Cities with the Most Immigrants from Spain in Virginia
RELATED REPORTS & OPTIONS
Spain
Virginia
Compare Cities
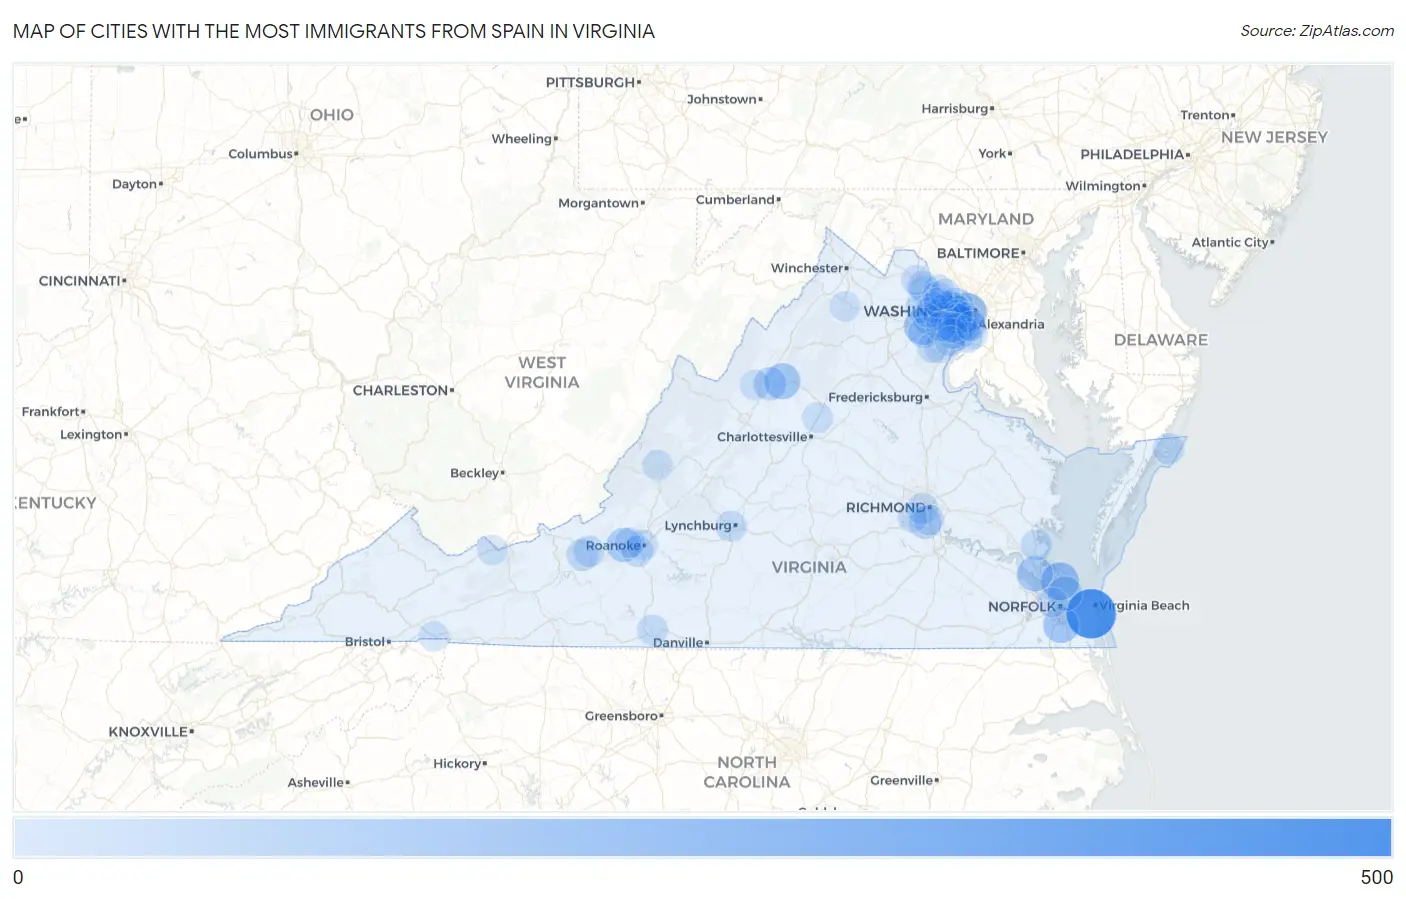
Map of Cities with the Most Immigrants from Spain in Virginia
0
500
Cities with the Most Immigrants from Spain in Virginia
| City | Spain | vs State | vs National | |
| 1. | Virginia Beach | 444 | 3,452(12.86%)#1 | 120,953(0.37%)#24 |
| 2. | Arlington | 190 | 3,452(5.50%)#2 | 120,953(0.16%)#78 |
| 3. | Hampton | 170 | 3,452(4.92%)#3 | 120,953(0.14%)#95 |
| 4. | Vienna | 160 | 3,452(4.63%)#4 | 120,953(0.13%)#106 |
| 5. | Sudley | 153 | 3,452(4.43%)#5 | 120,953(0.13%)#119 |
| 6. | Chesapeake | 132 | 3,452(3.82%)#6 | 120,953(0.11%)#145 |
| 7. | Massanutten | 132 | 3,452(3.82%)#7 | 120,953(0.11%)#147 |
| 8. | Newport News | 118 | 3,452(3.42%)#8 | 120,953(0.10%)#164 |
| 9. | Norfolk | 104 | 3,452(3.01%)#9 | 120,953(0.09%)#189 |
| 10. | Glenvar | 95 | 3,452(2.75%)#10 | 120,953(0.08%)#223 |
| 11. | Mclean | 84 | 3,452(2.43%)#11 | 120,953(0.07%)#253 |
| 12. | Massanetta Springs | 66 | 3,452(1.91%)#12 | 120,953(0.05%)#313 |
| 13. | Alexandria | 59 | 3,452(1.71%)#13 | 120,953(0.05%)#351 |
| 14. | Meadowbrook | 56 | 3,452(1.62%)#14 | 120,953(0.05%)#377 |
| 15. | Lincolnia | 56 | 3,452(1.62%)#15 | 120,953(0.05%)#378 |
| 16. | Idylwood | 51 | 3,452(1.48%)#16 | 120,953(0.04%)#412 |
| 17. | Centreville | 49 | 3,452(1.42%)#17 | 120,953(0.04%)#424 |
| 18. | Oakton | 48 | 3,452(1.39%)#18 | 120,953(0.04%)#433 |
| 19. | Difficult Run | 45 | 3,452(1.30%)#19 | 120,953(0.04%)#468 |
| 20. | South Riding | 36 | 3,452(1.04%)#20 | 120,953(0.03%)#567 |
| 21. | Prices Fork | 35 | 3,452(1.01%)#21 | 120,953(0.03%)#590 |
| 22. | Richmond | 31 | 3,452(0.90%)#22 | 120,953(0.03%)#638 |
| 23. | Chincoteague | 30 | 3,452(0.87%)#23 | 120,953(0.02%)#673 |
| 24. | Gloucester Point | 28 | 3,452(0.81%)#24 | 120,953(0.02%)#706 |
| 25. | Cave Spring | 27 | 3,452(0.78%)#25 | 120,953(0.02%)#725 |
| 26. | Blacksburg | 26 | 3,452(0.75%)#26 | 120,953(0.02%)#749 |
| 27. | Newington | 26 | 3,452(0.75%)#27 | 120,953(0.02%)#755 |
| 28. | Dale City | 23 | 3,452(0.67%)#28 | 120,953(0.02%)#816 |
| 29. | Lynchburg | 22 | 3,452(0.64%)#29 | 120,953(0.02%)#855 |
| 30. | Ashburn | 22 | 3,452(0.64%)#30 | 120,953(0.02%)#859 |
| 31. | Martinsville | 22 | 3,452(0.64%)#31 | 120,953(0.02%)#866 |
| 32. | Manassas | 21 | 3,452(0.61%)#32 | 120,953(0.02%)#899 |
| 33. | Fair Oaks | 19 | 3,452(0.55%)#33 | 120,953(0.02%)#964 |
| 34. | Leesylvania | 19 | 3,452(0.55%)#34 | 120,953(0.02%)#968 |
| 35. | Independent Hill | 17 | 3,452(0.49%)#35 | 120,953(0.01%)#1,041 |
| 36. | Belmont | 16 | 3,452(0.46%)#36 | 120,953(0.01%)#1,084 |
| 37. | Springfield | 15 | 3,452(0.43%)#37 | 120,953(0.01%)#1,107 |
| 38. | Fort Hunt | 15 | 3,452(0.43%)#38 | 120,953(0.01%)#1,117 |
| 39. | Bensley | 15 | 3,452(0.43%)#39 | 120,953(0.01%)#1,127 |
| 40. | Piney Mountain | 15 | 3,452(0.43%)#40 | 120,953(0.01%)#1,137 |
| 41. | Tysons | 14 | 3,452(0.41%)#41 | 120,953(0.01%)#1,160 |
| 42. | Bailey S Crossroads | 14 | 3,452(0.41%)#42 | 120,953(0.01%)#1,163 |
| 43. | Fairfax | 14 | 3,452(0.41%)#43 | 120,953(0.01%)#1,165 |
| 44. | Lowes Island | 14 | 3,452(0.41%)#44 | 120,953(0.01%)#1,176 |
| 45. | Roanoke | 13 | 3,452(0.38%)#45 | 120,953(0.01%)#1,197 |
| 46. | Bridgewater | 13 | 3,452(0.38%)#46 | 120,953(0.01%)#1,230 |
| 47. | Hayfield | 13 | 3,452(0.38%)#47 | 120,953(0.01%)#1,232 |
| 48. | Woodlawn Cdp Fairfax County | 12 | 3,452(0.35%)#48 | 120,953(0.01%)#1,267 |
| 49. | Rose Hill Cdp Fairfax County | 12 | 3,452(0.35%)#49 | 120,953(0.01%)#1,269 |
| 50. | Franklin Farm | 12 | 3,452(0.35%)#50 | 120,953(0.01%)#1,273 |
| 51. | Burke Centre | 12 | 3,452(0.35%)#51 | 120,953(0.01%)#1,274 |
| 52. | Annandale | 11 | 3,452(0.32%)#52 | 120,953(0.01%)#1,300 |
| 53. | Mount Vernon | 11 | 3,452(0.32%)#53 | 120,953(0.01%)#1,320 |
| 54. | Burke | 10 | 3,452(0.29%)#54 | 120,953(0.01%)#1,359 |
| 55. | Front Royal | 10 | 3,452(0.29%)#55 | 120,953(0.01%)#1,385 |
| 56. | Leesburg | 9 | 3,452(0.26%)#56 | 120,953(0.01%)#1,420 |
| 57. | West Falls Church | 9 | 3,452(0.26%)#57 | 120,953(0.01%)#1,434 |
| 58. | Salem | 9 | 3,452(0.26%)#58 | 120,953(0.01%)#1,437 |
| 59. | Chantilly | 9 | 3,452(0.26%)#59 | 120,953(0.01%)#1,440 |
| 60. | Dranesville | 9 | 3,452(0.26%)#60 | 120,953(0.01%)#1,454 |
| 61. | Clifton Forge | 9 | 3,452(0.26%)#61 | 120,953(0.01%)#1,466 |
| 62. | Reston | 8 | 3,452(0.23%)#62 | 120,953(0.01%)#1,482 |
| 63. | Great Falls | 8 | 3,452(0.23%)#63 | 120,953(0.01%)#1,512 |
| 64. | Newington Forest | 8 | 3,452(0.23%)#64 | 120,953(0.01%)#1,515 |
| 65. | Fairfax Station | 8 | 3,452(0.23%)#65 | 120,953(0.01%)#1,518 |
| 66. | West Springfield | 7 | 3,452(0.20%)#66 | 120,953(0.01%)#1,557 |
| 67. | Occoquan | 7 | 3,452(0.20%)#67 | 120,953(0.01%)#1,594 |
| 68. | Portsmouth | 5 | 3,452(0.14%)#68 | 120,953(0.00%)#1,655 |
| 69. | Huntington | 5 | 3,452(0.14%)#69 | 120,953(0.00%)#1,672 |
| 70. | Rockwood | 4 | 3,452(0.12%)#70 | 120,953(0.00%)#1,731 |
| 71. | Bluefield | 4 | 3,452(0.12%)#71 | 120,953(0.00%)#1,736 |
| 72. | Damascus | 4 | 3,452(0.12%)#72 | 120,953(0.00%)#1,763 |
Common Questions
What are the Top 10 Cities with the Most Immigrants from Spain in Virginia?
Top 10 Cities with the Most Immigrants from Spain in Virginia are:
#1
444
#2
190
#3
170
#4
160
#5
153
#6
132
#7
132
#8
118
#9
104
#10
95
What city has the Most Immigrants from Spain in Virginia?
Virginia Beach has the Most Immigrants from Spain in Virginia with 444.
What is the Total Immigrants from Spain in the State of Virginia?
Total Immigrants from Spain in Virginia is 3,452.
What is the Total Immigrants from Spain in the United States?
Total Immigrants from Spain in the United States is 120,953.