Cities with the Most Immigrants from Spain in Pennsylvania
RELATED REPORTS & OPTIONS
Spain
Pennsylvania
Compare Cities
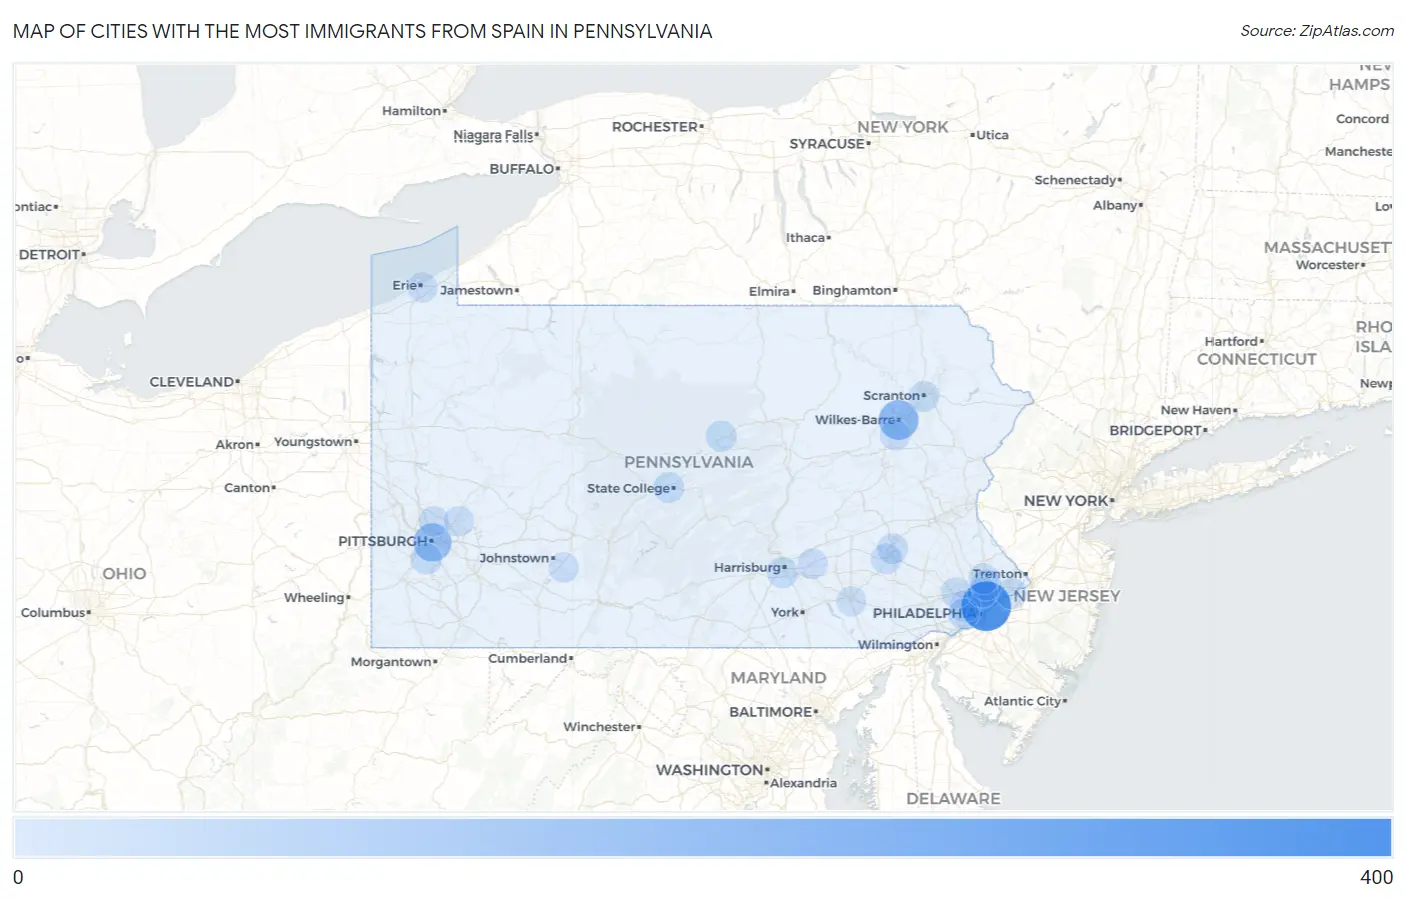
Map of Cities with the Most Immigrants from Spain in Pennsylvania
0
400
Cities with the Most Immigrants from Spain in Pennsylvania
| City | Spain | vs State | vs National | |
| 1. | Philadelphia | 375 | 2,635(14.23%)#1 | 120,953(0.31%)#27 |
| 2. | Wilkes Barre | 181 | 2,635(6.87%)#2 | 120,953(0.15%)#81 |
| 3. | Pittsburgh | 151 | 2,635(5.73%)#3 | 120,953(0.12%)#121 |
| 4. | Bridgeport Borough | 87 | 2,635(3.30%)#4 | 120,953(0.07%)#243 |
| 5. | Downingtown Borough | 60 | 2,635(2.28%)#5 | 120,953(0.05%)#348 |
| 6. | Lake City Borough | 55 | 2,635(2.09%)#6 | 120,953(0.05%)#386 |
| 7. | Wyomissing Borough | 46 | 2,635(1.75%)#7 | 120,953(0.04%)#454 |
| 8. | State College Borough | 39 | 2,635(1.48%)#8 | 120,953(0.03%)#521 |
| 9. | Lehighton Borough | 22 | 2,635(0.83%)#9 | 120,953(0.02%)#874 |
| 10. | Ardmore | 20 | 2,635(0.76%)#10 | 120,953(0.02%)#941 |
| 11. | Croydon | 20 | 2,635(0.76%)#11 | 120,953(0.02%)#944 |
| 12. | Lower Allen | 20 | 2,635(0.76%)#12 | 120,953(0.02%)#948 |
| 13. | Stroudsburg Borough | 20 | 2,635(0.76%)#13 | 120,953(0.02%)#951 |
| 14. | Bethel Park | 19 | 2,635(0.72%)#14 | 120,953(0.02%)#966 |
| 15. | Park Forest Village | 17 | 2,635(0.65%)#15 | 120,953(0.01%)#1,042 |
| 16. | Lock Haven | 17 | 2,635(0.65%)#16 | 120,953(0.01%)#1,045 |
| 17. | Narberth Borough | 17 | 2,635(0.65%)#17 | 120,953(0.01%)#1,051 |
| 18. | King Of Prussia | 15 | 2,635(0.57%)#18 | 120,953(0.01%)#1,112 |
| 19. | West Wyomissing | 15 | 2,635(0.57%)#19 | 120,953(0.01%)#1,134 |
| 20. | Lansdale Borough | 14 | 2,635(0.53%)#20 | 120,953(0.01%)#1,168 |
| 21. | Muhlenberg Park | 14 | 2,635(0.53%)#21 | 120,953(0.01%)#1,192 |
| 22. | Scranton | 13 | 2,635(0.49%)#22 | 120,953(0.01%)#1,200 |
| 23. | Drexel Hill | 13 | 2,635(0.49%)#23 | 120,953(0.01%)#1,213 |
| 24. | Willow Grove | 13 | 2,635(0.49%)#24 | 120,953(0.01%)#1,222 |
| 25. | West Mifflin Borough | 10 | 2,635(0.38%)#25 | 120,953(0.01%)#1,375 |
| 26. | Horsham | 10 | 2,635(0.38%)#26 | 120,953(0.01%)#1,384 |
| 27. | Aspinwall Borough | 10 | 2,635(0.38%)#27 | 120,953(0.01%)#1,404 |
| 28. | West Conshohocken Borough | 9 | 2,635(0.34%)#28 | 120,953(0.01%)#1,471 |
| 29. | Waymart Borough | 9 | 2,635(0.34%)#29 | 120,953(0.01%)#1,472 |
| 30. | West Chester Borough | 8 | 2,635(0.30%)#30 | 120,953(0.01%)#1,505 |
| 31. | Hershey | 8 | 2,635(0.30%)#31 | 120,953(0.01%)#1,513 |
| 32. | Mountain Top | 8 | 2,635(0.30%)#32 | 120,953(0.01%)#1,519 |
| 33. | Pleasant Hills Borough | 8 | 2,635(0.30%)#33 | 120,953(0.01%)#1,523 |
| 34. | Ambler Borough | 8 | 2,635(0.30%)#34 | 120,953(0.01%)#1,525 |
| 35. | Baldwin Borough | 7 | 2,635(0.27%)#35 | 120,953(0.01%)#1,562 |
| 36. | Avoca Borough | 7 | 2,635(0.27%)#36 | 120,953(0.01%)#1,590 |
| 37. | Allison Park | 5 | 2,635(0.19%)#37 | 120,953(0.00%)#1,667 |
| 38. | New Kensington | 5 | 2,635(0.19%)#38 | 120,953(0.00%)#1,673 |
| 39. | Gettysburg Borough | 5 | 2,635(0.19%)#39 | 120,953(0.00%)#1,680 |
| 40. | Merion Station | 5 | 2,635(0.19%)#40 | 120,953(0.00%)#1,684 |
| 41. | Valley View Cdp York County | 5 | 2,635(0.19%)#41 | 120,953(0.00%)#1,691 |
| 42. | Erie | 4 | 2,635(0.15%)#42 | 120,953(0.00%)#1,711 |
| 43. | Elizabethtown Borough | 4 | 2,635(0.15%)#43 | 120,953(0.00%)#1,726 |
| 44. | Kennett Square Borough | 4 | 2,635(0.15%)#44 | 120,953(0.00%)#1,735 |
| 45. | University Of Pittsburgh Johnstown | 4 | 2,635(0.15%)#45 | 120,953(0.00%)#1,753 |
| 46. | Loretto Borough | 3 | 2,635(0.11%)#46 | 120,953(0.00%)#1,801 |
| 47. | Lancaster | 2 | 2,635(0.08%)#47 | 120,953(0.00%)#1,822 |
| 48. | Smethport Borough | 2 | 2,635(0.08%)#48 | 120,953(0.00%)#1,849 |
| 49. | Bernville Borough | 2 | 2,635(0.08%)#49 | 120,953(0.00%)#1,859 |
| 50. | Yeadon Borough | 1 | 2,635(0.04%)#50 | 120,953(0.00%)#1,898 |
| 51. | Wyncote | 1 | 2,635(0.04%)#51 | 120,953(0.00%)#1,911 |
| 52. | Knox Borough | 1 | 2,635(0.04%)#52 | 120,953(0.00%)#1,914 |
Common Questions
What are the Top 10 Cities with the Most Immigrants from Spain in Pennsylvania?
Top 10 Cities with the Most Immigrants from Spain in Pennsylvania are:
#1
375
#2
181
#3
151
#4
20
#5
20
#6
20
#7
19
#8
17
#9
17
#10
15
What city has the Most Immigrants from Spain in Pennsylvania?
Philadelphia has the Most Immigrants from Spain in Pennsylvania with 375.
What is the Total Immigrants from Spain in the State of Pennsylvania?
Total Immigrants from Spain in Pennsylvania is 2,635.
What is the Total Immigrants from Spain in the United States?
Total Immigrants from Spain in the United States is 120,953.