Cities with the Most Immigrants from Serbia in New York
RELATED REPORTS & OPTIONS
Serbia
New York
Compare Cities
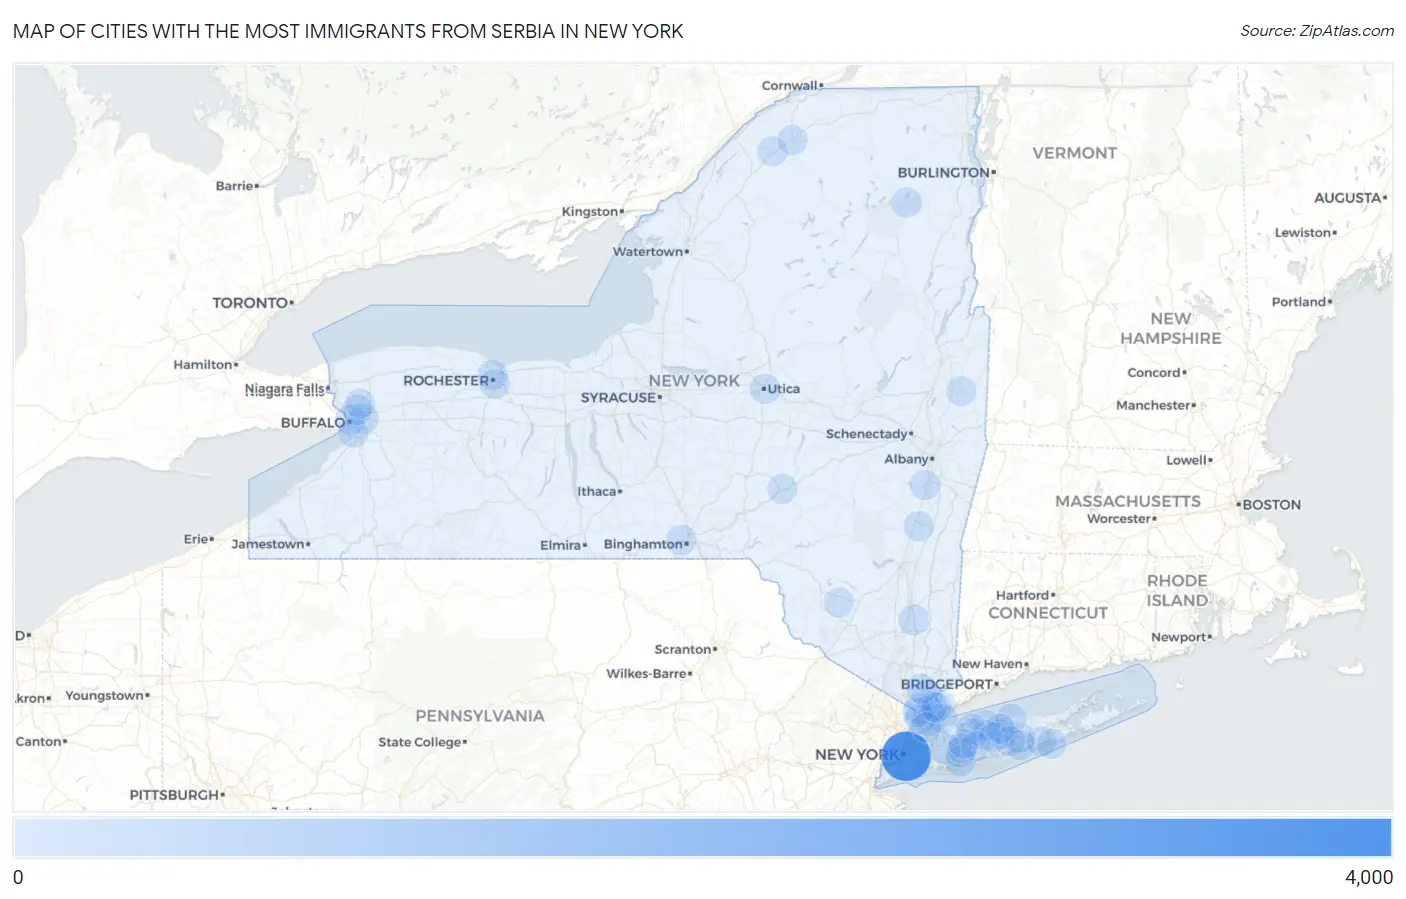
Map of Cities with the Most Immigrants from Serbia in New York
0
4,000
Cities with the Most Immigrants from Serbia in New York
| City | Serbia | vs State | vs National | |
| 1. | New York | 3,381 | 5,010(67.49%)#1 | 42,332(7.99%)#1 |
| 2. | Mineola | 204 | 5,010(4.07%)#2 | 42,332(0.48%)#24 |
| 3. | Dobbs Ferry | 79 | 5,010(1.58%)#3 | 42,332(0.19%)#91 |
| 4. | Wantagh | 76 | 5,010(1.52%)#4 | 42,332(0.18%)#97 |
| 5. | Wappingers Falls | 75 | 5,010(1.50%)#5 | 42,332(0.18%)#99 |
| 6. | Johnson City | 74 | 5,010(1.48%)#6 | 42,332(0.17%)#100 |
| 7. | Yonkers | 58 | 5,010(1.16%)#7 | 42,332(0.14%)#137 |
| 8. | Nesconset | 48 | 5,010(0.96%)#8 | 42,332(0.11%)#176 |
| 9. | Medford | 43 | 5,010(0.86%)#9 | 42,332(0.10%)#201 |
| 10. | Port Jefferson | 42 | 5,010(0.84%)#10 | 42,332(0.10%)#207 |
| 11. | Lake Placid | 42 | 5,010(0.84%)#11 | 42,332(0.10%)#209 |
| 12. | Cheektowaga | 37 | 5,010(0.74%)#12 | 42,332(0.09%)#226 |
| 13. | Utica | 36 | 5,010(0.72%)#13 | 42,332(0.09%)#233 |
| 14. | Ravena | 35 | 5,010(0.70%)#14 | 42,332(0.08%)#247 |
| 15. | Rochester | 33 | 5,010(0.66%)#15 | 42,332(0.08%)#258 |
| 16. | Rye Brook | 28 | 5,010(0.56%)#16 | 42,332(0.07%)#297 |
| 17. | Fort Salonga | 26 | 5,010(0.52%)#17 | 42,332(0.06%)#318 |
| 18. | New Rochelle | 25 | 5,010(0.50%)#18 | 42,332(0.06%)#320 |
| 19. | Brighton | 25 | 5,010(0.50%)#19 | 42,332(0.06%)#325 |
| 20. | Huntington Station | 23 | 5,010(0.46%)#20 | 42,332(0.05%)#344 |
| 21. | Levittown | 20 | 5,010(0.40%)#21 | 42,332(0.05%)#385 |
| 22. | Hawthorne | 20 | 5,010(0.40%)#22 | 42,332(0.05%)#387 |
| 23. | Woodridge | 19 | 5,010(0.38%)#23 | 42,332(0.04%)#412 |
| 24. | Buffalo | 18 | 5,010(0.36%)#24 | 42,332(0.04%)#413 |
| 25. | Rye | 18 | 5,010(0.36%)#25 | 42,332(0.04%)#423 |
| 26. | White Plains | 16 | 5,010(0.32%)#26 | 42,332(0.04%)#451 |
| 27. | Lackawanna | 16 | 5,010(0.32%)#27 | 42,332(0.04%)#459 |
| 28. | Oneonta | 16 | 5,010(0.32%)#28 | 42,332(0.04%)#460 |
| 29. | Eggertsville | 13 | 5,010(0.26%)#29 | 42,332(0.03%)#516 |
| 30. | Catskill | 13 | 5,010(0.26%)#30 | 42,332(0.03%)#523 |
| 31. | Commack | 11 | 5,010(0.22%)#31 | 42,332(0.03%)#546 |
| 32. | Huntington | 11 | 5,010(0.22%)#32 | 42,332(0.03%)#552 |
| 33. | Bethpage | 11 | 5,010(0.22%)#33 | 42,332(0.03%)#553 |
| 34. | Holbrook | 10 | 5,010(0.20%)#34 | 42,332(0.02%)#579 |
| 35. | East Patchogue | 10 | 5,010(0.20%)#35 | 42,332(0.02%)#582 |
| 36. | Hastings On Hudson | 10 | 5,010(0.20%)#36 | 42,332(0.02%)#589 |
| 37. | Pelham Manor | 10 | 5,010(0.20%)#37 | 42,332(0.02%)#595 |
| 38. | Center Moriches | 9 | 5,010(0.18%)#38 | 42,332(0.02%)#626 |
| 39. | Hauppauge | 8 | 5,010(0.16%)#39 | 42,332(0.02%)#644 |
| 40. | St James | 8 | 5,010(0.16%)#40 | 42,332(0.02%)#647 |
| 41. | Briarcliff Manor | 8 | 5,010(0.16%)#41 | 42,332(0.02%)#651 |
| 42. | Canton | 8 | 5,010(0.16%)#42 | 42,332(0.02%)#652 |
| 43. | Wheatley Heights | 7 | 5,010(0.14%)#43 | 42,332(0.02%)#678 |
| 44. | Greenwich | 6 | 5,010(0.12%)#44 | 42,332(0.01%)#702 |
| 45. | Niagara University | 6 | 5,010(0.12%)#45 | 42,332(0.01%)#703 |
| 46. | Harrison | 5 | 5,010(0.10%)#46 | 42,332(0.01%)#712 |
| 47. | East Setauket | 4 | 5,010(0.08%)#47 | 42,332(0.01%)#739 |
| 48. | University At Buffalo | 4 | 5,010(0.08%)#48 | 42,332(0.01%)#743 |
| 49. | Plainview | 3 | 5,010(0.06%)#49 | 42,332(0.01%)#753 |
| 50. | Potsdam | 2 | 5,010(0.04%)#50 | 42,332(0.00%)#765 |
| 51. | West Hampton Dunes | 1 | 5,010(0.02%)#51 | 42,332(0.00%)#775 |
Common Questions
What are the Top 10 Cities with the Most Immigrants from Serbia in New York?
Top 10 Cities with the Most Immigrants from Serbia in New York are:
#1
3,381
#2
204
#3
79
#4
76
#5
75
#6
74
#7
58
#8
48
#9
43
#10
42
What city has the Most Immigrants from Serbia in New York?
New York has the Most Immigrants from Serbia in New York with 3,381.
What is the Total Immigrants from Serbia in the State of New York?
Total Immigrants from Serbia in New York is 5,010.
What is the Total Immigrants from Serbia in the United States?
Total Immigrants from Serbia in the United States is 42,332.