Cities with the Most Immigrants from Belarus in New York
RELATED REPORTS & OPTIONS
Belarus
New York
Compare Cities
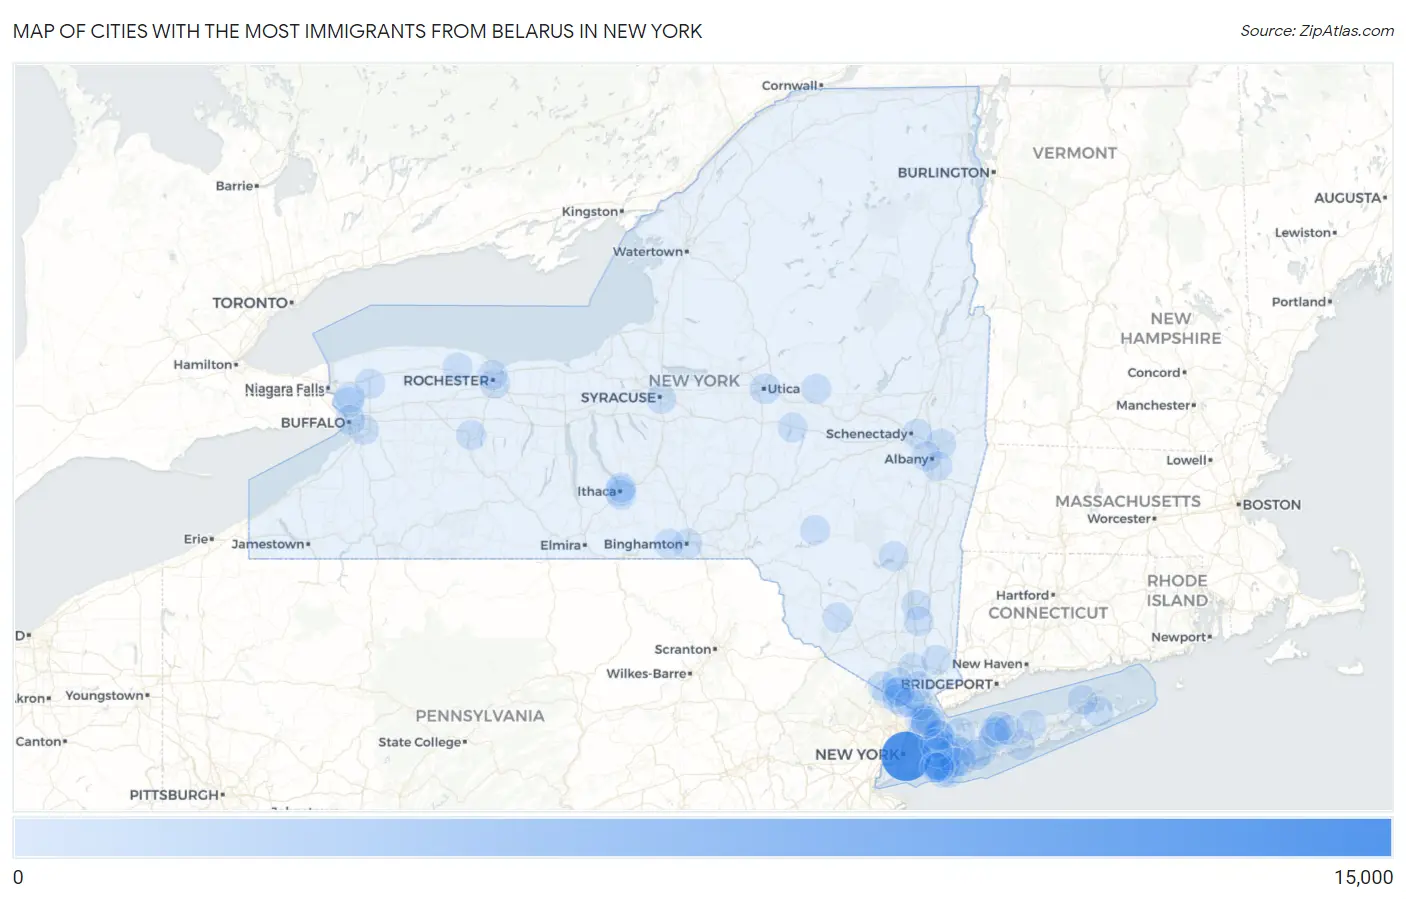
Map of Cities with the Most Immigrants from Belarus in New York
0
15,000
Cities with the Most Immigrants from Belarus in New York
| City | Belarus | vs State | vs National | |
| 1. | New York | 14,304 | 17,813(80.30%)#1 | 71,687(19.95%)#1 |
| 2. | Utica | 373 | 17,813(2.09%)#2 | 71,687(0.52%)#16 |
| 3. | Salisbury | 140 | 17,813(0.79%)#3 | 71,687(0.20%)#64 |
| 4. | Mineola | 118 | 17,813(0.66%)#4 | 71,687(0.16%)#76 |
| 5. | Brighton | 98 | 17,813(0.55%)#5 | 71,687(0.14%)#107 |
| 6. | Geneseo | 76 | 17,813(0.43%)#6 | 71,687(0.11%)#145 |
| 7. | Rochester | 70 | 17,813(0.39%)#7 | 71,687(0.10%)#159 |
| 8. | Yonkers | 68 | 17,813(0.38%)#8 | 71,687(0.09%)#168 |
| 9. | Levittown | 68 | 17,813(0.38%)#9 | 71,687(0.09%)#169 |
| 10. | Syracuse | 57 | 17,813(0.32%)#10 | 71,687(0.08%)#203 |
| 11. | Ithaca | 54 | 17,813(0.30%)#11 | 71,687(0.08%)#222 |
| 12. | Tonawanda | 49 | 17,813(0.28%)#12 | 71,687(0.07%)#239 |
| 13. | South Hill | 49 | 17,813(0.28%)#13 | 71,687(0.07%)#243 |
| 14. | Smithtown | 48 | 17,813(0.27%)#14 | 71,687(0.07%)#246 |
| 15. | Niskayuna | 46 | 17,813(0.26%)#15 | 71,687(0.06%)#258 |
| 16. | Southold | 43 | 17,813(0.24%)#16 | 71,687(0.06%)#279 |
| 17. | Troy | 39 | 17,813(0.22%)#17 | 71,687(0.05%)#308 |
| 18. | Peekskill | 38 | 17,813(0.21%)#18 | 71,687(0.05%)#317 |
| 19. | North Babylon | 34 | 17,813(0.19%)#19 | 71,687(0.05%)#343 |
| 20. | Pearl River | 33 | 17,813(0.19%)#20 | 71,687(0.05%)#356 |
| 21. | Arlington | 31 | 17,813(0.17%)#21 | 71,687(0.04%)#379 |
| 22. | Long Beach | 29 | 17,813(0.16%)#22 | 71,687(0.04%)#397 |
| 23. | Ossining | 28 | 17,813(0.16%)#23 | 71,687(0.04%)#415 |
| 24. | Port Washington | 28 | 17,813(0.16%)#24 | 71,687(0.04%)#417 |
| 25. | South Lockport | 28 | 17,813(0.16%)#25 | 71,687(0.04%)#419 |
| 26. | Zena | 27 | 17,813(0.15%)#26 | 71,687(0.04%)#433 |
| 27. | North Tonawanda | 26 | 17,813(0.15%)#27 | 71,687(0.04%)#437 |
| 28. | Lido Beach | 25 | 17,813(0.14%)#28 | 71,687(0.03%)#456 |
| 29. | Albany | 24 | 17,813(0.13%)#29 | 71,687(0.03%)#461 |
| 30. | Binghamton | 24 | 17,813(0.13%)#30 | 71,687(0.03%)#464 |
| 31. | Oceanside | 23 | 17,813(0.13%)#31 | 71,687(0.03%)#479 |
| 32. | East Patchogue | 23 | 17,813(0.13%)#32 | 71,687(0.03%)#482 |
| 33. | Woodmere | 23 | 17,813(0.13%)#33 | 71,687(0.03%)#483 |
| 34. | De Witt | 23 | 17,813(0.13%)#34 | 71,687(0.03%)#489 |
| 35. | Rock Hill | 22 | 17,813(0.12%)#35 | 71,687(0.03%)#506 |
| 36. | Lincolndale | 22 | 17,813(0.12%)#36 | 71,687(0.03%)#507 |
| 37. | Eastchester | 20 | 17,813(0.11%)#37 | 71,687(0.03%)#539 |
| 38. | Manorhaven | 19 | 17,813(0.11%)#38 | 71,687(0.03%)#560 |
| 39. | Hewlett | 18 | 17,813(0.10%)#39 | 71,687(0.03%)#576 |
| 40. | Hauppauge | 17 | 17,813(0.10%)#40 | 71,687(0.02%)#593 |
| 41. | Seaford | 17 | 17,813(0.10%)#41 | 71,687(0.02%)#594 |
| 42. | Port Washington North | 17 | 17,813(0.10%)#42 | 71,687(0.02%)#599 |
| 43. | Hempstead | 16 | 17,813(0.09%)#43 | 71,687(0.02%)#604 |
| 44. | West Babylon | 16 | 17,813(0.09%)#44 | 71,687(0.02%)#608 |
| 45. | Clarkson | 16 | 17,813(0.09%)#45 | 71,687(0.02%)#620 |
| 46. | West Seneca | 15 | 17,813(0.08%)#46 | 71,687(0.02%)#631 |
| 47. | Village Of The Branch | 14 | 17,813(0.08%)#47 | 71,687(0.02%)#666 |
| 48. | Manhasset | 13 | 17,813(0.07%)#48 | 71,687(0.02%)#696 |
| 49. | Cayuga Heights | 13 | 17,813(0.07%)#49 | 71,687(0.02%)#697 |
| 50. | East Greenbush | 12 | 17,813(0.07%)#50 | 71,687(0.02%)#723 |
| 51. | Dolgeville | 10 | 17,813(0.06%)#51 | 71,687(0.01%)#771 |
| 52. | Oyster Bay Cove | 10 | 17,813(0.06%)#52 | 71,687(0.01%)#773 |
| 53. | New Rochelle | 9 | 17,813(0.05%)#53 | 71,687(0.01%)#779 |
| 54. | Merrick | 9 | 17,813(0.05%)#54 | 71,687(0.01%)#794 |
| 55. | Ridge | 9 | 17,813(0.05%)#55 | 71,687(0.01%)#799 |
| 56. | Suffern | 9 | 17,813(0.05%)#56 | 71,687(0.01%)#800 |
| 57. | Myers Corner | 8 | 17,813(0.04%)#57 | 71,687(0.01%)#824 |
| 58. | Bronxville | 8 | 17,813(0.04%)#58 | 71,687(0.01%)#827 |
| 59. | Sloatsburg | 8 | 17,813(0.04%)#59 | 71,687(0.01%)#830 |
| 60. | Sag Harbor | 8 | 17,813(0.04%)#60 | 71,687(0.01%)#831 |
| 61. | Centereach | 7 | 17,813(0.04%)#61 | 71,687(0.01%)#845 |
| 62. | Russell Gardens | 7 | 17,813(0.04%)#62 | 71,687(0.01%)#869 |
| 63. | Hewlett Harbor | 7 | 17,813(0.04%)#63 | 71,687(0.01%)#870 |
| 64. | Andes | 7 | 17,813(0.04%)#64 | 71,687(0.01%)#871 |
| 65. | Irvington | 6 | 17,813(0.03%)#65 | 71,687(0.01%)#888 |
| 66. | Richfield Springs | 6 | 17,813(0.03%)#66 | 71,687(0.01%)#896 |
| 67. | Floral Park | 5 | 17,813(0.03%)#67 | 71,687(0.01%)#906 |
| 68. | Endicott | 5 | 17,813(0.03%)#68 | 71,687(0.01%)#908 |
| 69. | Pelham | 5 | 17,813(0.03%)#69 | 71,687(0.01%)#911 |
| 70. | Pomona | 5 | 17,813(0.03%)#70 | 71,687(0.01%)#912 |
| 71. | Monsey | 4 | 17,813(0.02%)#71 | 71,687(0.01%)#924 |
| 72. | Chestnut Ridge | 4 | 17,813(0.02%)#72 | 71,687(0.01%)#927 |
| 73. | Hillcrest | 4 | 17,813(0.02%)#73 | 71,687(0.01%)#928 |
| 74. | Hewlett Neck | 4 | 17,813(0.02%)#74 | 71,687(0.01%)#935 |
| 75. | Orangeburg | 3 | 17,813(0.02%)#75 | 71,687(0.00%)#941 |
| 76. | Buffalo | 2 | 17,813(0.01%)#76 | 71,687(0.00%)#951 |
| 77. | Cedarhurst | 1 | 17,813(0.01%)#77 | 71,687(0.00%)#962 |
| 78. | Gananda | 1 | 17,813(0.01%)#78 | 71,687(0.00%)#963 |
| 79. | Head Of The Harbor | 1 | 17,813(0.01%)#79 | 71,687(0.00%)#966 |
Common Questions
What are the Top 10 Cities with the Most Immigrants from Belarus in New York?
Top 10 Cities with the Most Immigrants from Belarus in New York are:
What city has the Most Immigrants from Belarus in New York?
New York has the Most Immigrants from Belarus in New York with 14,304.
What is the Total Immigrants from Belarus in the State of New York?
Total Immigrants from Belarus in New York is 17,813.
What is the Total Immigrants from Belarus in the United States?
Total Immigrants from Belarus in the United States is 71,687.