Area Code 331
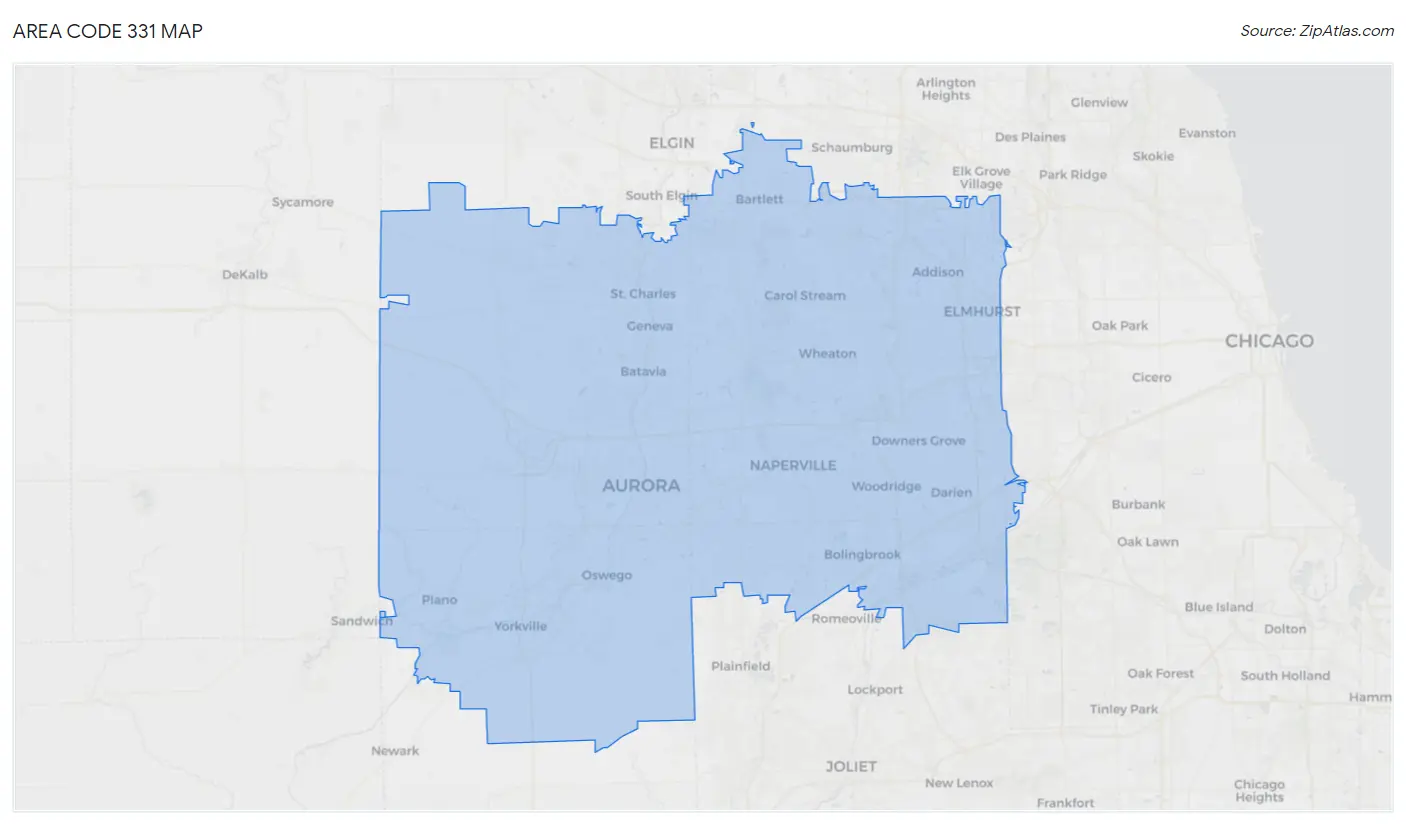
Area Code 331 Map
Area Code 331 Overview
941,954
TOTAL POPULATION
468,851
MALE POPULATION
473,103
FEMALE POPULATION
99.10
MALES / 100 FEMALES
100.91
FEMALES / 100 MALES
39.8
MEDIAN AGE
3.3
AVG FAMILY SIZE
2.8
AVG HOUSEHOLD SIZE
$51,795
PER CAPITA INCOME
$132,127
AVG FAMILY INCOME
$112,049
AVG HOUSEHOLD INCOME
35.5%
WAGE / INCOME GAP [ % ]
64.5¢/ $1
WAGE / INCOME GAP [ $ ]
$11,427
FAMILY INCOME DEFICIT
11.92
INEQUALITY / GINI INDEX
517,244
LABOR FORCE [ PEOPLE ]
69.4%
PERCENT IN LABOR FORCE
4.8%
UNEMPLOYMENT RATE
Race in Area Code 331
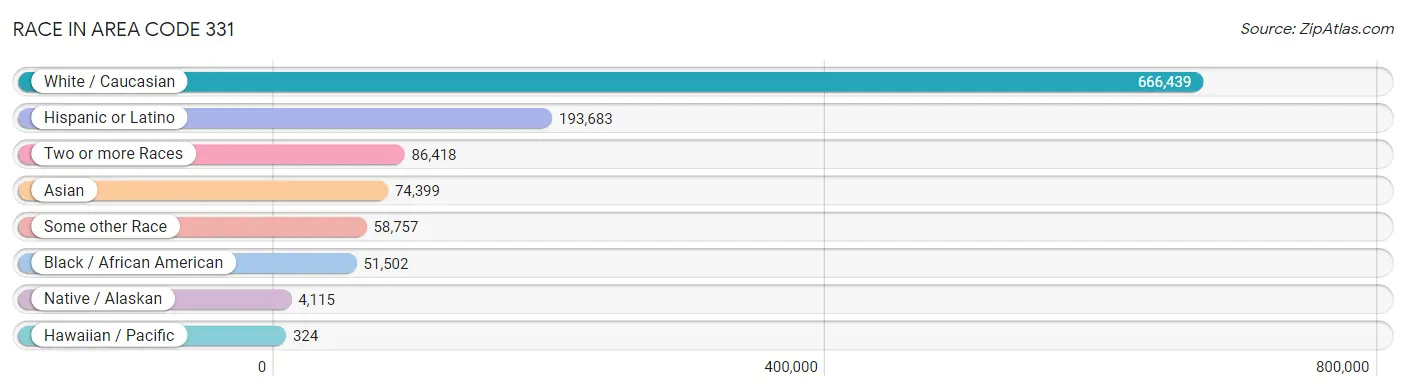
The most populous races in Area Code 331 are White / Caucasian (666,439 | 70.8%), Hispanic or Latino (193,683 | 20.6%), and Two or more Races (86,418 | 9.2%).
| Race | # Population | % Population |
| Asian | 74,399 | 7.9% |
| Black / African American | 51,502 | 5.5% |
| Hawaiian / Pacific | 324 | 0.0% |
| Hispanic or Latino | 193,683 | 20.6% |
| Native / Alaskan | 4,115 | 0.4% |
| White / Caucasian | 666,439 | 70.8% |
| Two or more Races | 86,418 | 9.2% |
| Some other Race | 58,757 | 6.2% |
| Total | 941,954 | 100.0% |
Ancestry in Area Code 331
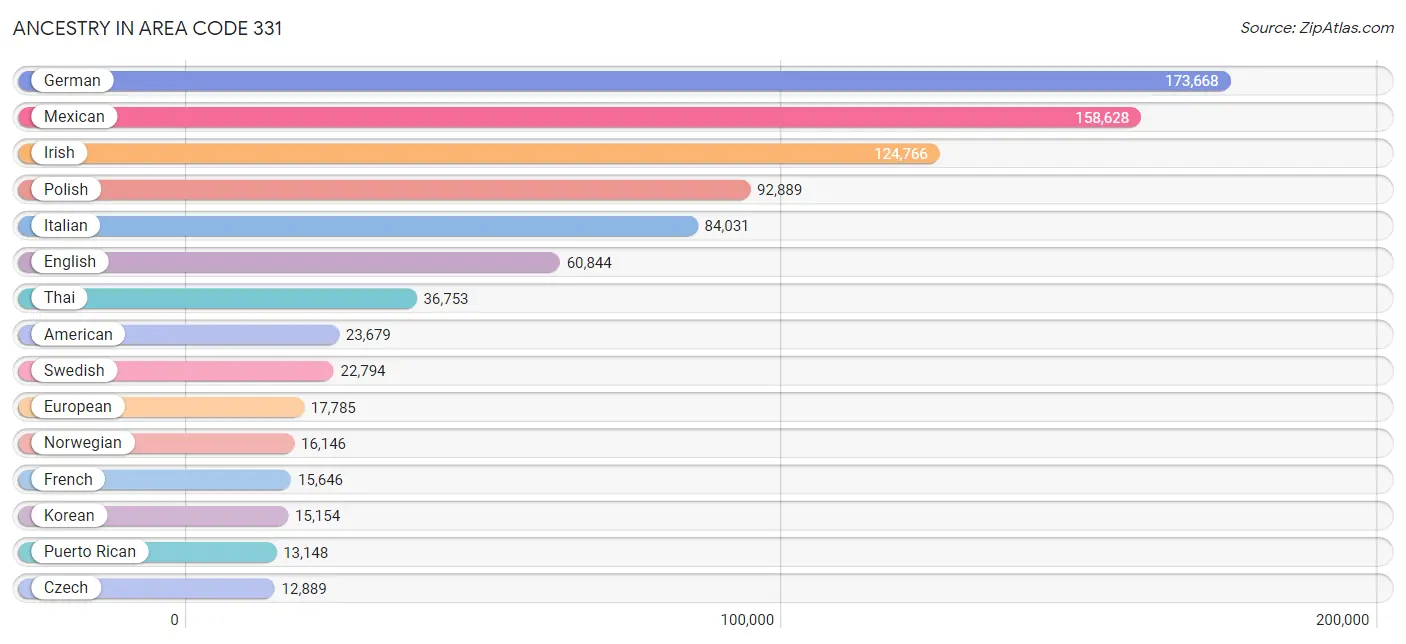
The most populous ancestries reported in Area Code 331 are German (173,668 | 18.4%), Mexican (158,628 | 16.8%), Irish (124,766 | 13.3%), Polish (92,889 | 9.9%), and Italian (84,031 | 8.9%), together accounting for 67.3% of all Area Code 331 residents.
| Ancestry | # Population | % Population |
| Afghan | 348 | 0.0% |
| African | 2,142 | 0.2% |
| Alaska Native | 52 | 0.0% |
| Alaskan Athabascan | 55 | 0.0% |
| Albanian | 2,426 | 0.3% |
| Alsatian | 12 | 0.0% |
| American | 23,679 | 2.5% |
| Apache | 176 | 0.0% |
| Arab | 6,723 | 0.7% |
| Argentinean | 597 | 0.1% |
| Armenian | 1,097 | 0.1% |
| Assyrian / Chaldean / Syriac | 631 | 0.1% |
| Australian | 204 | 0.0% |
| Austrian | 3,535 | 0.4% |
| Bahamian | 10 | 0.0% |
| Bangladeshi | 37 | 0.0% |
| Barbadian | 46 | 0.0% |
| Basque | 46 | 0.0% |
| Belgian | 1,504 | 0.2% |
| Belizean | 72 | 0.0% |
| Bhutanese | 2,368 | 0.3% |
| Blackfeet | 131 | 0.0% |
| Bolivian | 183 | 0.0% |
| Brazilian | 253 | 0.0% |
| British | 3,196 | 0.3% |
| British West Indian | 18 | 0.0% |
| Bulgarian | 1,525 | 0.2% |
| Burmese | 4,919 | 0.5% |
| Cajun | 53 | 0.0% |
| Cambodian | 249 | 0.0% |
| Canadian | 1,351 | 0.1% |
| Cape Verdean | 45 | 0.0% |
| Carpatho Rusyn | 44 | 0.0% |
| Celtic | 189 | 0.0% |
| Central American | 5,768 | 0.6% |
| Central American Indian | 763 | 0.1% |
| Cherokee | 1,301 | 0.1% |
| Chickasaw | 21 | 0.0% |
| Chilean | 374 | 0.0% |
| Chippewa | 96 | 0.0% |
| Choctaw | 52 | 0.0% |
| Colombian | 1,869 | 0.2% |
| Comanche | 35 | 0.0% |
| Costa Rican | 252 | 0.0% |
| Creek | 3 | 0.0% |
| Croatian | 3,927 | 0.4% |
| Cuban | 2,746 | 0.3% |
| Cypriot | 19 | 0.0% |
| Czech | 12,889 | 1.4% |
| Czechoslovakian | 1,346 | 0.1% |
| Danish | 4,340 | 0.5% |
| Delaware | 38 | 0.0% |
| Dominican | 674 | 0.1% |
| Dutch | 12,860 | 1.4% |
| Dutch West Indian | 7 | 0.0% |
| Eastern European | 2,949 | 0.3% |
| Ecuadorian | 1,305 | 0.1% |
| Egyptian | 1,528 | 0.2% |
| English | 60,844 | 6.5% |
| Estonian | 128 | 0.0% |
| Ethiopian | 462 | 0.1% |
| European | 17,785 | 1.9% |
| Fijian | 3 | 0.0% |
| Filipino | 869 | 0.1% |
| Finnish | 1,277 | 0.1% |
| French | 15,646 | 1.7% |
| French Canadian | 3,122 | 0.3% |
| German | 173,668 | 18.4% |
| Ghanaian | 1,039 | 0.1% |
| Greek | 9,687 | 1.0% |
| Guamanian / Chamorro | 130 | 0.0% |
| Guatemalan | 2,024 | 0.2% |
| Guyanese | 14 | 0.0% |
| Haitian | 517 | 0.1% |
| Honduran | 1,159 | 0.1% |
| Hopi | 7 | 0.0% |
| Hungarian | 3,924 | 0.4% |
| Icelander | 70 | 0.0% |
| Indian (Asian) | 11,563 | 1.2% |
| Indonesian | 1,024 | 0.1% |
| Inupiat | 30 | 0.0% |
| Iranian | 947 | 0.1% |
| Iraqi | 321 | 0.0% |
| Irish | 124,766 | 13.3% |
| Iroquois | 107 | 0.0% |
| Israeli | 179 | 0.0% |
| Italian | 84,031 | 8.9% |
| Jamaican | 884 | 0.1% |
| Japanese | 501 | 0.1% |
| Jordanian | 387 | 0.0% |
| Kenyan | 72 | 0.0% |
| Korean | 15,154 | 1.6% |
| Laotian | 147 | 0.0% |
| Latvian | 353 | 0.0% |
| Lebanese | 1,477 | 0.2% |
| Lithuanian | 11,124 | 1.2% |
| Luxembourger | 1,272 | 0.1% |
| Macedonian | 533 | 0.1% |
| Malaysian | 583 | 0.1% |
| Maltese | 28 | 0.0% |
| Mexican | 158,628 | 16.8% |
| Mexican American Indian | 2,553 | 0.3% |
| Mongolian | 45 | 0.0% |
| Moroccan | 216 | 0.0% |
| Native Hawaiian | 465 | 0.1% |
| Navajo | 61 | 0.0% |
| New Zealander | 17 | 0.0% |
| Nicaraguan | 460 | 0.1% |
| Nigerian | 1,068 | 0.1% |
| Northern European | 1,869 | 0.2% |
| Norwegian | 16,146 | 1.7% |
| Okinawan | 19 | 0.0% |
| Osage | 3 | 0.0% |
| Ottawa | 17 | 0.0% |
| Pakistani | 912 | 0.1% |
| Palestinian | 868 | 0.1% |
| Panamanian | 318 | 0.0% |
| Pennsylvania German | 144 | 0.0% |
| Peruvian | 998 | 0.1% |
| Pima | 28 | 0.0% |
| Polish | 92,889 | 9.9% |
| Portuguese | 1,051 | 0.1% |
| Potawatomi | 19 | 0.0% |
| Pueblo | 25 | 0.0% |
| Puerto Rican | 13,148 | 1.4% |
| Romanian | 4,360 | 0.5% |
| Russian | 6,577 | 0.7% |
| Salvadoran | 1,505 | 0.2% |
| Samoan | 32 | 0.0% |
| Scandinavian | 2,307 | 0.2% |
| Scotch-Irish | 5,116 | 0.5% |
| Scottish | 10,822 | 1.1% |
| Serbian | 2,080 | 0.2% |
| Sioux | 94 | 0.0% |
| Slavic | 416 | 0.0% |
| Slovak | 3,337 | 0.4% |
| Slovene | 1,562 | 0.2% |
| Somali | 315 | 0.0% |
| South African | 208 | 0.0% |
| South American | 6,667 | 0.7% |
| South American Indian | 105 | 0.0% |
| Soviet Union | 14 | 0.0% |
| Spaniard | 1,931 | 0.2% |
| Spanish | 1,350 | 0.1% |
| Spanish American | 19 | 0.0% |
| Spanish American Indian | 10 | 0.0% |
| Sri Lankan | 1,982 | 0.2% |
| Subsaharan African | 5,684 | 0.6% |
| Swedish | 22,794 | 2.4% |
| Swiss | 2,617 | 0.3% |
| Syrian | 242 | 0.0% |
| Taiwanese | 6 | 0.0% |
| Thai | 36,753 | 3.9% |
| Tohono O'Odham | 29 | 0.0% |
| Trinidadian and Tobagonian | 101 | 0.0% |
| Tsimshian | 8 | 0.0% |
| Turkish | 392 | 0.0% |
| Ugandan | 12 | 0.0% |
| Ukrainian | 4,429 | 0.5% |
| Uruguayan | 245 | 0.0% |
| Venezuelan | 1,055 | 0.1% |
| Vietnamese | 317 | 0.0% |
| Welsh | 3,597 | 0.4% |
| West Indian | 188 | 0.0% |
| Yaqui | 4 | 0.0% |
| Yugoslavian | 920 | 0.1% |
| Zimbabwean | 88 | 0.0% | View All 167 Rows |
Immigrants in Area Code 331
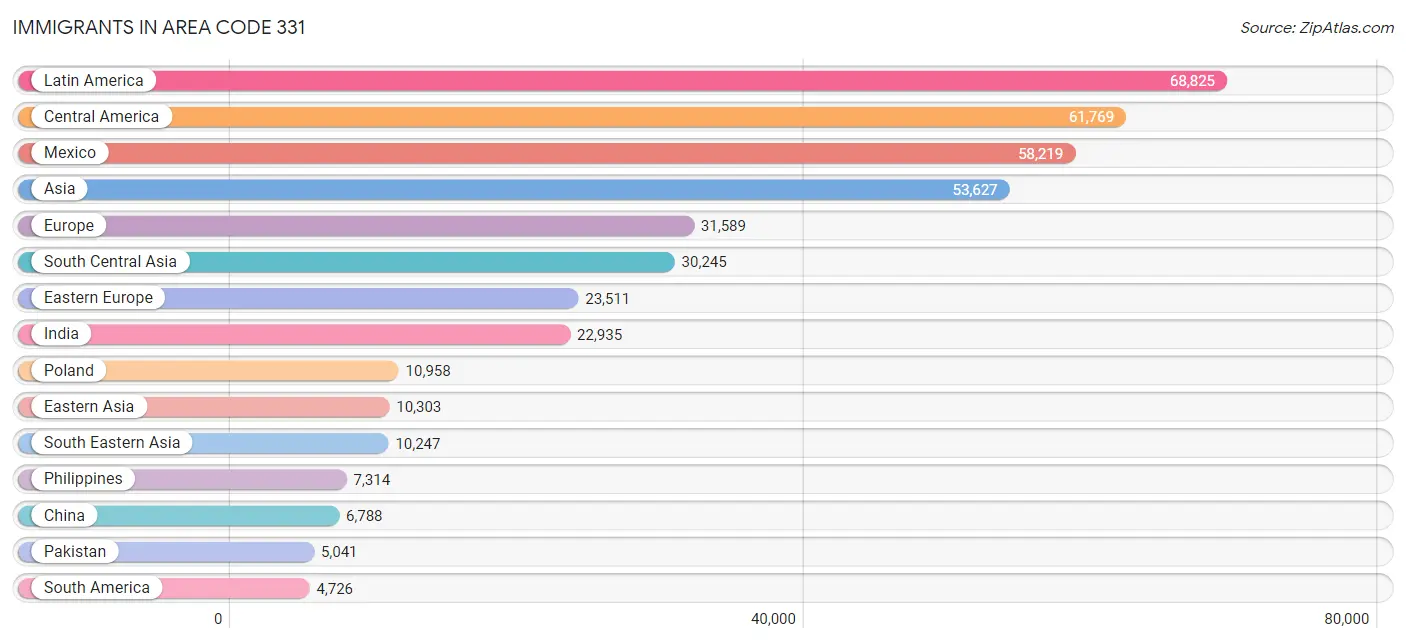
The most numerous immigrant groups reported in Area Code 331 came from Latin America (68,825 | 7.3%), Central America (61,769 | 6.6%), Mexico (58,219 | 6.2%), Asia (53,627 | 5.7%), and Europe (31,589 | 3.4%), together accounting for 29.1% of all Area Code 331 residents.
| Immigration Origin | # Population | % Population |
| Afghanistan | 228 | 0.0% |
| Africa | 4,516 | 0.5% |
| Albania | 1,732 | 0.2% |
| Argentina | 373 | 0.0% |
| Asia | 53,627 | 5.7% |
| Australia | 126 | 0.0% |
| Austria | 201 | 0.0% |
| Bangladesh | 229 | 0.0% |
| Barbados | 39 | 0.0% |
| Belarus | 156 | 0.0% |
| Belgium | 7 | 0.0% |
| Belize | 22 | 0.0% |
| Bolivia | 186 | 0.0% |
| Bosnia and Herzegovina | 423 | 0.0% |
| Brazil | 542 | 0.1% |
| Bulgaria | 916 | 0.1% |
| Cambodia | 235 | 0.0% |
| Cameroon | 57 | 0.0% |
| Canada | 1,274 | 0.1% |
| Caribbean | 2,330 | 0.3% |
| Central America | 61,769 | 6.6% |
| Chile | 171 | 0.0% |
| China | 6,788 | 0.7% |
| Colombia | 1,081 | 0.1% |
| Congo | 10 | 0.0% |
| Costa Rica | 37 | 0.0% |
| Croatia | 218 | 0.0% |
| Cuba | 982 | 0.1% |
| Czechoslovakia | 716 | 0.1% |
| Denmark | 65 | 0.0% |
| Dominican Republic | 356 | 0.0% |
| Eastern Africa | 1,111 | 0.1% |
| Eastern Asia | 10,303 | 1.1% |
| Eastern Europe | 23,511 | 2.5% |
| Ecuador | 708 | 0.1% |
| Egypt | 790 | 0.1% |
| El Salvador | 1,229 | 0.1% |
| England | 995 | 0.1% |
| Eritrea | 31 | 0.0% |
| Ethiopia | 234 | 0.0% |
| Europe | 31,589 | 3.4% |
| Fiji | 4 | 0.0% |
| France | 272 | 0.0% |
| Germany | 1,629 | 0.2% |
| Ghana | 695 | 0.1% |
| Greece | 538 | 0.1% |
| Guatemala | 938 | 0.1% |
| Guyana | 25 | 0.0% |
| Haiti | 175 | 0.0% |
| Honduras | 994 | 0.1% |
| Hong Kong | 434 | 0.1% |
| Hungary | 143 | 0.0% |
| India | 22,935 | 2.4% |
| Indonesia | 86 | 0.0% |
| Iran | 794 | 0.1% |
| Iraq | 607 | 0.1% |
| Ireland | 288 | 0.0% |
| Israel | 134 | 0.0% |
| Italy | 1,934 | 0.2% |
| Jamaica | 679 | 0.1% |
| Japan | 580 | 0.1% |
| Jordan | 350 | 0.0% |
| Kazakhstan | 59 | 0.0% |
| Kenya | 354 | 0.0% |
| Korea | 2,762 | 0.3% |
| Kuwait | 42 | 0.0% |
| Laos | 288 | 0.0% |
| Latin America | 68,825 | 7.3% |
| Latvia | 176 | 0.0% |
| Lebanon | 217 | 0.0% |
| Liberia | 2 | 0.0% |
| Lithuania | 2,572 | 0.3% |
| Malaysia | 213 | 0.0% |
| Mexico | 58,219 | 6.2% |
| Micronesia | 10 | 0.0% |
| Middle Africa | 153 | 0.0% |
| Moldova | 1,100 | 0.1% |
| Morocco | 118 | 0.0% |
| Nepal | 397 | 0.0% |
| Netherlands | 114 | 0.0% |
| Nicaragua | 148 | 0.0% |
| Nigeria | 722 | 0.1% |
| North Macedonia | 244 | 0.0% |
| Northern Africa | 1,184 | 0.1% |
| Northern Europe | 2,598 | 0.3% |
| Norway | 28 | 0.0% |
| Oceania | 331 | 0.0% |
| Pakistan | 5,041 | 0.5% |
| Panama | 182 | 0.0% |
| Peru | 451 | 0.1% |
| Philippines | 7,314 | 0.8% |
| Poland | 10,958 | 1.2% |
| Romania | 956 | 0.1% |
| Russia | 916 | 0.1% |
| Saudi Arabia | 338 | 0.0% |
| Scotland | 163 | 0.0% |
| Senegal | 64 | 0.0% |
| Serbia | 410 | 0.0% |
| Singapore | 65 | 0.0% |
| Somalia | 38 | 0.0% |
| South Africa | 363 | 0.0% |
| South America | 4,726 | 0.5% |
| South Central Asia | 30,245 | 3.2% |
| South Eastern Asia | 10,247 | 1.1% |
| Southern Europe | 2,702 | 0.3% |
| Spain | 230 | 0.0% |
| Sri Lanka | 175 | 0.0% |
| Sudan | 8 | 0.0% |
| Sweden | 45 | 0.0% |
| Switzerland | 133 | 0.0% |
| Syria | 398 | 0.0% |
| Taiwan | 1,173 | 0.1% |
| Thailand | 170 | 0.0% |
| Trinidad and Tobago | 79 | 0.0% |
| Turkey | 197 | 0.0% |
| Uganda | 155 | 0.0% |
| Ukraine | 1,358 | 0.1% |
| Uruguay | 115 | 0.0% |
| Uzbekistan | 49 | 0.0% |
| Venezuela | 1,074 | 0.1% |
| Vietnam | 1,093 | 0.1% |
| Western Africa | 1,483 | 0.2% |
| Western Asia | 2,486 | 0.3% |
| Western Europe | 2,356 | 0.3% |
| Yemen | 4 | 0.0% |
| Zaire | 74 | 0.0% |
| Zimbabwe | 63 | 0.0% | View All 127 Rows |
Sex and Age in Area Code 331
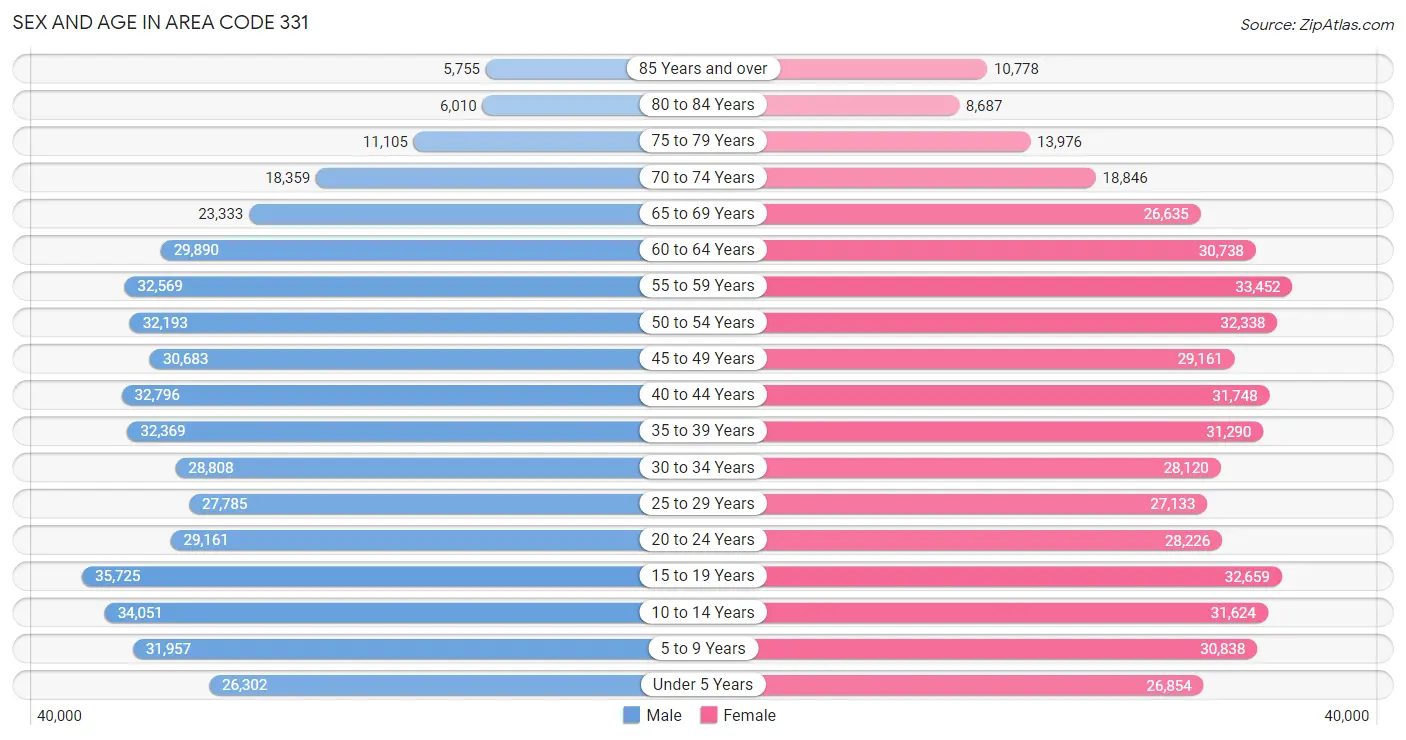
Sex and Age in Area Code 331
The most populous age groups in Area Code 331 are 15 to 19 Years (35,725 | 7.6%) for men and 55 to 59 Years (33,452 | 7.1%) for women.
| Age Bracket | Male | Female |
| Under 5 Years | 26,302 (5.6%) | 26,854 (5.7%) |
| 5 to 9 Years | 31,957 (6.8%) | 30,838 (6.5%) |
| 10 to 14 Years | 34,051 (7.3%) | 31,624 (6.7%) |
| 15 to 19 Years | 35,725 (7.6%) | 32,659 (6.9%) |
| 20 to 24 Years | 29,161 (6.2%) | 28,226 (6.0%) |
| 25 to 29 Years | 27,785 (5.9%) | 27,133 (5.7%) |
| 30 to 34 Years | 28,808 (6.1%) | 28,120 (5.9%) |
| 35 to 39 Years | 32,369 (6.9%) | 31,290 (6.6%) |
| 40 to 44 Years | 32,796 (7.0%) | 31,748 (6.7%) |
| 45 to 49 Years | 30,683 (6.5%) | 29,161 (6.2%) |
| 50 to 54 Years | 32,193 (6.9%) | 32,338 (6.8%) |
| 55 to 59 Years | 32,569 (7.0%) | 33,452 (7.1%) |
| 60 to 64 Years | 29,890 (6.4%) | 30,738 (6.5%) |
| 65 to 69 Years | 23,333 (5.0%) | 26,635 (5.6%) |
| 70 to 74 Years | 18,359 (3.9%) | 18,846 (4.0%) |
| 75 to 79 Years | 11,105 (2.4%) | 13,976 (2.9%) |
| 80 to 84 Years | 6,010 (1.3%) | 8,687 (1.8%) |
| 85 Years and over | 5,755 (1.2%) | 10,778 (2.3%) |
| Total | 468,851 (100.0%) | 473,103 (100.0%) |
Families and Households in Area Code 331
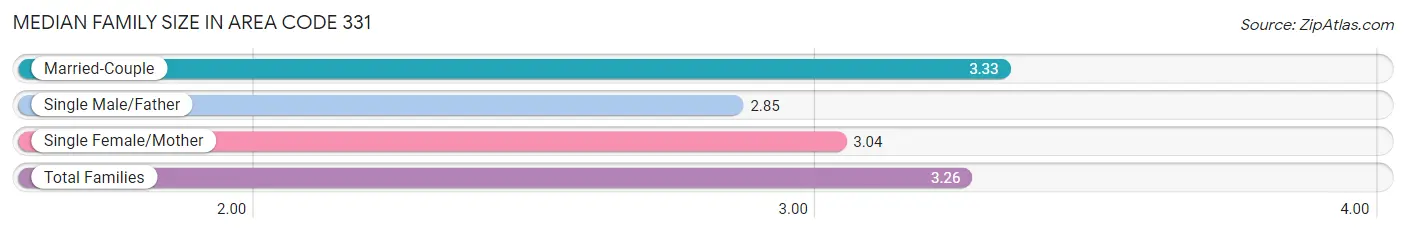
Median Family Size in Area Code 331
The median family size in Area Code 331 is 3.26 persons per family, with married-couple families (197,009 | 80.4%) accounting for the largest median family size of 3.32827 persons per family. On the other hand, single male/father families (15,444 | 6.3%) represent the smallest median family size with 2.85 persons per family.
| Family Type | # Families | Family Size |
| Married-Couple | 197,009 (80.4%) | 3.33 |
| Single Male/Father | 15,444 (6.3%) | 2.85 |
| Single Female/Mother | 32,689 (13.3%) | 3.04 |
| Total Families | 245,142 (100.0%) | 3.26 |
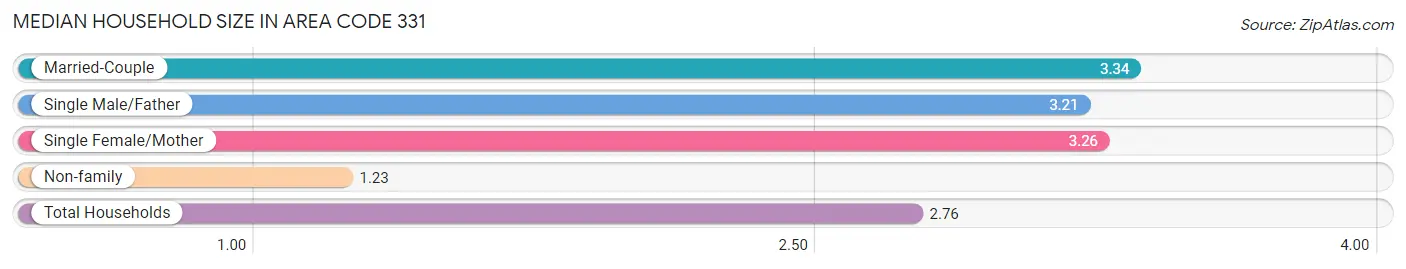
Median Household Size in Area Code 331
The median household size in Area Code 331 is 2.76 persons per household, with married-couple households (197,009 | 58.5%) accounting for the largest median household size of 3.34241 persons per household. non-family households (91,427 | 27.2%) represent the smallest median household size with 1.23 persons per household.
| Household Type | # Households | Household Size |
| Married-Couple | 197,009 (58.5%) | 3.34 |
| Single Male/Father | 15,444 (4.6%) | 3.21 |
| Single Female/Mother | 32,689 (9.7%) | 3.26 |
| Non-family | 91,427 (27.2%) | 1.23 |
| Total Households | 336,569 (100.0%) | 2.76 |
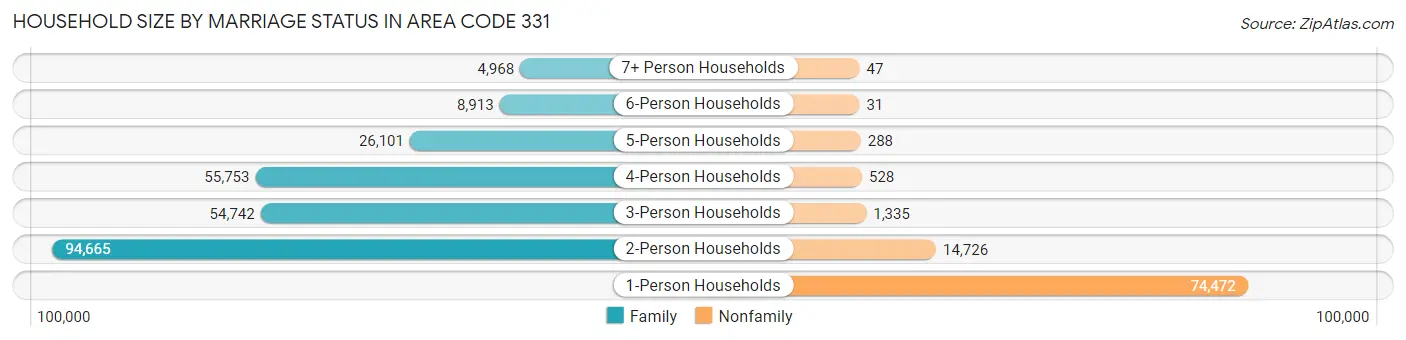
Household Size by Marriage Status in Area Code 331
Out of a total of 336,569 households in Area Code 331, 245,142 (72.8%) are family households, while 91,427 (27.2%) are nonfamily households. The most numerous type of family households are 2-person households, comprising 94,665, and the most common type of nonfamily households are 1-person households, comprising 74,472.
| Household Size | Family Households | Nonfamily Households |
| 1-Person Households | - | 74,472 (22.1%) |
| 2-Person Households | 94,665 (28.1%) | 14,726 (4.4%) |
| 3-Person Households | 54,742 (16.3%) | 1,335 (0.4%) |
| 4-Person Households | 55,753 (16.6%) | 528 (0.2%) |
| 5-Person Households | 26,101 (7.8%) | 288 (0.1%) |
| 6-Person Households | 8,913 (2.6%) | 31 (0.0%) |
| 7+ Person Households | 4,968 (1.5%) | 47 (0.0%) |
| Total | 245,142 (72.8%) | 91,427 (27.2%) |
Female Fertility in Area Code 331
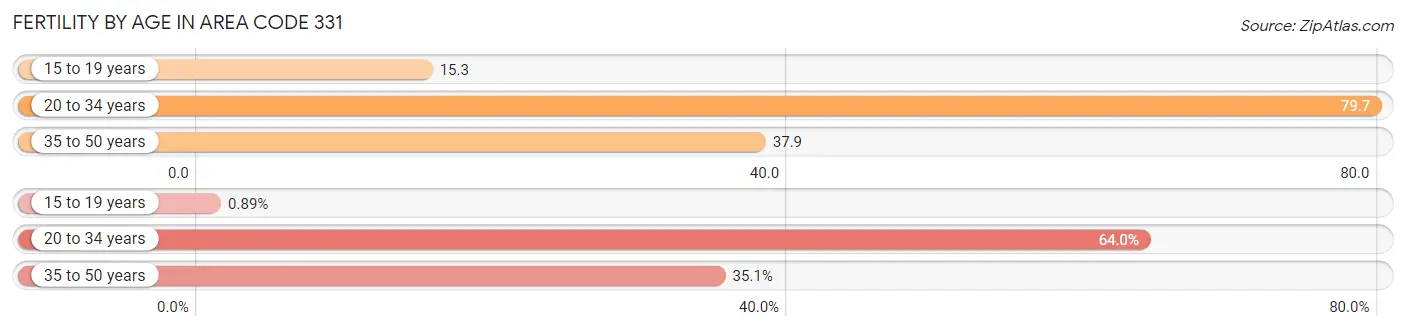
Fertility by Age in Area Code 331
Average fertility rate in Area Code 331 is 48.8 births per 1,000 women. Women in the age bracket of 20 to 34 years have the highest fertility rate with 79.7 births per 1,000 women. Women in the age bracket of 20 to 34 years acount for 64.0% of all women with births.
| Age Bracket | Women with Births | Births / 1,000 Women |
| 15 to 19 years | 96 (0.9%) | 15.2 |
| 20 to 34 years | 6,866 (64.0%) | 79.7 |
| 35 to 50 years | 3,770 (35.1%) | 37.9 |
| Total | 10,732 (100.0%) | 48.8 |
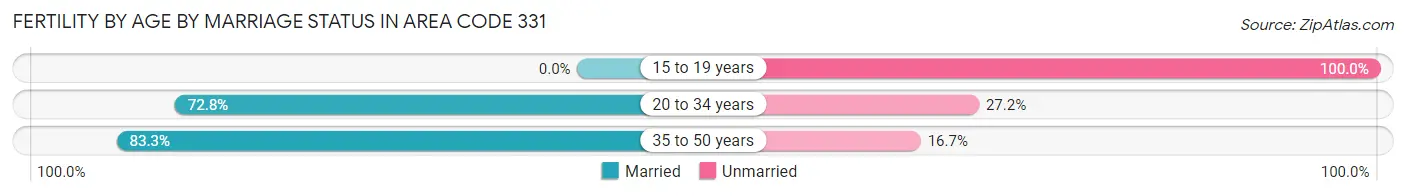
Fertility by Age by Marriage Status in Area Code 331
78.6% of women with births (10,732) in Area Code 331 are married. The highest percentage of unmarried women with births falls into 15 to 19 years age bracket with 100.0% of them unmarried at the time of birth, while the lowest percentage of unmarried women with births belong to 35 to 50 years age bracket with 16.7% of them unmarried.
| Age Bracket | Married | Unmarried |
| 15 to 19 years | 0 (0.0%) | 96 (100.0%) |
| 20 to 34 years | 4,996 (72.8%) | 1,870 (27.2%) |
| 35 to 50 years | 3,141 (83.3%) | 629 (16.7%) |
| Total | 8,430 (78.5%) | 2,302 (21.4%) |
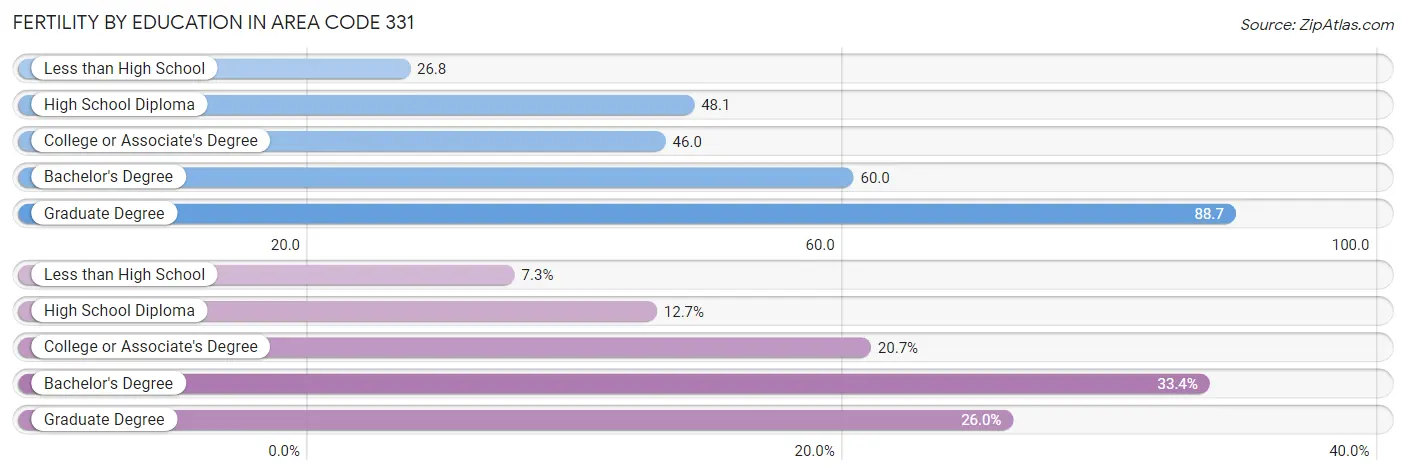
Fertility by Education in Area Code 331
Average fertility rate in Area Code 331 is 48.8 births per 1,000 women. Women with the education attainment of graduate degree have the highest fertility rate of 88.7 births per 1,000 women, while women with the education attainment of less than high school have the lowest fertility at 26.8 births per 1,000 women. Women with the education attainment of bachelor's degree represent 33.4% of all women with births.
| Educational Attainment | Women with Births | Births / 1,000 Women |
| Less than High School | 786 (7.3%) | 26.8 |
| High School Diploma | 1,358 (12.7%) | 48.1 |
| College or Associate's Degree | 2,218 (20.7%) | 46.0 |
| Bachelor's Degree | 3,580 (33.4%) | 60.0 |
| Graduate Degree | 2,790 (26.0%) | 88.7 |
| Total | 10,732 (100.0%) | 48.8 |
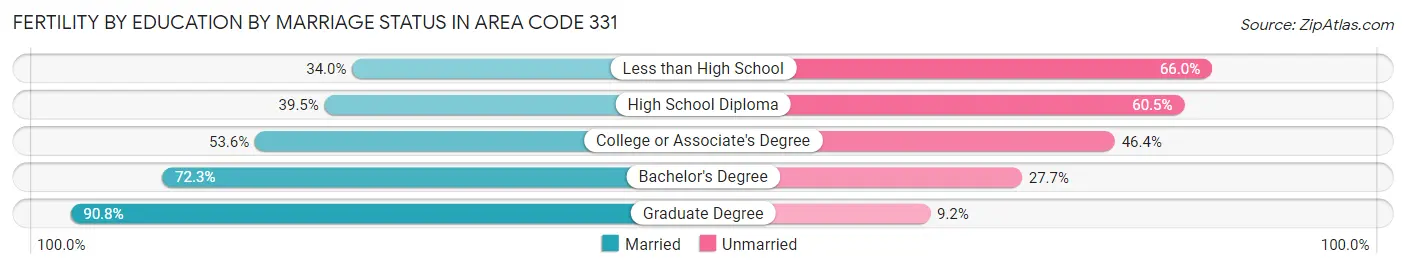
Fertility by Education by Marriage Status in Area Code 331
21.4% of women with births in Area Code 331 are unmarried. Women with the educational attainment of graduate degree are most likely to be married with 90.8% of them married at childbirth, while women with the educational attainment of less than high school are least likely to be married with 66.0% of them unmarried at childbirth.
| Educational Attainment | Married | Unmarried |
| Less than High School | 267 (34.0%) | 519 (66.0%) |
| High School Diploma | 537 (39.5%) | 821 (60.5%) |
| College or Associate's Degree | 1,188 (53.6%) | 1,030 (46.4%) |
| Bachelor's Degree | 2,588 (72.3%) | 992 (27.7%) |
| Graduate Degree | 2,533 (90.8%) | 257 (9.2%) |
| Total | 8,430 (78.5%) | 2,302 (21.4%) |
Income in Area Code 331
Income Overview in Area Code 331
Per Capita Income in Area Code 331 is $51,795, while median incomes of families and households are $132,127 and $112,049 respectively.
| Characteristic | Number | Measure |
| Per Capita Income | 941,954 | $51,795 |
| Median Family Income | 245,142 | $132,127 |
| Mean Family Income | 245,142 | $4,665,908 |
| Median Household Income | 336,569 | $112,049 |
| Mean Household Income | 336,569 | $4,084,665 |
| Income Deficit | 245,142 | $11,427 |
| Wage / Income Gap (%) | 941,954 | 35.47% |
| Wage / Income Gap ($) | 941,954 | 64.53¢ per $1 |
| Gini / Inequality Index | 941,954 | 11.92 |
Earnings by Sex in Area Code 331
Average Earnings in Area Code 331 are $55,127, $68,671 for men and $43,283 for women, a difference of 37.0%.
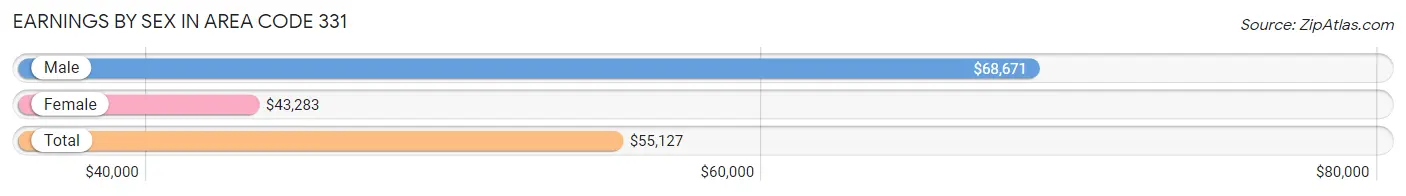
| Sex | Number | Average Earnings |
| Male | 286,816 (53.6%) | $68,671 |
| Female | 248,035 (46.4%) | $43,283 |
| Total | 534,851 (100.0%) | $55,127 |
Earnings by Sex by Income Bracket in Area Code 331
The most common earnings brackets in Area Code 331 are $100,000+ for men (85,293 | 29.7%) and $100,000+ for women (34,232 | 13.8%).
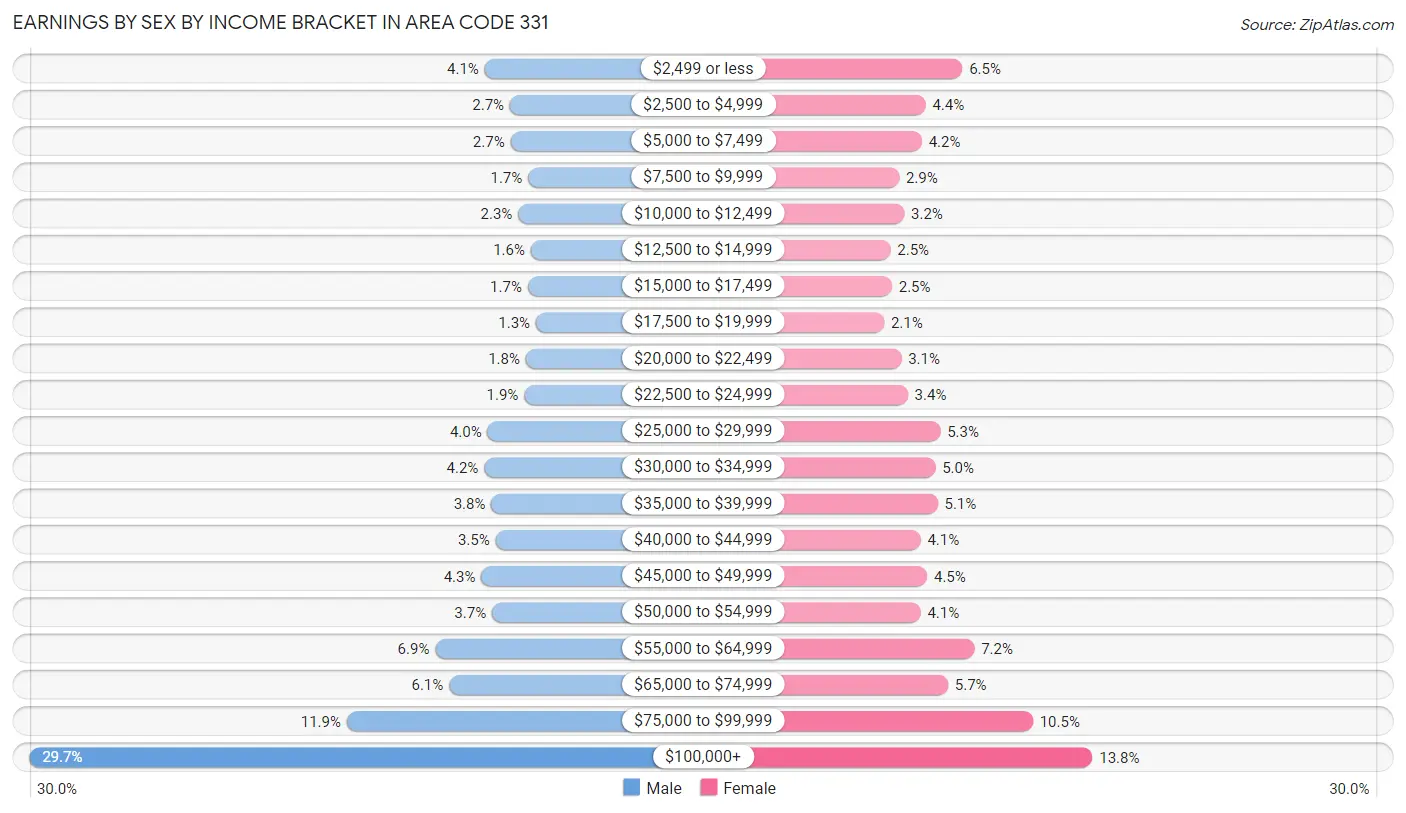
| Income | Male | Female |
| $2,499 or less | 11,863 (4.1%) | 16,086 (6.5%) |
| $2,500 to $4,999 | 7,807 (2.7%) | 10,968 (4.4%) |
| $5,000 to $7,499 | 7,706 (2.7%) | 10,440 (4.2%) |
| $7,500 to $9,999 | 4,875 (1.7%) | 7,257 (2.9%) |
| $10,000 to $12,499 | 6,480 (2.3%) | 7,975 (3.2%) |
| $12,500 to $14,999 | 4,441 (1.5%) | 6,078 (2.5%) |
| $15,000 to $17,499 | 4,937 (1.7%) | 6,270 (2.5%) |
| $17,500 to $19,999 | 3,621 (1.3%) | 5,185 (2.1%) |
| $20,000 to $22,499 | 5,246 (1.8%) | 7,590 (3.1%) |
| $22,500 to $24,999 | 5,521 (1.9%) | 8,475 (3.4%) |
| $25,000 to $29,999 | 11,411 (4.0%) | 13,012 (5.2%) |
| $30,000 to $34,999 | 11,966 (4.2%) | 12,336 (5.0%) |
| $35,000 to $39,999 | 10,809 (3.8%) | 12,643 (5.1%) |
| $40,000 to $44,999 | 10,117 (3.5%) | 10,257 (4.1%) |
| $45,000 to $49,999 | 12,431 (4.3%) | 11,189 (4.5%) |
| $50,000 to $54,999 | 10,705 (3.7%) | 10,266 (4.1%) |
| $55,000 to $64,999 | 19,853 (6.9%) | 17,767 (7.2%) |
| $65,000 to $74,999 | 17,622 (6.1%) | 14,094 (5.7%) |
| $75,000 to $99,999 | 34,112 (11.9%) | 25,915 (10.4%) |
| $100,000+ | 85,293 (29.7%) | 34,232 (13.8%) |
| Total | 286,816 (100.0%) | 248,035 (100.0%) |
Earnings by Sex by Educational Attainment in Area Code 331
Average earnings in Area Code 331 are $2,260,625 for men and $1,474,405 for women, a difference of 34.8%. Men with an educational attainment of graduate degree enjoy the highest average annual earnings of $3,307,366, while those with less than high school education earn the least with $1,029,520. Women with an educational attainment of graduate degree earn the most with the average annual earnings of $2,256,284, while those with less than high school education have the smallest earnings of $505,960.
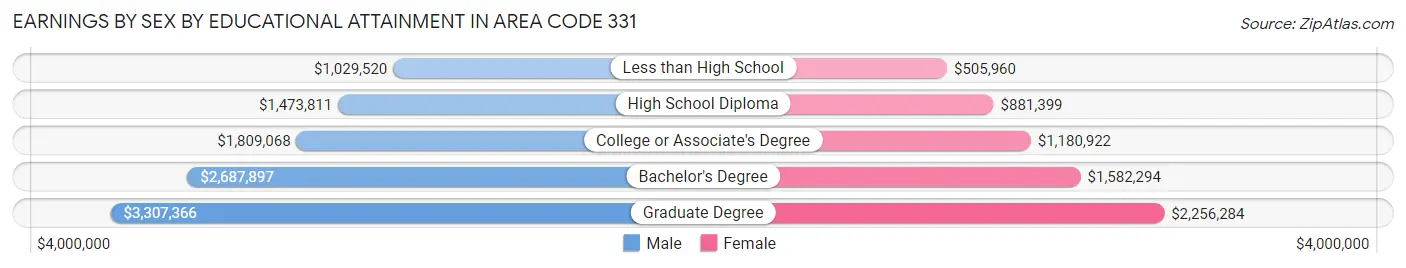
| Educational Attainment | Male Income | Female Income |
| Less than High School | $1,029,520 | $505,960 |
| High School Diploma | $1,473,811 | $881,399 |
| College or Associate's Degree | $1,809,068 | $1,180,922 |
| Bachelor's Degree | $2,687,897 | $1,582,294 |
| Graduate Degree | $3,307,366 | $2,256,284 |
| Total | $2,260,625 | $1,474,405 |
Family Income in Area Code 331
Family Income Brackets in Area Code 331
According to the Area Code 331 family income data, there are 1,733,399 families falling into the $200,000+ income range, which is the most common income bracket and makes up 707.1% of all families. Conversely, the $10,000 to $14,999 income bracket is the least frequent group with only 50,254 families (20.5%) belonging to this category.
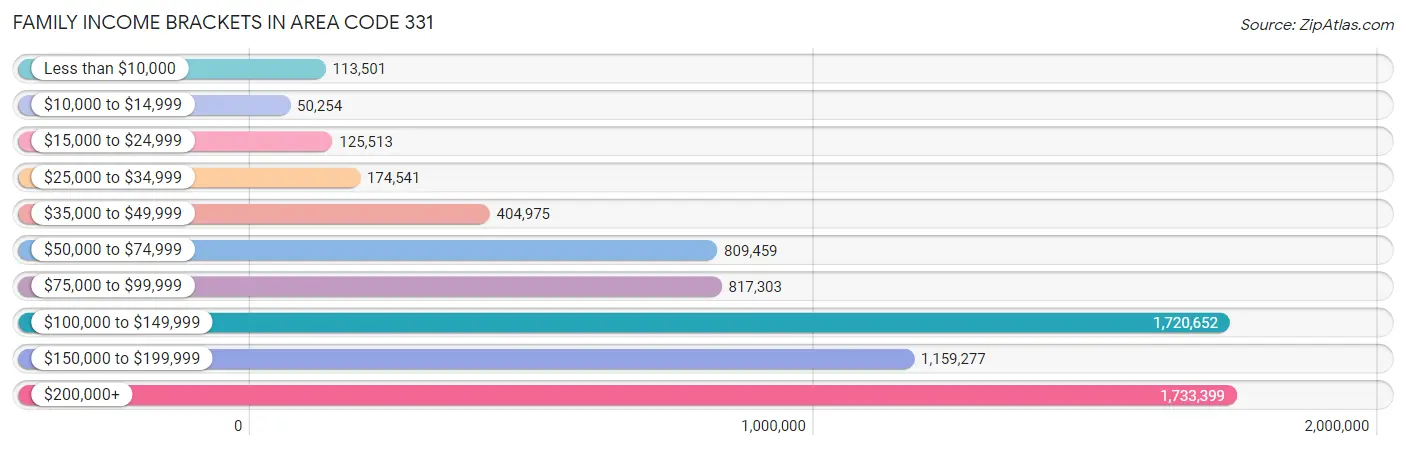
| Income Bracket | # Families | % Families |
| Less than $10,000 | 113,501 | 46.3% |
| $10,000 to $14,999 | 50,254 | 20.5% |
| $15,000 to $24,999 | 125,513 | 51.2% |
| $25,000 to $34,999 | 174,541 | 71.2% |
| $35,000 to $49,999 | 404,975 | 165.2% |
| $50,000 to $74,999 | 809,459 | 330.2% |
| $75,000 to $99,999 | 817,303 | 333.4% |
| $100,000 to $149,999 | 1,720,652 | 701.9% |
| $150,000 to $199,999 | 1,159,277 | 472.9% |
| $200,000+ | 1,733,399 | 707.1% |
Family Income by Famaliy Size in Area Code 331
7+ person families (4,254 | 1.7%) account for the highest median family income in Area Code 331 with $163,933 per family, while 2-person families (99,018 | 40.4%) have the highest median income of $55,857 per family member.
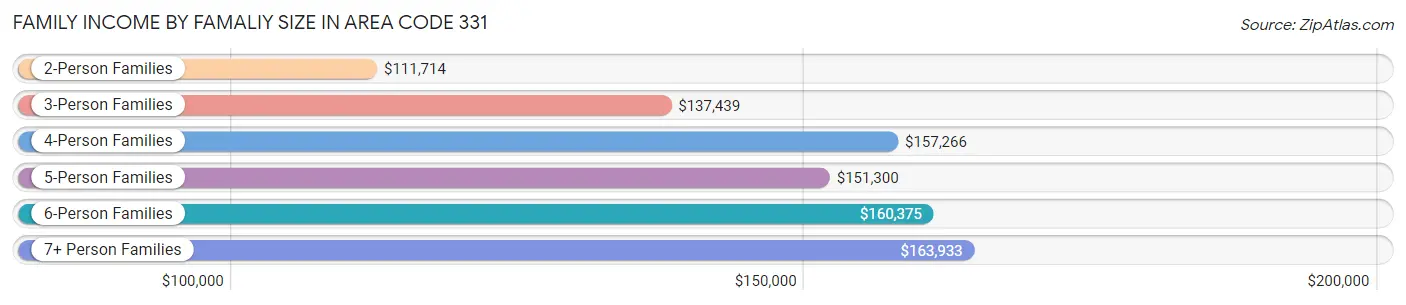
| Income Bracket | # Families | Median Income |
| 2-Person Families | 99,018 (40.4%) | $111,714 |
| 3-Person Families | 55,012 (22.4%) | $137,439 |
| 4-Person Families | 53,704 (21.9%) | $157,266 |
| 5-Person Families | 25,128 (10.2%) | $151,300 |
| 6-Person Families | 8,026 (3.3%) | $160,375 |
| 7+ Person Families | 4,254 (1.7%) | $163,933 |
| Total | 245,142 (100.0%) | $132,127 |
Family Income by Number of Earners in Area Code 331
The median family income in Area Code 331 is $132,127, with families comprising 3+ earners (42,244) having the highest median family income of $174,358, while families with no earners (25,645) have the lowest median family income of $69,399, accounting for 17.2% and 10.5% of families, respectively.
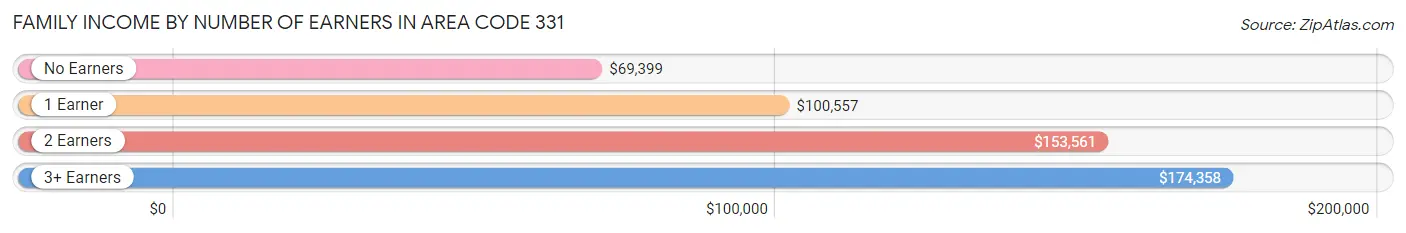
| Number of Earners | # Families | Median Income |
| No Earners | 25,645 (10.5%) | $69,399 |
| 1 Earner | 65,775 (26.8%) | $100,557 |
| 2 Earners | 111,478 (45.5%) | $153,561 |
| 3+ Earners | 42,244 (17.2%) | $174,358 |
| Total | 245,142 (100.0%) | $132,127 |
Household Income in Area Code 331
Household Income Brackets in Area Code 331
With 2,060,812 households falling in the category, the $100,000 to $149,999 income range is the most frequent in Area Code 331, accounting for 612.3% of all households. In contrast, only 147,754 households (43.9%) fall into the $10,000 to $14,999 income bracket, making it the least populous group.
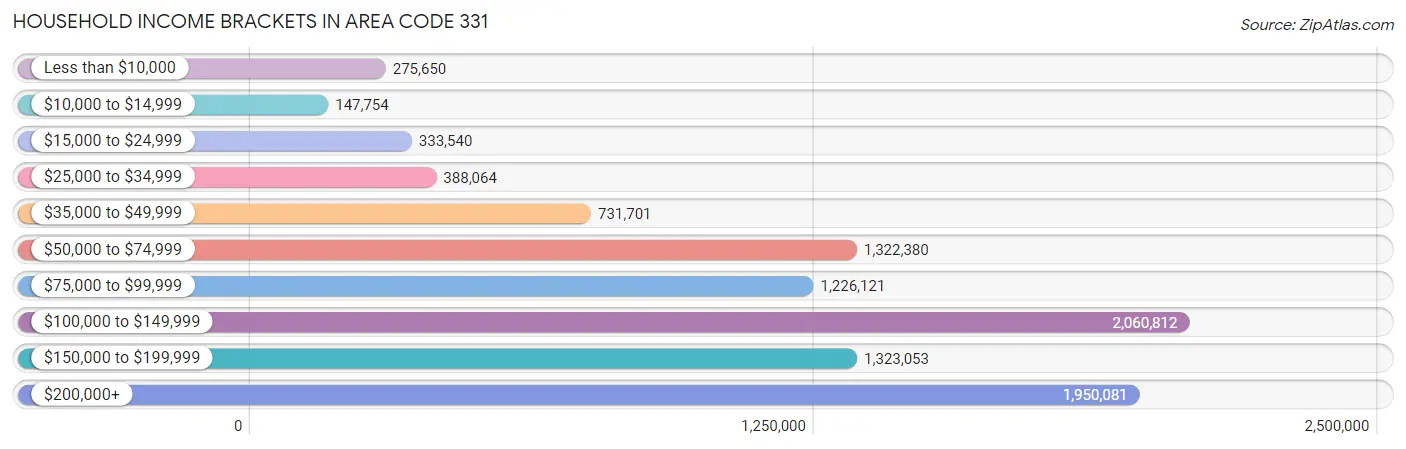
| Income Bracket | # Households | % Households |
| Less than $10,000 | 275,650 | 81.9% |
| $10,000 to $14,999 | 147,754 | 43.9% |
| $15,000 to $24,999 | 333,540 | 99.1% |
| $25,000 to $34,999 | 388,064 | 115.3% |
| $35,000 to $49,999 | 731,701 | 217.4% |
| $50,000 to $74,999 | 1,322,380 | 392.9% |
| $75,000 to $99,999 | 1,226,121 | 364.3% |
| $100,000 to $149,999 | 2,060,812 | 612.3% |
| $150,000 to $199,999 | 1,323,053 | 393.1% |
| $200,000+ | 1,950,081 | 579.4% |
Household Income by Householder Age in Area Code 331
The median household income in Area Code 331 is $112,049, with the highest median household income of $132,944 found in the 45 to 64 years age bracket for the primary householder. A total of 136,467 households (40.6%) fall into this category. Meanwhile, the 15 to 24 years age bracket for the primary householder has the lowest median household income of $62,079, with 7,067 households (2.1%) in this group.
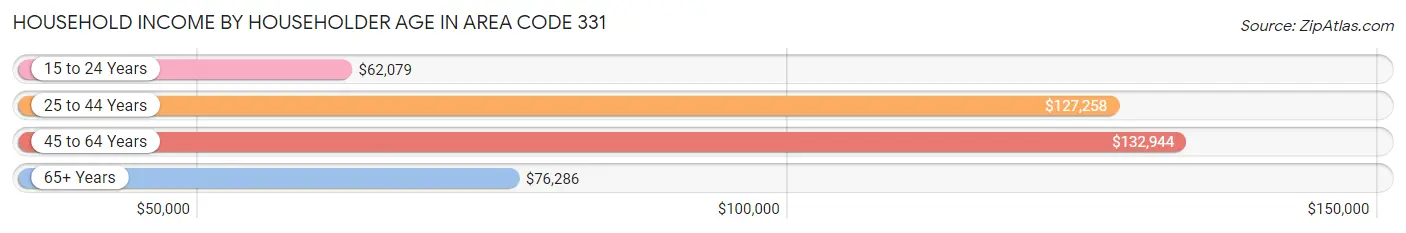
| Income Bracket | # Households | Median Income |
| 15 to 24 Years | 7,067 (2.1%) | $62,079 |
| 25 to 44 Years | 108,486 (32.2%) | $127,258 |
| 45 to 64 Years | 136,467 (40.6%) | $132,944 |
| 65+ Years | 84,549 (25.1%) | $76,286 |
| Total | 336,569 (100.0%) | $112,049 |
Poverty in Area Code 331
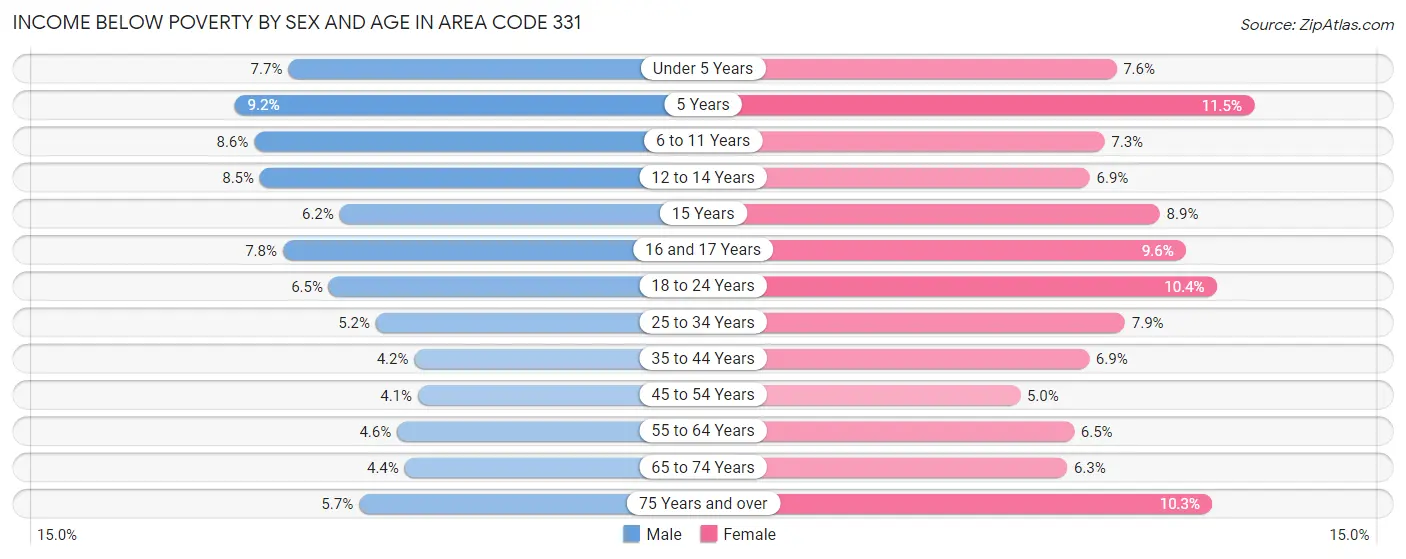
Income Below Poverty by Sex and Age in Area Code 331
With 5.6% poverty level for males and 7.4% for females among the residents of Area Code 331, 5 year old males and 5 year old females are the most vulnerable to poverty, with 531 males (9.1%) and 656 females (11.5%) in their respective age groups living below the poverty level.
| Age Bracket | Male | Female |
| Under 5 Years | 1,995 (7.7%) | 2,031 (7.6%) |
| 5 Years | 531 (9.1%) | 656 (11.5%) |
| 6 to 11 Years | 3,407 (8.6%) | 2,653 (7.3%) |
| 12 to 14 Years | 1,667 (8.5%) | 1,368 (6.9%) |
| 15 Years | 455 (6.2%) | 640 (8.8%) |
| 16 and 17 Years | 1,163 (7.8%) | 1,315 (9.6%) |
| 18 to 24 Years | 2,602 (6.5%) | 3,930 (10.4%) |
| 25 to 34 Years | 2,928 (5.2%) | 4,344 (7.9%) |
| 35 to 44 Years | 2,697 (4.2%) | 4,324 (6.9%) |
| 45 to 54 Years | 2,537 (4.1%) | 3,047 (5.0%) |
| 55 to 64 Years | 2,875 (4.6%) | 4,135 (6.5%) |
| 65 to 74 Years | 1,828 (4.4%) | 2,823 (6.3%) |
| 75 Years and over | 1,249 (5.7%) | 3,199 (10.3%) |
| Total | 25,934 (5.6%) | 34,465 (7.4%) |
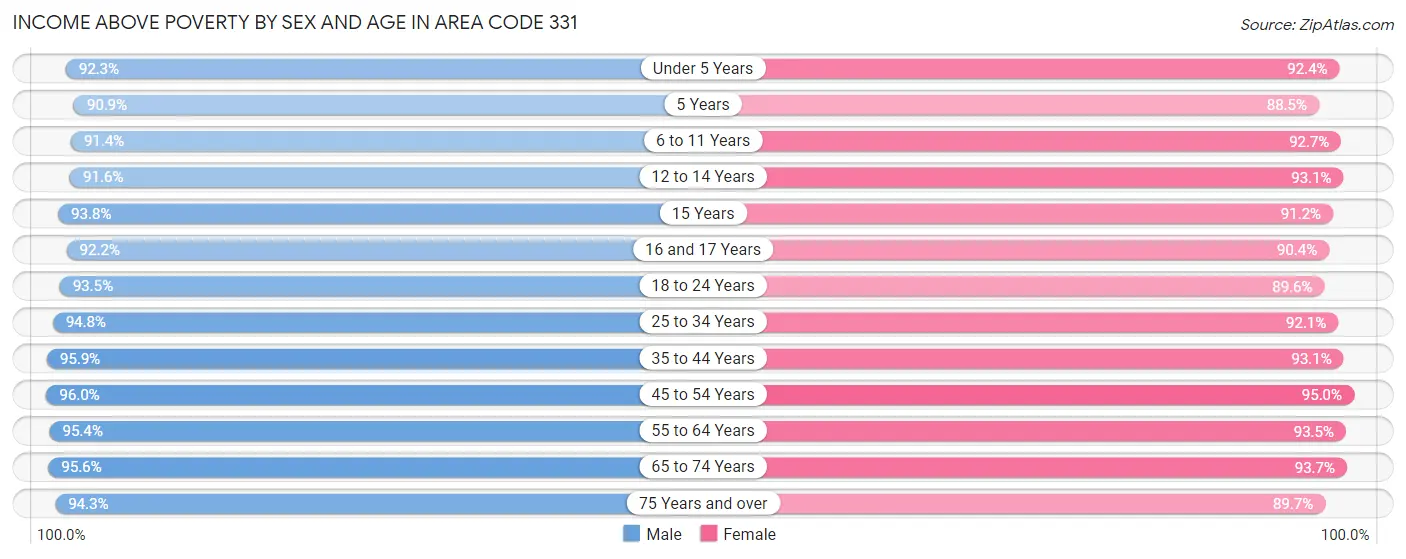
Income Above Poverty by Sex and Age in Area Code 331
According to the poverty statistics in Area Code 331, males aged 45 to 54 years and females aged 45 to 54 years are the age groups that are most secure financially, with 96.0% of males and 95.0% of females in these age groups living above the poverty line.
| Age Bracket | Male | Female |
| Under 5 Years | 24,040 (92.3%) | 24,555 (92.4%) |
| 5 Years | 5,275 (90.8%) | 5,061 (88.5%) |
| 6 to 11 Years | 36,179 (91.4%) | 33,629 (92.7%) |
| 12 to 14 Years | 18,057 (91.5%) | 18,464 (93.1%) |
| 15 Years | 6,844 (93.8%) | 6,593 (91.1%) |
| 16 and 17 Years | 13,737 (92.2%) | 12,432 (90.4%) |
| 18 to 24 Years | 37,255 (93.5%) | 33,760 (89.6%) |
| 25 to 34 Years | 53,161 (94.8%) | 50,763 (92.1%) |
| 35 to 44 Years | 62,241 (95.9%) | 58,556 (93.1%) |
| 45 to 54 Years | 60,129 (96.0%) | 58,336 (95.0%) |
| 55 to 64 Years | 59,163 (95.4%) | 59,838 (93.5%) |
| 65 to 74 Years | 39,540 (95.6%) | 42,192 (93.7%) |
| 75 Years and over | 20,712 (94.3%) | 27,856 (89.7%) |
| Total | 436,333 (94.4%) | 432,035 (92.6%) |
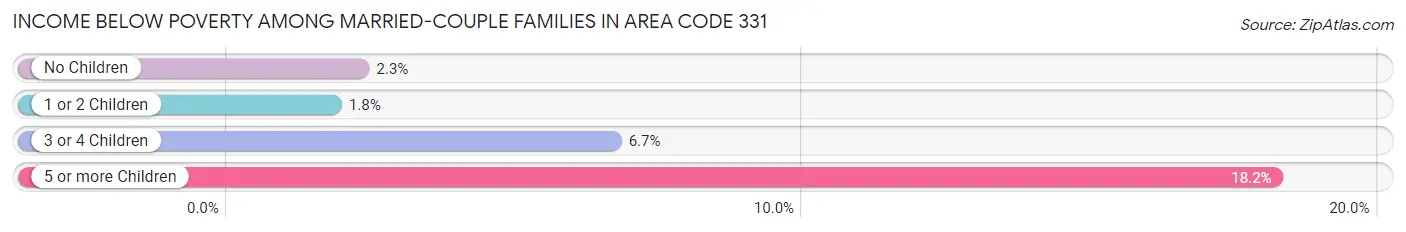
Income Below Poverty Among Married-Couple Families in Area Code 331
The poverty statistics for married-couple families in Area Code 331 show that 2.6% or 5,116 of the total 197,009 families live below the poverty line. Families with 5 or more children have the highest poverty rate of 18.2%, comprising of 148 families. On the other hand, families with 1 or 2 children have the lowest poverty rate of 1.8%, which includes 1,288 families.
| Children | Above Poverty | Below Poverty |
| No Children | 104,216 (97.7%) | 2,445 (2.3%) |
| 1 or 2 Children | 69,758 (98.2%) | 1,288 (1.8%) |
| 3 or 4 Children | 17,254 (93.3%) | 1,235 (6.7%) |
| 5 or more Children | 665 (81.8%) | 148 (18.2%) |
| Total | 191,893 (97.4%) | 5,116 (2.6%) |
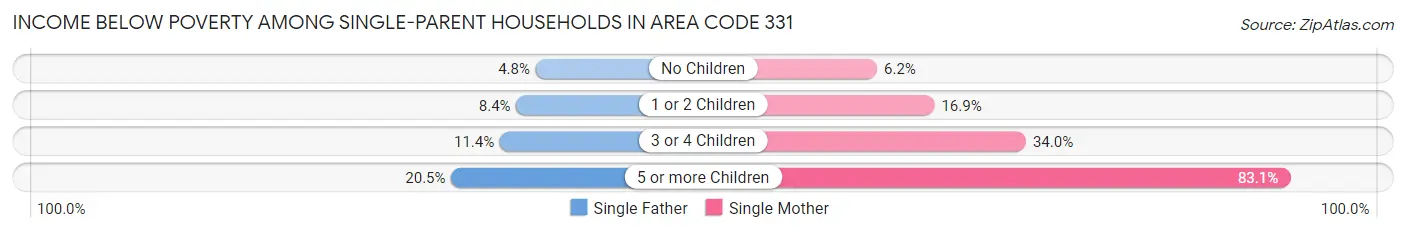
Income Below Poverty Among Single-Parent Households in Area Code 331
According to the poverty data in Area Code 331, 6.8% or 1,046 single-father households and 14.6% or 4,773 single-mother households are living below the poverty line. Among single-father households, those with 5 or more children have the highest poverty rate, with 8 households (20.5%) experiencing poverty. Likewise, among single-mother households, those with 5 or more children have the highest poverty rate, with 207 households (83.1%) falling below the poverty line.
| Children | Single Father | Single Mother |
| No Children | 387 (4.8%) | 860 (6.2%) |
| 1 or 2 Children | 509 (8.4%) | 2,603 (16.9%) |
| 3 or 4 Children | 142 (11.4%) | 1,103 (34.0%) |
| 5 or more Children | 8 (20.5%) | 207 (83.1%) |
| Total | 1,046 (6.8%) | 4,773 (14.6%) |
Income Below Poverty Among Married-Couple vs Single-Parent Households in Area Code 331
The poverty data for Area Code 331 shows that 5,116 of the married-couple family households (2.6%) and 5,819 of the single-parent households (12.1%) are living below the poverty level. Within the married-couple family households, those with 5 or more children have the highest poverty rate, with 148 households (18.2%) falling below the poverty line. Among the single-parent households, those with 5 or more children have the highest poverty rate, with 215 household (74.7%) living below poverty.
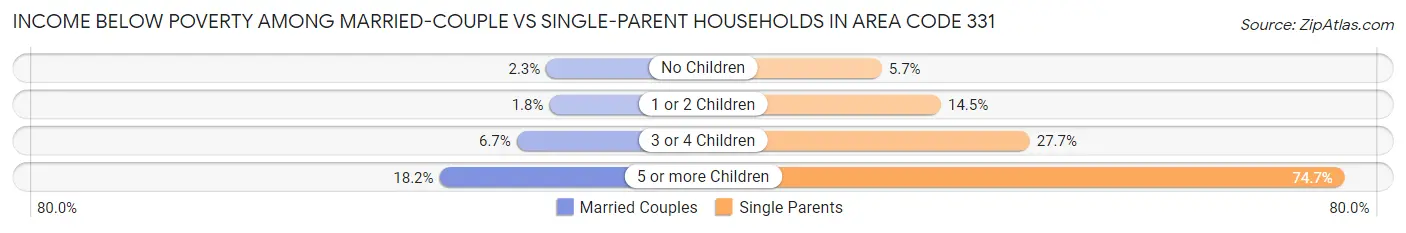
| Children | Married-Couple Families | Single-Parent Households |
| No Children | 2,445 (2.3%) | 1,247 (5.7%) |
| 1 or 2 Children | 1,288 (1.8%) | 3,112 (14.5%) |
| 3 or 4 Children | 1,235 (6.7%) | 1,245 (27.7%) |
| 5 or more Children | 148 (18.2%) | 215 (74.7%) |
| Total | 5,116 (2.6%) | 5,819 (12.1%) |
Employment Characteristics in Area Code 331
Employment by Class of Employer in Area Code 331
Among the 479,656 employed individuals in Area Code 331, private company employees (346,339 | 72.2%), not-for-profit organizations (37,889 | 7.9%), and local government employees (36,052 | 7.5%) make up the most common classes of employment.
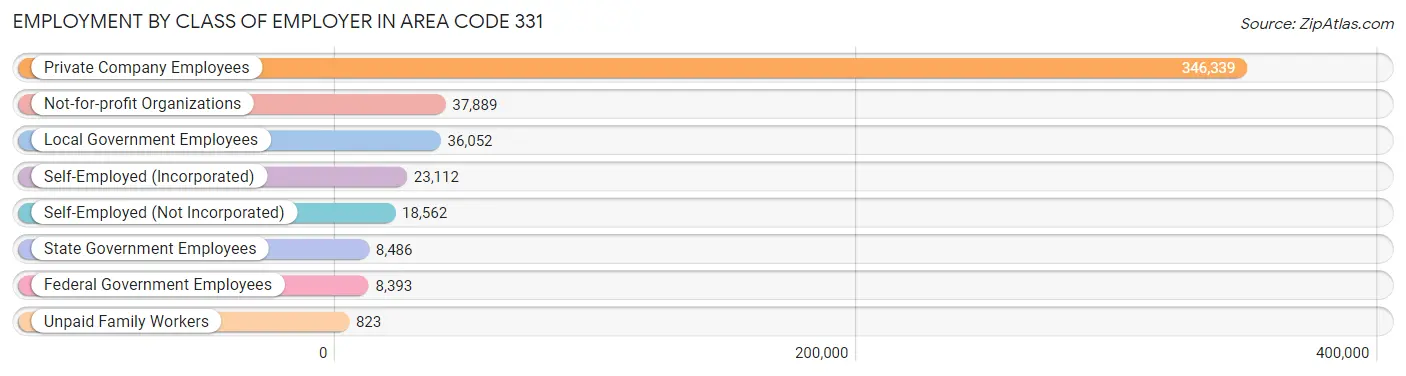
| Employer Class | # Employees | % Employees |
| Private Company Employees | 346,339 | 72.2% |
| Self-Employed (Incorporated) | 23,112 | 4.8% |
| Self-Employed (Not Incorporated) | 18,562 | 3.9% |
| Not-for-profit Organizations | 37,889 | 7.9% |
| Local Government Employees | 36,052 | 7.5% |
| State Government Employees | 8,486 | 1.8% |
| Federal Government Employees | 8,393 | 1.8% |
| Unpaid Family Workers | 823 | 0.2% |
| Total | 479,656 | 100.0% |
Employment Status by Age in Area Code 331
According to the labor force statistics for Area Code 331, out of the total population over 16 years of age (745,753), 69.4% or 517,254 individuals are in the labor force, with 4.8% or 24,776 of them unemployed. The age group with the highest labor force participation rate is 45 to 54 years, with 88.3% or 109,811 individuals in the labor force. Within the labor force, the 16 to 19 years age range has the highest percentage of unemployed individuals, with 321.3% or 79,599 of them being unemployed.
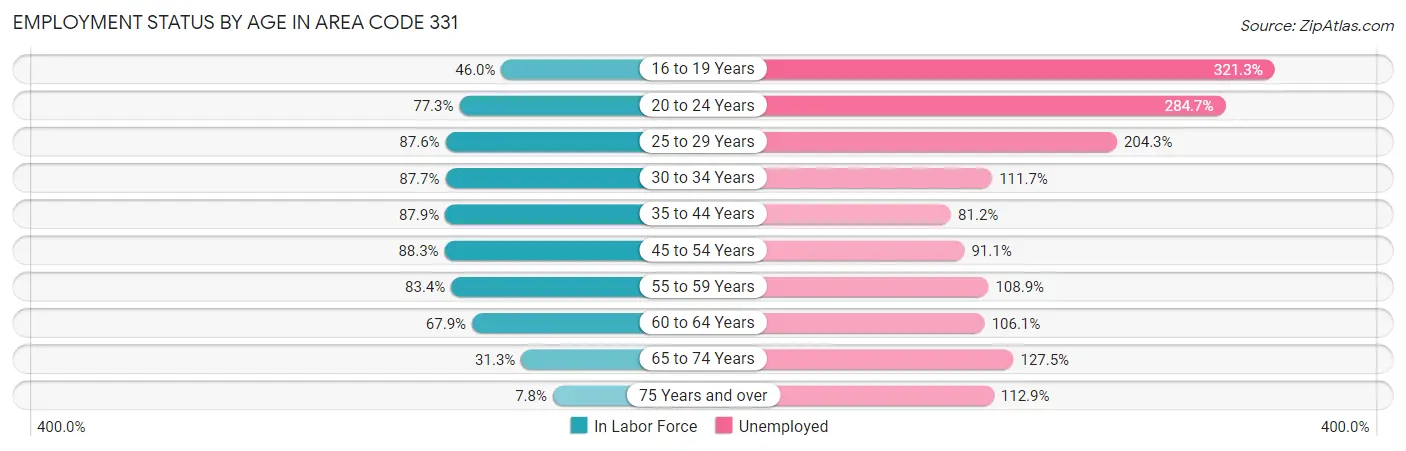
| Age Bracket | In Labor Force | Unemployed |
| 16 to 19 Years | 24,773 (46.0%) | 79,599 (321.3%) |
| 20 to 24 Years | 44,350 (77.3%) | 126,262 (284.7%) |
| 25 to 29 Years | 48,084 (87.6%) | 98,240 (204.3%) |
| 30 to 34 Years | 49,902 (87.7%) | 55,742 (111.7%) |
| 35 to 44 Years | 112,664 (87.9%) | 91,484 (81.2%) |
| 45 to 54 Years | 109,815 (88.3%) | 100,038 (91.1%) |
| 55 to 59 Years | 55,030 (83.4%) | 59,927 (108.9%) |
| 60 to 64 Years | 41,160 (67.9%) | 43,671 (106.1%) |
| 65 to 74 Years | 27,313 (31.3%) | 34,822 (127.5%) |
| 75 Years and over | 4,406 (7.8%) | 4,972 (112.9%) |
| Total | 517,244 (69.4%) | 24,754 (4.8%) |
Employment Status by Educational Attainment in Area Code 331
According to labor force statistics for Area Code 331, 84.8% of individuals (416,626) out of the total population between 25 and 64 years of age (491,073) are in the labor force, with 107.4% or 447,456 of them being unemployed. The group with the highest labor force participation rate are those with the educational attainment of bachelor's degree or higher, with 88.5% or 212,149 individuals in the labor force. Within the labor force, individuals with less than high school education have the highest percentage of unemployment, with 253.2% or 72,592 of them being unemployed.
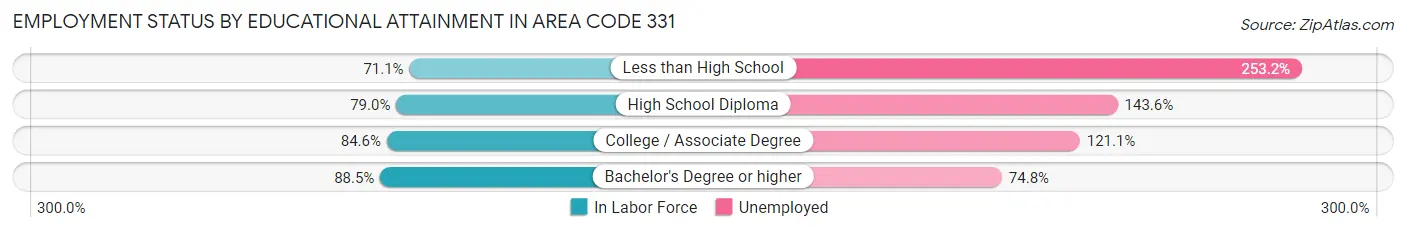
| Educational Attainment | In Labor Force | Unemployed |
| Less than High School | 28,672 (71.1%) | 102,100 (253.2%) |
| High School Diploma | 68,736 (78.9%) | 125,025 (143.6%) |
| College / Associate Degree | 104,828 (84.6%) | 150,093 (121.1%) |
| Bachelor's Degree or higher | 212,139 (88.5%) | 179,328 (74.8%) |
| Total | 416,616 (84.8%) | 527,412 (107.4%) |
Employment Occupations by Sex in Area Code 331
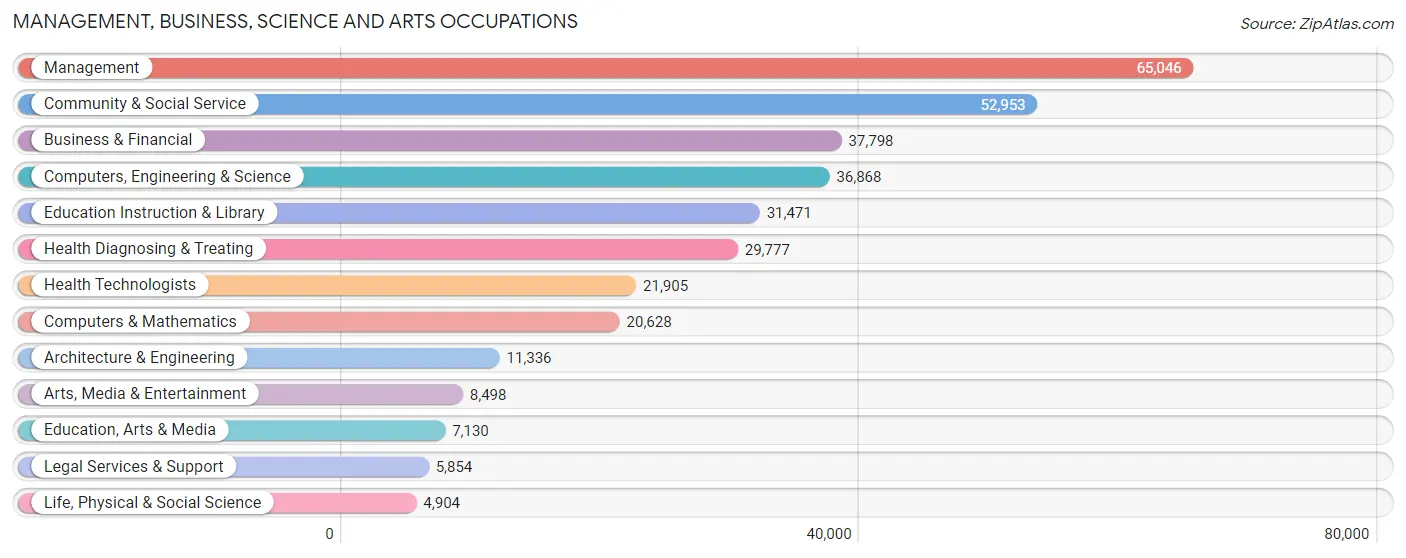
Management, Business, Science and Arts Occupations
The most common Management, Business, Science and Arts occupations in Area Code 331 are Management (65,046 | 13.3%), Community & Social Service (52,953 | 10.8%), Business & Financial (37,798 | 7.7%), Computers, Engineering & Science (36,868 | 7.5%), and Education Instruction & Library (31,471 | 6.4%).
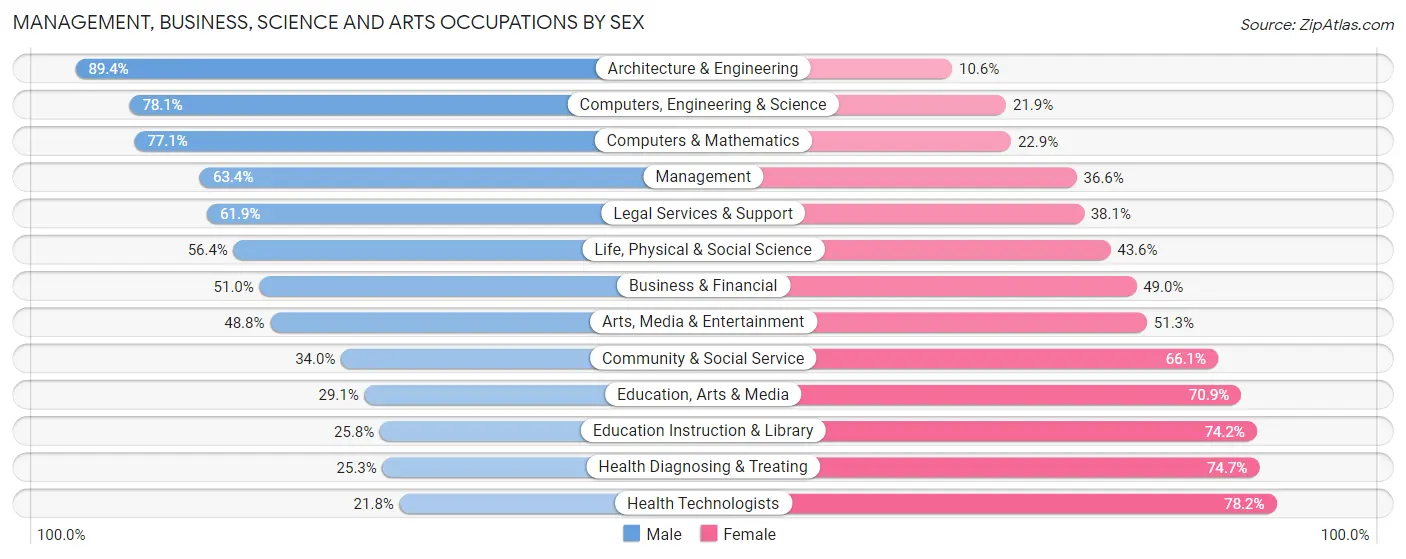
Management, Business, Science and Arts Occupations by Sex
Within the Management, Business, Science and Arts occupations in Area Code 331, the most male-oriented occupations are Architecture & Engineering (89.4%), Computers, Engineering & Science (78.1%), and Computers & Mathematics (77.1%), while the most female-oriented occupations are Health Technologists (78.2%), Health Diagnosing & Treating (74.7%), and Education Instruction & Library (74.2%).
| Occupation | Male | Female |
| Management | 41,241 (63.4%) | 23,805 (36.6%) |
| Business & Financial | 19,265 (51.0%) | 18,533 (49.0%) |
| Computers, Engineering & Science | 28,801 (78.1%) | 8,067 (21.9%) |
| Computers & Mathematics | 15,903 (77.1%) | 4,725 (22.9%) |
| Architecture & Engineering | 10,133 (89.4%) | 1,203 (10.6%) |
| Life, Physical & Social Science | 2,765 (56.4%) | 2,139 (43.6%) |
| Community & Social Service | 17,975 (34.0%) | 34,978 (66.0%) |
| Education, Arts & Media | 2,074 (29.1%) | 5,056 (70.9%) |
| Legal Services & Support | 3,625 (61.9%) | 2,229 (38.1%) |
| Education Instruction & Library | 8,133 (25.8%) | 23,338 (74.2%) |
| Arts, Media & Entertainment | 4,143 (48.7%) | 4,355 (51.2%) |
| Health Diagnosing & Treating | 7,539 (25.3%) | 22,238 (74.7%) |
| Health Technologists | 4,767 (21.8%) | 17,138 (78.2%) |
| Total (Category) | 114,821 (51.6%) | 107,621 (48.4%) |
| Total (Overall) | 264,240 (54.1%) | 224,476 (45.9%) |
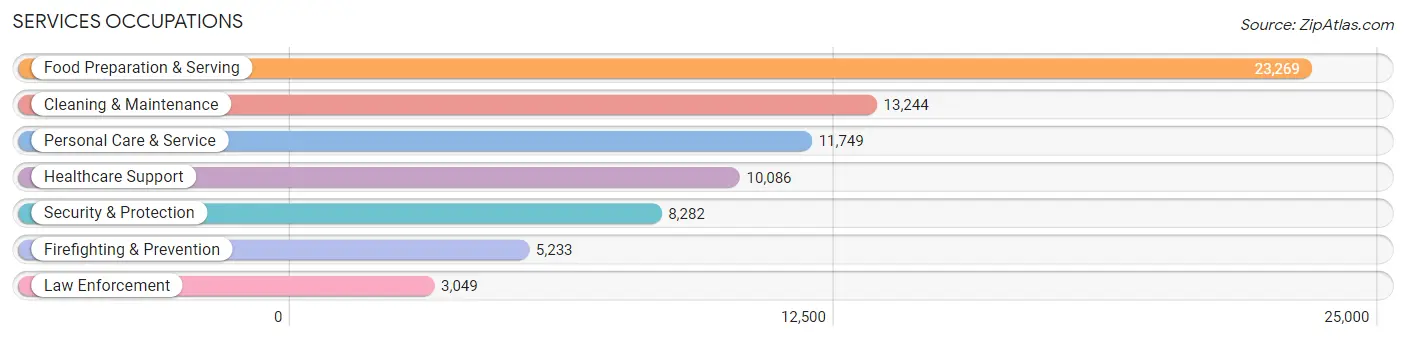
Services Occupations
The most common Services occupations in Area Code 331 are Food Preparation & Serving (23,269 | 4.8%), Cleaning & Maintenance (13,244 | 2.7%), Personal Care & Service (11,749 | 2.4%), Healthcare Support (10,086 | 2.1%), and Security & Protection (8,282 | 1.7%).
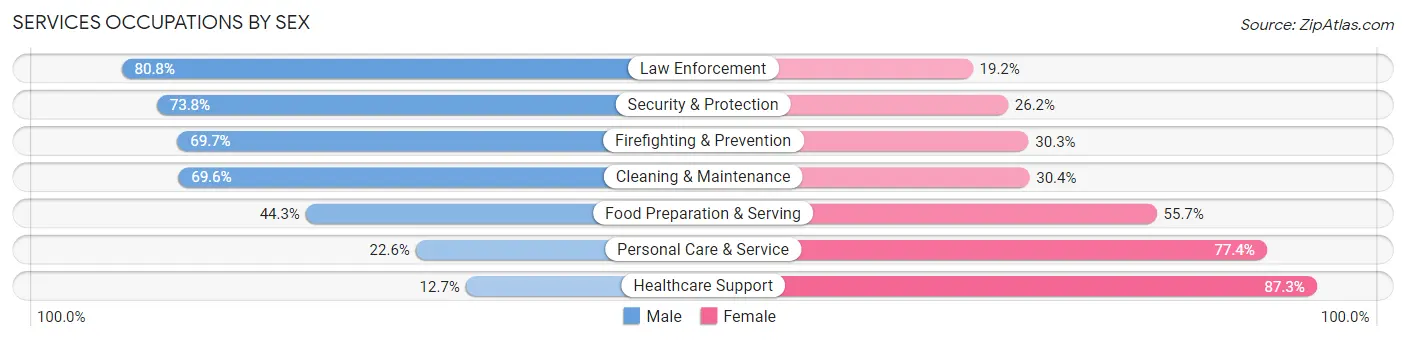
Services Occupations by Sex
Within the Services occupations in Area Code 331, the most male-oriented occupations are Law Enforcement (80.8%), Security & Protection (73.8%), and Firefighting & Prevention (69.7%), while the most female-oriented occupations are Healthcare Support (87.3%), Personal Care & Service (77.4%), and Food Preparation & Serving (55.7%).
| Occupation | Male | Female |
| Healthcare Support | 1,277 (12.7%) | 8,809 (87.3%) |
| Security & Protection | 6,112 (73.8%) | 2,170 (26.2%) |
| Firefighting & Prevention | 3,649 (69.7%) | 1,584 (30.3%) |
| Law Enforcement | 2,463 (80.8%) | 586 (19.2%) |
| Food Preparation & Serving | 10,318 (44.3%) | 12,951 (55.7%) |
| Cleaning & Maintenance | 9,212 (69.6%) | 4,032 (30.4%) |
| Personal Care & Service | 2,650 (22.6%) | 9,099 (77.4%) |
| Total (Category) | 29,569 (44.4%) | 37,061 (55.6%) |
| Total (Overall) | 264,240 (54.1%) | 224,476 (45.9%) |
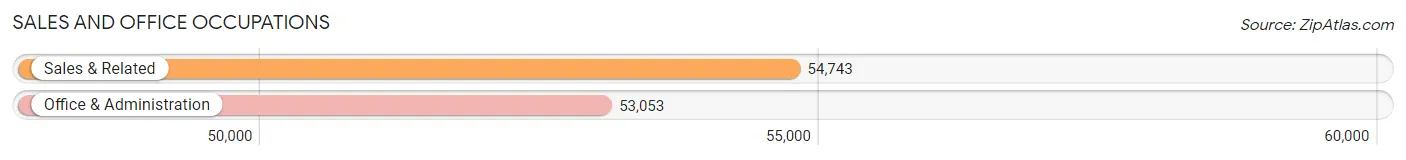
Sales and Office Occupations
The most common Sales and Office occupations in Area Code 331 are Sales & Related (54,743 | 11.2%), and Office & Administration (53,053 | 10.9%).
Sales and Office Occupations by Sex
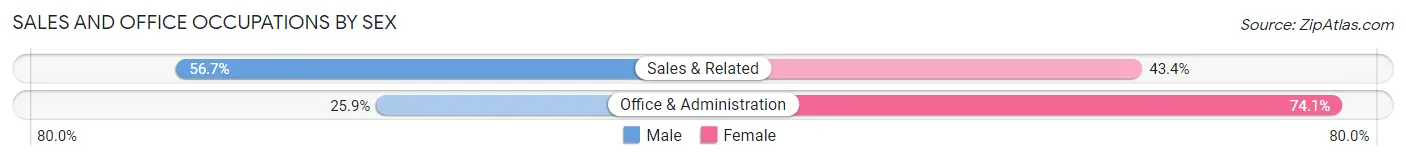
| Occupation | Male | Female |
| Sales & Related | 31,013 (56.7%) | 23,730 (43.3%) |
| Office & Administration | 13,748 (25.9%) | 39,305 (74.1%) |
| Total (Category) | 44,761 (41.5%) | 63,035 (58.5%) |
| Total (Overall) | 264,240 (54.1%) | 224,476 (45.9%) |
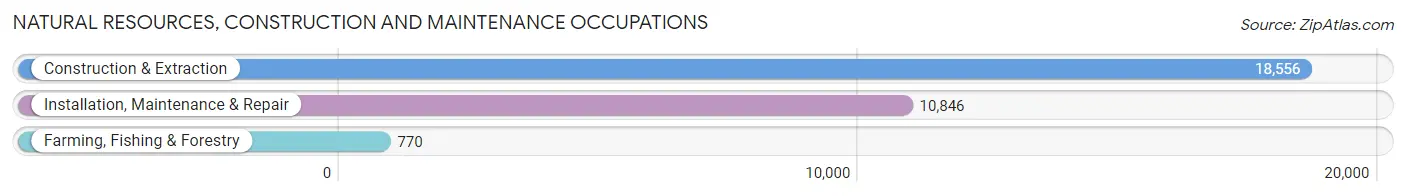
Natural Resources, Construction and Maintenance Occupations
The most common Natural Resources, Construction and Maintenance occupations in Area Code 331 are Construction & Extraction (18,556 | 3.8%), Installation, Maintenance & Repair (10,846 | 2.2%), and Farming, Fishing & Forestry (770 | 0.2%).
Natural Resources, Construction and Maintenance Occupations by Sex
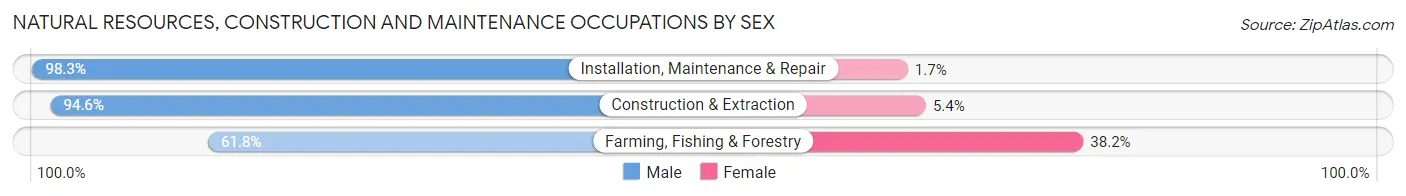
| Occupation | Male | Female |
| Farming, Fishing & Forestry | 476 (61.8%) | 294 (38.2%) |
| Construction & Extraction | 17,550 (94.6%) | 1,006 (5.4%) |
| Installation, Maintenance & Repair | 10,666 (98.3%) | 180 (1.7%) |
| Total (Category) | 28,692 (95.1%) | 1,480 (4.9%) |
| Total (Overall) | 264,240 (54.1%) | 224,476 (45.9%) |
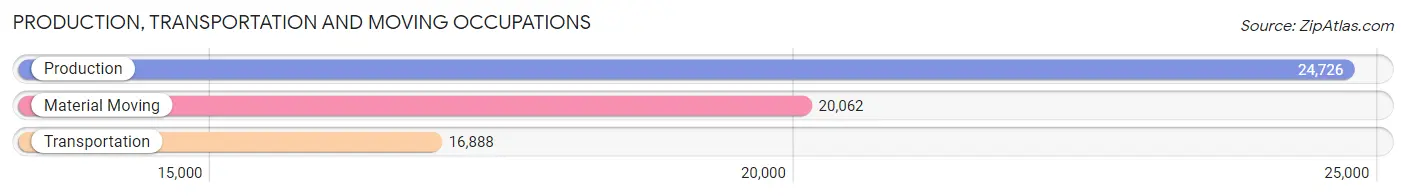
Production, Transportation and Moving Occupations
The most common Production, Transportation and Moving occupations in Area Code 331 are Production (24,726 | 5.1%), Material Moving (20,062 | 4.1%), and Transportation (16,888 | 3.5%).
Production, Transportation and Moving Occupations by Sex
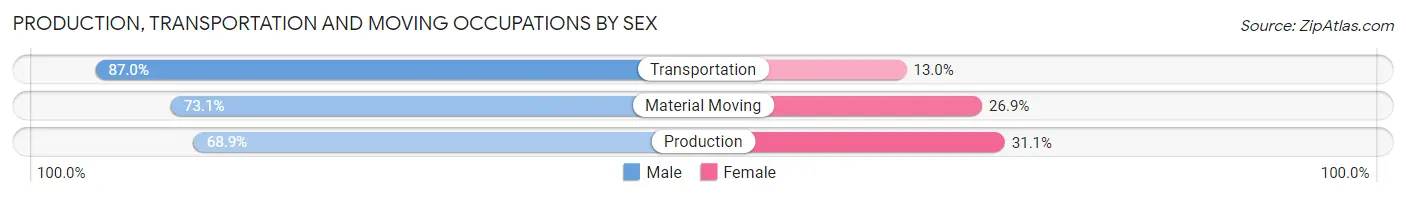
| Occupation | Male | Female |
| Production | 17,044 (68.9%) | 7,682 (31.1%) |
| Transportation | 14,687 (87.0%) | 2,201 (13.0%) |
| Material Moving | 14,666 (73.1%) | 5,396 (26.9%) |
| Total (Category) | 46,397 (75.2%) | 15,279 (24.8%) |
| Total (Overall) | 264,240 (54.1%) | 224,476 (45.9%) |
Employment Industries by Sex in Area Code 331
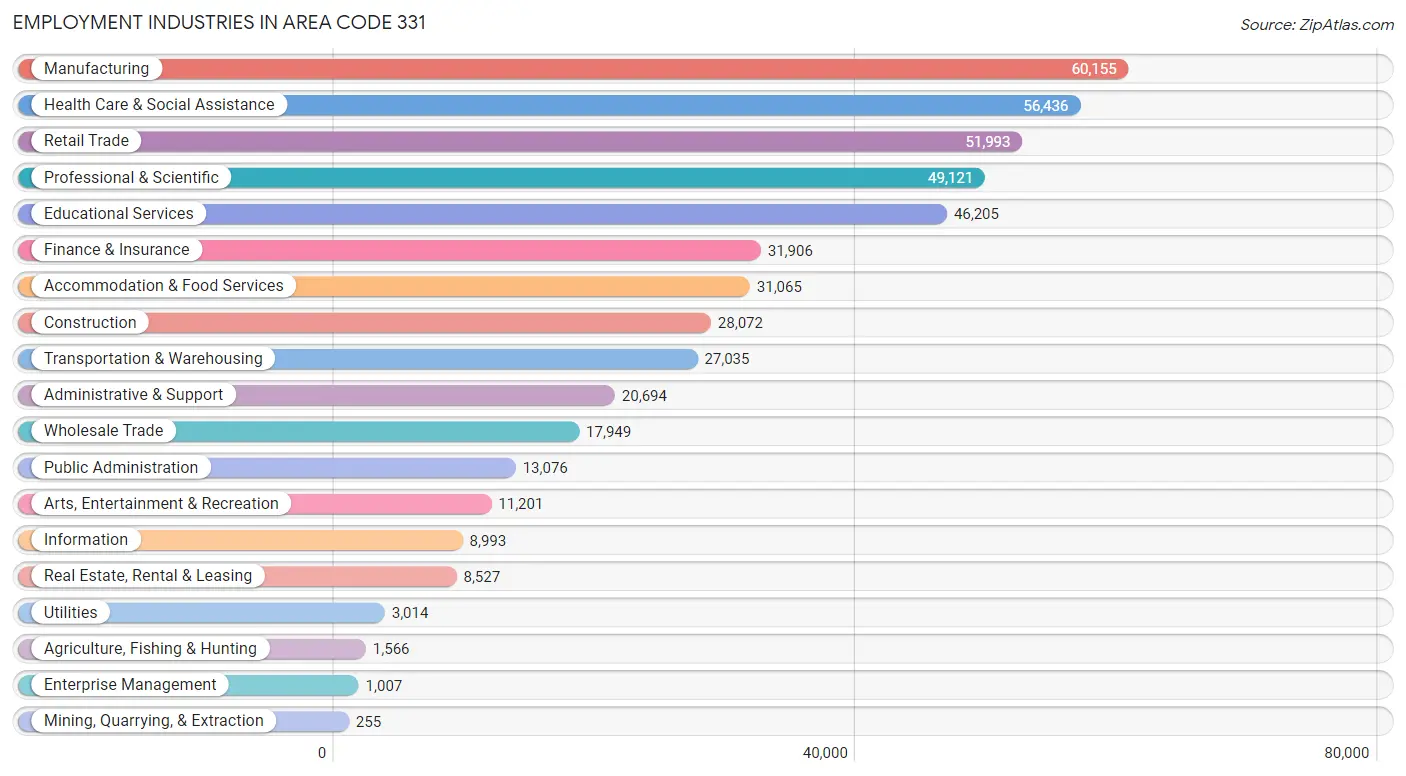
Employment Industries in Area Code 331
The major employment industries in Area Code 331 include Manufacturing (60,155 | 12.3%), Health Care & Social Assistance (56,436 | 11.6%), Retail Trade (51,993 | 10.6%), Professional & Scientific (49,121 | 10.1%), and Educational Services (46,205 | 9.5%).
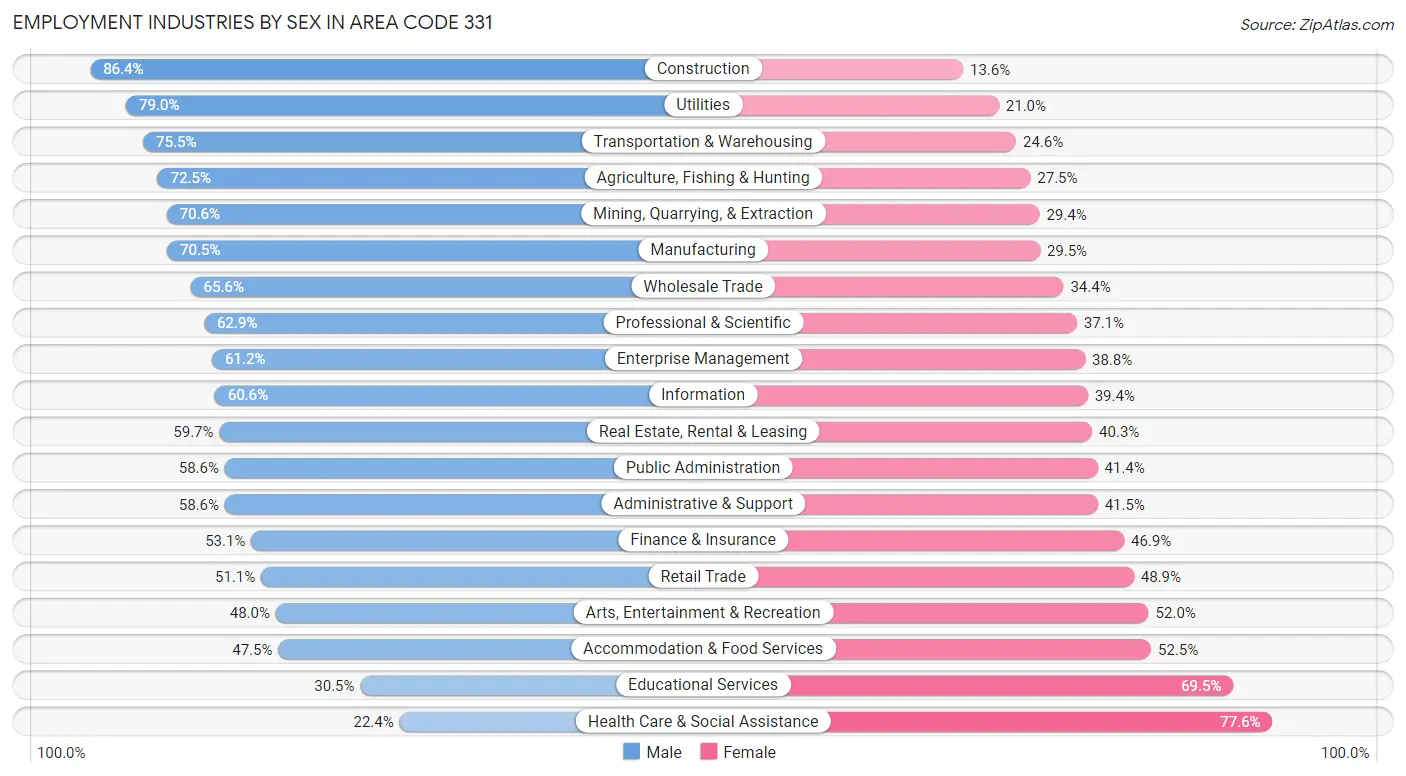
Employment Industries by Sex in Area Code 331
The Area Code 331 industries that see more men than women are Construction (86.4%), Utilities (79.0%), and Transportation & Warehousing (75.4%), whereas the industries that tend to have a higher number of women are Health Care & Social Assistance (77.6%), Educational Services (69.5%), and Accommodation & Food Services (52.5%).
| Industry | Male | Female |
| Agriculture, Fishing & Hunting | 1,135 (72.5%) | 431 (27.5%) |
| Mining, Quarrying, & Extraction | 180 (70.6%) | 75 (29.4%) |
| Construction | 24,261 (86.4%) | 3,811 (13.6%) |
| Manufacturing | 42,408 (70.5%) | 17,747 (29.5%) |
| Wholesale Trade | 11,780 (65.6%) | 6,169 (34.4%) |
| Retail Trade | 26,548 (51.1%) | 25,445 (48.9%) |
| Transportation & Warehousing | 20,398 (75.4%) | 6,637 (24.5%) |
| Utilities | 2,381 (79.0%) | 633 (21.0%) |
| Information | 5,452 (60.6%) | 3,541 (39.4%) |
| Finance & Insurance | 16,941 (53.1%) | 14,965 (46.9%) |
| Real Estate, Rental & Leasing | 5,090 (59.7%) | 3,437 (40.3%) |
| Professional & Scientific | 30,877 (62.9%) | 18,244 (37.1%) |
| Enterprise Management | 616 (61.2%) | 391 (38.8%) |
| Administrative & Support | 12,117 (58.6%) | 8,577 (41.4%) |
| Educational Services | 14,093 (30.5%) | 32,112 (69.5%) |
| Health Care & Social Assistance | 12,634 (22.4%) | 43,802 (77.6%) |
| Arts, Entertainment & Recreation | 5,376 (48.0%) | 5,825 (52.0%) |
| Accommodation & Food Services | 14,752 (47.5%) | 16,313 (52.5%) |
| Public Administration | 7,659 (58.6%) | 5,417 (41.4%) |
| Total | 264,240 (54.1%) | 224,476 (45.9%) |
Education in Area Code 331
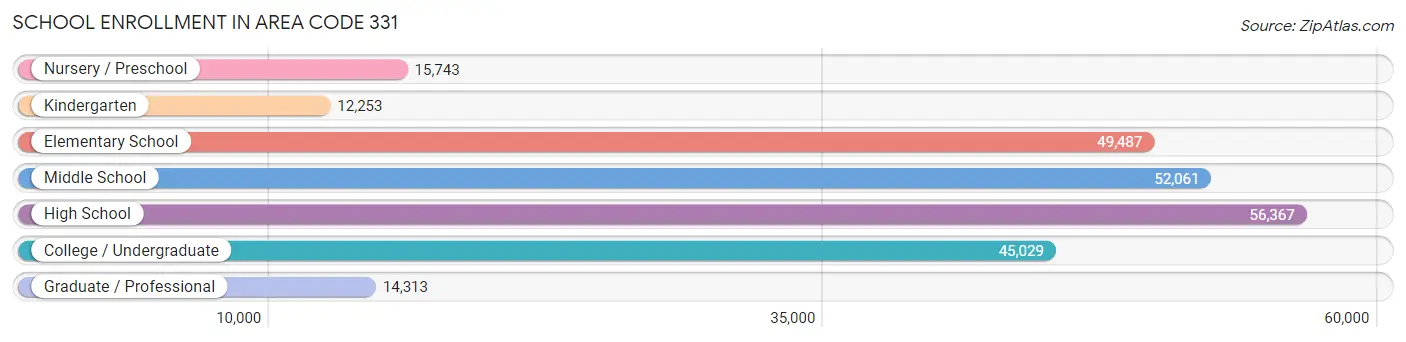
School Enrollment in Area Code 331
The most common levels of schooling among the 245,253 students in Area Code 331 are high school (56,367 | 23.0%), middle school (52,061 | 21.2%), and elementary school (49,487 | 20.2%).
| School Level | # Students | % Students |
| Nursery / Preschool | 15,743 | 6.4% |
| Kindergarten | 12,253 | 5.0% |
| Elementary School | 49,487 | 20.2% |
| Middle School | 52,061 | 21.2% |
| High School | 56,367 | 23.0% |
| College / Undergraduate | 45,029 | 18.4% |
| Graduate / Professional | 14,313 | 5.8% |
| Total | 245,253 | 100.0% |
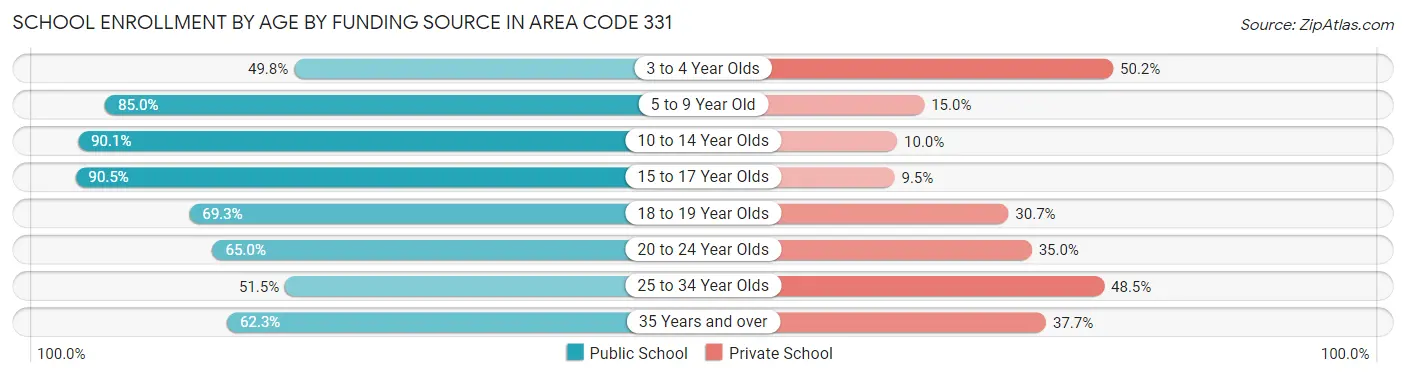
School Enrollment by Age by Funding Source in Area Code 331
Out of a total of 245,253 students who are enrolled in schools in Area Code 331, 49,526 (20.2%) attend a private institution, while the remaining 195,727 (79.8%) are enrolled in public schools. The age group of 3 to 4 year olds has the highest likelihood of being enrolled in private schools, with 5,732 (50.2% in the age bracket) enrolled. Conversely, the age group of 15 to 17 year olds has the lowest likelihood of being enrolled in a private school, with 38,321 (90.5% in the age bracket) attending a public institution.
| Age Bracket | Public School | Private School |
| 3 to 4 Year Olds | 5,688 (49.8%) | 5,732 (50.2%) |
| 5 to 9 Year Old | 50,906 (85.0%) | 8,989 (15.0%) |
| 10 to 14 Year Olds | 58,402 (90.0%) | 6,451 (10.0%) |
| 15 to 17 Year Olds | 38,321 (90.5%) | 4,010 (9.5%) |
| 18 to 19 Year Olds | 13,382 (69.3%) | 5,923 (30.7%) |
| 20 to 24 Year Olds | 16,677 (65.0%) | 8,988 (35.0%) |
| 25 to 34 Year Olds | 5,793 (51.5%) | 5,457 (48.5%) |
| 35 Years and over | 6,563 (62.3%) | 3,971 (37.7%) |
| Total | 195,727 (79.8%) | 49,526 (20.2%) |
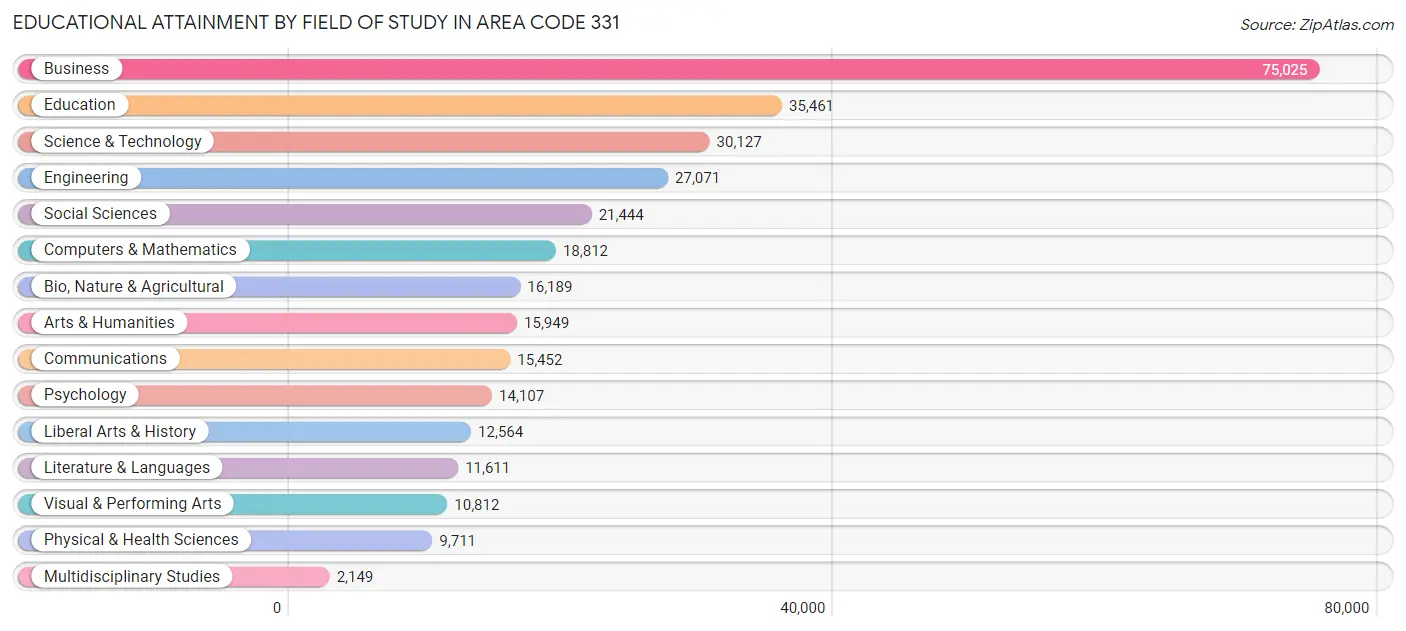
Educational Attainment by Field of Study in Area Code 331
Business (75,025 | 23.7%), education (35,461 | 11.2%), science & technology (30,127 | 9.5%), engineering (27,071 | 8.6%), and social sciences (21,444 | 6.8%) are the most common fields of study among 316,484 individuals in Area Code 331 who have obtained a bachelor's degree or higher.
| Field of Study | # Graduates | % Graduates |
| Computers & Mathematics | 18,812 | 5.9% |
| Bio, Nature & Agricultural | 16,189 | 5.1% |
| Physical & Health Sciences | 9,711 | 3.1% |
| Psychology | 14,107 | 4.5% |
| Social Sciences | 21,444 | 6.8% |
| Engineering | 27,071 | 8.6% |
| Multidisciplinary Studies | 2,149 | 0.7% |
| Science & Technology | 30,127 | 9.5% |
| Business | 75,025 | 23.7% |
| Education | 35,461 | 11.2% |
| Literature & Languages | 11,611 | 3.7% |
| Liberal Arts & History | 12,564 | 4.0% |
| Visual & Performing Arts | 10,812 | 3.4% |
| Communications | 15,452 | 4.9% |
| Arts & Humanities | 15,949 | 5.0% |
| Total | 316,484 | 100.0% |
Transportation & Commute in Area Code 331
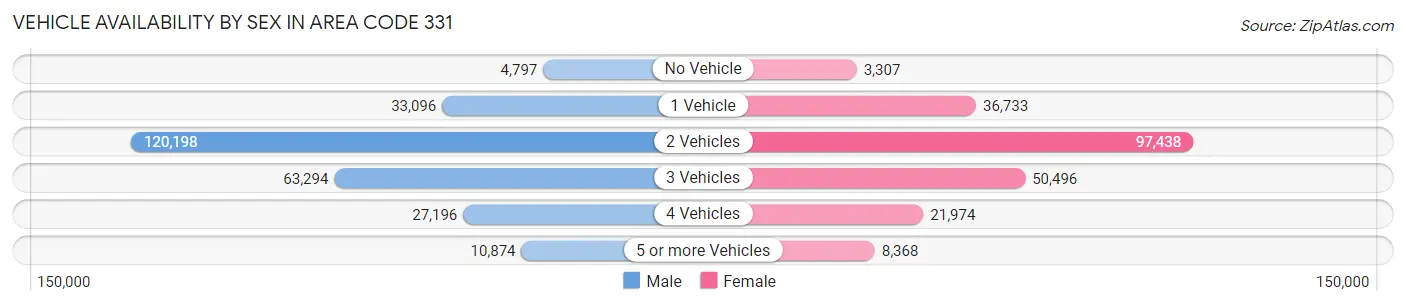
Vehicle Availability by Sex in Area Code 331
The most prevalent vehicle ownership categories in Area Code 331 are males with 2 vehicles (120,198, accounting for 46.3%) and females with 2 vehicles (97,438, making up 55.1%).
| Vehicles Available | Male | Female |
| No Vehicle | 4,797 (1.8%) | 3,307 (1.5%) |
| 1 Vehicle | 33,096 (12.8%) | 36,733 (16.8%) |
| 2 Vehicles | 120,198 (46.3%) | 97,438 (44.6%) |
| 3 Vehicles | 63,294 (24.4%) | 50,496 (23.1%) |
| 4 Vehicles | 27,196 (10.5%) | 21,974 (10.1%) |
| 5 or more Vehicles | 10,874 (4.2%) | 8,368 (3.8%) |
| Total | 259,455 (100.0%) | 218,316 (100.0%) |
Commute Time in Area Code 331
The most frequently occuring commute durations in Area Code 331 are 15 to 19 minutes (56,686 commuters, 13.9%), 30 to 34 minutes (55,377 commuters, 13.6%), and 20 to 24 minutes (52,528 commuters, 12.9%).
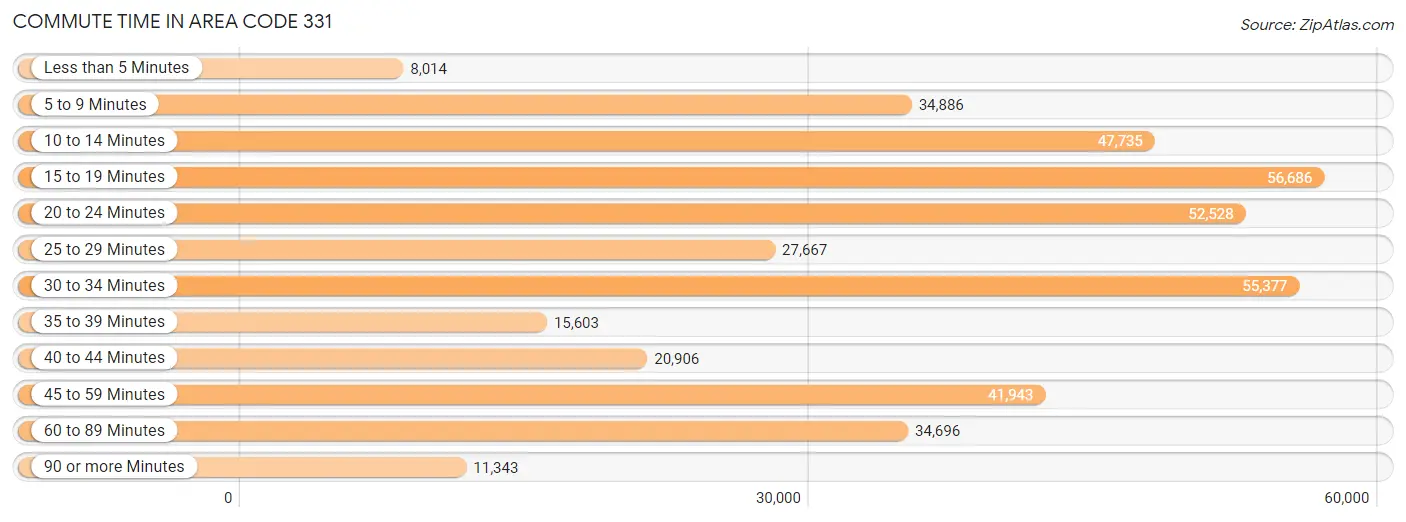
| Commute Time | # Commuters | % Commuters |
| Less than 5 Minutes | 8,014 | 2.0% |
| 5 to 9 Minutes | 34,886 | 8.6% |
| 10 to 14 Minutes | 47,735 | 11.7% |
| 15 to 19 Minutes | 56,686 | 13.9% |
| 20 to 24 Minutes | 52,528 | 12.9% |
| 25 to 29 Minutes | 27,667 | 6.8% |
| 30 to 34 Minutes | 55,377 | 13.6% |
| 35 to 39 Minutes | 15,603 | 3.8% |
| 40 to 44 Minutes | 20,906 | 5.1% |
| 45 to 59 Minutes | 41,943 | 10.3% |
| 60 to 89 Minutes | 34,696 | 8.5% |
| 90 or more Minutes | 11,343 | 2.8% |
Commute Time by Sex in Area Code 331
The most common commute times in Area Code 331 are 30 to 34 minutes (31,403 commuters, 14.1%) for males and 15 to 19 minutes (27,346 commuters, 14.9%) for females.
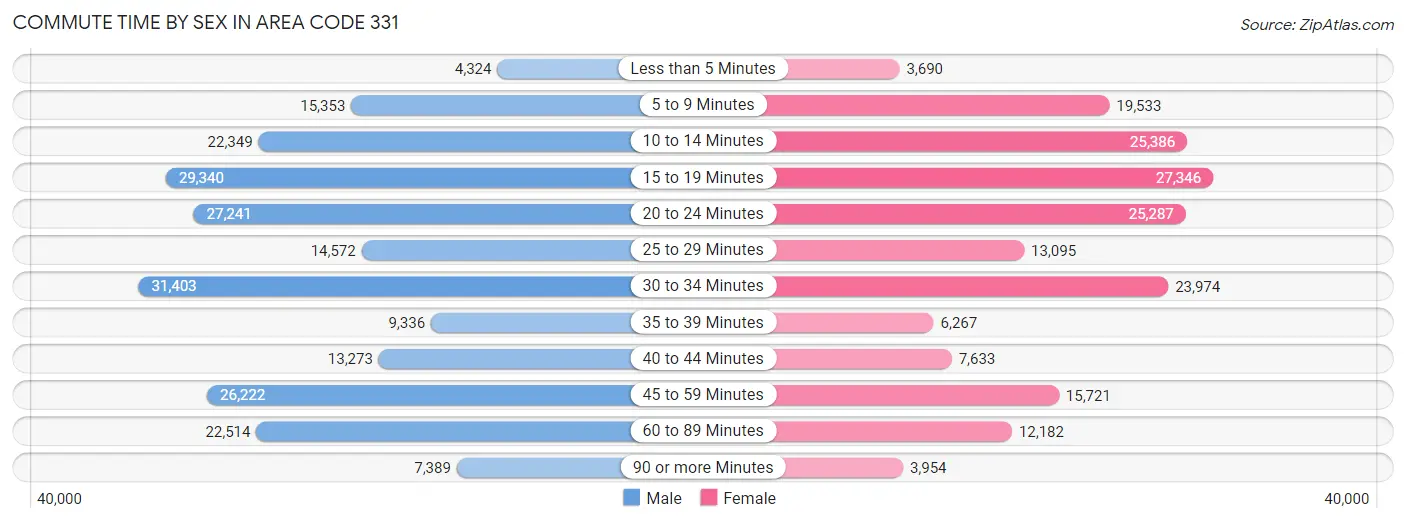
| Commute Time | Male | Female |
| Less than 5 Minutes | 4,324 (1.9%) | 3,690 (2.0%) |
| 5 to 9 Minutes | 15,353 (6.9%) | 19,533 (10.6%) |
| 10 to 14 Minutes | 22,349 (10.0%) | 25,386 (13.8%) |
| 15 to 19 Minutes | 29,340 (13.1%) | 27,346 (14.9%) |
| 20 to 24 Minutes | 27,241 (12.2%) | 25,287 (13.7%) |
| 25 to 29 Minutes | 14,572 (6.5%) | 13,095 (7.1%) |
| 30 to 34 Minutes | 31,403 (14.1%) | 23,974 (13.0%) |
| 35 to 39 Minutes | 9,336 (4.2%) | 6,267 (3.4%) |
| 40 to 44 Minutes | 13,273 (5.9%) | 7,633 (4.2%) |
| 45 to 59 Minutes | 26,222 (11.7%) | 15,721 (8.5%) |
| 60 to 89 Minutes | 22,514 (10.1%) | 12,182 (6.6%) |
| 90 or more Minutes | 7,389 (3.3%) | 3,954 (2.1%) |
Time of Departure to Work by Sex in Area Code 331
The most frequent times of departure to work in Area Code 331 are 7:00 AM to 7:29 AM (33,480, 15.0%) for males and 7:00 AM to 7:29 AM (30,071, 16.3%) for females.
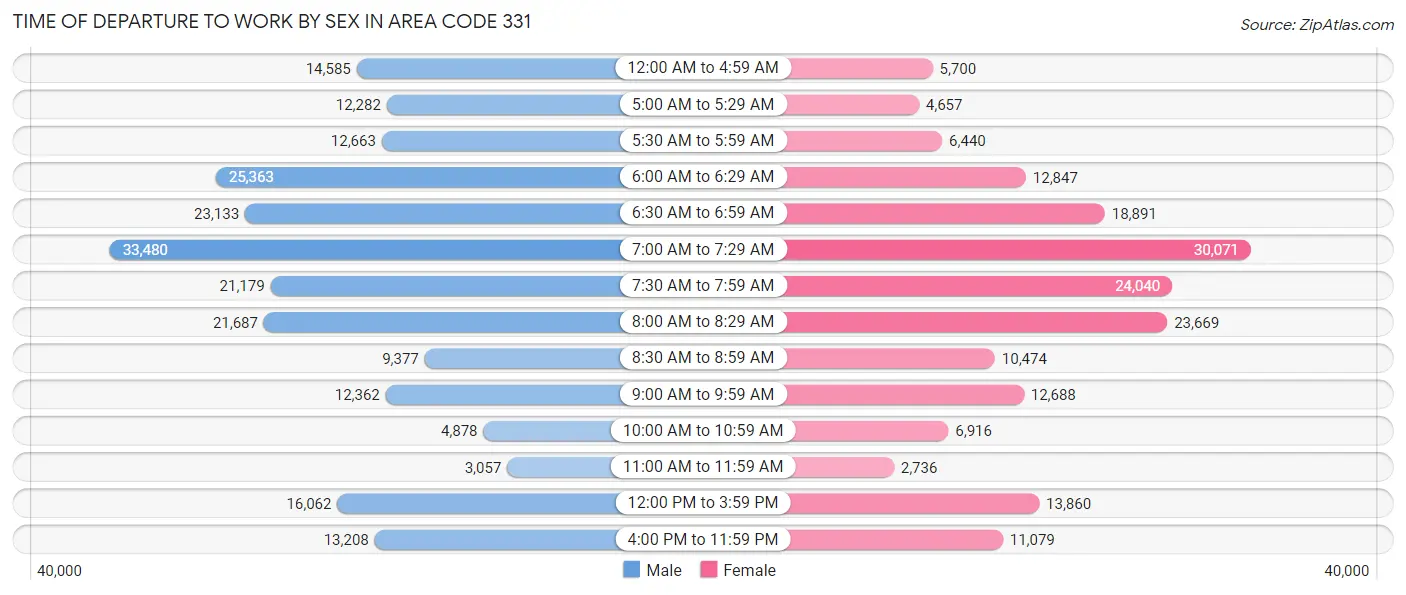
| Time of Departure | Male | Female |
| 12:00 AM to 4:59 AM | 14,585 (6.5%) | 5,700 (3.1%) |
| 5:00 AM to 5:29 AM | 12,282 (5.5%) | 4,657 (2.5%) |
| 5:30 AM to 5:59 AM | 12,663 (5.7%) | 6,440 (3.5%) |
| 6:00 AM to 6:29 AM | 25,363 (11.4%) | 12,847 (7.0%) |
| 6:30 AM to 6:59 AM | 23,133 (10.4%) | 18,891 (10.3%) |
| 7:00 AM to 7:29 AM | 33,480 (15.0%) | 30,071 (16.3%) |
| 7:30 AM to 7:59 AM | 21,179 (9.5%) | 24,040 (13.1%) |
| 8:00 AM to 8:29 AM | 21,687 (9.7%) | 23,669 (12.9%) |
| 8:30 AM to 8:59 AM | 9,377 (4.2%) | 10,474 (5.7%) |
| 9:00 AM to 9:59 AM | 12,362 (5.5%) | 12,688 (6.9%) |
| 10:00 AM to 10:59 AM | 4,878 (2.2%) | 6,916 (3.8%) |
| 11:00 AM to 11:59 AM | 3,057 (1.4%) | 2,736 (1.5%) |
| 12:00 PM to 3:59 PM | 16,062 (7.2%) | 13,860 (7.5%) |
| 4:00 PM to 11:59 PM | 13,208 (5.9%) | 11,079 (6.0%) |
| Total | 223,316 (100.0%) | 184,068 (100.0%) |
Housing Occupancy in Area Code 331
Occupancy by Ownership in Area Code 331
Of the total 336,569 dwellings in Area Code 331, owner-occupied units account for 257,401 (76.5%), while renter-occupied units make up 79,168 (23.5%).
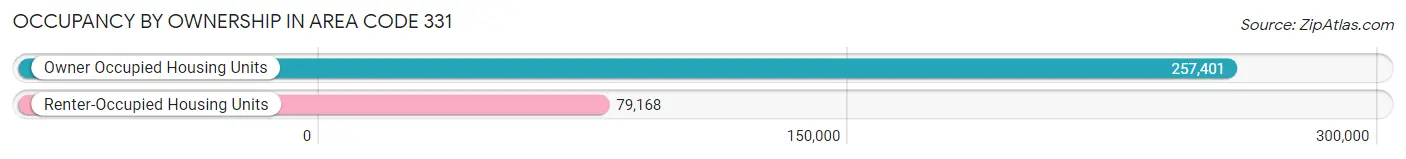
| Occupancy | # Housing Units | % Housing Units |
| Owner Occupied Housing Units | 257,401 | 76.5% |
| Renter-Occupied Housing Units | 79,168 | 23.5% |
| Total Occupied Housing Units | 336,569 | 100.0% |
Occupancy by Household Size in Area Code 331
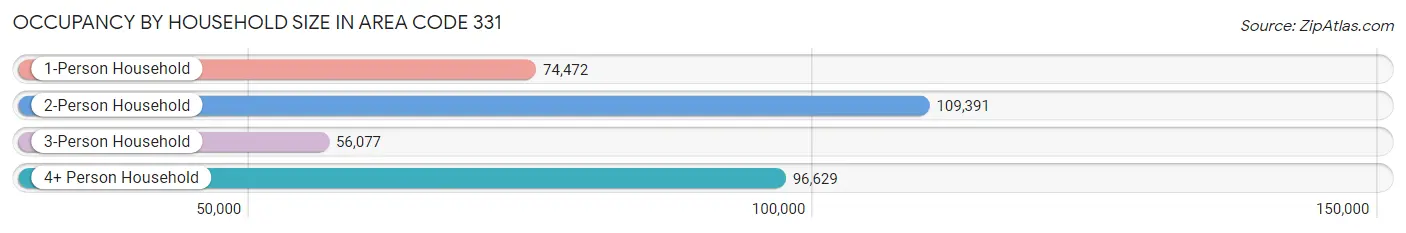
| Household Size | # Housing Units | % Housing Units |
| 1-Person Household | 74,472 | 22.1% |
| 2-Person Household | 109,391 | 32.5% |
| 3-Person Household | 56,077 | 16.7% |
| 4+ Person Household | 96,629 | 28.7% |
| Total Housing Units | 336,569 | 100.0% |
Occupancy by Ownership by Household Size in Area Code 331
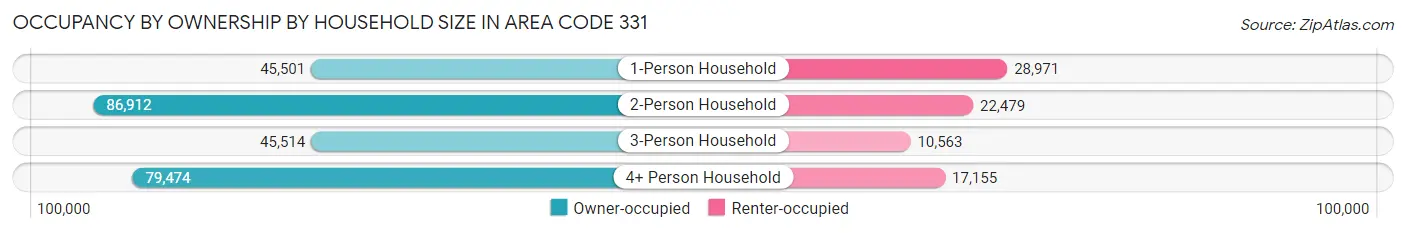
| Household Size | Owner-occupied | Renter-occupied |
| 1-Person Household | 45,501 (61.1%) | 28,971 (38.9%) |
| 2-Person Household | 86,912 (79.4%) | 22,479 (20.5%) |
| 3-Person Household | 45,514 (81.2%) | 10,563 (18.8%) |
| 4+ Person Household | 79,474 (82.3%) | 17,155 (17.7%) |
| Total Housing Units | 257,401 (76.5%) | 79,168 (23.5%) |
Occupancy by Educational Attainment in Area Code 331
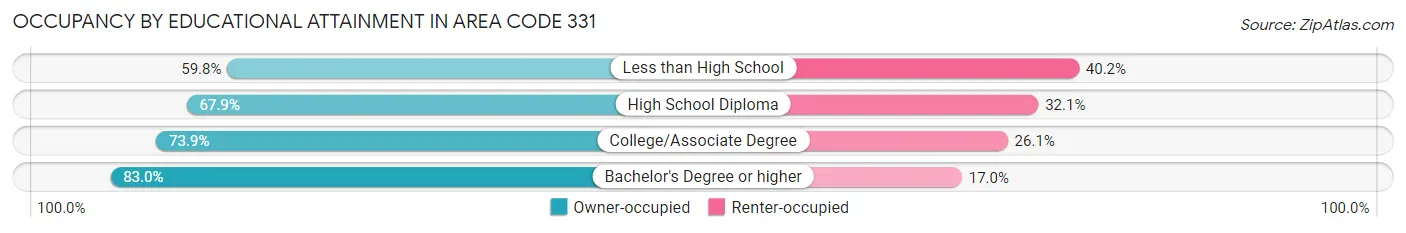
| Household Size | Owner-occupied | Renter-occupied |
| Less than High School | 13,069 (59.8%) | 8,780 (40.2%) |
| High School Diploma | 38,998 (67.9%) | 18,462 (32.1%) |
| College/Associate Degree | 67,099 (73.9%) | 23,659 (26.1%) |
| Bachelor's Degree or higher | 138,235 (83.0%) | 28,267 (17.0%) |
Occupancy by Age of Householder in Area Code 331
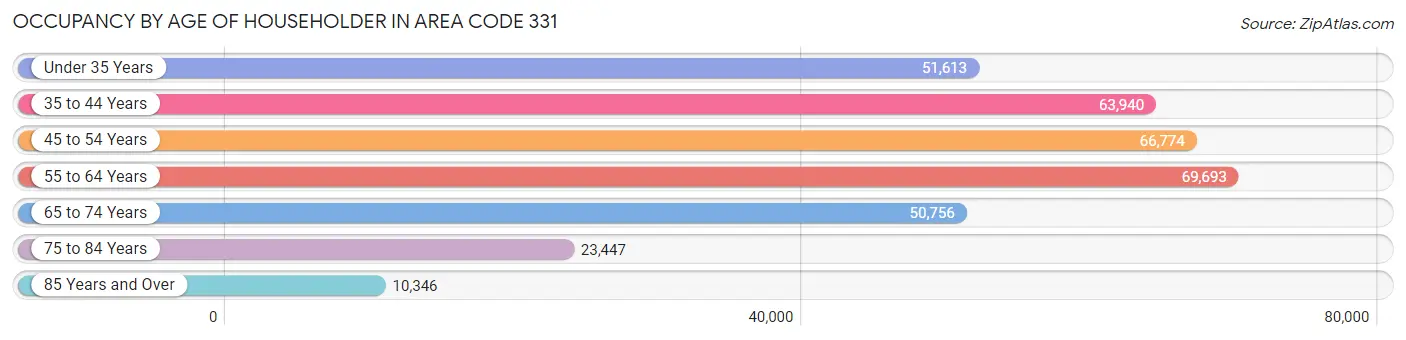
| Age Bracket | # Households | % Households |
| Under 35 Years | 51,613 | 15.3% |
| 35 to 44 Years | 63,940 | 19.0% |
| 45 to 54 Years | 66,774 | 19.8% |
| 55 to 64 Years | 69,693 | 20.7% |
| 65 to 74 Years | 50,756 | 15.1% |
| 75 to 84 Years | 23,447 | 7.0% |
| 85 Years and Over | 10,346 | 3.1% |
| Total | 336,569 | 100.0% |
Housing Finances in Area Code 331
Median Income by Occupancy in Area Code 331
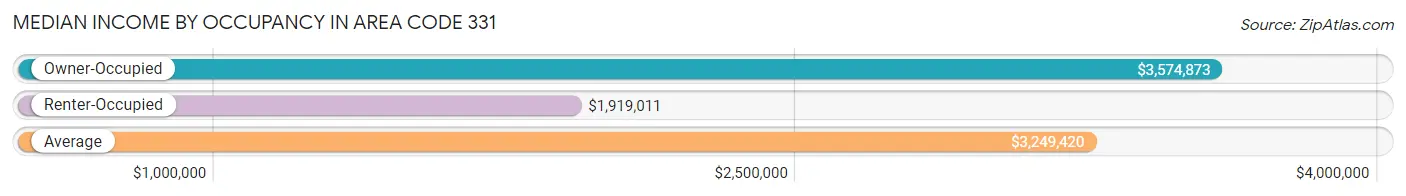
| Occupancy Type | # Households | Median Income |
| Owner-Occupied | 257,401 (76.5%) | $3,574,873 |
| Renter-Occupied | 79,168 (23.5%) | $1,919,011 |
| Average | 336,569 (100.0%) | $3,249,420 |
Occupancy by Householder Income Bracket in Area Code 331
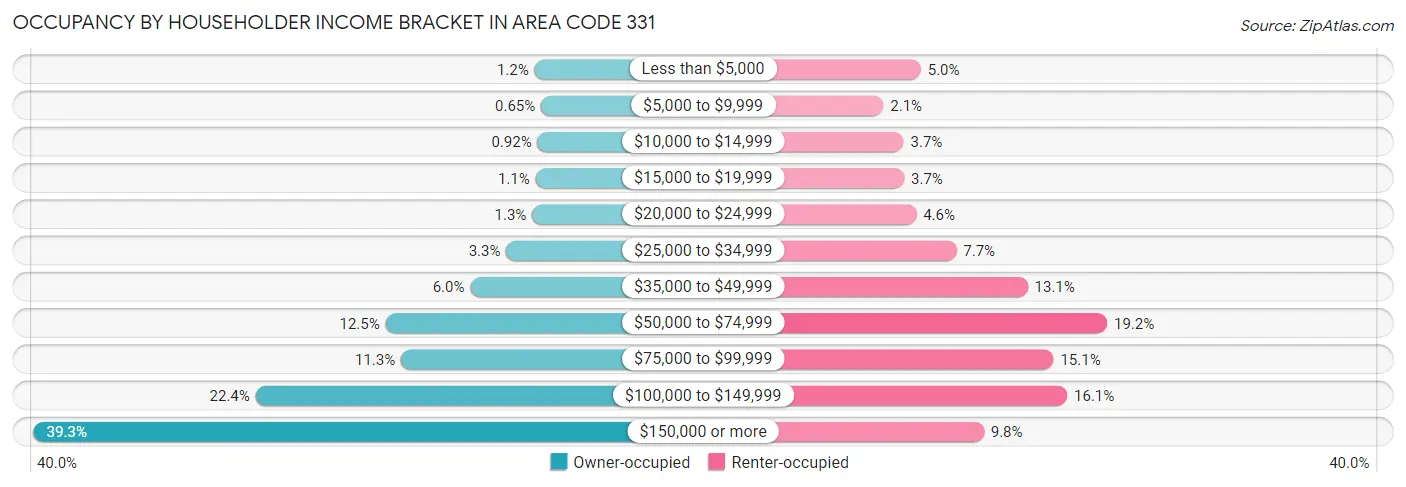
| Income Bracket | Owner-occupied | Renter-occupied |
| Less than $5,000 | 2,965 (1.1%) | 3,935 (5.0%) |
| $5,000 to $9,999 | 1,666 (0.6%) | 1,679 (2.1%) |
| $10,000 to $14,999 | 2,370 (0.9%) | 2,900 (3.7%) |
| $15,000 to $19,999 | 2,761 (1.1%) | 2,933 (3.7%) |
| $20,000 to $24,999 | 3,429 (1.3%) | 3,657 (4.6%) |
| $25,000 to $34,999 | 8,506 (3.3%) | 6,080 (7.7%) |
| $35,000 to $49,999 | 15,553 (6.0%) | 10,380 (13.1%) |
| $50,000 to $74,999 | 32,184 (12.5%) | 15,166 (19.2%) |
| $75,000 to $99,999 | 29,125 (11.3%) | 11,942 (15.1%) |
| $100,000 to $149,999 | 57,663 (22.4%) | 12,760 (16.1%) |
| $150,000 or more | 101,179 (39.3%) | 7,736 (9.8%) |
| Total | 257,401 (100.0%) | 79,168 (100.0%) |
Monthly Housing Cost Tiers in Area Code 331
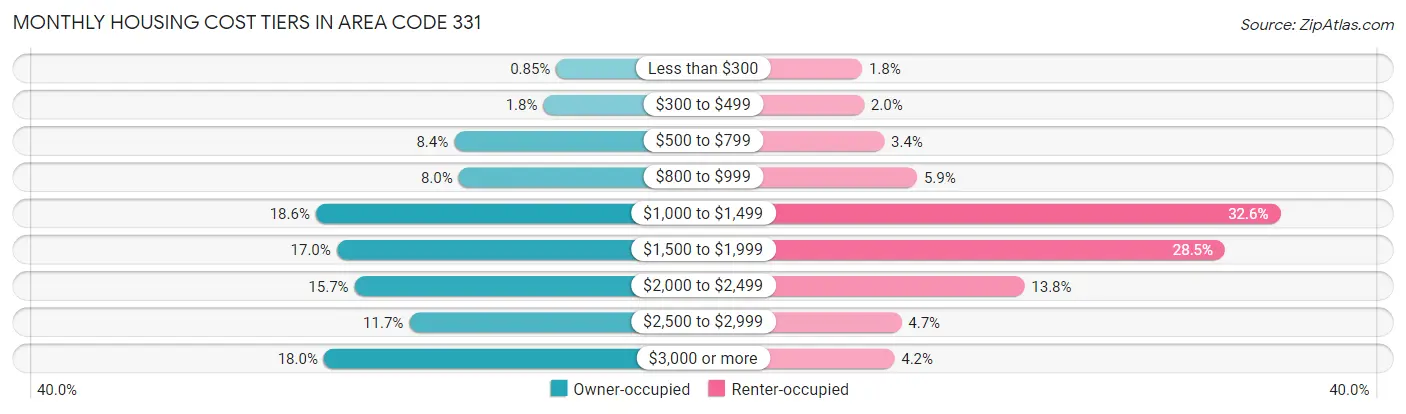
| Monthly Cost | Owner-occupied | Renter-occupied |
| Less than $300 | 2,183 (0.9%) | 1,429 (1.8%) |
| $300 to $499 | 4,637 (1.8%) | 1,545 (1.9%) |
| $500 to $799 | 21,547 (8.4%) | 2,721 (3.4%) |
| $800 to $999 | 20,699 (8.0%) | 4,642 (5.9%) |
| $1,000 to $1,499 | 47,772 (18.6%) | 25,815 (32.6%) |
| $1,500 to $1,999 | 43,812 (17.0%) | 22,585 (28.5%) |
| $2,000 to $2,499 | 40,444 (15.7%) | 10,904 (13.8%) |
| $2,500 to $2,999 | 30,058 (11.7%) | 3,730 (4.7%) |
| $3,000 or more | 46,249 (18.0%) | 3,316 (4.2%) |
| Total | 257,401 (100.0%) | 79,168 (100.0%) |
Physical Housing Characteristics in Area Code 331
Housing Structures in Area Code 331
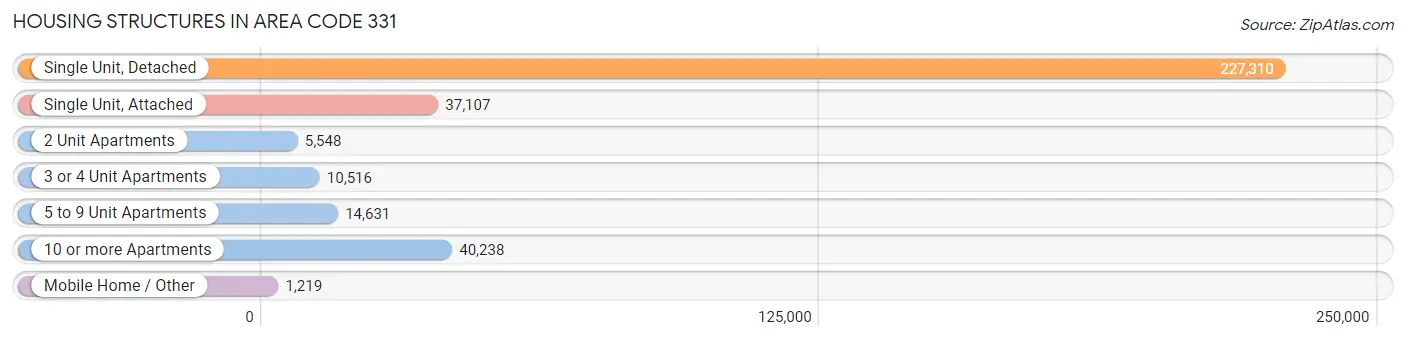
| Structure Type | # Housing Units | % Housing Units |
| Single Unit, Detached | 227,310 | 67.5% |
| Single Unit, Attached | 37,107 | 11.0% |
| 2 Unit Apartments | 5,548 | 1.7% |
| 3 or 4 Unit Apartments | 10,516 | 3.1% |
| 5 to 9 Unit Apartments | 14,631 | 4.3% |
| 10 or more Apartments | 40,238 | 12.0% |
| Mobile Home / Other | 1,219 | 0.4% |
| Total | 336,569 | 100.0% |
Housing Structures by Occupancy in Area Code 331
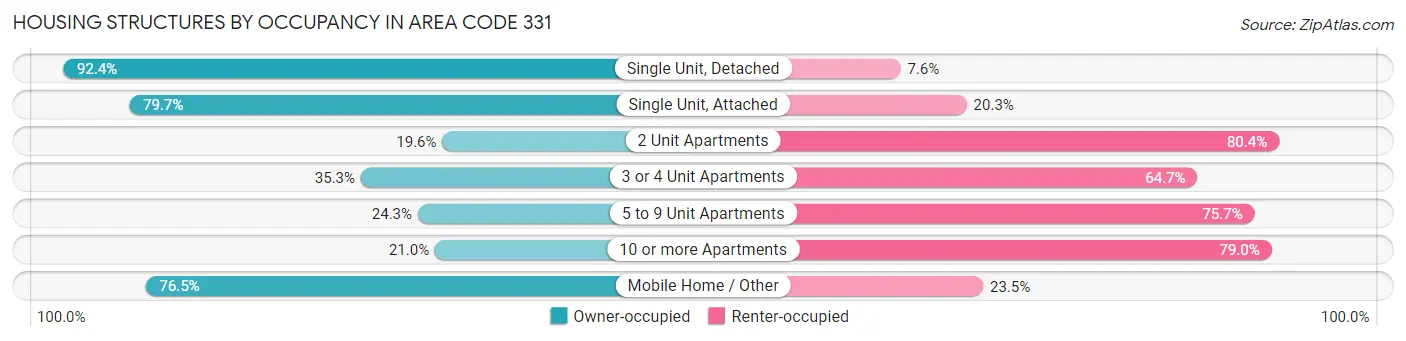
| Structure Type | Owner-occupied | Renter-occupied |
| Single Unit, Detached | 210,111 (92.4%) | 17,199 (7.6%) |
| Single Unit, Attached | 29,569 (79.7%) | 7,538 (20.3%) |
| 2 Unit Apartments | 1,085 (19.6%) | 4,463 (80.4%) |
| 3 or 4 Unit Apartments | 3,708 (35.3%) | 6,808 (64.7%) |
| 5 to 9 Unit Apartments | 3,552 (24.3%) | 11,079 (75.7%) |
| 10 or more Apartments | 8,443 (21.0%) | 31,795 (79.0%) |
| Mobile Home / Other | 933 (76.5%) | 286 (23.5%) |
| Total | 257,401 (76.5%) | 79,168 (23.5%) |
Housing Structures by Number of Rooms in Area Code 331
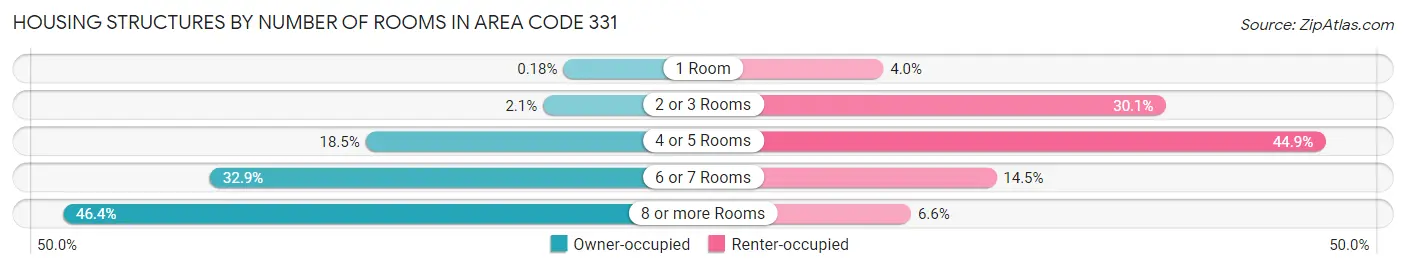
| Number of Rooms | Owner-occupied | Renter-occupied |
| 1 Room | 467 (0.2%) | 3,171 (4.0%) |
| 2 or 3 Rooms | 5,279 (2.1%) | 23,822 (30.1%) |
| 4 or 5 Rooms | 47,533 (18.5%) | 35,515 (44.9%) |
| 6 or 7 Rooms | 84,575 (32.9%) | 11,459 (14.5%) |
| 8 or more Rooms | 119,547 (46.4%) | 5,201 (6.6%) |
| Total | 257,401 (100.0%) | 79,168 (100.0%) |
Housing Structure by Heating Type in Area Code 331
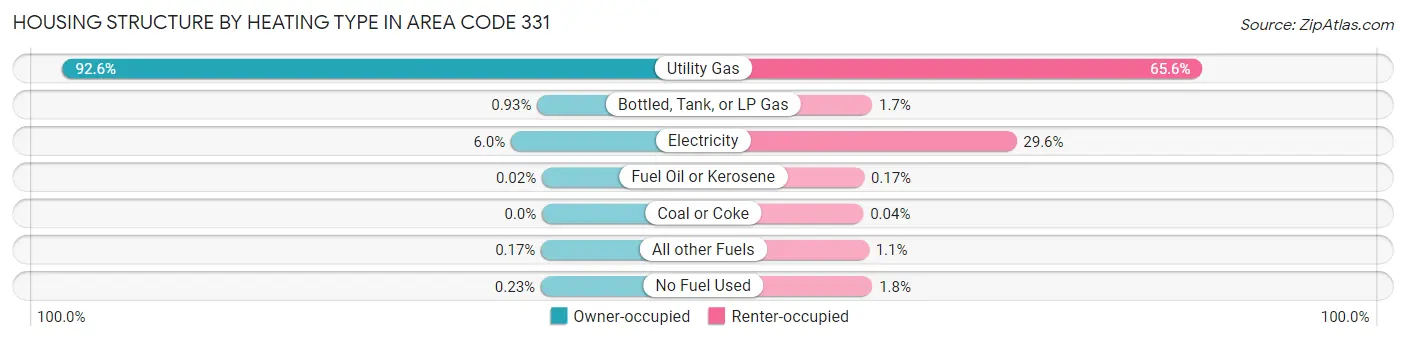
| Heating Type | Owner-occupied | Renter-occupied |
| Utility Gas | 238,466 (92.6%) | 51,902 (65.6%) |
| Bottled, Tank, or LP Gas | 2,389 (0.9%) | 1,377 (1.7%) |
| Electricity | 15,443 (6.0%) | 23,457 (29.6%) |
| Fuel Oil or Kerosene | 64 (0.0%) | 135 (0.2%) |
| Coal or Coke | 7 (0.0%) | 28 (0.0%) |
| All other Fuels | 442 (0.2%) | 864 (1.1%) |
| No Fuel Used | 590 (0.2%) | 1,405 (1.8%) |
| Total | 257,401 (100.0%) | 79,168 (100.0%) |
Household Vehicle Usage in Area Code 331
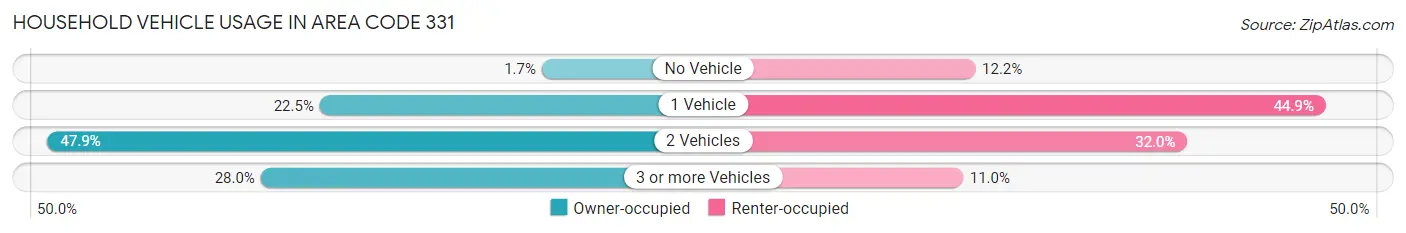
| Vehicles per Household | Owner-occupied | Renter-occupied |
| No Vehicle | 4,422 (1.7%) | 9,619 (12.1%) |
| 1 Vehicle | 57,781 (22.5%) | 35,534 (44.9%) |
| 2 Vehicles | 123,228 (47.9%) | 25,304 (32.0%) |
| 3 or more Vehicles | 71,970 (28.0%) | 8,711 (11.0%) |
| Total | 257,401 (100.0%) | 79,168 (100.0%) |
Real Estate & Mortgages in Area Code 331
Real Estate and Mortgage Overview in Area Code 331
| Characteristic | Without Mortgage | With Mortgage |
| Housing Units | 81,921 | 175,480 |
| Median Property Value | $9,652,400 | $10,414,100 |
| Median Household Income | $2,680,937 | $77,973 |
| Monthly Housing Costs | $28,378 | $45,687 |
| Real Estate Taxes | $212,889 | $1,448 |
Property Value by Mortgage Status in Area Code 331
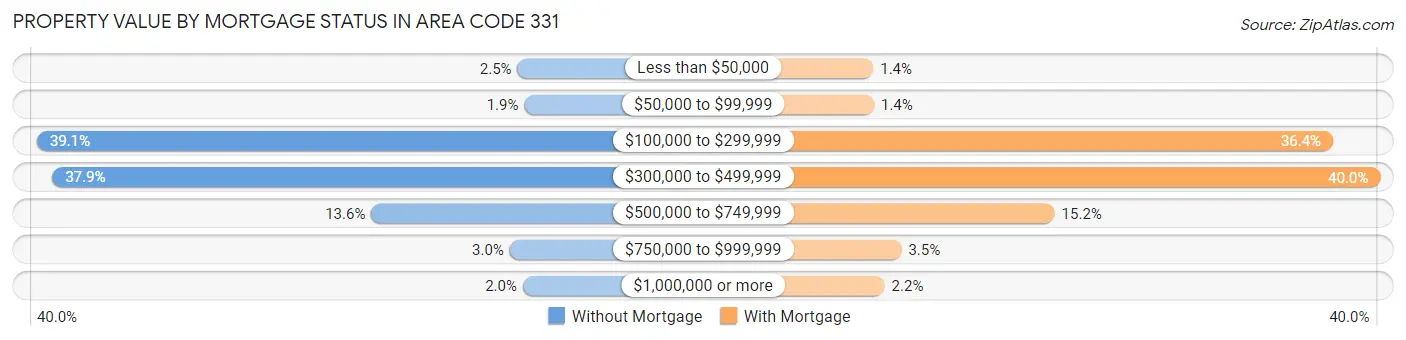
| Property Value | Without Mortgage | With Mortgage |
| Less than $50,000 | 2,011 (2.5%) | 2,366 (1.3%) |
| $50,000 to $99,999 | 1,580 (1.9%) | 2,475 (1.4%) |
| $100,000 to $299,999 | 32,006 (39.1%) | 63,823 (36.4%) |
| $300,000 to $499,999 | 31,037 (37.9%) | 70,154 (40.0%) |
| $500,000 to $749,999 | 11,131 (13.6%) | 26,629 (15.2%) |
| $750,000 to $999,999 | 2,488 (3.0%) | 6,139 (3.5%) |
| $1,000,000 or more | 1,668 (2.0%) | 3,894 (2.2%) |
| Total | 81,921 (100.0%) | 175,480 (100.0%) |
Household Income by Mortgage Status in Area Code 331
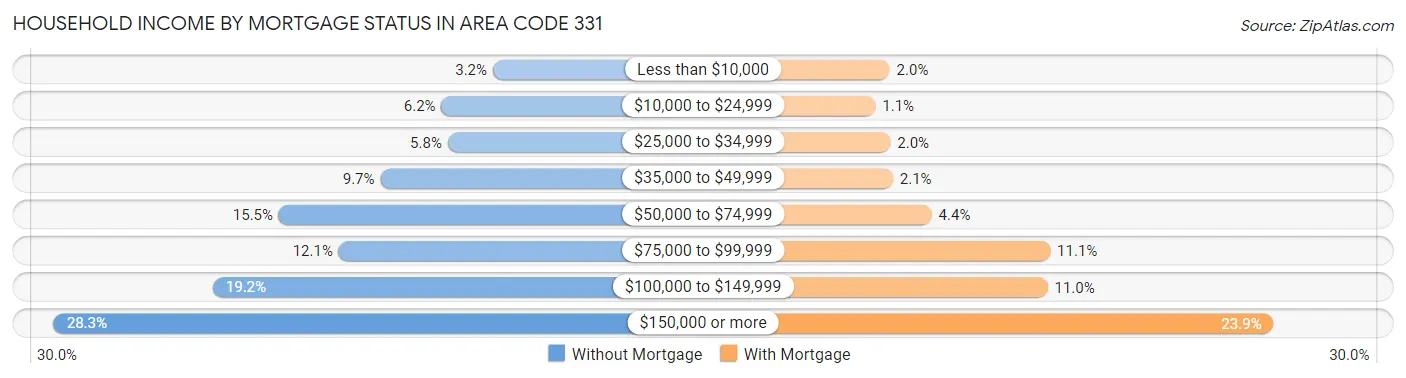
| Household Income | Without Mortgage | With Mortgage |
| Less than $10,000 | 2,655 (3.2%) | 3,430 (1.9%) |
| $10,000 to $24,999 | 5,064 (6.2%) | 1,976 (1.1%) |
| $25,000 to $34,999 | 4,767 (5.8%) | 3,496 (2.0%) |
| $35,000 to $49,999 | 7,925 (9.7%) | 3,739 (2.1%) |
| $50,000 to $74,999 | 12,671 (15.5%) | 7,628 (4.3%) |
| $75,000 to $99,999 | 9,871 (12.0%) | 19,513 (11.1%) |
| $100,000 to $149,999 | 15,762 (19.2%) | 19,254 (11.0%) |
| $150,000 or more | 23,206 (28.3%) | 41,901 (23.9%) |
| Total | 81,921 (100.0%) | 175,480 (100.0%) |
Property Value to Household Income Ratio in Area Code 331
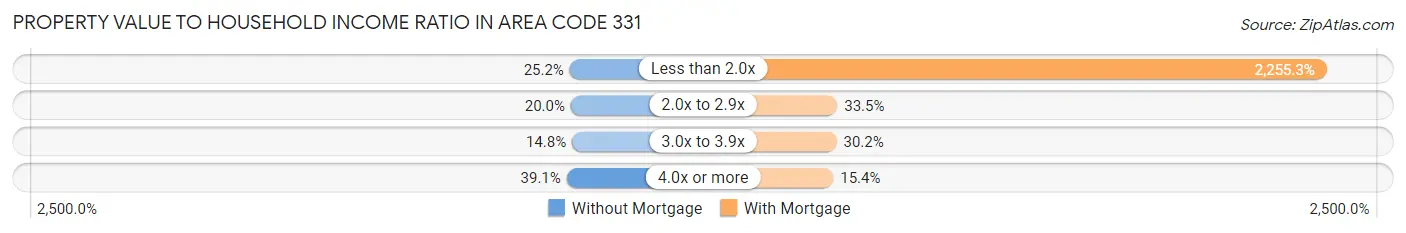
| Value-to-Income Ratio | Without Mortgage | With Mortgage |
| Less than 2.0x | 20,621 (25.2%) | 3,957,665 (2,255.3%) |
| 2.0x to 2.9x | 16,352 (20.0%) | 58,780 (33.5%) |
| 3.0x to 3.9x | 12,120 (14.8%) | 52,982 (30.2%) |
| 4.0x or more | 32,021 (39.1%) | 26,969 (15.4%) |
| Total | 81,921 (100.0%) | 175,480 (100.0%) |
Real Estate Taxes by Mortgage Status in Area Code 331
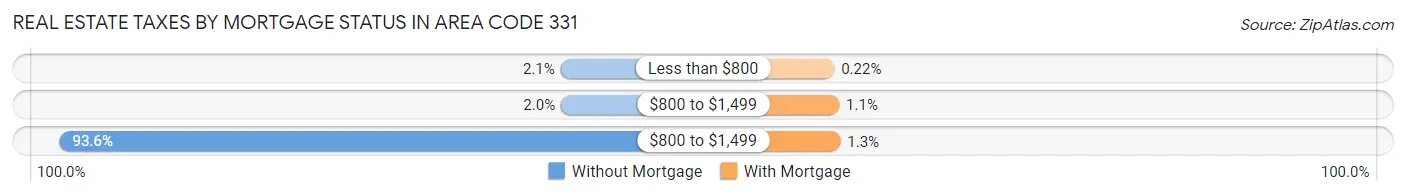
| Property Taxes | Without Mortgage | With Mortgage |
| Less than $800 | 1,719 (2.1%) | 383 (0.2%) |
| $800 to $1,499 | 1,666 (2.0%) | 1,966 (1.1%) |
| $800 to $1,499 | 76,685 (93.6%) | 2,334 (1.3%) |
| Total | 81,921 (100.0%) | 175,480 (100.0%) |
Health & Disability in Area Code 331
Health Insurance Coverage by Age in Area Code 331
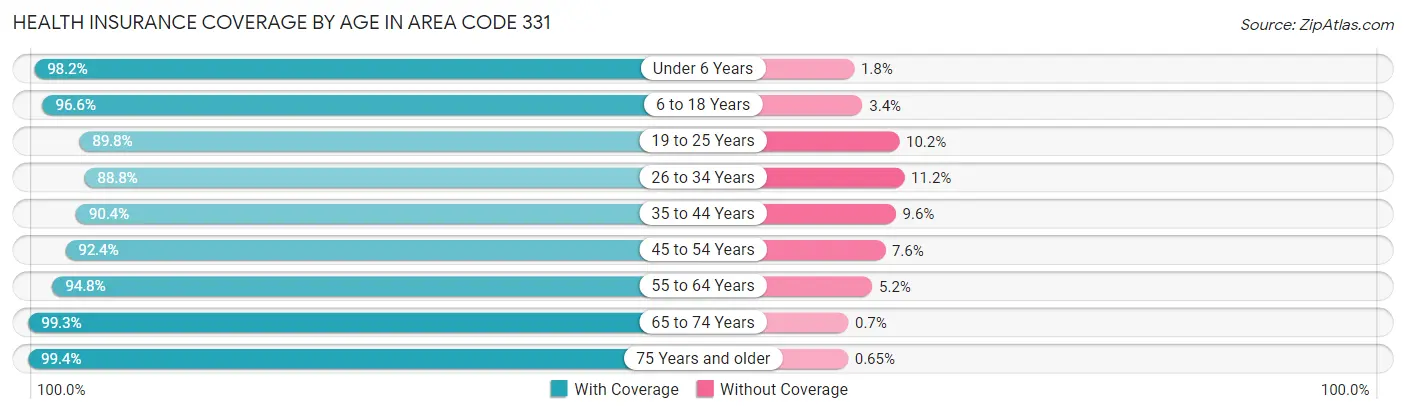
| Age Bracket | With Coverage | Without Coverage |
| Under 6 Years | 63,615 (98.2%) | 1,168 (1.8%) |
| 6 to 18 Years | 167,552 (96.6%) | 5,824 (3.4%) |
| 19 to 25 Years | 71,745 (89.8%) | 8,161 (10.2%) |
| 26 to 34 Years | 88,933 (88.8%) | 11,173 (11.2%) |
| 35 to 44 Years | 115,468 (90.4%) | 12,219 (9.6%) |
| 45 to 54 Years | 114,602 (92.4%) | 9,411 (7.6%) |
| 55 to 64 Years | 119,479 (94.8%) | 6,521 (5.2%) |
| 65 to 74 Years | 85,780 (99.3%) | 603 (0.7%) |
| 75 Years and older | 52,669 (99.4%) | 347 (0.6%) |
| Total | 879,843 (94.1%) | 55,427 (5.9%) |
Health Insurance Coverage by Citizenship Status in Area Code 331
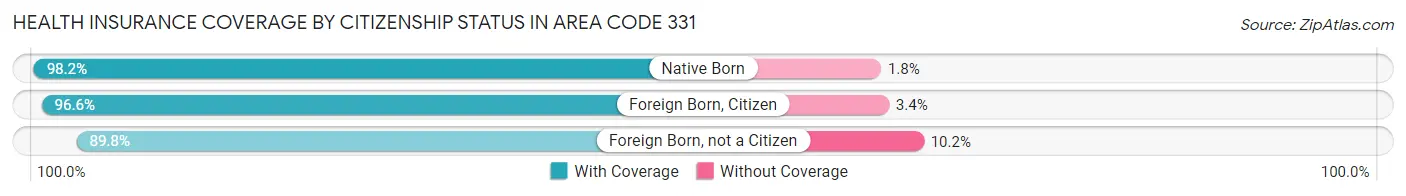
| Citizenship Status | With Coverage | Without Coverage |
| Native Born | 63,615 (98.2%) | 1,168 (1.8%) |
| Foreign Born, Citizen | 167,552 (96.6%) | 5,824 (3.4%) |
| Foreign Born, not a Citizen | 71,745 (89.8%) | 8,161 (10.2%) |
Health Insurance Coverage by Household Income in Area Code 331
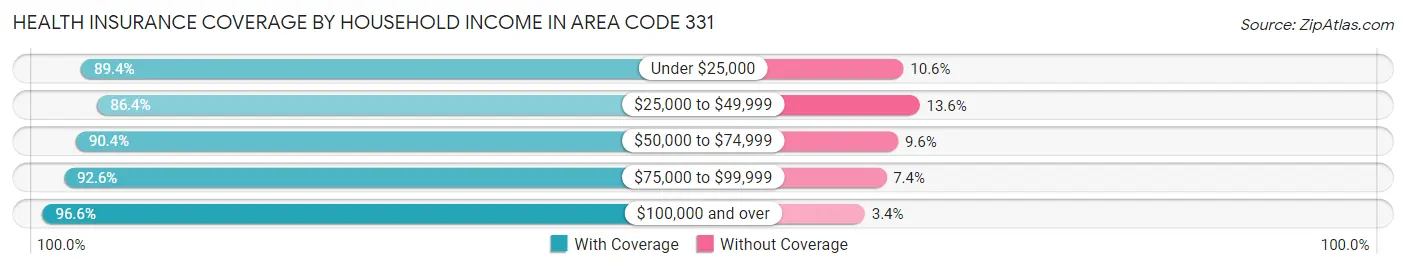
| Household Income | With Coverage | Without Coverage |
| Under $25,000 | 44,139 (89.4%) | 5,231 (10.6%) |
| $25,000 to $49,999 | 74,148 (86.4%) | 11,705 (13.6%) |
| $50,000 to $74,999 | 100,526 (90.4%) | 10,680 (9.6%) |
| $75,000 to $99,999 | 101,075 (92.6%) | 8,048 (7.4%) |
| $100,000 and over | 554,262 (96.6%) | 19,327 (3.4%) |
Public vs Private Health Insurance Coverage by Age in Area Code 331
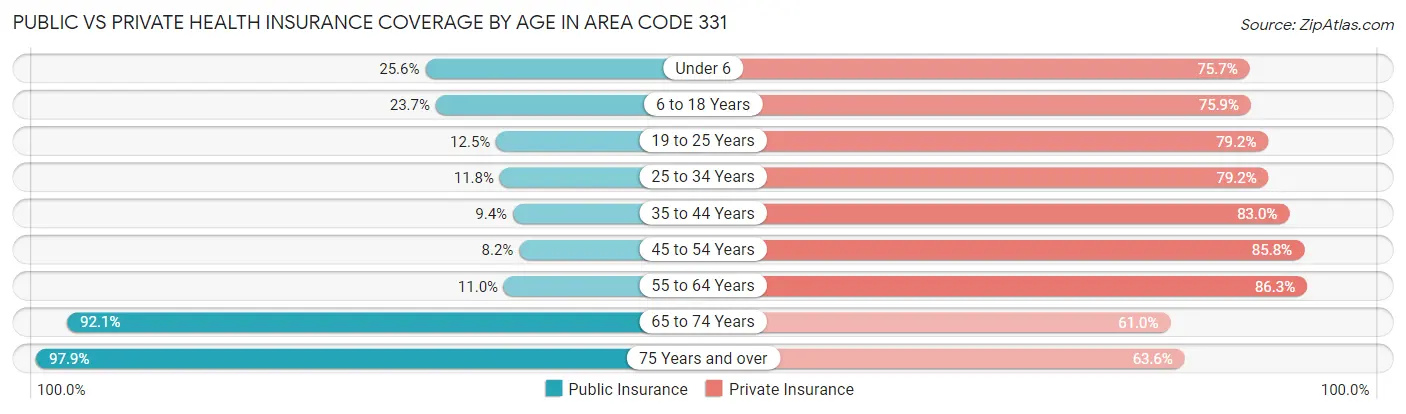
| Age Bracket | Public Insurance | Private Insurance |
| Under 6 | 16,601 (25.6%) | 49,022 (75.7%) |
| 6 to 18 Years | 41,064 (23.7%) | 131,620 (75.9%) |
| 19 to 25 Years | 9,967 (12.5%) | 63,243 (79.1%) |
| 25 to 34 Years | 11,803 (11.8%) | 79,296 (79.2%) |
| 35 to 44 Years | 11,957 (9.4%) | 106,036 (83.0%) |
| 45 to 54 Years | 10,165 (8.2%) | 106,362 (85.8%) |
| 55 to 64 Years | 13,901 (11.0%) | 108,788 (86.3%) |
| 65 to 74 Years | 79,547 (92.1%) | 52,663 (61.0%) |
| 75 Years and over | 51,882 (97.9%) | 33,741 (63.6%) |
| Total | 246,887 (26.4%) | 730,771 (78.1%) |
Disability Status by Sex by Age in Area Code 331
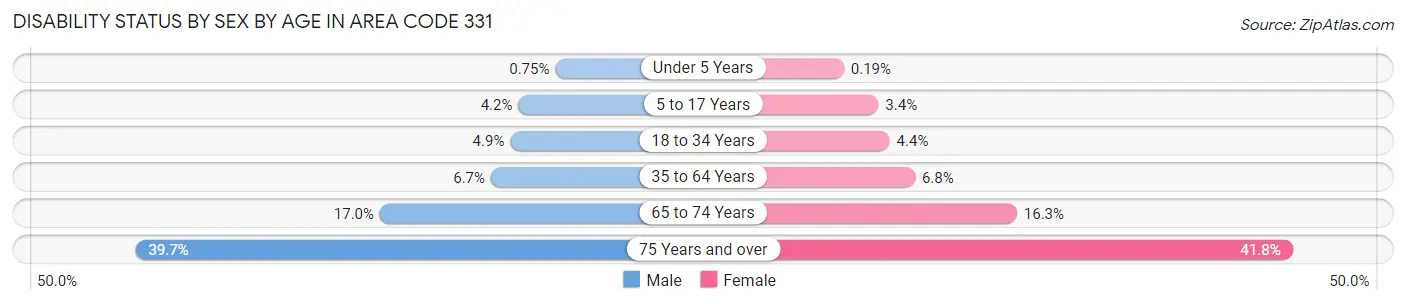
| Age Bracket | Male | Female |
| Under 5 Years | 197 (0.7%) | 51 (0.2%) |
| 5 to 17 Years | 3,687 (4.2%) | 2,838 (3.4%) |
| 18 to 34 Years | 4,857 (4.9%) | 4,211 (4.4%) |
| 35 to 64 Years | 12,754 (6.7%) | 12,780 (6.8%) |
| 65 to 74 Years | 7,044 (17.0%) | 7,316 (16.3%) |
| 75 Years and over | 8,720 (39.7%) | 12,989 (41.8%) |
Disability Class by Sex by Age in Area Code 331
Disability Class: Hearing Difficulty
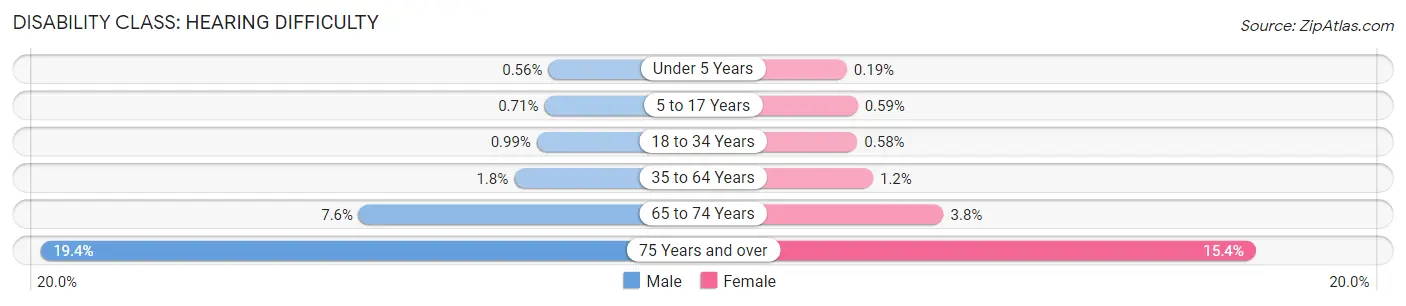
| Age Bracket | Male | Female |
| Under 5 Years | 148 (0.6%) | 51 (0.2%) |
| 5 to 17 Years | 622 (0.7%) | 491 (0.6%) |
| 18 to 34 Years | 970 (1.0%) | 553 (0.6%) |
| 35 to 64 Years | 3,473 (1.8%) | 2,180 (1.2%) |
| 65 to 74 Years | 3,138 (7.6%) | 1,701 (3.8%) |
| 75 Years and over | 4,265 (19.4%) | 4,770 (15.4%) |
Disability Class: Vision Difficulty
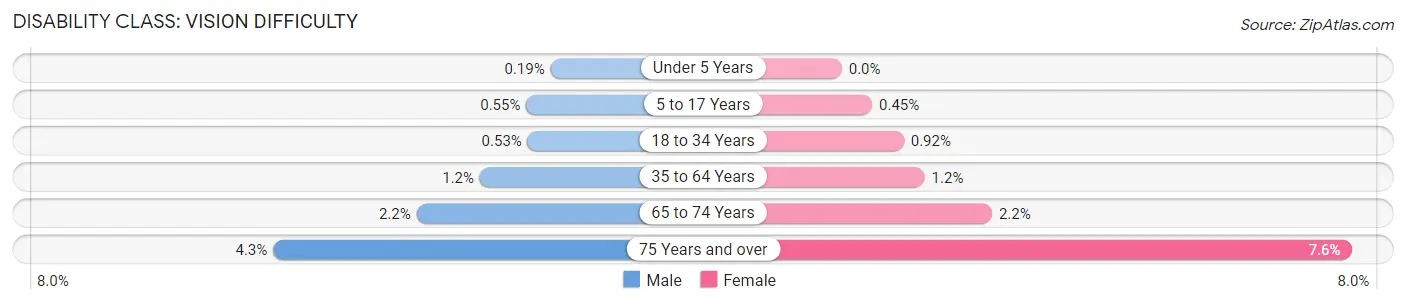
| Age Bracket | Male | Female |
| Under 5 Years | 49 (0.2%) | 0 (0.0%) |
| 5 to 17 Years | 486 (0.5%) | 374 (0.4%) |
| 18 to 34 Years | 523 (0.5%) | 873 (0.9%) |
| 35 to 64 Years | 2,342 (1.2%) | 2,314 (1.2%) |
| 65 to 74 Years | 903 (2.2%) | 1,005 (2.2%) |
| 75 Years and over | 946 (4.3%) | 2,353 (7.6%) |
Disability Class: Cognitive Difficulty
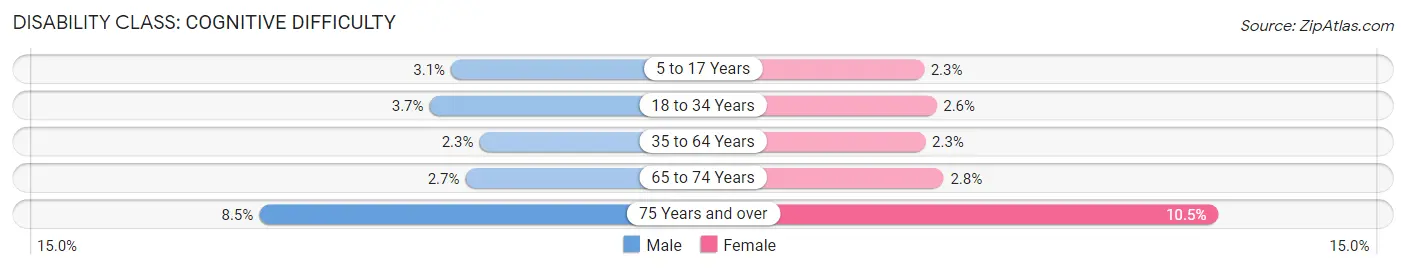
| Age Bracket | Male | Female |
| 5 to 17 Years | 2,763 (3.1%) | 1,905 (2.3%) |
| 18 to 34 Years | 3,675 (3.7%) | 2,496 (2.6%) |
| 35 to 64 Years | 4,441 (2.3%) | 4,362 (2.3%) |
| 65 to 74 Years | 1,130 (2.7%) | 1,276 (2.8%) |
| 75 Years and over | 1,861 (8.5%) | 3,255 (10.5%) |
Disability Class: Ambulatory Difficulty
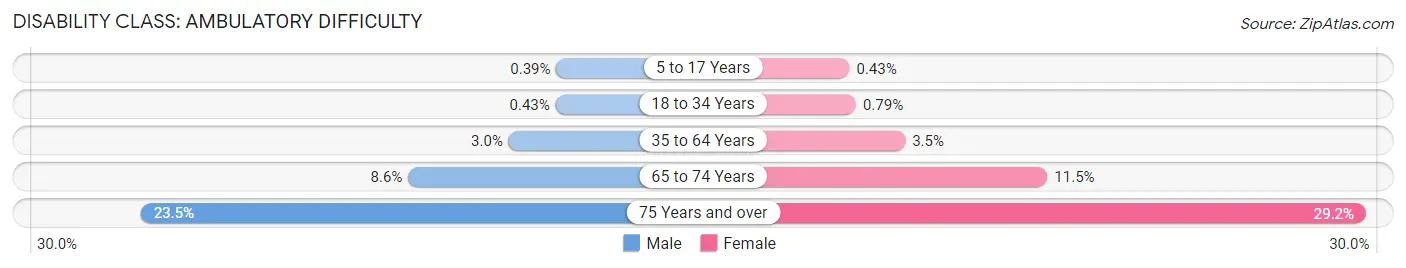
| Age Bracket | Male | Female |
| 5 to 17 Years | 344 (0.4%) | 356 (0.4%) |
| 18 to 34 Years | 423 (0.4%) | 754 (0.8%) |
| 35 to 64 Years | 5,765 (3.0%) | 6,634 (3.5%) |
| 65 to 74 Years | 3,573 (8.6%) | 5,152 (11.5%) |
| 75 Years and over | 5,168 (23.5%) | 9,061 (29.2%) |
Disability Class: Self-Care Difficulty
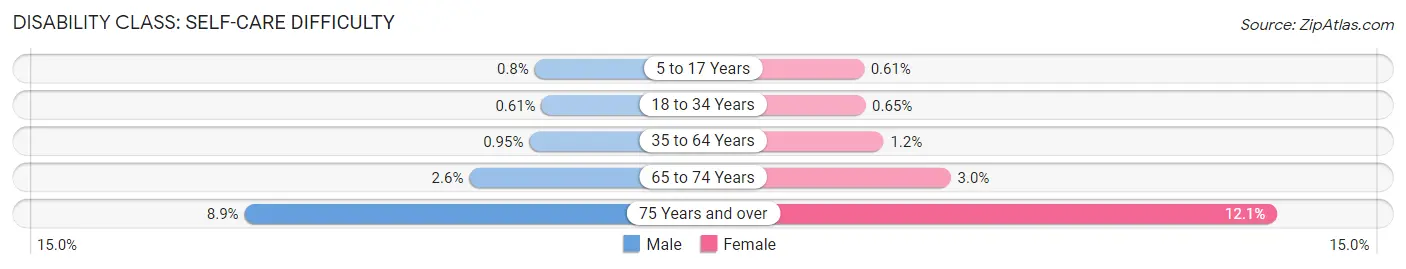
| Age Bracket | Male | Female |
| 5 to 17 Years | 703 (0.8%) | 507 (0.6%) |
| 18 to 34 Years | 598 (0.6%) | 615 (0.6%) |
| 35 to 64 Years | 1,793 (0.9%) | 2,185 (1.2%) |
| 65 to 74 Years | 1,083 (2.6%) | 1,363 (3.0%) |
| 75 Years and over | 1,950 (8.9%) | 3,763 (12.1%) |
Technology Access in Area Code 331
Computing Device Access in Area Code 331
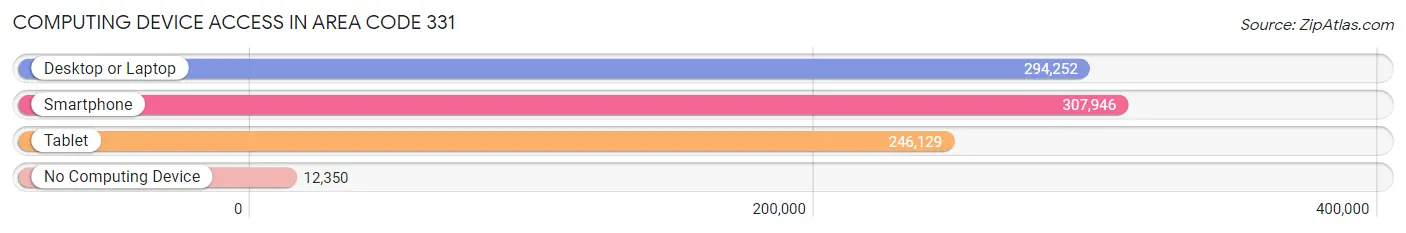
| Device Type | # Households | % Households |
| Desktop or Laptop | 294,252 | 87.4% |
| Smartphone | 307,946 | 91.5% |
| Tablet | 246,129 | 73.1% |
| No Computing Device | 12,350 | 3.7% |
| Total | 336,569 | 100.0% |
Internet Access in Area Code 331
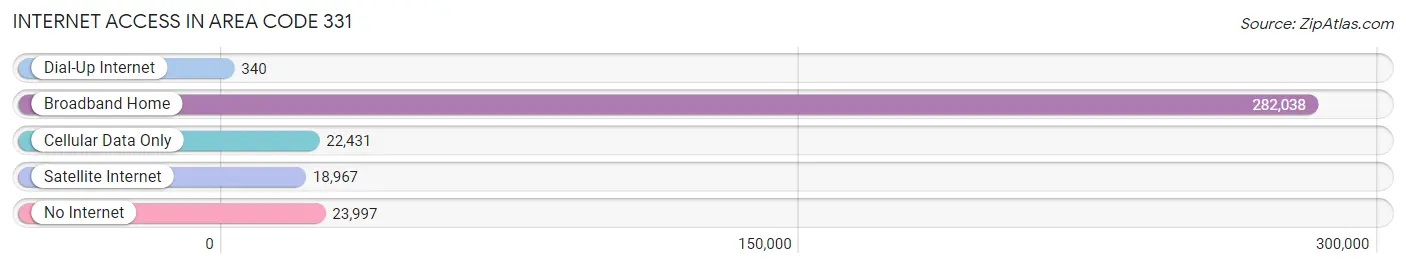
| Internet Type | # Households | % Households |
| Dial-Up Internet | 340 | 0.1% |
| Broadband Home | 282,038 | 83.8% |
| Cellular Data Only | 22,431 | 6.7% |
| Satellite Internet | 18,967 | 5.6% |
| No Internet | 23,997 | 7.1% |
| Total | 336,569 | 100.0% |
Area Code 331 Summary
Geography
Area code 331 is an area code in the North American Numbering Plan (NANP) for the western and northwestern suburbs of Chicago, Illinois. It includes the cities of Aurora, Elgin, Naperville, and Joliet.
Social
Area code 331 is a vibrant and diverse area with a variety of cultural and recreational activities. The area is home to a number of museums, theaters, and other attractions, as well as a variety of restaurants and shopping centers.
Economics
Area code 331 is a major economic hub in the Chicago metropolitan area. The area is home to a number of large corporations, including Caterpillar, Motorola Solutions, and Navistar International. The area also has a strong manufacturing base, with many factories and warehouses located in the area.
Demographics
Area code 331 is home to a diverse population, with a mix of racial and ethnic backgrounds. According to the 2010 census, the population of the area was approximately 1.2 million people. The area is also home to a large number of immigrants, with a significant percentage of the population being foreign-born.
Common Questions
What is the Total Population of Area Code 331?
Total Population of Area Code 331 is 941,954.
What is the Total Male Population of Area Code 331?
Total Male Population of Area Code 331 is 468,851.
What is the Total Female Population of Area Code 331?
Total Female Population of Area Code 331 is 473,103.
What is the Ratio of Males per 100 Females in Area Code 331?
There are 99.10 Males per 100 Females in Area Code 331.
What is the Ratio of Females per 100 Males in Area Code 331?
There are 100.91 Females per 100 Males in Area Code 331.
What is the Median Population Age in Area Code 331?
Median Population Age in Area Code 331 is 39.8 Years.
What is the Average Family Size in Area Code 331
Average Family Size in Area Code 331 is 3.3 People.
What is the Average Household Size in Area Code 331
Average Household Size in Area Code 331 is 2.8 People.
What is Per Capita Income in Area Code 331?
Per Capita income in Area Code 331 is $51,795.
What is the Median Family Income in Area Code 331?
Median Family Income in Area Code 331 is $132,127.
What is the Median Household income in Area Code 331?
Median Household Income in Area Code 331 is $112,049.
What is Income or Wage Gap in Area Code 331?
Income or Wage Gap in Area Code 331 is 35.5%.
Women in Area Code 331 earn 64.5 cents for every dollar earned by a man.
What is Family Income Deficit in Area Code 331?
Family Income Deficit in Area Code 331 is $11,427.
Families that are below poverty line in Area Code 331 earn $11,427 less on average than the poverty threshold level.
What is Inequality or Gini Index in Area Code 331?
Inequality or Gini Index in Area Code 331 is 11.92.
How Large is the Labor Force in Area Code 331?
There are 517,244 People in the Labor Forcein in Area Code 331.
What is the Percentage of People in the Labor Force in Area Code 331?
69.4% of People are in the Labor Force in Area Code 331.
What is the Unemployment Rate in Area Code 331?
Unemployment Rate in Area Code 331 is 4.8%.