Will County, IL
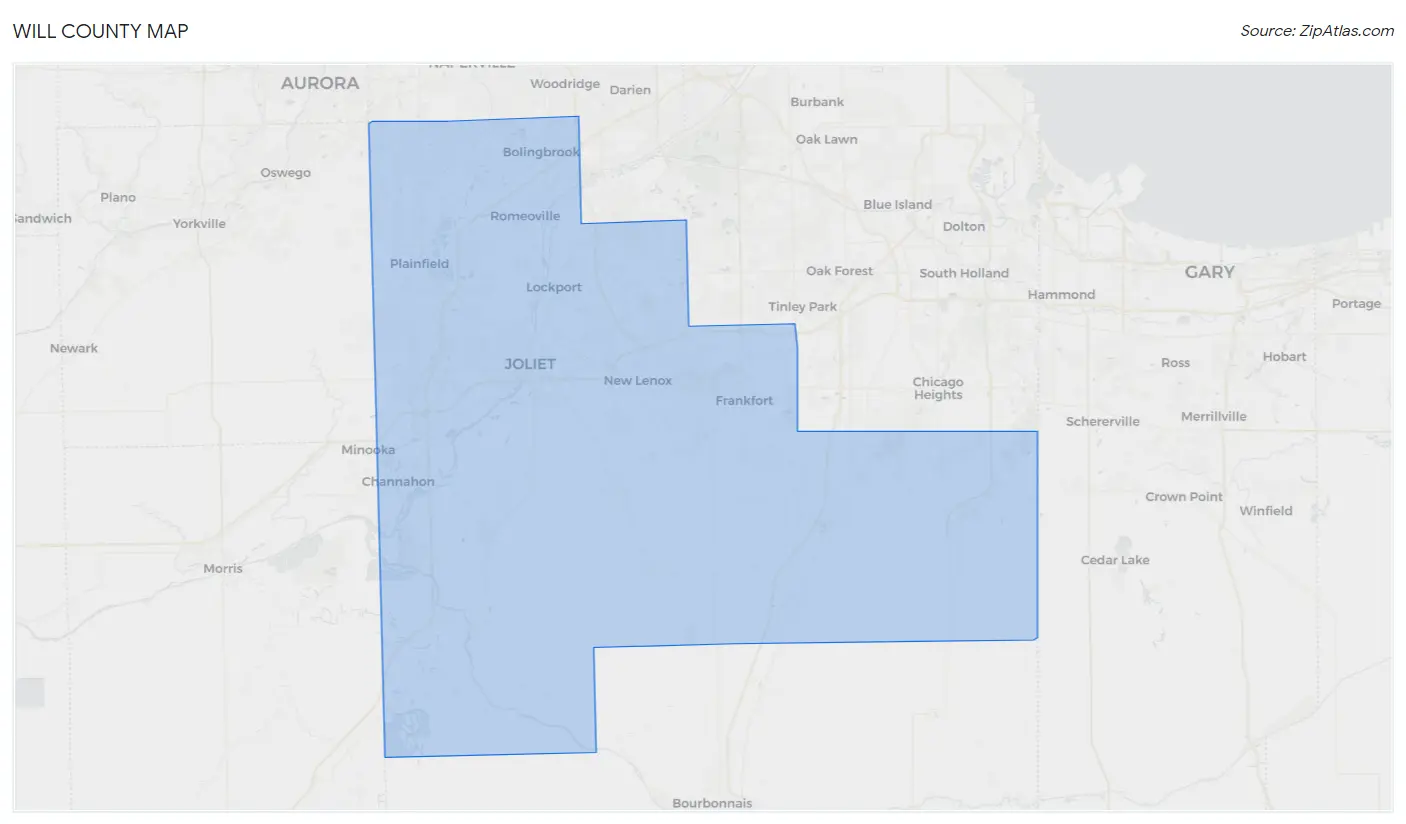
Will County Map
Will County Overview
696,774
TOTAL POPULATION
348,352
MALE POPULATION
348,422
FEMALE POPULATION
99.98
MALES / 100 FEMALES
100.02
FEMALES / 100 MALES
38.7
MEDIAN AGE
3.4
AVG FAMILY SIZE
2.9
AVG HOUSEHOLD SIZE
$44,356
PER CAPITA INCOME
$119,675
AVG FAMILY INCOME
$103,678
AVG HOUSEHOLD INCOME
36.5%
WAGE / INCOME GAP [ % ]
63.5¢/ $1
WAGE / INCOME GAP [ $ ]
$12,072
FAMILY INCOME DEFICIT
0.41
INEQUALITY / GINI INDEX
378,677
LABOR FORCE [ PEOPLE ]
68.8%
PERCENT IN LABOR FORCE
5.0%
UNEMPLOYMENT RATE
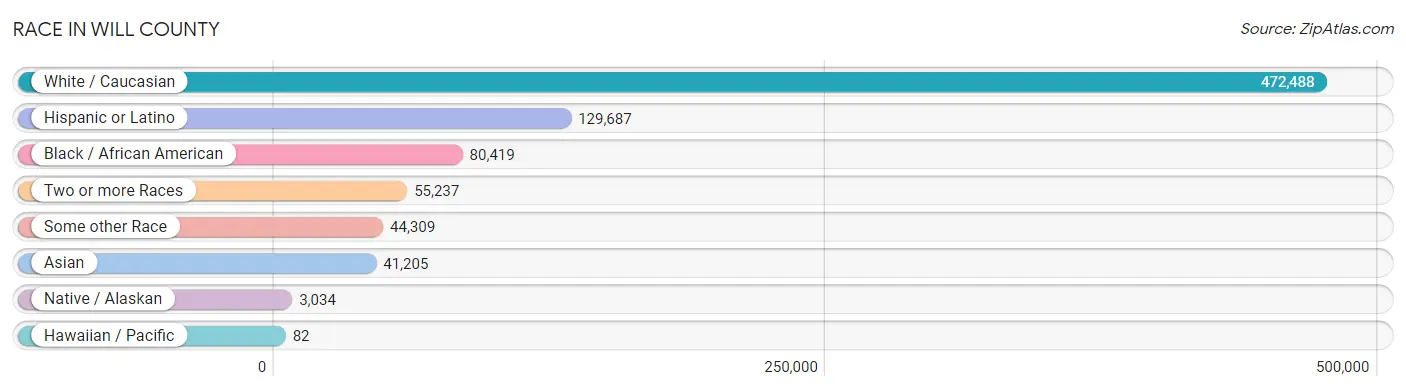
Race in Will County
The most populous races in Will County are White / Caucasian (472,488 | 67.8%), Hispanic or Latino (129,687 | 18.6%), and Black / African American (80,419 | 11.5%).
| Race | # Population | % Population |
| Asian | 41,205 | 5.9% |
| Black / African American | 80,419 | 11.5% |
| Hawaiian / Pacific | 82 | 0.0% |
| Hispanic or Latino | 129,687 | 18.6% |
| Native / Alaskan | 3,034 | 0.4% |
| White / Caucasian | 472,488 | 67.8% |
| Two or more Races | 55,237 | 7.9% |
| Some other Race | 44,309 | 6.4% |
| Total | 696,774 | 100.0% |
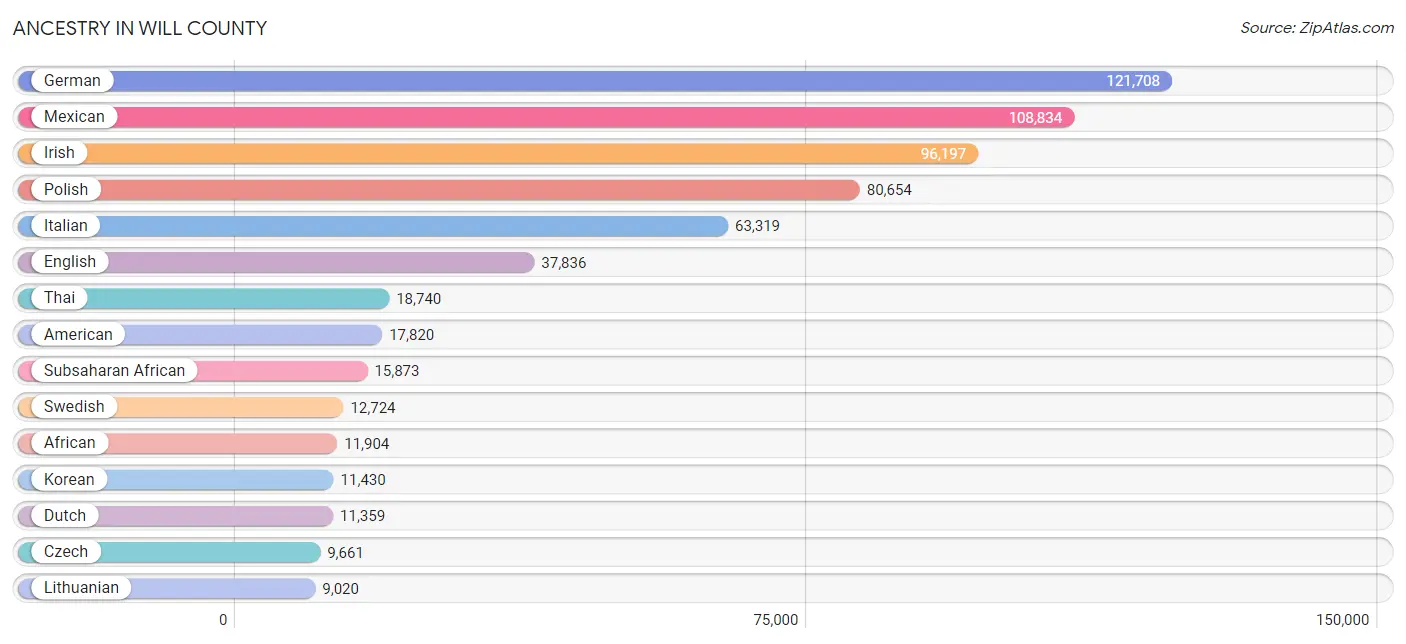
Ancestry in Will County
The most populous ancestries reported in Will County are German (121,708 | 17.5%), Mexican (108,834 | 15.6%), Irish (96,197 | 13.8%), Polish (80,654 | 11.6%), and Italian (63,319 | 9.1%), together accounting for 67.6% of all Will County residents.
| Ancestry | # Population | % Population |
| Afghan | 267 | 0.0% |
| African | 11,904 | 1.7% |
| Albanian | 209 | 0.0% |
| Alsatian | 20 | 0.0% |
| American | 17,820 | 2.6% |
| Apache | 219 | 0.0% |
| Arab | 4,509 | 0.6% |
| Arapaho | 34 | 0.0% |
| Argentinean | 153 | 0.0% |
| Armenian | 384 | 0.1% |
| Assyrian / Chaldean / Syriac | 139 | 0.0% |
| Australian | 58 | 0.0% |
| Austrian | 2,362 | 0.3% |
| Bangladeshi | 49 | 0.0% |
| Barbadian | 51 | 0.0% |
| Belgian | 893 | 0.1% |
| Belizean | 275 | 0.0% |
| Bhutanese | 1,170 | 0.2% |
| Blackfeet | 436 | 0.1% |
| Bolivian | 121 | 0.0% |
| Brazilian | 206 | 0.0% |
| British | 1,742 | 0.3% |
| British West Indian | 19 | 0.0% |
| Bulgarian | 369 | 0.1% |
| Burmese | 3,207 | 0.5% |
| Cambodian | 169 | 0.0% |
| Canadian | 658 | 0.1% |
| Carpatho Rusyn | 7 | 0.0% |
| Celtic | 17 | 0.0% |
| Central American | 2,845 | 0.4% |
| Central American Indian | 819 | 0.1% |
| Cherokee | 1,865 | 0.3% |
| Cheyenne | 8 | 0.0% |
| Chickasaw | 9 | 0.0% |
| Chilean | 174 | 0.0% |
| Chinese | 18 | 0.0% |
| Chippewa | 147 | 0.0% |
| Choctaw | 169 | 0.0% |
| Colombian | 1,037 | 0.2% |
| Comanche | 53 | 0.0% |
| Costa Rican | 163 | 0.0% |
| Cree | 2 | 0.0% |
| Creek | 4 | 0.0% |
| Croatian | 4,651 | 0.7% |
| Cuban | 1,253 | 0.2% |
| Czech | 9,661 | 1.4% |
| Czechoslovakian | 1,413 | 0.2% |
| Danish | 1,964 | 0.3% |
| Dominican | 326 | 0.1% |
| Dutch | 11,359 | 1.6% |
| Dutch West Indian | 35 | 0.0% |
| Eastern European | 1,334 | 0.2% |
| Ecuadorian | 724 | 0.1% |
| Egyptian | 651 | 0.1% |
| English | 37,836 | 5.4% |
| Estonian | 8 | 0.0% |
| Ethiopian | 232 | 0.0% |
| European | 7,443 | 1.1% |
| Filipino | 261 | 0.0% |
| Finnish | 637 | 0.1% |
| French | 8,868 | 1.3% |
| French American Indian | 8 | 0.0% |
| French Canadian | 1,771 | 0.3% |
| German | 121,708 | 17.5% |
| German Russian | 30 | 0.0% |
| Ghanaian | 734 | 0.1% |
| Greek | 5,235 | 0.7% |
| Guamanian / Chamorro | 126 | 0.0% |
| Guatemalan | 1,487 | 0.2% |
| Guyanese | 144 | 0.0% |
| Haitian | 492 | 0.1% |
| Honduran | 270 | 0.0% |
| Hungarian | 3,320 | 0.5% |
| Indian (Asian) | 5,659 | 0.8% |
| Indonesian | 303 | 0.0% |
| Inupiat | 2 | 0.0% |
| Iranian | 291 | 0.0% |
| Iraqi | 35 | 0.0% |
| Irish | 96,197 | 13.8% |
| Iroquois | 56 | 0.0% |
| Israeli | 55 | 0.0% |
| Italian | 63,319 | 9.1% |
| Jamaican | 932 | 0.1% |
| Japanese | 115 | 0.0% |
| Jordanian | 449 | 0.1% |
| Kenyan | 112 | 0.0% |
| Korean | 11,430 | 1.6% |
| Laotian | 257 | 0.0% |
| Latvian | 200 | 0.0% |
| Lebanese | 702 | 0.1% |
| Liberian | 111 | 0.0% |
| Lithuanian | 9,020 | 1.3% |
| Lumbee | 68 | 0.0% |
| Luxembourger | 223 | 0.0% |
| Macedonian | 716 | 0.1% |
| Malaysian | 338 | 0.1% |
| Maltese | 61 | 0.0% |
| Menominee | 60 | 0.0% |
| Mexican | 108,834 | 15.6% |
| Mexican American Indian | 2,441 | 0.4% |
| Mongolian | 144 | 0.0% |
| Moroccan | 293 | 0.0% |
| Native Hawaiian | 161 | 0.0% |
| Navajo | 54 | 0.0% |
| New Zealander | 80 | 0.0% |
| Nicaraguan | 227 | 0.0% |
| Nigerian | 2,264 | 0.3% |
| Northern European | 613 | 0.1% |
| Norwegian | 6,274 | 0.9% |
| Okinawan | 51 | 0.0% |
| Ottawa | 17 | 0.0% |
| Paiute | 19 | 0.0% |
| Pakistani | 565 | 0.1% |
| Palestinian | 802 | 0.1% |
| Panamanian | 178 | 0.0% |
| Pennsylvania German | 20 | 0.0% |
| Peruvian | 549 | 0.1% |
| Polish | 80,654 | 11.6% |
| Portuguese | 576 | 0.1% |
| Potawatomi | 21 | 0.0% |
| Puerto Rican | 7,841 | 1.1% |
| Romanian | 1,646 | 0.2% |
| Russian | 3,729 | 0.5% |
| Salvadoran | 520 | 0.1% |
| Samoan | 78 | 0.0% |
| Scandinavian | 1,123 | 0.2% |
| Scotch-Irish | 2,973 | 0.4% |
| Scottish | 6,210 | 0.9% |
| Seminole | 11 | 0.0% |
| Serbian | 1,299 | 0.2% |
| Sioux | 54 | 0.0% |
| Slavic | 575 | 0.1% |
| Slovak | 3,687 | 0.5% |
| Slovene | 2,761 | 0.4% |
| South African | 97 | 0.0% |
| South American | 3,496 | 0.5% |
| South American Indian | 10 | 0.0% |
| Spaniard | 2,097 | 0.3% |
| Spanish | 977 | 0.1% |
| Spanish American | 5 | 0.0% |
| Spanish American Indian | 3 | 0.0% |
| Sri Lankan | 1,676 | 0.2% |
| Subsaharan African | 15,873 | 2.3% |
| Swedish | 12,724 | 1.8% |
| Swiss | 1,103 | 0.2% |
| Syrian | 356 | 0.1% |
| Thai | 18,740 | 2.7% |
| Tongan | 90 | 0.0% |
| Trinidadian and Tobagonian | 97 | 0.0% |
| Turkish | 400 | 0.1% |
| Ugandan | 71 | 0.0% |
| Ukrainian | 2,351 | 0.3% |
| Uruguayan | 15 | 0.0% |
| Ute | 24 | 0.0% |
| Venezuelan | 723 | 0.1% |
| Vietnamese | 298 | 0.0% |
| Welsh | 2,025 | 0.3% |
| West Indian | 109 | 0.0% |
| Yaqui | 1 | 0.0% |
| Yugoslavian | 1,097 | 0.2% | View All 160 Rows |
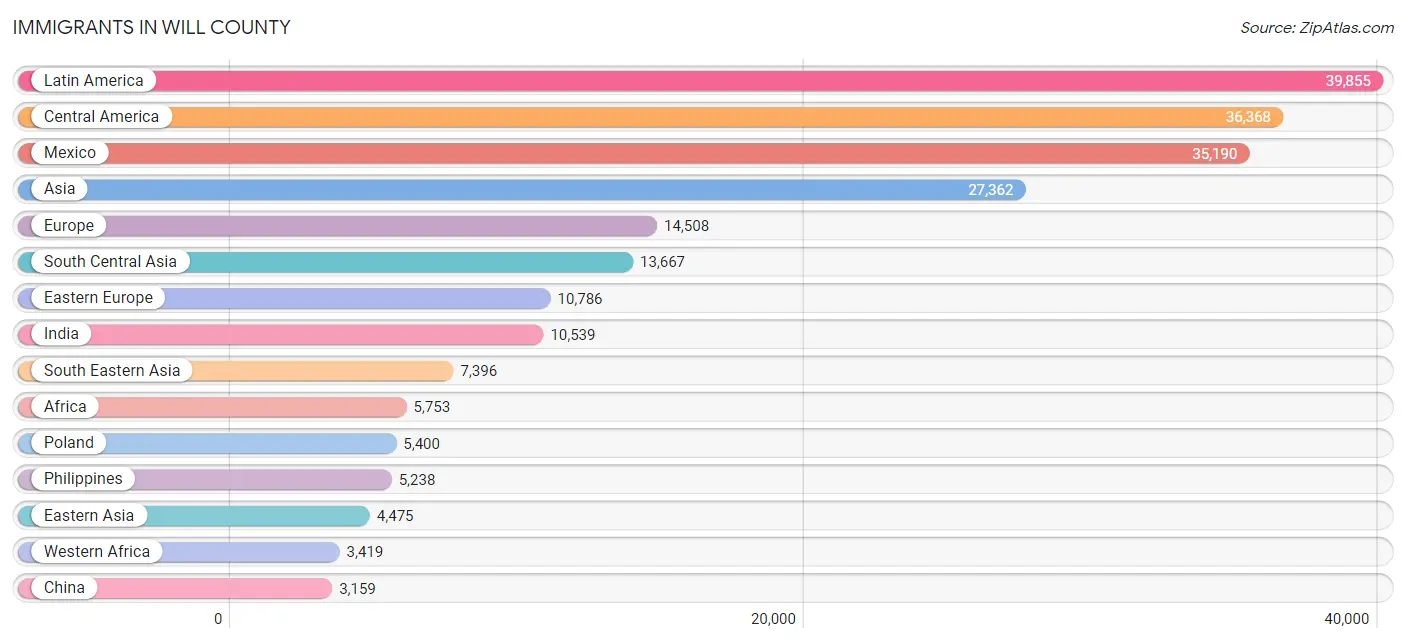
Immigrants in Will County
The most numerous immigrant groups reported in Will County came from Latin America (39,855 | 5.7%), Central America (36,368 | 5.2%), Mexico (35,190 | 5.1%), Asia (27,362 | 3.9%), and Europe (14,508 | 2.1%), together accounting for 22.0% of all Will County residents.
| Immigration Origin | # Population | % Population |
| Afghanistan | 159 | 0.0% |
| Africa | 5,753 | 0.8% |
| Albania | 27 | 0.0% |
| Argentina | 61 | 0.0% |
| Asia | 27,362 | 3.9% |
| Australia | 39 | 0.0% |
| Austria | 41 | 0.0% |
| Bangladesh | 205 | 0.0% |
| Barbados | 8 | 0.0% |
| Belarus | 29 | 0.0% |
| Belgium | 29 | 0.0% |
| Belize | 130 | 0.0% |
| Bolivia | 108 | 0.0% |
| Bosnia and Herzegovina | 335 | 0.1% |
| Brazil | 81 | 0.0% |
| Bulgaria | 286 | 0.0% |
| Cambodia | 96 | 0.0% |
| Cameroon | 215 | 0.0% |
| Canada | 851 | 0.1% |
| Caribbean | 1,248 | 0.2% |
| Central America | 36,368 | 5.2% |
| Chile | 45 | 0.0% |
| China | 3,159 | 0.4% |
| Colombia | 626 | 0.1% |
| Congo | 17 | 0.0% |
| Croatia | 52 | 0.0% |
| Cuba | 176 | 0.0% |
| Czechoslovakia | 199 | 0.0% |
| Dominica | 31 | 0.0% |
| Dominican Republic | 283 | 0.0% |
| Eastern Africa | 689 | 0.1% |
| Eastern Asia | 4,475 | 0.6% |
| Eastern Europe | 10,786 | 1.5% |
| Ecuador | 433 | 0.1% |
| Egypt | 503 | 0.1% |
| El Salvador | 166 | 0.0% |
| England | 464 | 0.1% |
| Eritrea | 40 | 0.0% |
| Ethiopia | 104 | 0.0% |
| Europe | 14,508 | 2.1% |
| Fiji | 36 | 0.0% |
| France | 234 | 0.0% |
| Germany | 705 | 0.1% |
| Ghana | 1,112 | 0.2% |
| Greece | 386 | 0.1% |
| Guatemala | 537 | 0.1% |
| Haiti | 272 | 0.0% |
| Honduras | 201 | 0.0% |
| Hong Kong | 49 | 0.0% |
| Hungary | 90 | 0.0% |
| India | 10,539 | 1.5% |
| Indonesia | 48 | 0.0% |
| Iran | 104 | 0.0% |
| Iraq | 71 | 0.0% |
| Ireland | 349 | 0.1% |
| Israel | 121 | 0.0% |
| Italy | 573 | 0.1% |
| Jamaica | 301 | 0.0% |
| Japan | 226 | 0.0% |
| Jordan | 643 | 0.1% |
| Kazakhstan | 203 | 0.0% |
| Kenya | 293 | 0.0% |
| Korea | 1,043 | 0.2% |
| Kuwait | 97 | 0.0% |
| Laos | 226 | 0.0% |
| Latin America | 39,855 | 5.7% |
| Latvia | 16 | 0.0% |
| Lebanon | 183 | 0.0% |
| Liberia | 91 | 0.0% |
| Lithuania | 1,329 | 0.2% |
| Malaysia | 122 | 0.0% |
| Mexico | 35,190 | 5.1% |
| Middle Africa | 285 | 0.0% |
| Moldova | 668 | 0.1% |
| Morocco | 575 | 0.1% |
| Nepal | 166 | 0.0% |
| Netherlands | 99 | 0.0% |
| Nicaragua | 84 | 0.0% |
| Nigeria | 1,929 | 0.3% |
| North Macedonia | 278 | 0.0% |
| Northern Africa | 1,168 | 0.2% |
| Northern Europe | 1,387 | 0.2% |
| Oceania | 146 | 0.0% |
| Pakistan | 1,819 | 0.3% |
| Panama | 60 | 0.0% |
| Peru | 326 | 0.1% |
| Philippines | 5,238 | 0.7% |
| Poland | 5,400 | 0.8% |
| Romania | 356 | 0.1% |
| Russia | 363 | 0.1% |
| Saudi Arabia | 106 | 0.0% |
| Scotland | 56 | 0.0% |
| Senegal | 64 | 0.0% |
| Serbia | 172 | 0.0% |
| Singapore | 54 | 0.0% |
| South Africa | 103 | 0.0% |
| South America | 2,239 | 0.3% |
| South Central Asia | 13,667 | 2.0% |
| South Eastern Asia | 7,396 | 1.1% |
| Southern Europe | 1,025 | 0.2% |
| Spain | 66 | 0.0% |
| Sri Lanka | 38 | 0.0% |
| Sudan | 10 | 0.0% |
| Sweden | 10 | 0.0% |
| Switzerland | 31 | 0.0% |
| Syria | 45 | 0.0% |
| Taiwan | 447 | 0.1% |
| Thailand | 333 | 0.1% |
| Trinidad and Tobago | 162 | 0.0% |
| Turkey | 177 | 0.0% |
| Uganda | 138 | 0.0% |
| Ukraine | 681 | 0.1% |
| Uruguay | 15 | 0.0% |
| Uzbekistan | 434 | 0.1% |
| Venezuela | 510 | 0.1% |
| Vietnam | 1,042 | 0.2% |
| Western Africa | 3,419 | 0.5% |
| Western Asia | 1,611 | 0.2% |
| Western Europe | 1,139 | 0.2% |
| Yemen | 4 | 0.0% |
| Zaire | 40 | 0.0% | View All 121 Rows |
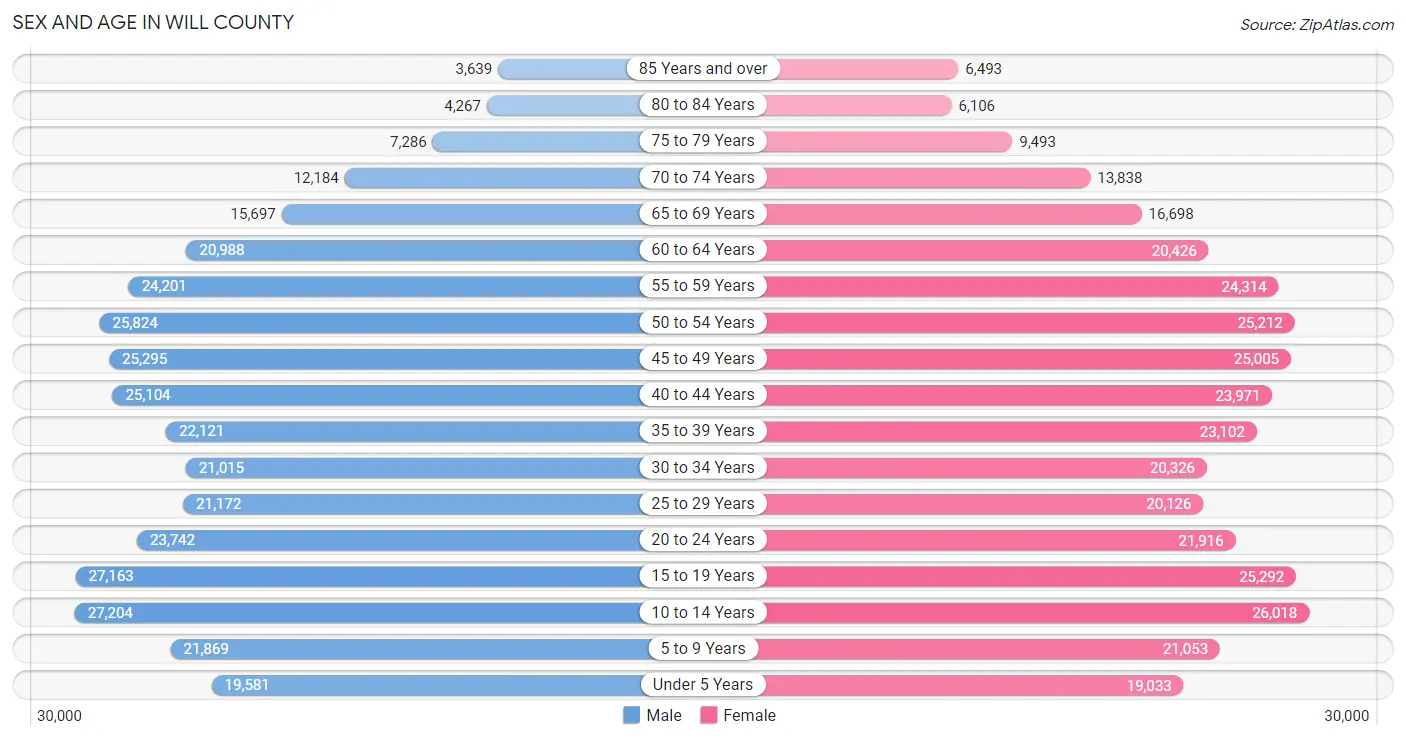
Sex and Age in Will County
Sex and Age in Will County
The most populous age groups in Will County are 10 to 14 Years (27,204 | 7.8%) for men and 10 to 14 Years (26,018 | 7.5%) for women.
| Age Bracket | Male | Female |
| Under 5 Years | 19,581 (5.6%) | 19,033 (5.5%) |
| 5 to 9 Years | 21,869 (6.3%) | 21,053 (6.0%) |
| 10 to 14 Years | 27,204 (7.8%) | 26,018 (7.5%) |
| 15 to 19 Years | 27,163 (7.8%) | 25,292 (7.3%) |
| 20 to 24 Years | 23,742 (6.8%) | 21,916 (6.3%) |
| 25 to 29 Years | 21,172 (6.1%) | 20,126 (5.8%) |
| 30 to 34 Years | 21,015 (6.0%) | 20,326 (5.8%) |
| 35 to 39 Years | 22,121 (6.4%) | 23,102 (6.6%) |
| 40 to 44 Years | 25,104 (7.2%) | 23,971 (6.9%) |
| 45 to 49 Years | 25,295 (7.3%) | 25,005 (7.2%) |
| 50 to 54 Years | 25,824 (7.4%) | 25,212 (7.2%) |
| 55 to 59 Years | 24,201 (7.0%) | 24,314 (7.0%) |
| 60 to 64 Years | 20,988 (6.0%) | 20,426 (5.9%) |
| 65 to 69 Years | 15,697 (4.5%) | 16,698 (4.8%) |
| 70 to 74 Years | 12,184 (3.5%) | 13,838 (4.0%) |
| 75 to 79 Years | 7,286 (2.1%) | 9,493 (2.7%) |
| 80 to 84 Years | 4,267 (1.2%) | 6,106 (1.8%) |
| 85 Years and over | 3,639 (1.0%) | 6,493 (1.9%) |
| Total | 348,352 (100.0%) | 348,422 (100.0%) |
Families and Households in Will County
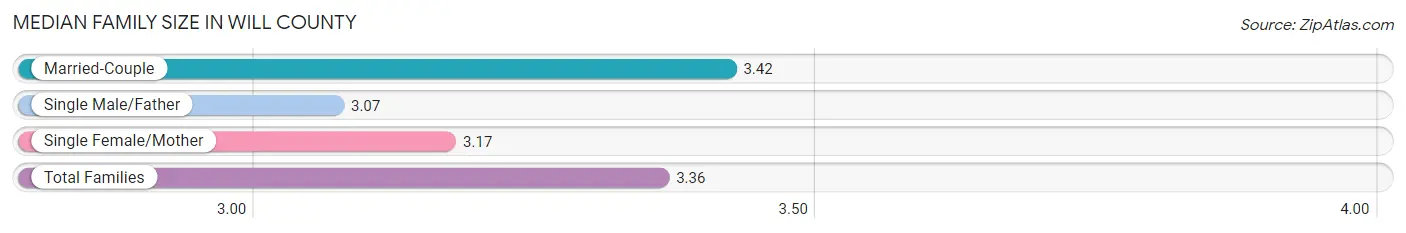
Median Family Size in Will County
The median family size in Will County is 3.36 persons per family, with married-couple families (141,261 | 79.0%) accounting for the largest median family size of 3.42 persons per family. On the other hand, single male/father families (11,208 | 6.3%) represent the smallest median family size with 3.07 persons per family.
| Family Type | # Families | Family Size |
| Married-Couple | 141,261 (79.0%) | 3.42 |
| Single Male/Father | 11,208 (6.3%) | 3.07 |
| Single Female/Mother | 26,409 (14.8%) | 3.17 |
| Total Families | 178,878 (100.0%) | 3.36 |
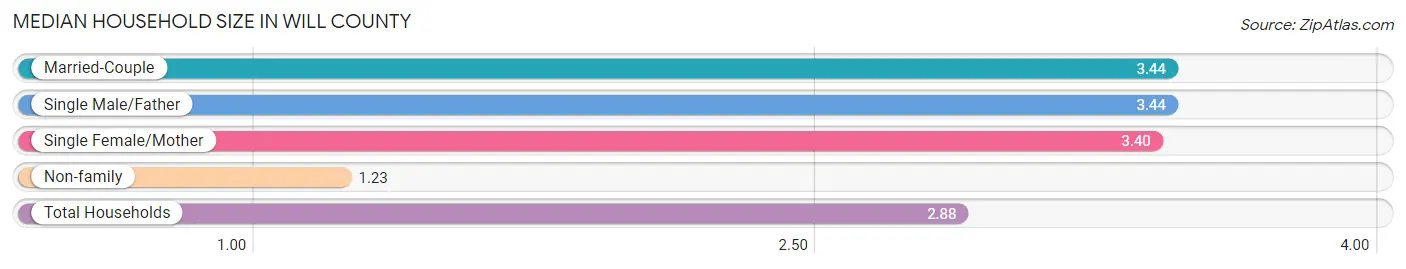
Median Household Size in Will County
The median household size in Will County is 2.88 persons per household, with married-couple households (141,261 | 59.1%) accounting for the largest median household size of 3.44 persons per household. non-family households (60,186 | 25.2%) represent the smallest median household size with 1.23 persons per household.
| Household Type | # Households | Household Size |
| Married-Couple | 141,261 (59.1%) | 3.44 |
| Single Male/Father | 11,208 (4.7%) | 3.44 |
| Single Female/Mother | 26,409 (11.1%) | 3.40 |
| Non-family | 60,186 (25.2%) | 1.23 |
| Total Households | 239,064 (100.0%) | 2.88 |
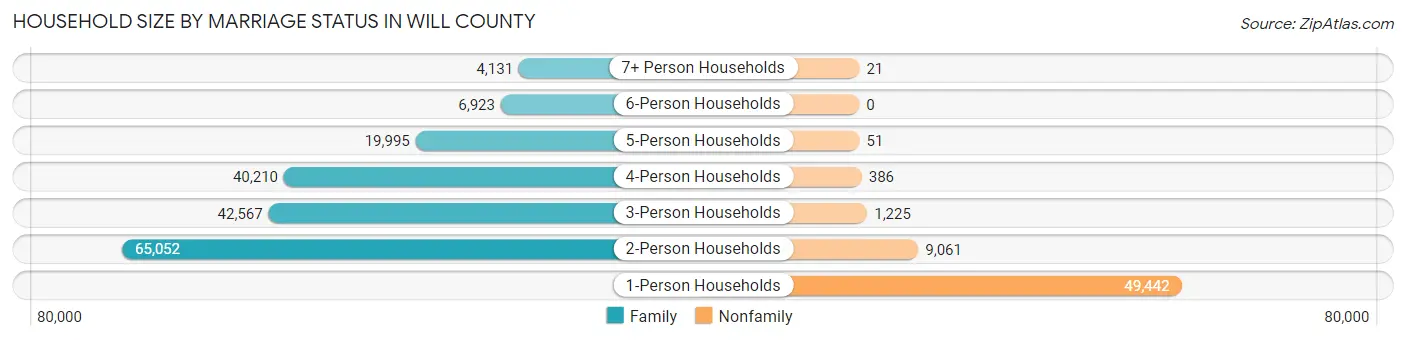
Household Size by Marriage Status in Will County
Out of a total of 239,064 households in Will County, 178,878 (74.8%) are family households, while 60,186 (25.2%) are nonfamily households. The most numerous type of family households are 2-person households, comprising 65,052, and the most common type of nonfamily households are 1-person households, comprising 49,442.
| Household Size | Family Households | Nonfamily Households |
| 1-Person Households | - | 49,442 (20.7%) |
| 2-Person Households | 65,052 (27.2%) | 9,061 (3.8%) |
| 3-Person Households | 42,567 (17.8%) | 1,225 (0.5%) |
| 4-Person Households | 40,210 (16.8%) | 386 (0.2%) |
| 5-Person Households | 19,995 (8.4%) | 51 (0.0%) |
| 6-Person Households | 6,923 (2.9%) | 0 (0.0%) |
| 7+ Person Households | 4,131 (1.7%) | 21 (0.0%) |
| Total | 178,878 (74.8%) | 60,186 (25.2%) |
Female Fertility in Will County
Fertility by Age in Will County
Average fertility rate in Will County is 54.0 births per 1,000 women. Women in the age bracket of 20 to 34 years have the highest fertility rate with 97.0 births per 1,000 women. Women in the age bracket of 20 to 34 years acount for 68.1% of all women with births.
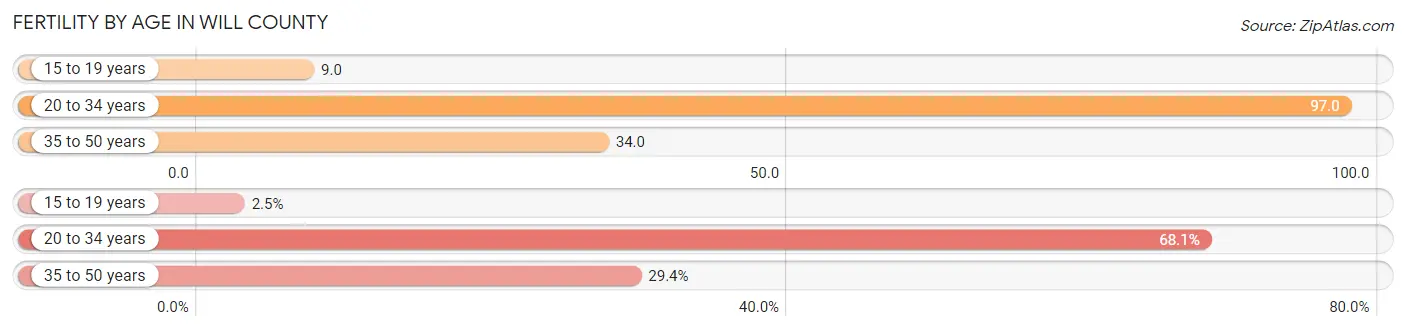
| Age Bracket | Women with Births | Births / 1,000 Women |
| 15 to 19 years | 222 (2.5%) | 9.0 |
| 20 to 34 years | 6,063 (68.1%) | 97.0 |
| 35 to 50 years | 2,618 (29.4%) | 34.0 |
| Total | 8,903 (100.0%) | 54.0 |
Fertility by Age by Marriage Status in Will County
78.5% of women with births (8,903) in Will County are married. The highest percentage of unmarried women with births falls into 15 to 19 years age bracket with 76.6% of them unmarried at the time of birth, while the lowest percentage of unmarried women with births belong to 35 to 50 years age bracket with 8.2% of them unmarried.
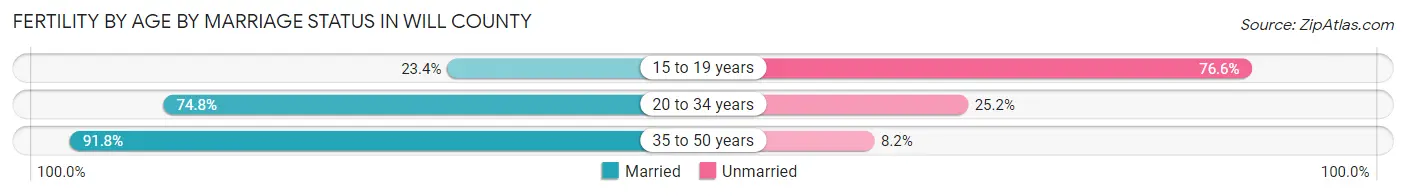
| Age Bracket | Married | Unmarried |
| 15 to 19 years | 52 (23.4%) | 170 (76.6%) |
| 20 to 34 years | 4,535 (74.8%) | 1,528 (25.2%) |
| 35 to 50 years | 2,403 (91.8%) | 215 (8.2%) |
| Total | 6,989 (78.5%) | 1,914 (21.5%) |
Fertility by Education in Will County
Average fertility rate in Will County is 54.0 births per 1,000 women. Women with the education attainment of bachelor's degree have the highest fertility rate of 62.0 births per 1,000 women, while women with the education attainment of less than high school have the lowest fertility at 34.0 births per 1,000 women. Women with the education attainment of college or associate's degree represent 31.0% of all women with births.
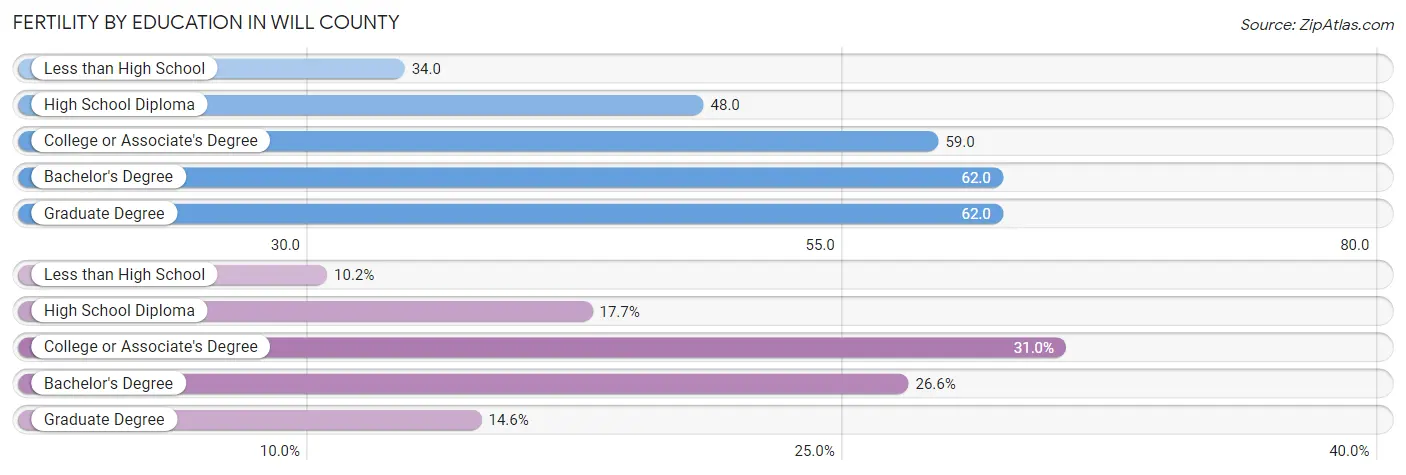
| Educational Attainment | Women with Births | Births / 1,000 Women |
| Less than High School | 910 (10.2%) | 34.0 |
| High School Diploma | 1,574 (17.7%) | 48.0 |
| College or Associate's Degree | 2,758 (31.0%) | 59.0 |
| Bachelor's Degree | 2,365 (26.6%) | 62.0 |
| Graduate Degree | 1,296 (14.6%) | 62.0 |
| Total | 8,903 (100.0%) | 54.0 |
Fertility by Education by Marriage Status in Will County
21.5% of women with births in Will County are unmarried. Women with the educational attainment of graduate degree are most likely to be married with 97.1% of them married at childbirth, while women with the educational attainment of high school diploma are least likely to be married with 44.5% of them unmarried at childbirth.
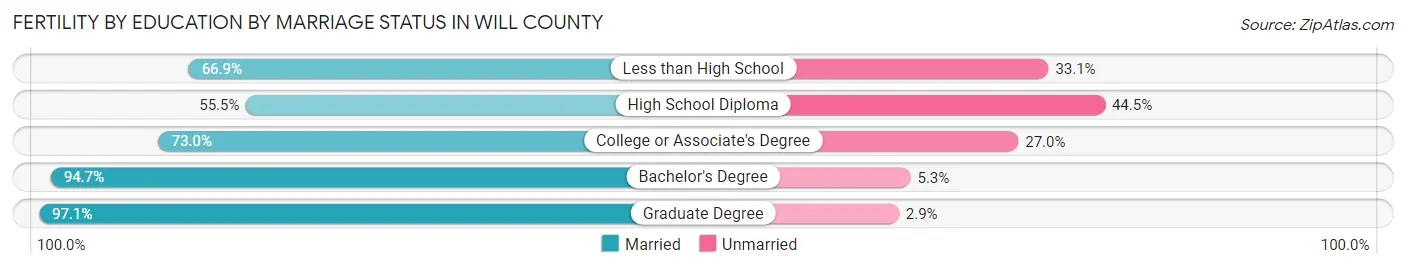
| Educational Attainment | Married | Unmarried |
| Less than High School | 609 (66.9%) | 301 (33.1%) |
| High School Diploma | 874 (55.5%) | 700 (44.5%) |
| College or Associate's Degree | 2,013 (73.0%) | 745 (27.0%) |
| Bachelor's Degree | 2,240 (94.7%) | 125 (5.3%) |
| Graduate Degree | 1,258 (97.1%) | 38 (2.9%) |
| Total | 6,989 (78.5%) | 1,914 (21.5%) |
Income in Will County
Income Overview in Will County
Per Capita Income in Will County is $44,356, while median incomes of families and households are $119,675 and $103,678 respectively.
| Characteristic | Number | Measure |
| Per Capita Income | 696,774 | $44,356 |
| Median Family Income | 178,878 | $119,675 |
| Mean Family Income | 178,878 | $141,799 |
| Median Household Income | 239,064 | $103,678 |
| Mean Household Income | 239,064 | $126,188 |
| Income Deficit | 178,878 | $12,072 |
| Wage / Income Gap (%) | 696,774 | 36.48% |
| Wage / Income Gap ($) | 696,774 | 63.52¢ per $1 |
| Gini / Inequality Index | 696,774 | 0.41 |
Earnings by Sex in Will County
Average Earnings in Will County are $48,108, $59,357 for men and $37,705 for women, a difference of 36.5%.

| Sex | Number | Average Earnings |
| Male | 208,265 (53.2%) | $59,357 |
| Female | 183,324 (46.8%) | $37,705 |
| Total | 391,589 (100.0%) | $48,108 |
Earnings by Sex by Income Bracket in Will County
The most common earnings brackets in Will County are $100,000+ for men (55,813 | 26.8%) and $100,000+ for women (20,149 | 11.0%).
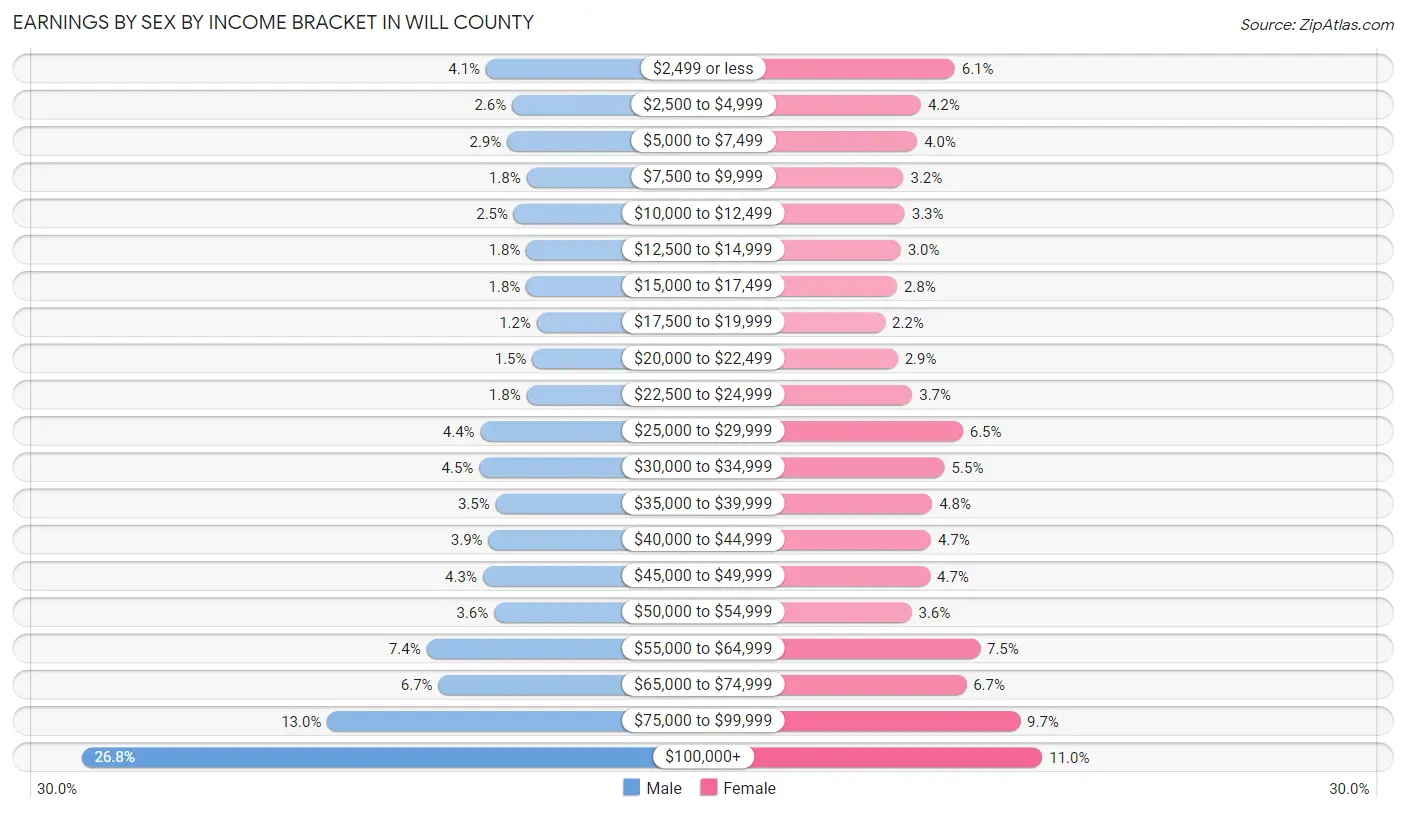
| Income | Male | Female |
| $2,499 or less | 8,475 (4.1%) | 11,123 (6.1%) |
| $2,500 to $4,999 | 5,416 (2.6%) | 7,646 (4.2%) |
| $5,000 to $7,499 | 6,006 (2.9%) | 7,251 (4.0%) |
| $7,500 to $9,999 | 3,730 (1.8%) | 5,841 (3.2%) |
| $10,000 to $12,499 | 5,213 (2.5%) | 5,975 (3.3%) |
| $12,500 to $14,999 | 3,741 (1.8%) | 5,558 (3.0%) |
| $15,000 to $17,499 | 3,763 (1.8%) | 5,172 (2.8%) |
| $17,500 to $19,999 | 2,529 (1.2%) | 3,949 (2.1%) |
| $20,000 to $22,499 | 3,032 (1.5%) | 5,251 (2.9%) |
| $22,500 to $24,999 | 3,730 (1.8%) | 6,749 (3.7%) |
| $25,000 to $29,999 | 9,117 (4.4%) | 11,960 (6.5%) |
| $30,000 to $34,999 | 9,277 (4.4%) | 10,088 (5.5%) |
| $35,000 to $39,999 | 7,353 (3.5%) | 8,796 (4.8%) |
| $40,000 to $44,999 | 8,189 (3.9%) | 8,670 (4.7%) |
| $45,000 to $49,999 | 8,847 (4.3%) | 8,578 (4.7%) |
| $50,000 to $54,999 | 7,516 (3.6%) | 6,673 (3.6%) |
| $55,000 to $64,999 | 15,429 (7.4%) | 13,733 (7.5%) |
| $65,000 to $74,999 | 14,044 (6.7%) | 12,298 (6.7%) |
| $75,000 to $99,999 | 27,045 (13.0%) | 17,864 (9.7%) |
| $100,000+ | 55,813 (26.8%) | 20,149 (11.0%) |
| Total | 208,265 (100.0%) | 183,324 (100.0%) |
Earnings by Sex by Educational Attainment in Will County
Average earnings in Will County are $70,532 for men and $45,460 for women, a difference of 35.5%. Men with an educational attainment of graduate degree enjoy the highest average annual earnings of $116,584, while those with less than high school education earn the least with $39,870. Women with an educational attainment of graduate degree earn the most with the average annual earnings of $74,773, while those with less than high school education have the smallest earnings of $24,944.
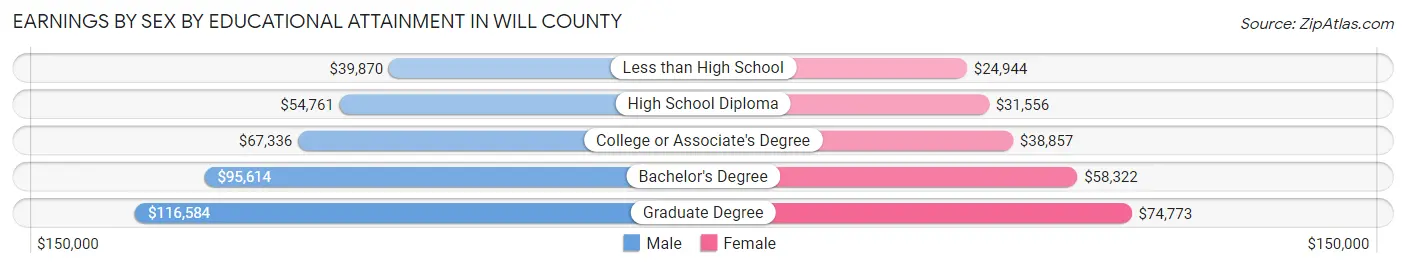
| Educational Attainment | Male Income | Female Income |
| Less than High School | $39,870 | $24,944 |
| High School Diploma | $54,761 | $31,556 |
| College or Associate's Degree | $67,336 | $38,857 |
| Bachelor's Degree | $95,614 | $58,322 |
| Graduate Degree | $116,584 | $74,773 |
| Total | $70,532 | $45,460 |
Family Income in Will County
Family Income Brackets in Will County
According to the Will County family income data, there are 44,898 families falling into the $100,000 to $149,999 income range, which is the most common income bracket and makes up 25.1% of all families. Conversely, the $10,000 to $14,999 income bracket is the least frequent group with only 1,789 families (1.0%) belonging to this category.
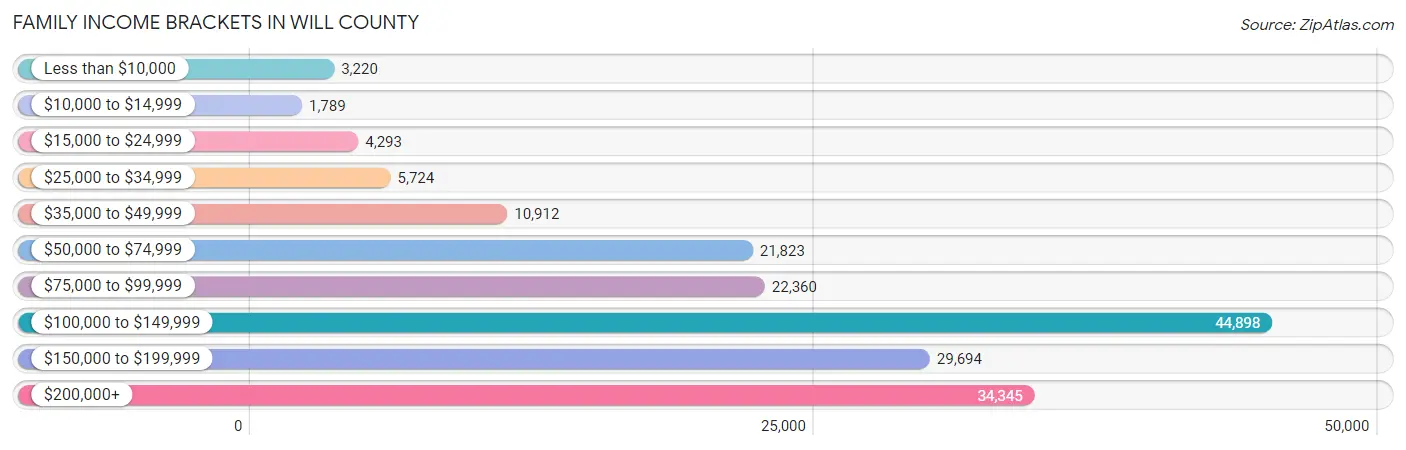
| Income Bracket | # Families | % Families |
| Less than $10,000 | 3,220 | 1.8% |
| $10,000 to $14,999 | 1,789 | 1.0% |
| $15,000 to $24,999 | 4,293 | 2.4% |
| $25,000 to $34,999 | 5,724 | 3.2% |
| $35,000 to $49,999 | 10,912 | 6.1% |
| $50,000 to $74,999 | 21,823 | 12.2% |
| $75,000 to $99,999 | 22,360 | 12.5% |
| $100,000 to $149,999 | 44,898 | 25.1% |
| $150,000 to $199,999 | 29,694 | 16.6% |
| $200,000+ | 34,345 | 19.2% |
Family Income by Famaliy Size in Will County
7+ person families (3,685 | 2.1%) account for the highest median family income in Will County with $139,235 per family, while 2-person families (69,539 | 38.9%) have the highest median income of $50,558 per family member.
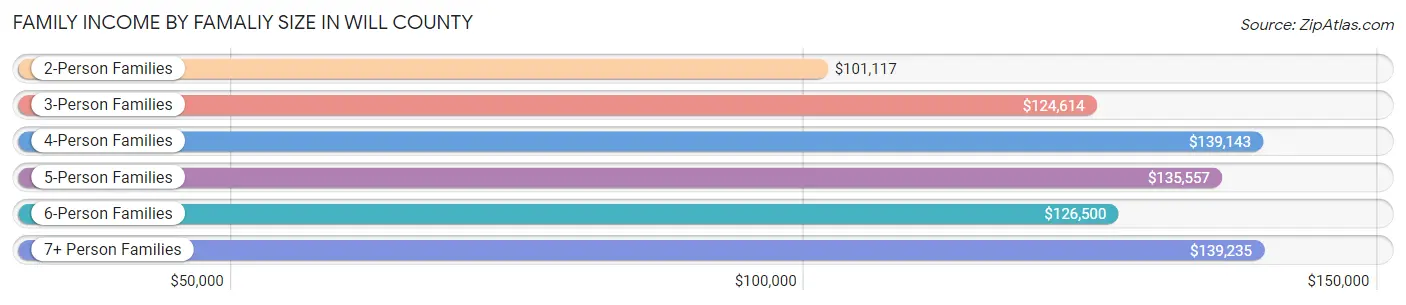
| Income Bracket | # Families | Median Income |
| 2-Person Families | 69,539 (38.9%) | $101,117 |
| 3-Person Families | 41,826 (23.4%) | $124,614 |
| 4-Person Families | 38,785 (21.7%) | $139,143 |
| 5-Person Families | 18,473 (10.3%) | $135,557 |
| 6-Person Families | 6,570 (3.7%) | $126,500 |
| 7+ Person Families | 3,685 (2.1%) | $139,235 |
| Total | 178,878 (100.0%) | $119,675 |
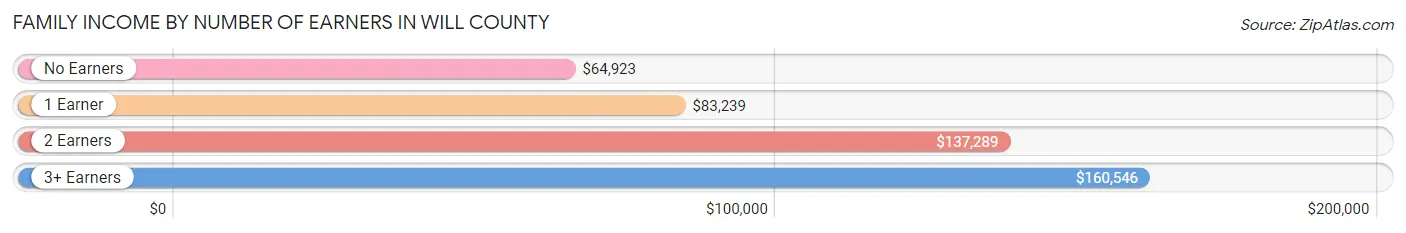
Family Income by Number of Earners in Will County
The median family income in Will County is $119,675, with families comprising 3+ earners (33,164) having the highest median family income of $160,546, while families with no earners (18,782) have the lowest median family income of $64,923, accounting for 18.5% and 10.5% of families, respectively.
| Number of Earners | # Families | Median Income |
| No Earners | 18,782 (10.5%) | $64,923 |
| 1 Earner | 47,733 (26.7%) | $83,239 |
| 2 Earners | 79,199 (44.3%) | $137,289 |
| 3+ Earners | 33,164 (18.5%) | $160,546 |
| Total | 178,878 (100.0%) | $119,675 |
Household Income in Will County
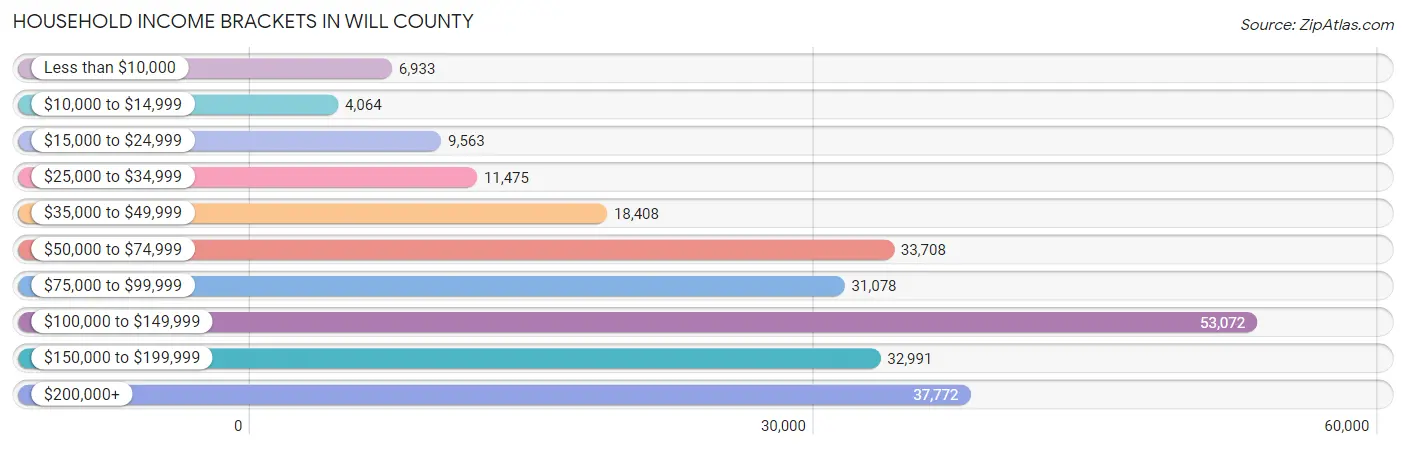
Household Income Brackets in Will County
With 53,072 households falling in the category, the $100,000 to $149,999 income range is the most frequent in Will County, accounting for 22.2% of all households. In contrast, only 4,064 households (1.7%) fall into the $10,000 to $14,999 income bracket, making it the least populous group.
| Income Bracket | # Households | % Households |
| Less than $10,000 | 6,933 | 2.9% |
| $10,000 to $14,999 | 4,064 | 1.7% |
| $15,000 to $24,999 | 9,563 | 4.0% |
| $25,000 to $34,999 | 11,475 | 4.8% |
| $35,000 to $49,999 | 18,408 | 7.7% |
| $50,000 to $74,999 | 33,708 | 14.1% |
| $75,000 to $99,999 | 31,078 | 13.0% |
| $100,000 to $149,999 | 53,072 | 22.2% |
| $150,000 to $199,999 | 32,991 | 13.8% |
| $200,000+ | 37,772 | 15.8% |
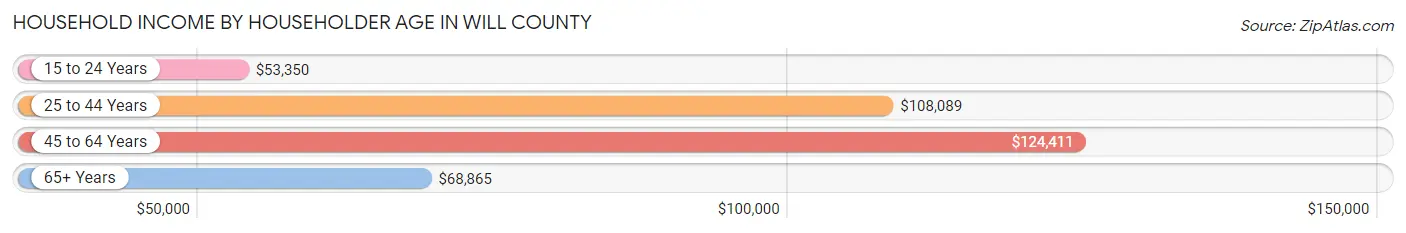
Household Income by Householder Age in Will County
The median household income in Will County is $103,678, with the highest median household income of $124,411 found in the 45 to 64 years age bracket for the primary householder. A total of 101,913 households (42.6%) fall into this category. Meanwhile, the 15 to 24 years age bracket for the primary householder has the lowest median household income of $53,350, with 4,242 households (1.8%) in this group.
| Income Bracket | # Households | Median Income |
| 15 to 24 Years | 4,242 (1.8%) | $53,350 |
| 25 to 44 Years | 76,872 (32.2%) | $108,089 |
| 45 to 64 Years | 101,913 (42.6%) | $124,411 |
| 65+ Years | 56,037 (23.4%) | $68,865 |
| Total | 239,064 (100.0%) | $103,678 |
Poverty in Will County
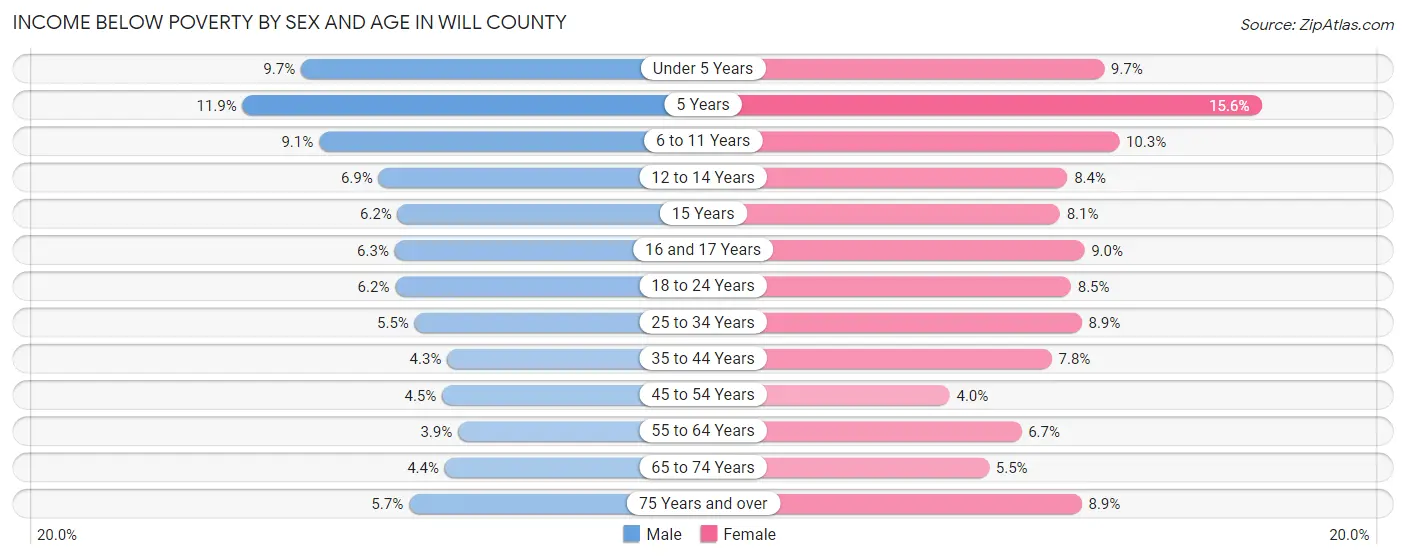
Income Below Poverty by Sex and Age in Will County
With 5.7% poverty level for males and 7.6% for females among the residents of Will County, 5 year old males and 5 year old females are the most vulnerable to poverty, with 541 males (11.9%) and 648 females (15.6%) in their respective age groups living below the poverty level.
| Age Bracket | Male | Female |
| Under 5 Years | 1,887 (9.7%) | 1,799 (9.7%) |
| 5 Years | 541 (11.9%) | 648 (15.6%) |
| 6 to 11 Years | 2,495 (9.1%) | 2,677 (10.3%) |
| 12 to 14 Years | 1,116 (6.9%) | 1,377 (8.4%) |
| 15 Years | 373 (6.1%) | 447 (8.1%) |
| 16 and 17 Years | 687 (6.3%) | 962 (9.0%) |
| 18 to 24 Years | 2,050 (6.2%) | 2,575 (8.5%) |
| 25 to 34 Years | 2,282 (5.5%) | 3,593 (8.9%) |
| 35 to 44 Years | 1,994 (4.3%) | 3,663 (7.8%) |
| 45 to 54 Years | 2,270 (4.5%) | 2,005 (4.0%) |
| 55 to 64 Years | 1,749 (3.9%) | 2,972 (6.7%) |
| 65 to 74 Years | 1,212 (4.4%) | 1,650 (5.5%) |
| 75 Years and over | 848 (5.7%) | 1,865 (8.9%) |
| Total | 19,504 (5.7%) | 26,233 (7.6%) |
Income Above Poverty by Sex and Age in Will County
According to the poverty statistics in Will County, males aged 55 to 64 years and females aged 45 to 54 years are the age groups that are most secure financially, with 96.1% of males and 96.0% of females in these age groups living above the poverty line.
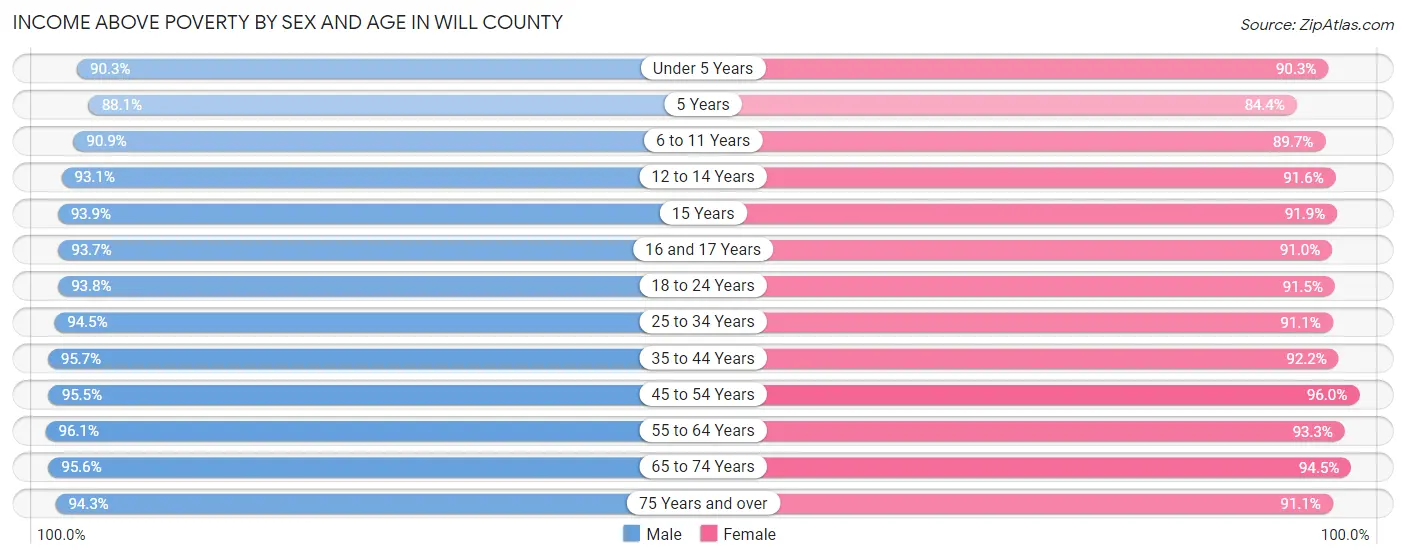
| Age Bracket | Male | Female |
| Under 5 Years | 17,483 (90.3%) | 16,681 (90.3%) |
| 5 Years | 4,003 (88.1%) | 3,513 (84.4%) |
| 6 to 11 Years | 25,019 (90.9%) | 23,346 (89.7%) |
| 12 to 14 Years | 15,158 (93.1%) | 15,074 (91.6%) |
| 15 Years | 5,693 (93.9%) | 5,080 (91.9%) |
| 16 and 17 Years | 10,284 (93.7%) | 9,726 (91.0%) |
| 18 to 24 Years | 30,783 (93.8%) | 27,718 (91.5%) |
| 25 to 34 Years | 39,023 (94.5%) | 36,786 (91.1%) |
| 35 to 44 Years | 44,259 (95.7%) | 43,372 (92.2%) |
| 45 to 54 Years | 48,199 (95.5%) | 48,139 (96.0%) |
| 55 to 64 Years | 42,953 (96.1%) | 41,658 (93.3%) |
| 65 to 74 Years | 26,328 (95.6%) | 28,567 (94.5%) |
| 75 Years and over | 13,951 (94.3%) | 19,094 (91.1%) |
| Total | 323,136 (94.3%) | 318,754 (92.4%) |
Income Below Poverty Among Married-Couple Families in Will County
The poverty statistics for married-couple families in Will County show that 2.3% or 3,220 of the total 141,261 families live below the poverty line. Families with 5 or more children have the highest poverty rate of 8.6%, comprising of 76 families. On the other hand, families with 1 or 2 children have the lowest poverty rate of 1.7%, which includes 899 families.

| Children | Above Poverty | Below Poverty |
| No Children | 74,056 (98.1%) | 1,462 (1.9%) |
| 1 or 2 Children | 50,996 (98.3%) | 899 (1.7%) |
| 3 or 4 Children | 12,177 (94.0%) | 783 (6.0%) |
| 5 or more Children | 812 (91.4%) | 76 (8.6%) |
| Total | 138,041 (97.7%) | 3,220 (2.3%) |
Income Below Poverty Among Single-Parent Households in Will County
According to the poverty data in Will County, 6.4% or 722 single-father households and 18.3% or 4,838 single-mother households are living below the poverty line. Among single-father households, those with 5 or more children have the highest poverty rate, with 25 households (25.3%) experiencing poverty. Likewise, among single-mother households, those with 5 or more children have the highest poverty rate, with 180 households (58.6%) falling below the poverty line.
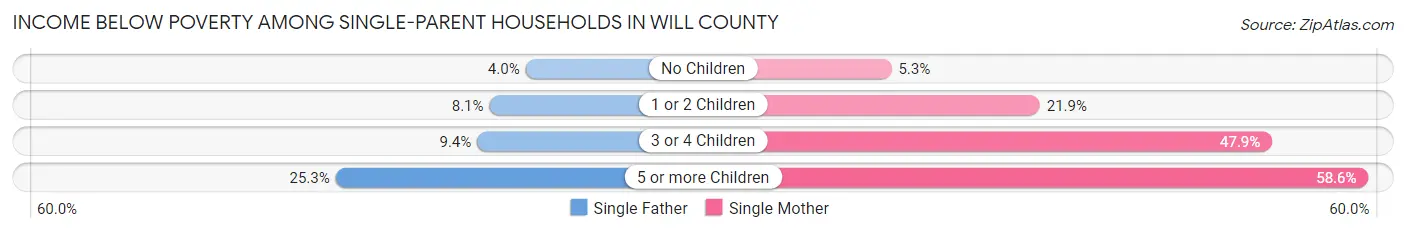
| Children | Single Father | Single Mother |
| No Children | 210 (4.0%) | 565 (5.3%) |
| 1 or 2 Children | 395 (8.1%) | 2,818 (21.9%) |
| 3 or 4 Children | 92 (9.4%) | 1,275 (47.9%) |
| 5 or more Children | 25 (25.3%) | 180 (58.6%) |
| Total | 722 (6.4%) | 4,838 (18.3%) |
Income Below Poverty Among Married-Couple vs Single-Parent Households in Will County
The poverty data for Will County shows that 3,220 of the married-couple family households (2.3%) and 5,560 of the single-parent households (14.8%) are living below the poverty level. Within the married-couple family households, those with 5 or more children have the highest poverty rate, with 76 households (8.6%) falling below the poverty line. Among the single-parent households, those with 5 or more children have the highest poverty rate, with 205 household (50.5%) living below poverty.
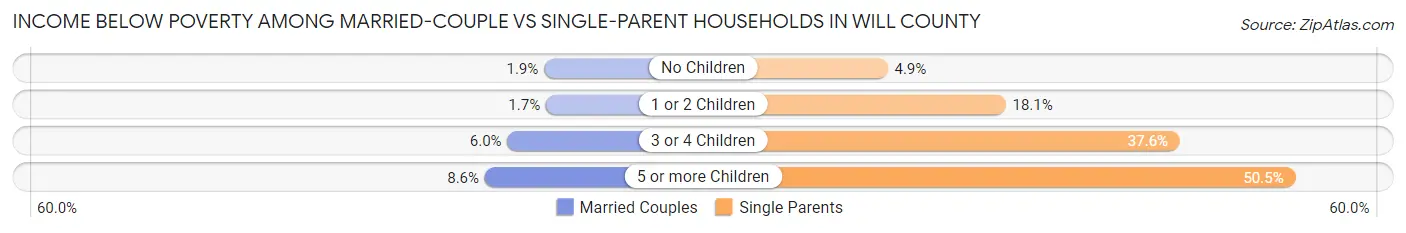
| Children | Married-Couple Families | Single-Parent Households |
| No Children | 1,462 (1.9%) | 775 (4.9%) |
| 1 or 2 Children | 899 (1.7%) | 3,213 (18.1%) |
| 3 or 4 Children | 783 (6.0%) | 1,367 (37.6%) |
| 5 or more Children | 76 (8.6%) | 205 (50.5%) |
| Total | 3,220 (2.3%) | 5,560 (14.8%) |
Employment Characteristics in Will County
Employment by Class of Employer in Will County
Among the 352,432 employed individuals in Will County, private company employees (256,493 | 72.8%), local government employees (27,952 | 7.9%), and not-for-profit organizations (24,679 | 7.0%) make up the most common classes of employment.
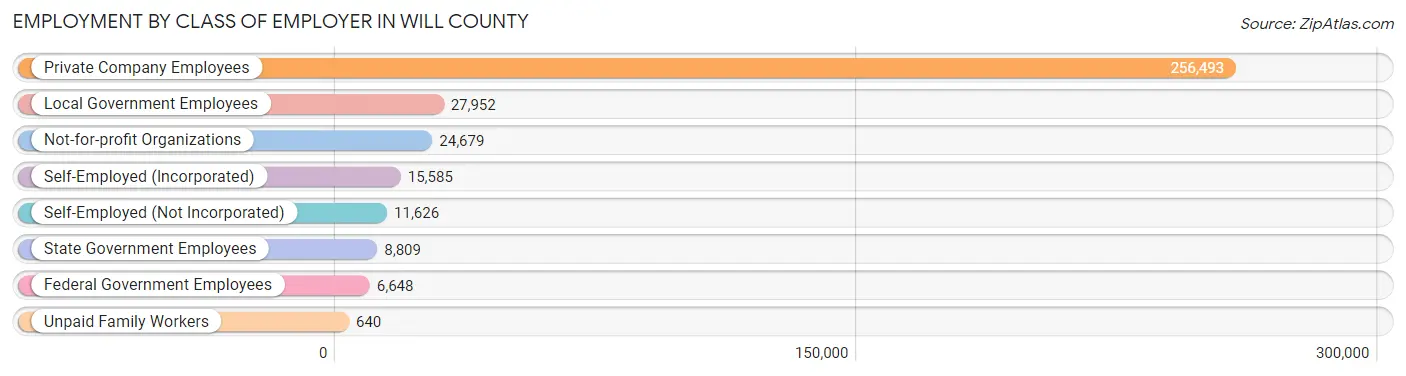
| Employer Class | # Employees | % Employees |
| Private Company Employees | 256,493 | 72.8% |
| Self-Employed (Incorporated) | 15,585 | 4.4% |
| Self-Employed (Not Incorporated) | 11,626 | 3.3% |
| Not-for-profit Organizations | 24,679 | 7.0% |
| Local Government Employees | 27,952 | 7.9% |
| State Government Employees | 8,809 | 2.5% |
| Federal Government Employees | 6,648 | 1.9% |
| Unpaid Family Workers | 640 | 0.2% |
| Total | 352,432 | 100.0% |
Employment Status by Age in Will County
According to the labor force statistics for Will County, out of the total population over 16 years of age (550,402), 68.8% or 378,677 individuals are in the labor force, with 5.0% or 18,934 of them unemployed. The age group with the highest labor force participation rate is 35 to 44 years, with 86.6% or 81,662 individuals in the labor force. Within the labor force, the 16 to 19 years age range has the highest percentage of unemployed individuals, with 13.0% or 2,464 of them being unemployed.
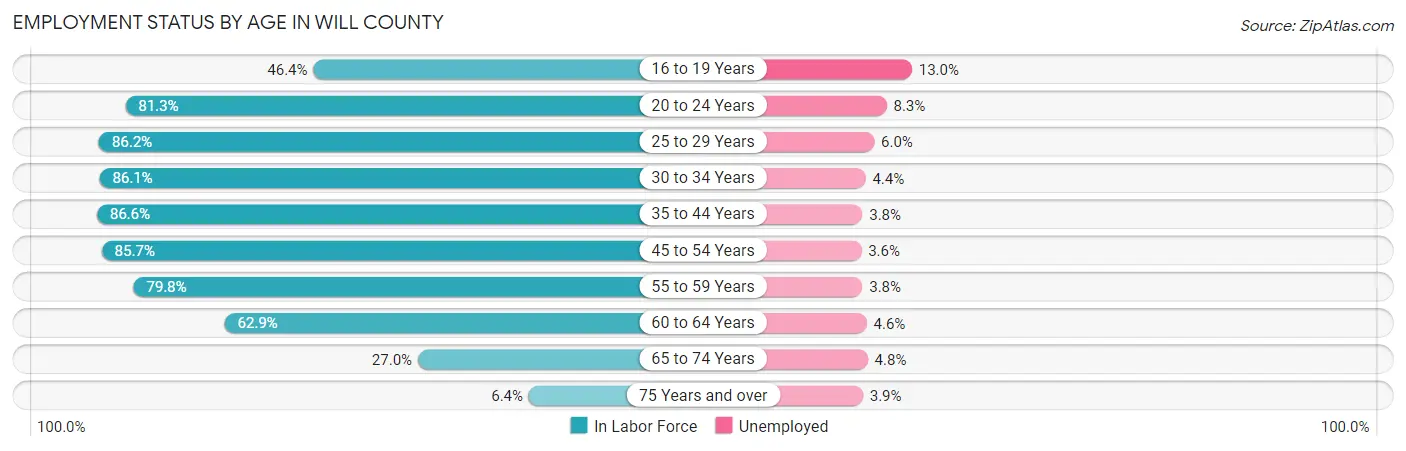
| Age Bracket | In Labor Force | Unemployed |
| 16 to 19 Years | 18,950 (46.4%) | 2,464 (13.0%) |
| 20 to 24 Years | 37,120 (81.3%) | 3,081 (8.3%) |
| 25 to 29 Years | 35,599 (86.2%) | 2,136 (6.0%) |
| 30 to 34 Years | 35,595 (86.1%) | 1,566 (4.4%) |
| 35 to 44 Years | 81,662 (86.6%) | 3,103 (3.8%) |
| 45 to 54 Years | 86,845 (85.7%) | 3,126 (3.6%) |
| 55 to 59 Years | 38,715 (79.8%) | 1,471 (3.8%) |
| 60 to 64 Years | 26,049 (62.9%) | 1,198 (4.6%) |
| 65 to 74 Years | 15,773 (27.0%) | 757 (4.8%) |
| 75 Years and over | 2,386 (6.4%) | 93 (3.9%) |
| Total | 378,677 (68.8%) | 18,934 (5.0%) |
Employment Status by Educational Attainment in Will County
According to labor force statistics for Will County, 82.7% of individuals (304,503) out of the total population between 25 and 64 years of age (368,202) are in the labor force, with 4.1% or 12,485 of them being unemployed. The group with the highest labor force participation rate are those with the educational attainment of bachelor's degree or higher, with 88.5% or 124,766 individuals in the labor force. Within the labor force, individuals with less than high school education have the highest percentage of unemployment, with 8.3% or 1,640 of them being unemployed.
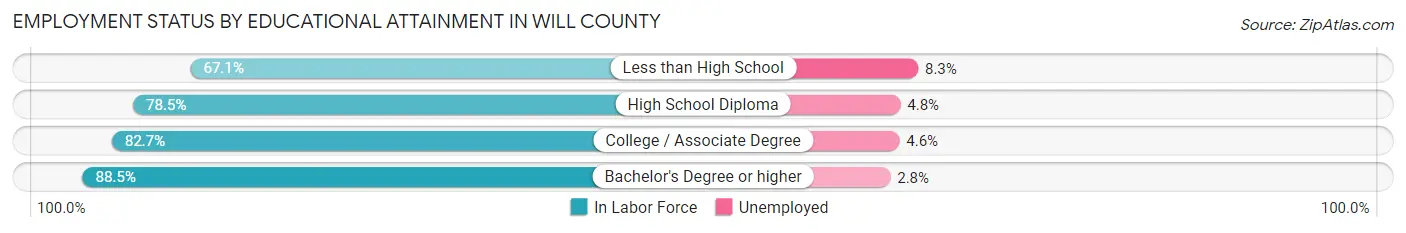
| Educational Attainment | In Labor Force | Unemployed |
| Less than High School | 19,755 (67.1%) | 2,444 (8.3%) |
| High School Diploma | 68,248 (78.5%) | 4,173 (4.8%) |
| College / Associate Degree | 91,667 (82.7%) | 5,099 (4.6%) |
| Bachelor's Degree or higher | 124,766 (88.5%) | 3,947 (2.8%) |
| Total | 304,503 (82.7%) | 15,096 (4.1%) |
Employment Occupations by Sex in Will County
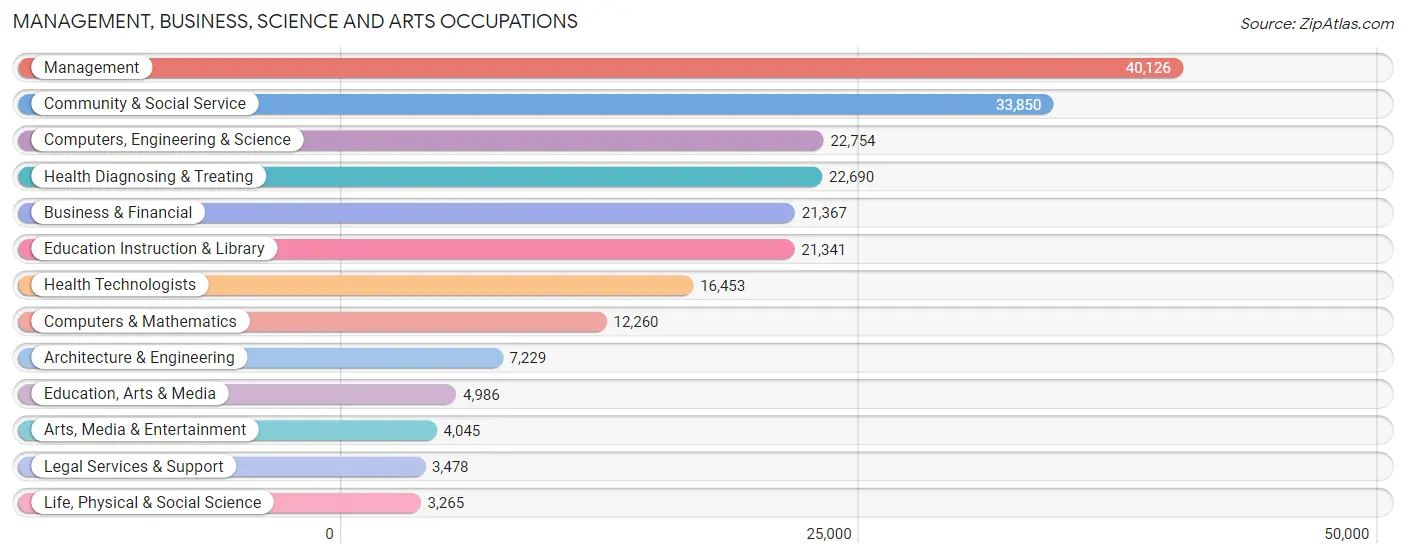
Management, Business, Science and Arts Occupations
The most common Management, Business, Science and Arts occupations in Will County are Management (40,126 | 11.2%), Community & Social Service (33,850 | 9.4%), Computers, Engineering & Science (22,754 | 6.3%), Health Diagnosing & Treating (22,690 | 6.3%), and Business & Financial (21,367 | 5.9%).
Management, Business, Science and Arts Occupations by Sex
Within the Management, Business, Science and Arts occupations in Will County, the most male-oriented occupations are Architecture & Engineering (85.6%), Computers, Engineering & Science (74.0%), and Computers & Mathematics (73.5%), while the most female-oriented occupations are Health Technologists (81.6%), Health Diagnosing & Treating (79.8%), and Education Instruction & Library (77.3%).
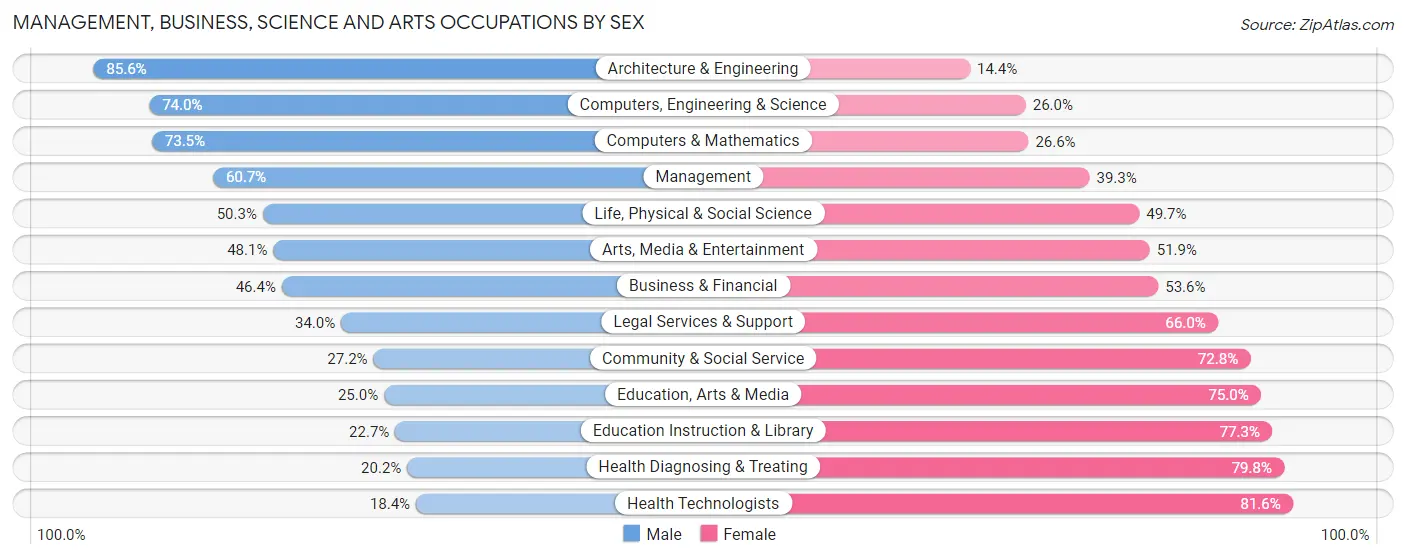
| Occupation | Male | Female |
| Management | 24,355 (60.7%) | 15,771 (39.3%) |
| Business & Financial | 9,905 (46.4%) | 11,462 (53.6%) |
| Computers, Engineering & Science | 16,839 (74.0%) | 5,915 (26.0%) |
| Computers & Mathematics | 9,005 (73.5%) | 3,255 (26.6%) |
| Architecture & Engineering | 6,191 (85.6%) | 1,038 (14.4%) |
| Life, Physical & Social Science | 1,643 (50.3%) | 1,622 (49.7%) |
| Community & Social Service | 9,222 (27.2%) | 24,628 (72.8%) |
| Education, Arts & Media | 1,248 (25.0%) | 3,738 (75.0%) |
| Legal Services & Support | 1,182 (34.0%) | 2,296 (66.0%) |
| Education Instruction & Library | 4,845 (22.7%) | 16,496 (77.3%) |
| Arts, Media & Entertainment | 1,947 (48.1%) | 2,098 (51.9%) |
| Health Diagnosing & Treating | 4,584 (20.2%) | 18,106 (79.8%) |
| Health Technologists | 3,021 (18.4%) | 13,432 (81.6%) |
| Total (Category) | 64,905 (46.1%) | 75,882 (53.9%) |
| Total (Overall) | 191,311 (53.2%) | 168,153 (46.8%) |
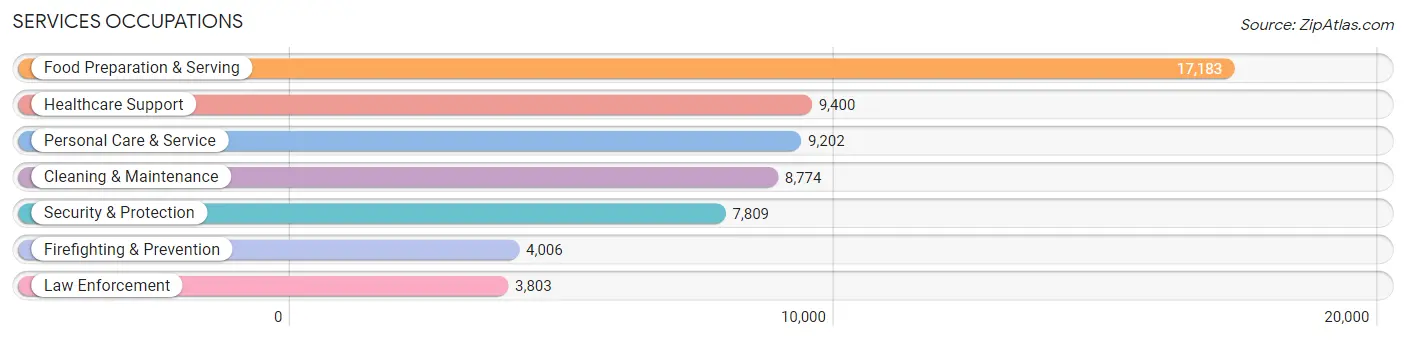
Services Occupations
The most common Services occupations in Will County are Food Preparation & Serving (17,183 | 4.8%), Healthcare Support (9,400 | 2.6%), Personal Care & Service (9,202 | 2.6%), Cleaning & Maintenance (8,774 | 2.4%), and Security & Protection (7,809 | 2.2%).
Services Occupations by Sex
Within the Services occupations in Will County, the most male-oriented occupations are Law Enforcement (83.4%), Security & Protection (77.2%), and Firefighting & Prevention (71.3%), while the most female-oriented occupations are Healthcare Support (86.2%), Personal Care & Service (80.0%), and Food Preparation & Serving (56.5%).

| Occupation | Male | Female |
| Healthcare Support | 1,300 (13.8%) | 8,100 (86.2%) |
| Security & Protection | 6,028 (77.2%) | 1,781 (22.8%) |
| Firefighting & Prevention | 2,855 (71.3%) | 1,151 (28.7%) |
| Law Enforcement | 3,173 (83.4%) | 630 (16.6%) |
| Food Preparation & Serving | 7,471 (43.5%) | 9,712 (56.5%) |
| Cleaning & Maintenance | 5,988 (68.2%) | 2,786 (31.8%) |
| Personal Care & Service | 1,837 (20.0%) | 7,365 (80.0%) |
| Total (Category) | 22,624 (43.2%) | 29,744 (56.8%) |
| Total (Overall) | 191,311 (53.2%) | 168,153 (46.8%) |
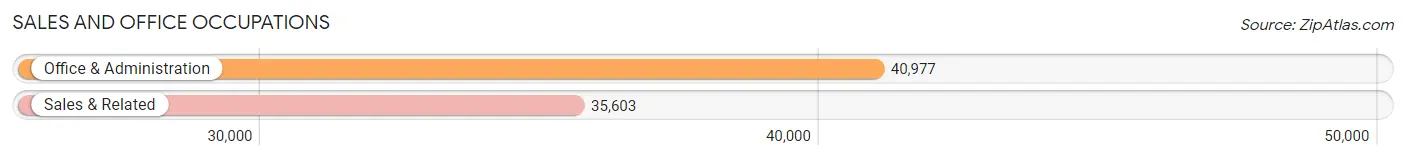
Sales and Office Occupations
The most common Sales and Office occupations in Will County are Office & Administration (40,977 | 11.4%), and Sales & Related (35,603 | 9.9%).
Sales and Office Occupations by Sex
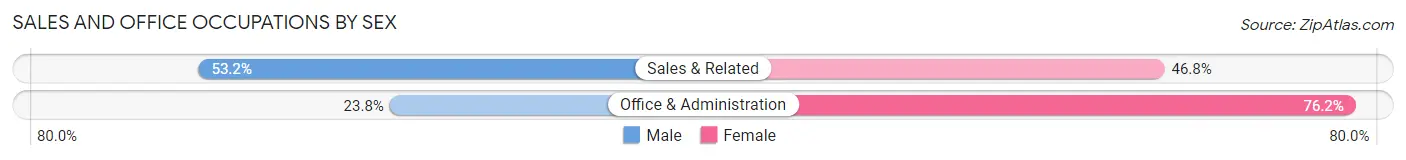
| Occupation | Male | Female |
| Sales & Related | 18,952 (53.2%) | 16,651 (46.8%) |
| Office & Administration | 9,770 (23.8%) | 31,207 (76.2%) |
| Total (Category) | 28,722 (37.5%) | 47,858 (62.5%) |
| Total (Overall) | 191,311 (53.2%) | 168,153 (46.8%) |
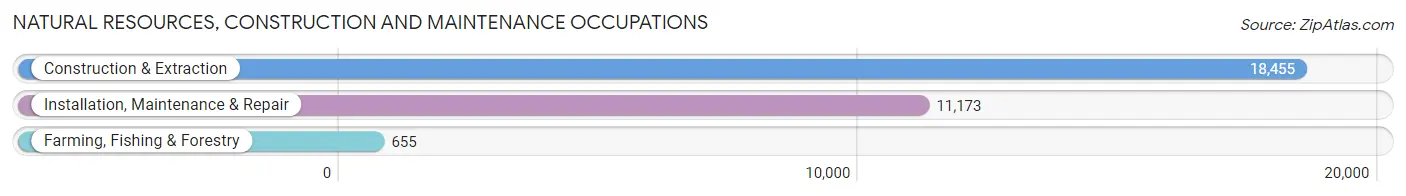
Natural Resources, Construction and Maintenance Occupations
The most common Natural Resources, Construction and Maintenance occupations in Will County are Construction & Extraction (18,455 | 5.1%), Installation, Maintenance & Repair (11,173 | 3.1%), and Farming, Fishing & Forestry (655 | 0.2%).
Natural Resources, Construction and Maintenance Occupations by Sex
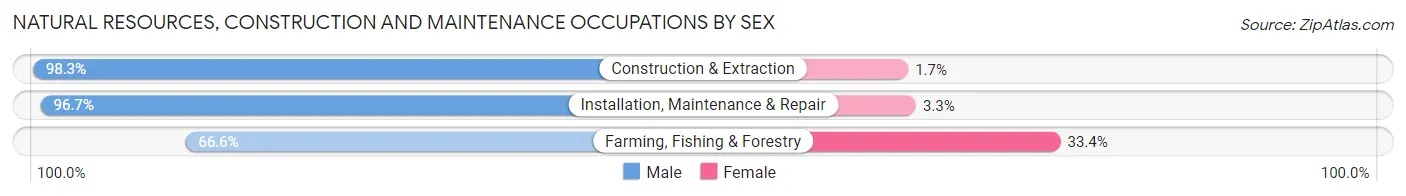
| Occupation | Male | Female |
| Farming, Fishing & Forestry | 436 (66.6%) | 219 (33.4%) |
| Construction & Extraction | 18,138 (98.3%) | 317 (1.7%) |
| Installation, Maintenance & Repair | 10,800 (96.7%) | 373 (3.3%) |
| Total (Category) | 29,374 (97.0%) | 909 (3.0%) |
| Total (Overall) | 191,311 (53.2%) | 168,153 (46.8%) |
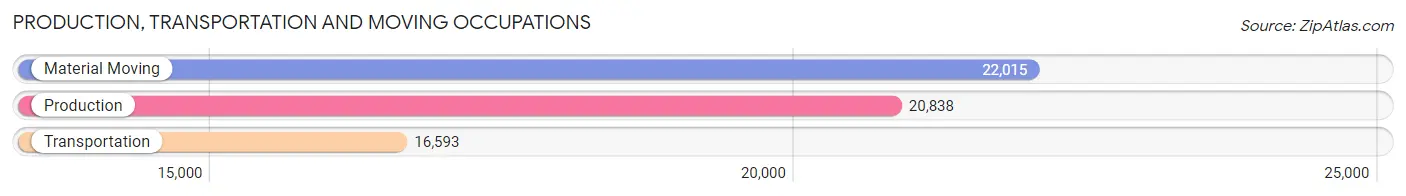
Production, Transportation and Moving Occupations
The most common Production, Transportation and Moving occupations in Will County are Material Moving (22,015 | 6.1%), Production (20,838 | 5.8%), and Transportation (16,593 | 4.6%).
Production, Transportation and Moving Occupations by Sex
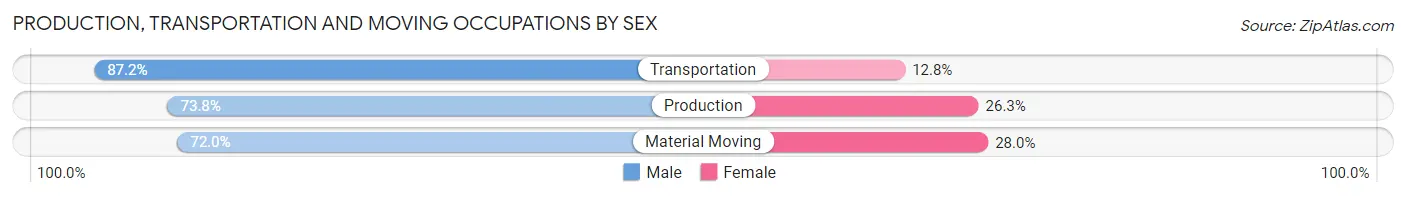
| Occupation | Male | Female |
| Production | 15,367 (73.8%) | 5,471 (26.3%) |
| Transportation | 14,473 (87.2%) | 2,120 (12.8%) |
| Material Moving | 15,846 (72.0%) | 6,169 (28.0%) |
| Total (Category) | 45,686 (76.8%) | 13,760 (23.2%) |
| Total (Overall) | 191,311 (53.2%) | 168,153 (46.8%) |
Employment Industries by Sex in Will County
Employment Industries in Will County
The major employment industries in Will County include Health Care & Social Assistance (46,402 | 12.9%), Retail Trade (41,360 | 11.5%), Manufacturing (39,811 | 11.1%), Educational Services (31,346 | 8.7%), and Transportation & Warehousing (30,026 | 8.4%).

Employment Industries by Sex in Will County
The Will County industries that see more men than women are Construction (91.1%), Utilities (81.4%), and Transportation & Warehousing (74.4%), whereas the industries that tend to have a higher number of women are Health Care & Social Assistance (81.2%), Educational Services (71.8%), and Finance & Insurance (57.0%).
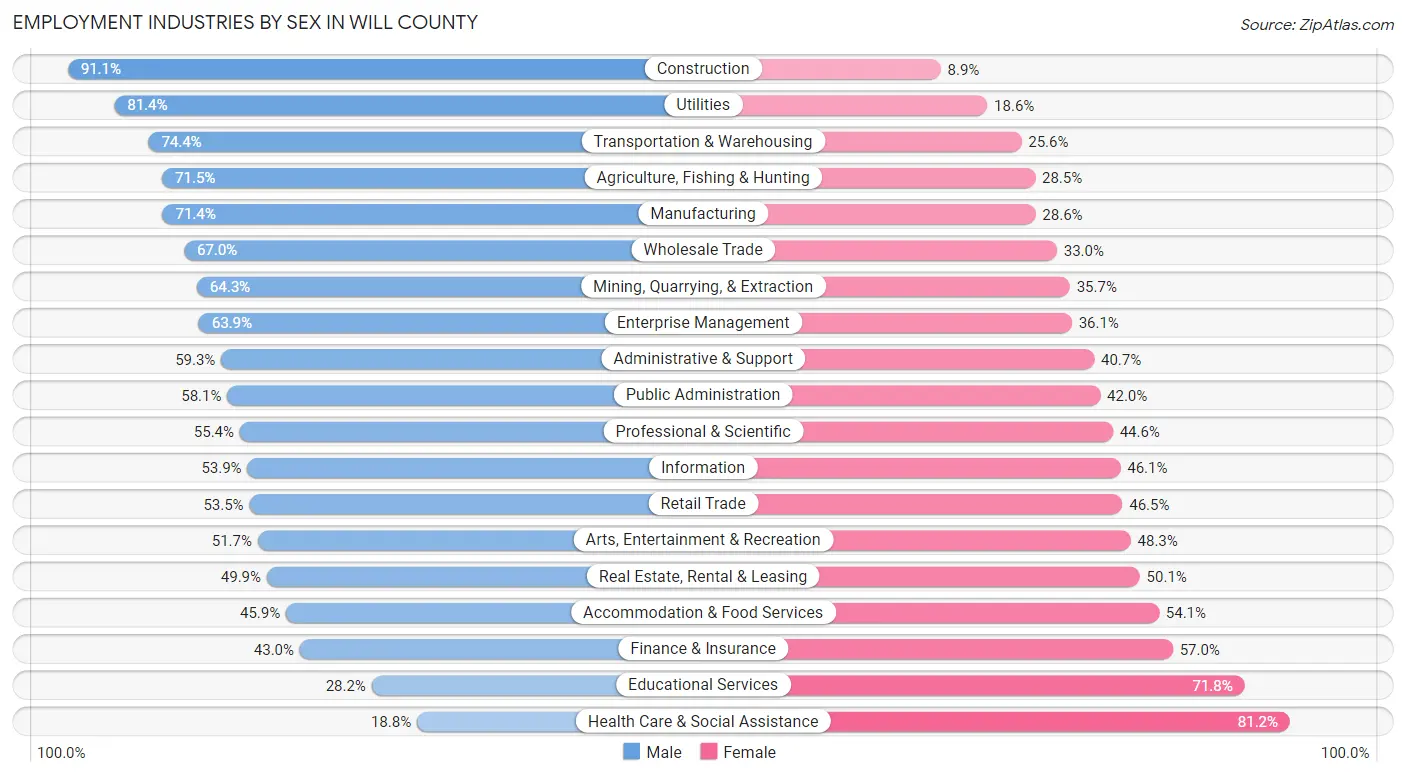
| Industry | Male | Female |
| Agriculture, Fishing & Hunting | 914 (71.5%) | 364 (28.5%) |
| Mining, Quarrying, & Extraction | 202 (64.3%) | 112 (35.7%) |
| Construction | 22,888 (91.1%) | 2,246 (8.9%) |
| Manufacturing | 28,442 (71.4%) | 11,369 (28.6%) |
| Wholesale Trade | 7,763 (67.0%) | 3,822 (33.0%) |
| Retail Trade | 22,109 (53.5%) | 19,251 (46.5%) |
| Transportation & Warehousing | 22,327 (74.4%) | 7,699 (25.6%) |
| Utilities | 2,929 (81.4%) | 668 (18.6%) |
| Information | 3,238 (53.9%) | 2,773 (46.1%) |
| Finance & Insurance | 8,288 (43.0%) | 10,979 (57.0%) |
| Real Estate, Rental & Leasing | 2,775 (49.9%) | 2,791 (50.1%) |
| Professional & Scientific | 14,135 (55.4%) | 11,360 (44.6%) |
| Enterprise Management | 622 (63.9%) | 351 (36.1%) |
| Administrative & Support | 8,074 (59.3%) | 5,540 (40.7%) |
| Educational Services | 8,826 (28.2%) | 22,520 (71.8%) |
| Health Care & Social Assistance | 8,712 (18.8%) | 37,690 (81.2%) |
| Arts, Entertainment & Recreation | 3,576 (51.7%) | 3,337 (48.3%) |
| Accommodation & Food Services | 10,049 (45.9%) | 11,851 (54.1%) |
| Public Administration | 7,809 (58.1%) | 5,643 (41.9%) |
| Total | 191,311 (53.2%) | 168,153 (46.8%) |
Education in Will County
School Enrollment in Will County
The most common levels of schooling among the 180,221 students in Will County are high school (45,370 | 25.2%), middle school (41,055 | 22.8%), and elementary school (33,535 | 18.6%).

| School Level | # Students | % Students |
| Nursery / Preschool | 10,479 | 5.8% |
| Kindergarten | 7,873 | 4.4% |
| Elementary School | 33,535 | 18.6% |
| Middle School | 41,055 | 22.8% |
| High School | 45,370 | 25.2% |
| College / Undergraduate | 33,521 | 18.6% |
| Graduate / Professional | 8,388 | 4.6% |
| Total | 180,221 | 100.0% |
School Enrollment by Age by Funding Source in Will County
Out of a total of 180,221 students who are enrolled in schools in Will County, 29,196 (16.2%) attend a private institution, while the remaining 151,025 (83.8%) are enrolled in public schools. The age group of 35 years and over has the highest likelihood of being enrolled in private schools, with 3,544 (40.0% in the age bracket) enrolled. Conversely, the age group of 15 to 17 year olds has the lowest likelihood of being enrolled in a private school, with 30,071 (92.8% in the age bracket) attending a public institution.
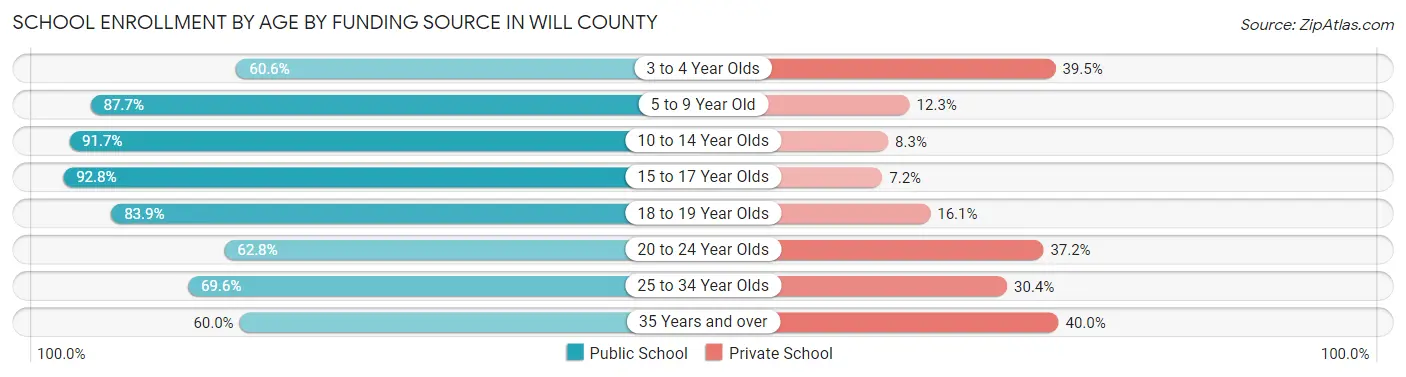
| Age Bracket | Public School | Private School |
| 3 to 4 Year Olds | 4,614 (60.6%) | 3,006 (39.5%) |
| 5 to 9 Year Old | 35,026 (87.7%) | 4,908 (12.3%) |
| 10 to 14 Year Olds | 47,813 (91.7%) | 4,321 (8.3%) |
| 15 to 17 Year Olds | 30,071 (92.8%) | 2,334 (7.2%) |
| 18 to 19 Year Olds | 11,659 (83.9%) | 2,244 (16.1%) |
| 20 to 24 Year Olds | 10,801 (62.8%) | 6,400 (37.2%) |
| 25 to 34 Year Olds | 5,682 (69.6%) | 2,486 (30.4%) |
| 35 Years and over | 5,312 (60.0%) | 3,544 (40.0%) |
| Total | 151,025 (83.8%) | 29,196 (16.2%) |
Educational Attainment by Field of Study in Will County
Business (40,679 | 22.8%), education (24,035 | 13.5%), science & technology (22,475 | 12.6%), engineering (15,668 | 8.8%), and arts & humanities (11,992 | 6.7%) are the most common fields of study among 178,525 individuals in Will County who have obtained a bachelor's degree or higher.
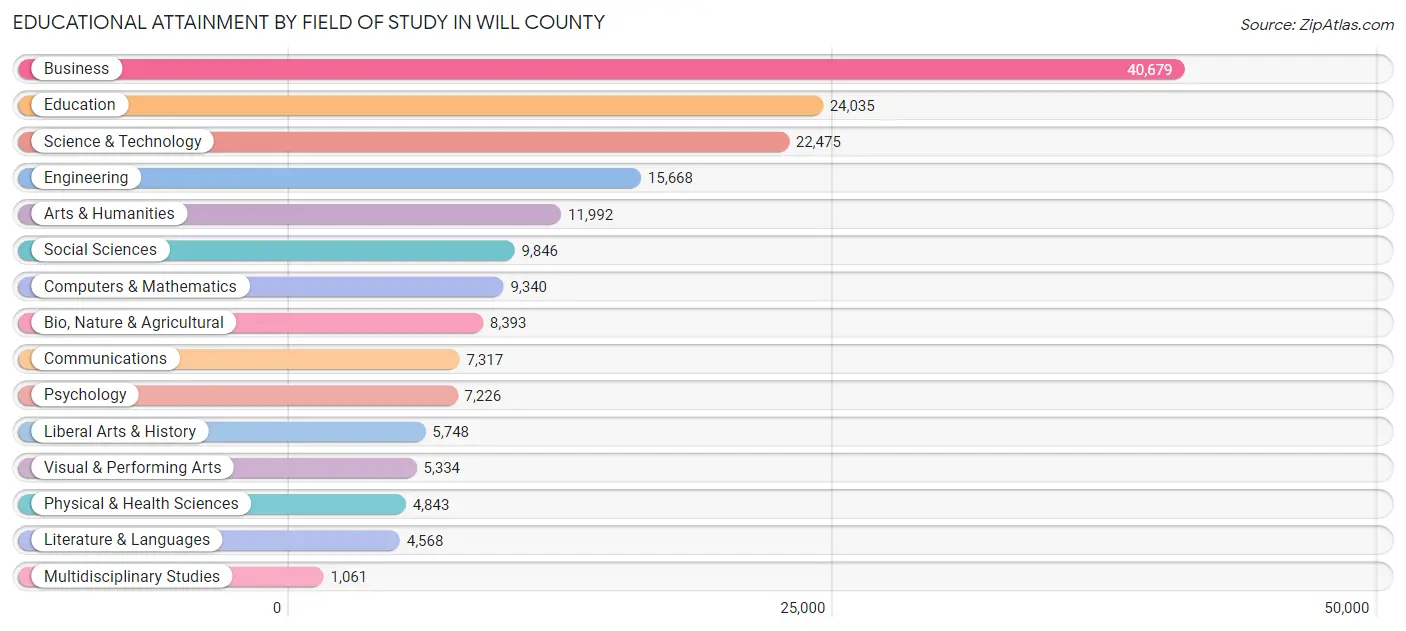
| Field of Study | # Graduates | % Graduates |
| Computers & Mathematics | 9,340 | 5.2% |
| Bio, Nature & Agricultural | 8,393 | 4.7% |
| Physical & Health Sciences | 4,843 | 2.7% |
| Psychology | 7,226 | 4.1% |
| Social Sciences | 9,846 | 5.5% |
| Engineering | 15,668 | 8.8% |
| Multidisciplinary Studies | 1,061 | 0.6% |
| Science & Technology | 22,475 | 12.6% |
| Business | 40,679 | 22.8% |
| Education | 24,035 | 13.5% |
| Literature & Languages | 4,568 | 2.6% |
| Liberal Arts & History | 5,748 | 3.2% |
| Visual & Performing Arts | 5,334 | 3.0% |
| Communications | 7,317 | 4.1% |
| Arts & Humanities | 11,992 | 6.7% |
| Total | 178,525 | 100.0% |
Transportation & Commute in Will County
Vehicle Availability by Sex in Will County
The most prevalent vehicle ownership categories in Will County are males with 2 vehicles (81,860, accounting for 43.5%) and females with 2 vehicles (67,685, making up 50.0%).
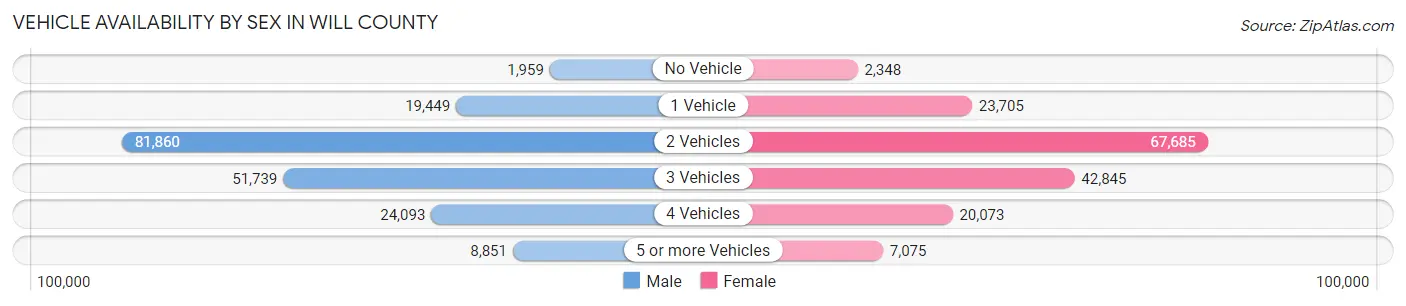
| Vehicles Available | Male | Female |
| No Vehicle | 1,959 (1.0%) | 2,348 (1.4%) |
| 1 Vehicle | 19,449 (10.3%) | 23,705 (14.5%) |
| 2 Vehicles | 81,860 (43.5%) | 67,685 (41.3%) |
| 3 Vehicles | 51,739 (27.5%) | 42,845 (26.2%) |
| 4 Vehicles | 24,093 (12.8%) | 20,073 (12.3%) |
| 5 or more Vehicles | 8,851 (4.7%) | 7,075 (4.3%) |
| Total | 187,951 (100.0%) | 163,731 (100.0%) |
Commute Time in Will County
The most frequently occuring commute durations in Will County are 30 to 34 minutes (42,663 commuters, 13.7%), 15 to 19 minutes (37,454 commuters, 12.0%), and 45 to 59 minutes (36,598 commuters, 11.7%).
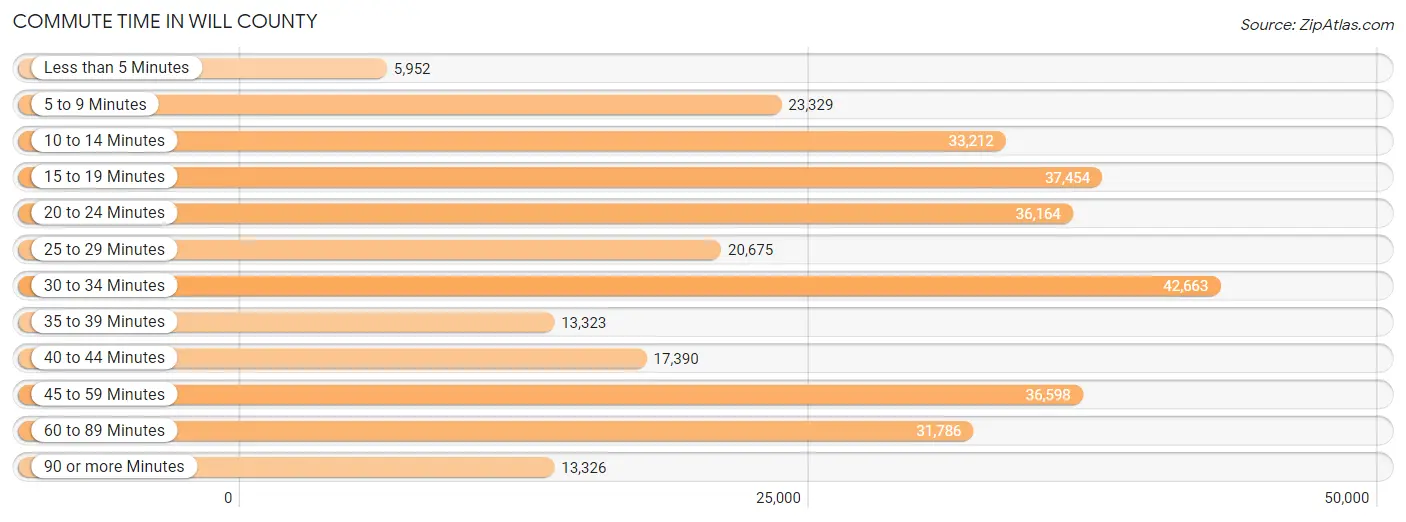
| Commute Time | # Commuters | % Commuters |
| Less than 5 Minutes | 5,952 | 1.9% |
| 5 to 9 Minutes | 23,329 | 7.5% |
| 10 to 14 Minutes | 33,212 | 10.6% |
| 15 to 19 Minutes | 37,454 | 12.0% |
| 20 to 24 Minutes | 36,164 | 11.6% |
| 25 to 29 Minutes | 20,675 | 6.6% |
| 30 to 34 Minutes | 42,663 | 13.7% |
| 35 to 39 Minutes | 13,323 | 4.3% |
| 40 to 44 Minutes | 17,390 | 5.6% |
| 45 to 59 Minutes | 36,598 | 11.7% |
| 60 to 89 Minutes | 31,786 | 10.2% |
| 90 or more Minutes | 13,326 | 4.3% |
Commute Time by Sex in Will County
The most common commute times in Will County are 30 to 34 minutes (24,004 commuters, 14.2%) for males and 15 to 19 minutes (19,510 commuters, 13.7%) for females.
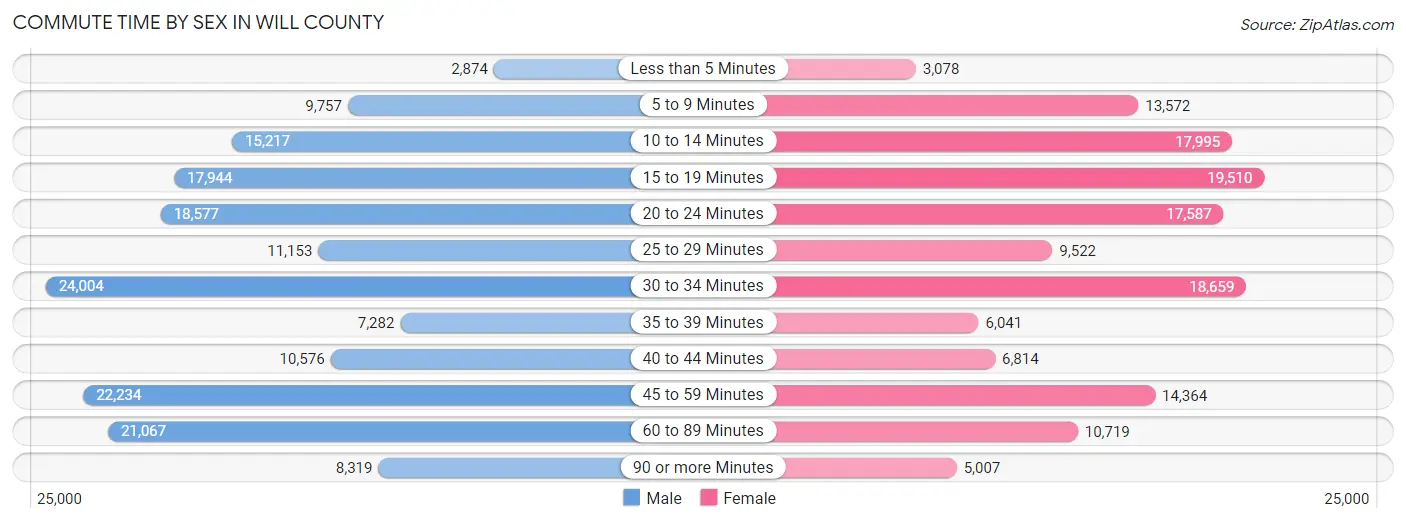
| Commute Time | Male | Female |
| Less than 5 Minutes | 2,874 (1.7%) | 3,078 (2.1%) |
| 5 to 9 Minutes | 9,757 (5.8%) | 13,572 (9.5%) |
| 10 to 14 Minutes | 15,217 (9.0%) | 17,995 (12.6%) |
| 15 to 19 Minutes | 17,944 (10.6%) | 19,510 (13.7%) |
| 20 to 24 Minutes | 18,577 (11.0%) | 17,587 (12.3%) |
| 25 to 29 Minutes | 11,153 (6.6%) | 9,522 (6.7%) |
| 30 to 34 Minutes | 24,004 (14.2%) | 18,659 (13.1%) |
| 35 to 39 Minutes | 7,282 (4.3%) | 6,041 (4.2%) |
| 40 to 44 Minutes | 10,576 (6.3%) | 6,814 (4.8%) |
| 45 to 59 Minutes | 22,234 (13.2%) | 14,364 (10.1%) |
| 60 to 89 Minutes | 21,067 (12.5%) | 10,719 (7.5%) |
| 90 or more Minutes | 8,319 (4.9%) | 5,007 (3.5%) |
Time of Departure to Work by Sex in Will County
The most frequent times of departure to work in Will County are 6:00 AM to 6:29 AM (22,114, 13.1%) for males and 7:00 AM to 7:29 AM (20,853, 14.6%) for females.
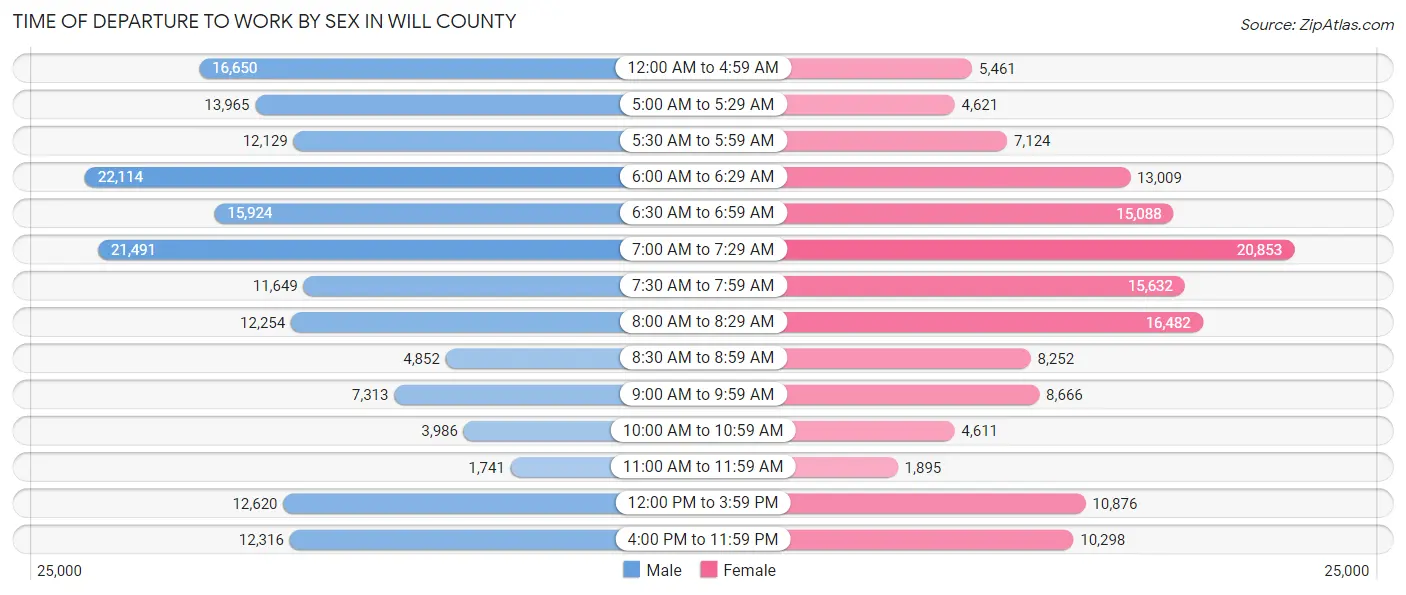
| Time of Departure | Male | Female |
| 12:00 AM to 4:59 AM | 16,650 (9.9%) | 5,461 (3.8%) |
| 5:00 AM to 5:29 AM | 13,965 (8.3%) | 4,621 (3.2%) |
| 5:30 AM to 5:59 AM | 12,129 (7.2%) | 7,124 (5.0%) |
| 6:00 AM to 6:29 AM | 22,114 (13.1%) | 13,009 (9.1%) |
| 6:30 AM to 6:59 AM | 15,924 (9.4%) | 15,088 (10.6%) |
| 7:00 AM to 7:29 AM | 21,491 (12.7%) | 20,853 (14.6%) |
| 7:30 AM to 7:59 AM | 11,649 (6.9%) | 15,632 (10.9%) |
| 8:00 AM to 8:29 AM | 12,254 (7.2%) | 16,482 (11.5%) |
| 8:30 AM to 8:59 AM | 4,852 (2.9%) | 8,252 (5.8%) |
| 9:00 AM to 9:59 AM | 7,313 (4.3%) | 8,666 (6.1%) |
| 10:00 AM to 10:59 AM | 3,986 (2.4%) | 4,611 (3.2%) |
| 11:00 AM to 11:59 AM | 1,741 (1.0%) | 1,895 (1.3%) |
| 12:00 PM to 3:59 PM | 12,620 (7.5%) | 10,876 (7.6%) |
| 4:00 PM to 11:59 PM | 12,316 (7.3%) | 10,298 (7.2%) |
| Total | 169,004 (100.0%) | 142,868 (100.0%) |
Housing Occupancy in Will County
Occupancy by Ownership in Will County
Of the total 239,064 dwellings in Will County, owner-occupied units account for 196,571 (82.2%), while renter-occupied units make up 42,493 (17.8%).
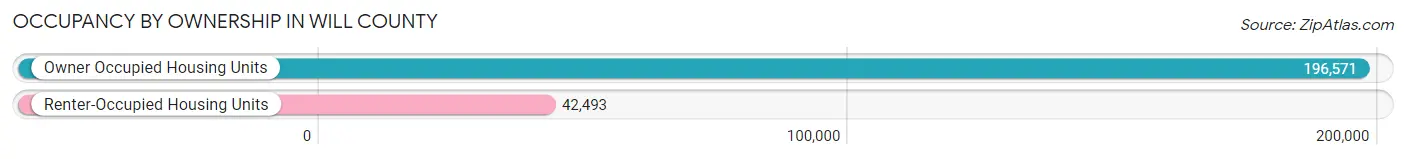
| Occupancy | # Housing Units | % Housing Units |
| Owner Occupied Housing Units | 196,571 | 82.2% |
| Renter-Occupied Housing Units | 42,493 | 17.8% |
| Total Occupied Housing Units | 239,064 | 100.0% |
Occupancy by Household Size in Will County
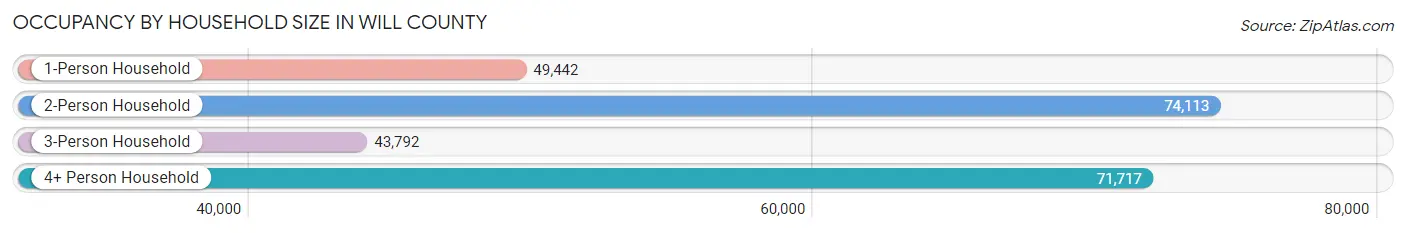
| Household Size | # Housing Units | % Housing Units |
| 1-Person Household | 49,442 | 20.7% |
| 2-Person Household | 74,113 | 31.0% |
| 3-Person Household | 43,792 | 18.3% |
| 4+ Person Household | 71,717 | 30.0% |
| Total Housing Units | 239,064 | 100.0% |
Occupancy by Ownership by Household Size in Will County
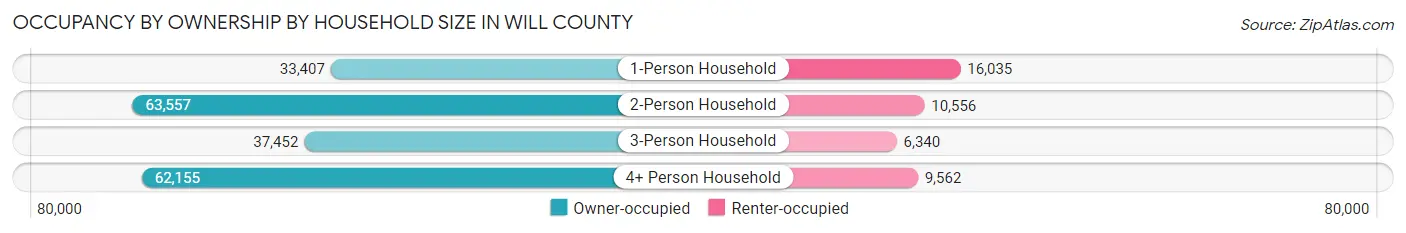
| Household Size | Owner-occupied | Renter-occupied |
| 1-Person Household | 33,407 (67.6%) | 16,035 (32.4%) |
| 2-Person Household | 63,557 (85.8%) | 10,556 (14.2%) |
| 3-Person Household | 37,452 (85.5%) | 6,340 (14.5%) |
| 4+ Person Household | 62,155 (86.7%) | 9,562 (13.3%) |
| Total Housing Units | 196,571 (82.2%) | 42,493 (17.8%) |
Occupancy by Educational Attainment in Will County
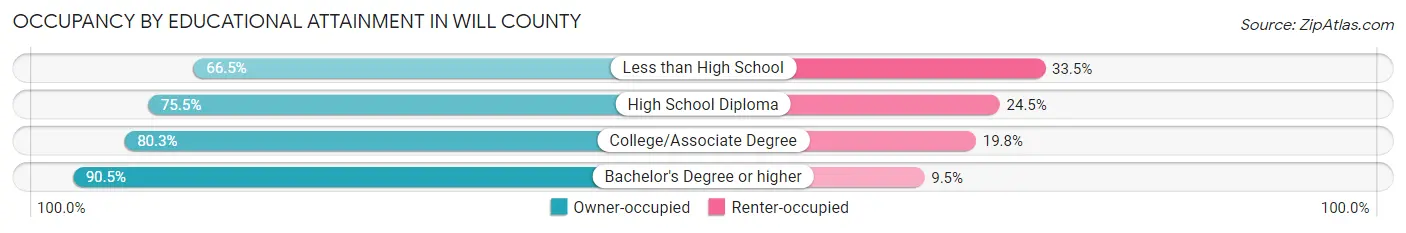
| Household Size | Owner-occupied | Renter-occupied |
| Less than High School | 10,675 (66.5%) | 5,372 (33.5%) |
| High School Diploma | 40,883 (75.5%) | 13,243 (24.5%) |
| College/Associate Degree | 61,039 (80.2%) | 15,024 (19.8%) |
| Bachelor's Degree or higher | 83,974 (90.5%) | 8,854 (9.5%) |
Occupancy by Age of Householder in Will County
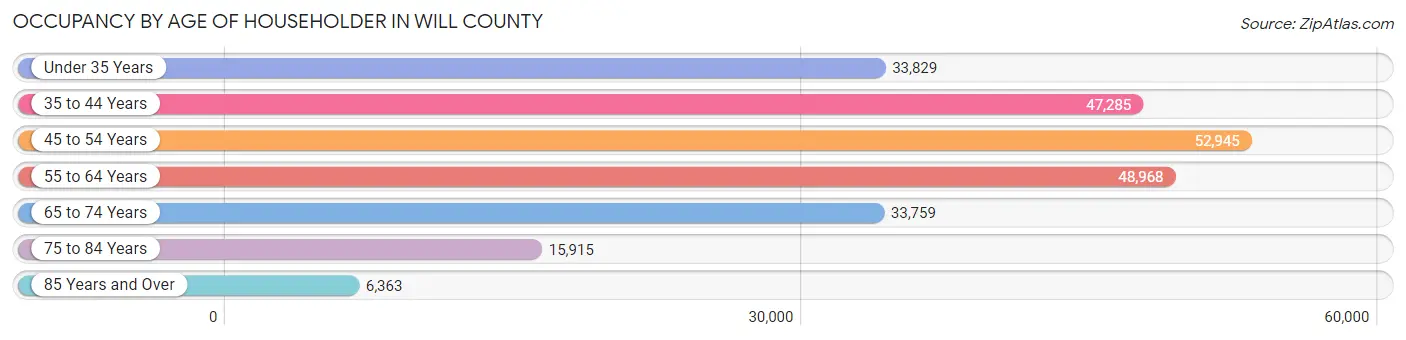
| Age Bracket | # Households | % Households |
| Under 35 Years | 33,829 | 14.1% |
| 35 to 44 Years | 47,285 | 19.8% |
| 45 to 54 Years | 52,945 | 22.2% |
| 55 to 64 Years | 48,968 | 20.5% |
| 65 to 74 Years | 33,759 | 14.1% |
| 75 to 84 Years | 15,915 | 6.7% |
| 85 Years and Over | 6,363 | 2.7% |
| Total | 239,064 | 100.0% |
Housing Finances in Will County
Median Income by Occupancy in Will County
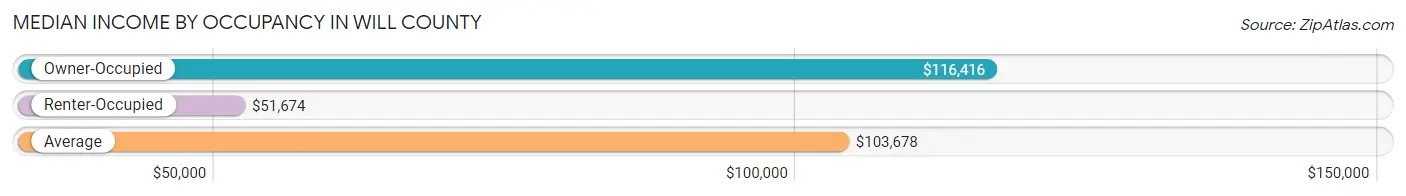
| Occupancy Type | # Households | Median Income |
| Owner-Occupied | 196,571 (82.2%) | $116,416 |
| Renter-Occupied | 42,493 (17.8%) | $51,674 |
| Average | 239,064 (100.0%) | $103,678 |
Occupancy by Householder Income Bracket in Will County
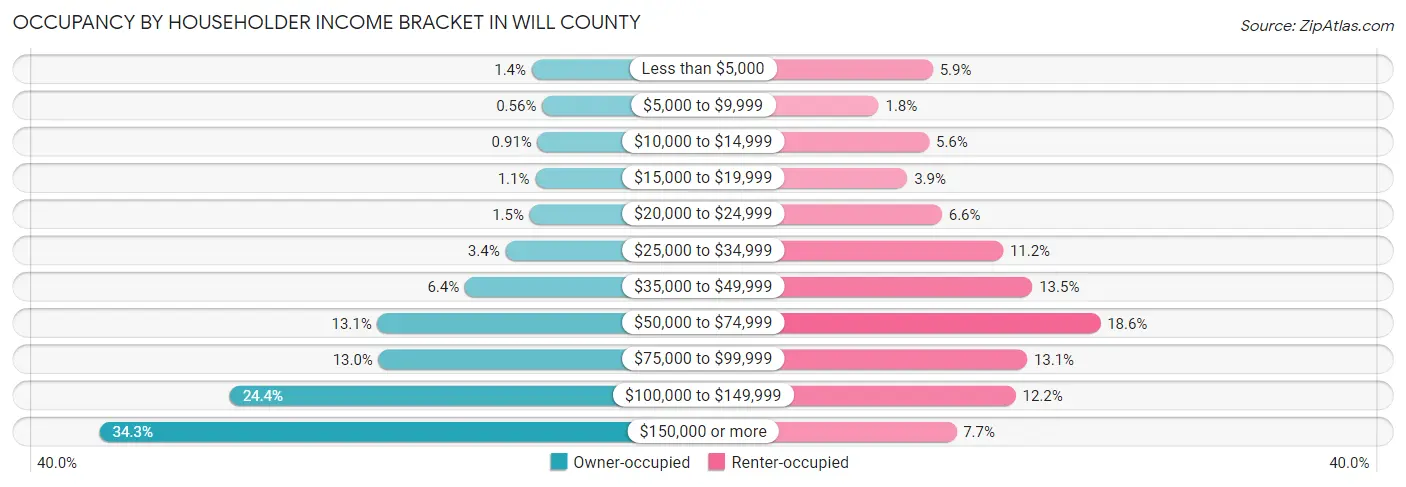
| Income Bracket | Owner-occupied | Renter-occupied |
| Less than $5,000 | 2,654 (1.3%) | 2,500 (5.9%) |
| $5,000 to $9,999 | 1,097 (0.6%) | 745 (1.8%) |
| $10,000 to $14,999 | 1,779 (0.9%) | 2,378 (5.6%) |
| $15,000 to $19,999 | 2,137 (1.1%) | 1,676 (3.9%) |
| $20,000 to $24,999 | 2,960 (1.5%) | 2,790 (6.6%) |
| $25,000 to $34,999 | 6,611 (3.4%) | 4,771 (11.2%) |
| $35,000 to $49,999 | 12,669 (6.4%) | 5,721 (13.5%) |
| $50,000 to $74,999 | 25,765 (13.1%) | 7,921 (18.6%) |
| $75,000 to $99,999 | 25,587 (13.0%) | 5,549 (13.1%) |
| $100,000 to $149,999 | 47,908 (24.4%) | 5,181 (12.2%) |
| $150,000 or more | 67,404 (34.3%) | 3,261 (7.7%) |
| Total | 196,571 (100.0%) | 42,493 (100.0%) |
Monthly Housing Cost Tiers in Will County
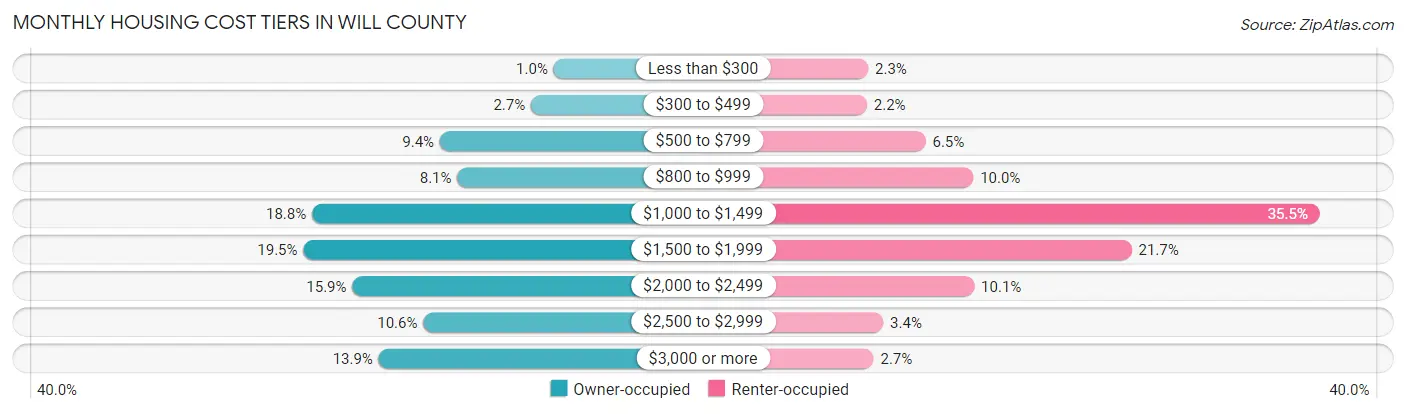
| Monthly Cost | Owner-occupied | Renter-occupied |
| Less than $300 | 2,026 (1.0%) | 962 (2.3%) |
| $300 to $499 | 5,313 (2.7%) | 920 (2.2%) |
| $500 to $799 | 18,504 (9.4%) | 2,758 (6.5%) |
| $800 to $999 | 15,985 (8.1%) | 4,248 (10.0%) |
| $1,000 to $1,499 | 37,013 (18.8%) | 15,092 (35.5%) |
| $1,500 to $1,999 | 38,276 (19.5%) | 9,203 (21.7%) |
| $2,000 to $2,499 | 31,179 (15.9%) | 4,279 (10.1%) |
| $2,500 to $2,999 | 20,908 (10.6%) | 1,432 (3.4%) |
| $3,000 or more | 27,367 (13.9%) | 1,131 (2.7%) |
| Total | 196,571 (100.0%) | 42,493 (100.0%) |
Physical Housing Characteristics in Will County
Housing Structures in Will County
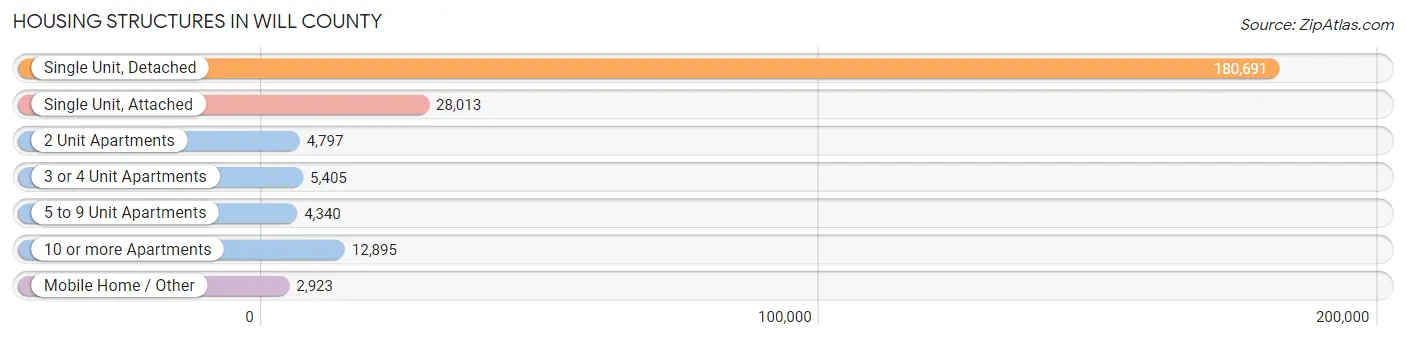
| Structure Type | # Housing Units | % Housing Units |
| Single Unit, Detached | 180,691 | 75.6% |
| Single Unit, Attached | 28,013 | 11.7% |
| 2 Unit Apartments | 4,797 | 2.0% |
| 3 or 4 Unit Apartments | 5,405 | 2.3% |
| 5 to 9 Unit Apartments | 4,340 | 1.8% |
| 10 or more Apartments | 12,895 | 5.4% |
| Mobile Home / Other | 2,923 | 1.2% |
| Total | 239,064 | 100.0% |
Housing Structures by Occupancy in Will County
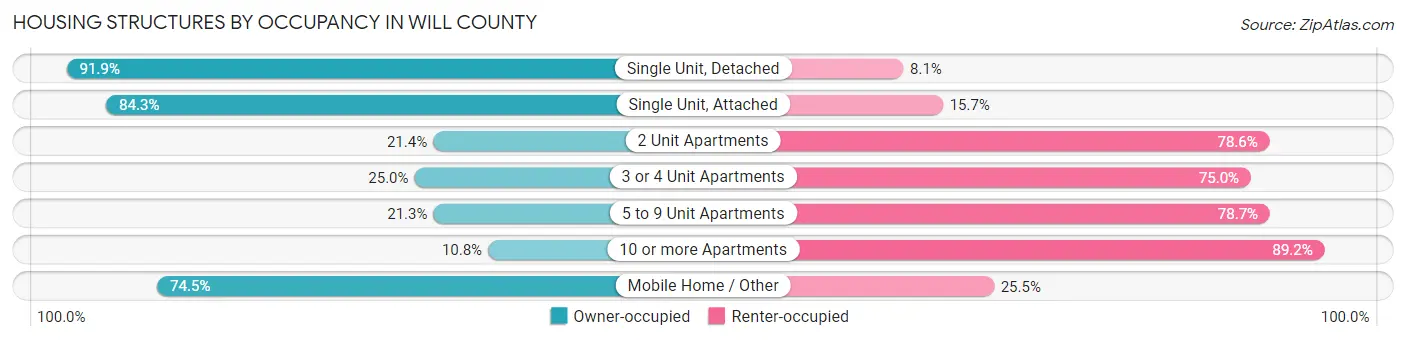
| Structure Type | Owner-occupied | Renter-occupied |
| Single Unit, Detached | 166,087 (91.9%) | 14,604 (8.1%) |
| Single Unit, Attached | 23,616 (84.3%) | 4,397 (15.7%) |
| 2 Unit Apartments | 1,025 (21.4%) | 3,772 (78.6%) |
| 3 or 4 Unit Apartments | 1,349 (25.0%) | 4,056 (75.0%) |
| 5 to 9 Unit Apartments | 925 (21.3%) | 3,415 (78.7%) |
| 10 or more Apartments | 1,392 (10.8%) | 11,503 (89.2%) |
| Mobile Home / Other | 2,177 (74.5%) | 746 (25.5%) |
| Total | 196,571 (82.2%) | 42,493 (17.8%) |
Housing Structures by Number of Rooms in Will County
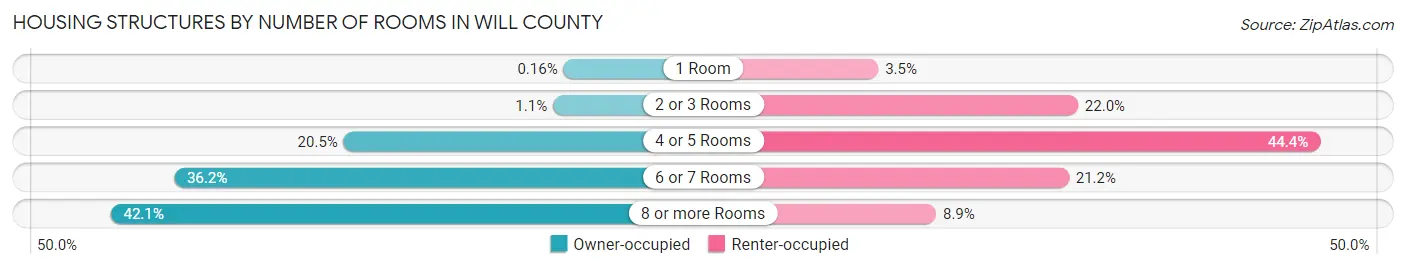
| Number of Rooms | Owner-occupied | Renter-occupied |
| 1 Room | 305 (0.2%) | 1,504 (3.5%) |
| 2 or 3 Rooms | 2,221 (1.1%) | 9,351 (22.0%) |
| 4 or 5 Rooms | 40,280 (20.5%) | 18,867 (44.4%) |
| 6 or 7 Rooms | 71,115 (36.2%) | 8,995 (21.2%) |
| 8 or more Rooms | 82,650 (42.0%) | 3,776 (8.9%) |
| Total | 196,571 (100.0%) | 42,493 (100.0%) |
Housing Structure by Heating Type in Will County
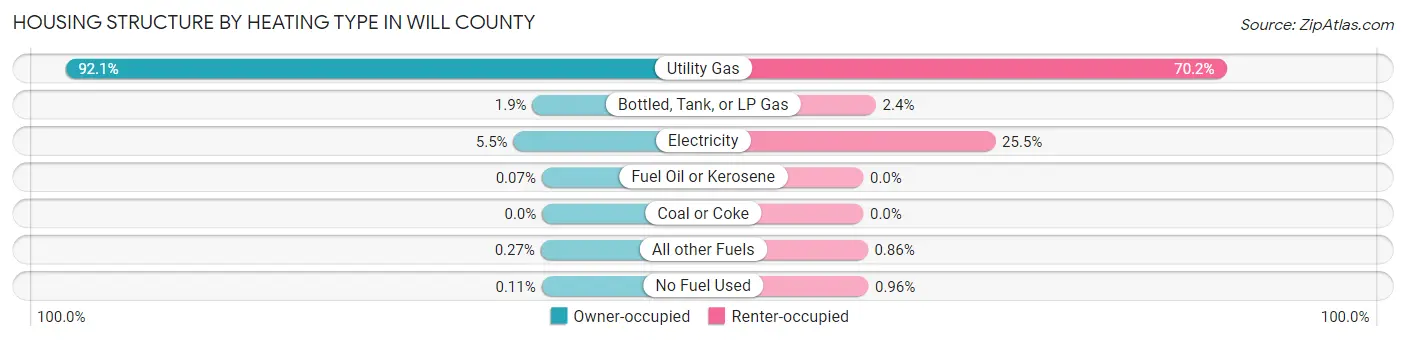
| Heating Type | Owner-occupied | Renter-occupied |
| Utility Gas | 181,119 (92.1%) | 29,831 (70.2%) |
| Bottled, Tank, or LP Gas | 3,669 (1.9%) | 1,038 (2.4%) |
| Electricity | 10,891 (5.5%) | 10,847 (25.5%) |
| Fuel Oil or Kerosene | 141 (0.1%) | 1 (0.0%) |
| Coal or Coke | 0 (0.0%) | 0 (0.0%) |
| All other Fuels | 538 (0.3%) | 366 (0.9%) |
| No Fuel Used | 213 (0.1%) | 410 (1.0%) |
| Total | 196,571 (100.0%) | 42,493 (100.0%) |
Household Vehicle Usage in Will County
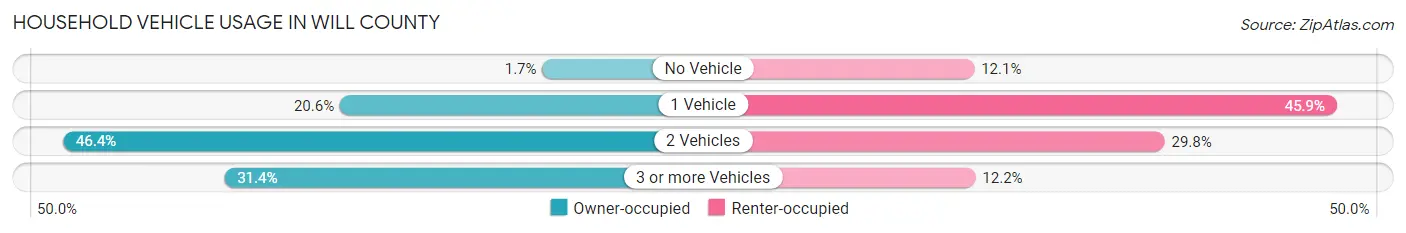
| Vehicles per Household | Owner-occupied | Renter-occupied |
| No Vehicle | 3,278 (1.7%) | 5,130 (12.1%) |
| 1 Vehicle | 40,407 (20.6%) | 19,509 (45.9%) |
| 2 Vehicles | 91,249 (46.4%) | 12,678 (29.8%) |
| 3 or more Vehicles | 61,637 (31.4%) | 5,176 (12.2%) |
| Total | 196,571 (100.0%) | 42,493 (100.0%) |
Real Estate & Mortgages in Will County
Real Estate and Mortgage Overview in Will County
| Characteristic | Without Mortgage | With Mortgage |
| Housing Units | 59,550 | 137,021 |
| Median Property Value | $266,200 | $290,600 |
| Median Household Income | $89,062 | $52,383 |
| Monthly Housing Costs | $883 | $27,121 |
| Real Estate Taxes | $6,212 | $1,534 |
Property Value by Mortgage Status in Will County
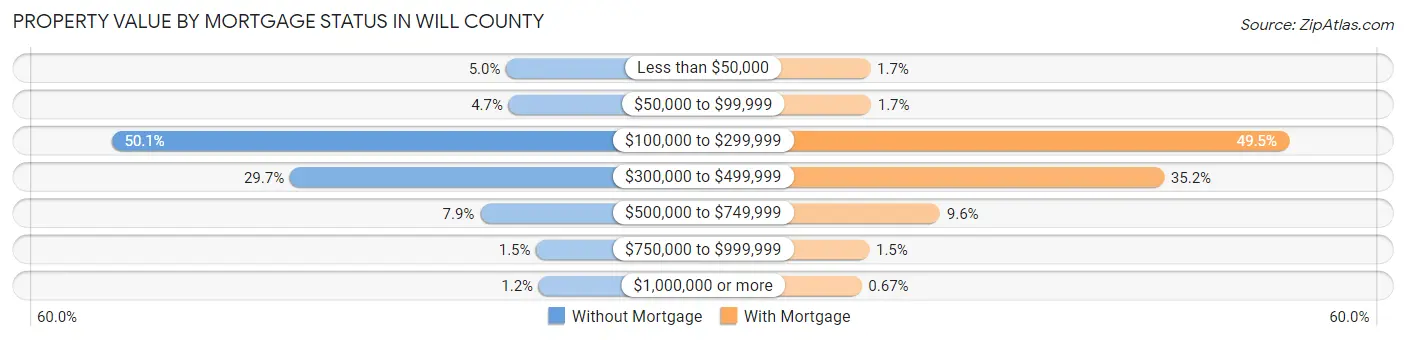
| Property Value | Without Mortgage | With Mortgage |
| Less than $50,000 | 2,945 (5.0%) | 2,270 (1.7%) |
| $50,000 to $99,999 | 2,776 (4.7%) | 2,383 (1.7%) |
| $100,000 to $299,999 | 29,817 (50.1%) | 67,856 (49.5%) |
| $300,000 to $499,999 | 17,668 (29.7%) | 48,292 (35.2%) |
| $500,000 to $749,999 | 4,720 (7.9%) | 13,201 (9.6%) |
| $750,000 to $999,999 | 899 (1.5%) | 2,105 (1.5%) |
| $1,000,000 or more | 725 (1.2%) | 914 (0.7%) |
| Total | 59,550 (100.0%) | 137,021 (100.0%) |
Household Income by Mortgage Status in Will County
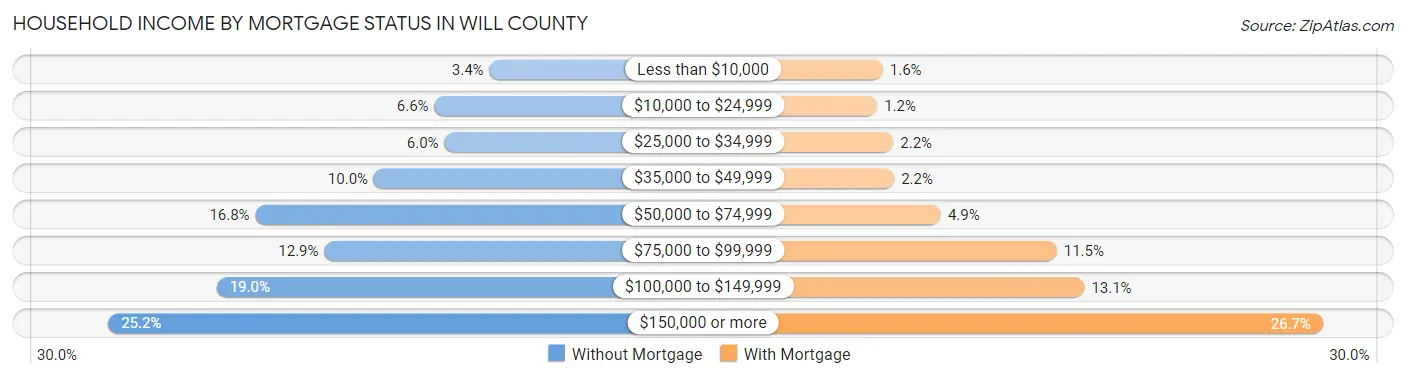
| Household Income | Without Mortgage | With Mortgage |
| Less than $10,000 | 2,050 (3.4%) | 2,138 (1.6%) |
| $10,000 to $24,999 | 3,918 (6.6%) | 1,701 (1.2%) |
| $25,000 to $34,999 | 3,579 (6.0%) | 2,958 (2.2%) |
| $35,000 to $49,999 | 5,977 (10.0%) | 3,032 (2.2%) |
| $50,000 to $74,999 | 10,013 (16.8%) | 6,692 (4.9%) |
| $75,000 to $99,999 | 7,663 (12.9%) | 15,752 (11.5%) |
| $100,000 to $149,999 | 11,329 (19.0%) | 17,924 (13.1%) |
| $150,000 or more | 15,021 (25.2%) | 36,579 (26.7%) |
| Total | 59,550 (100.0%) | 137,021 (100.0%) |
Property Value to Household Income Ratio in Will County
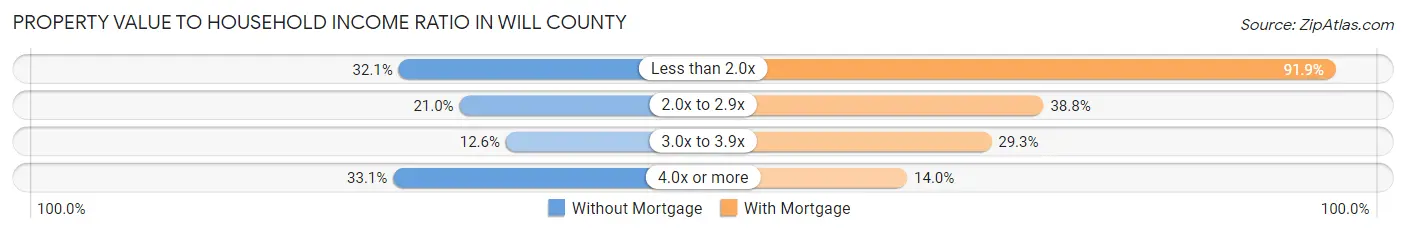
| Value-to-Income Ratio | Without Mortgage | With Mortgage |
| Less than 2.0x | 19,097 (32.1%) | 125,876 (91.9%) |
| 2.0x to 2.9x | 12,523 (21.0%) | 53,146 (38.8%) |
| 3.0x to 3.9x | 7,510 (12.6%) | 40,166 (29.3%) |
| 4.0x or more | 19,692 (33.1%) | 19,212 (14.0%) |
| Total | 59,550 (100.0%) | 137,021 (100.0%) |
Real Estate Taxes by Mortgage Status in Will County
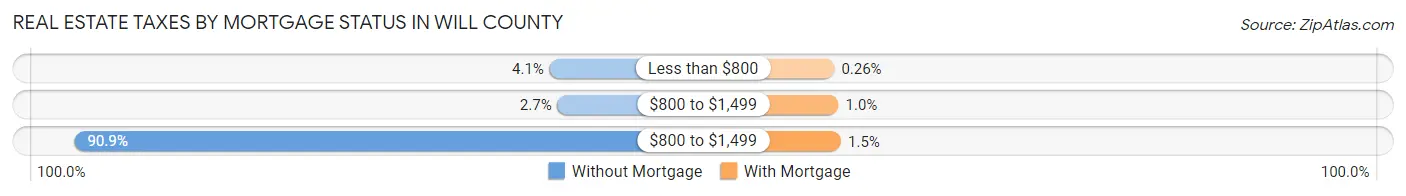
| Property Taxes | Without Mortgage | With Mortgage |
| Less than $800 | 2,440 (4.1%) | 351 (0.3%) |
| $800 to $1,499 | 1,591 (2.7%) | 1,383 (1.0%) |
| $800 to $1,499 | 54,118 (90.9%) | 2,011 (1.5%) |
| Total | 59,550 (100.0%) | 137,021 (100.0%) |
Health & Disability in Will County
Health Insurance Coverage by Age in Will County
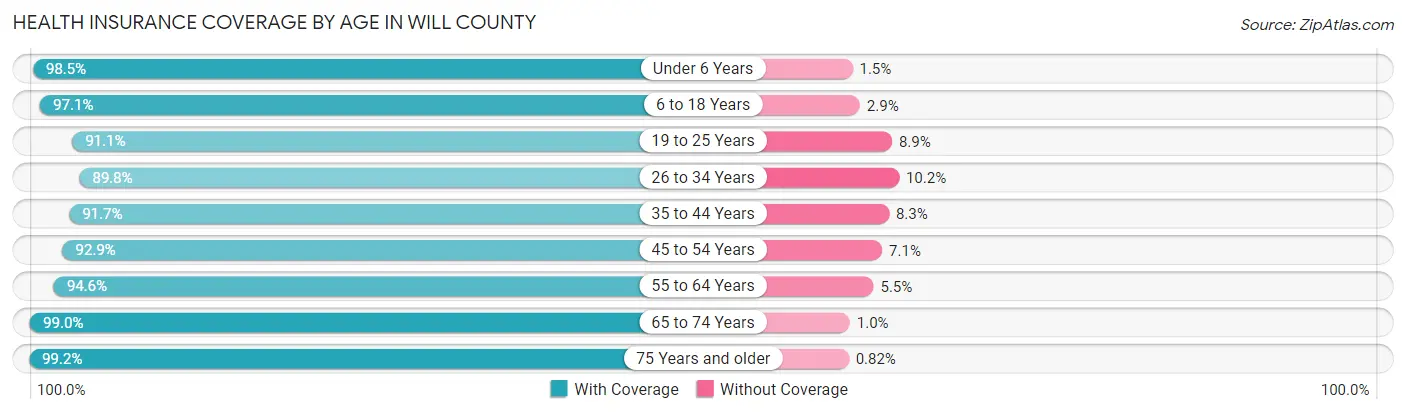
| Age Bracket | With Coverage | Without Coverage |
| Under 6 Years | 46,701 (98.5%) | 725 (1.5%) |
| 6 to 18 Years | 127,242 (97.1%) | 3,820 (2.9%) |
| 19 to 25 Years | 56,638 (91.1%) | 5,526 (8.9%) |
| 26 to 34 Years | 65,674 (89.8%) | 7,461 (10.2%) |
| 35 to 44 Years | 85,475 (91.7%) | 7,771 (8.3%) |
| 45 to 54 Years | 93,513 (92.9%) | 7,100 (7.1%) |
| 55 to 64 Years | 84,455 (94.6%) | 4,867 (5.4%) |
| 65 to 74 Years | 57,155 (99.0%) | 602 (1.0%) |
| 75 Years and older | 35,464 (99.2%) | 294 (0.8%) |
| Total | 652,317 (94.5%) | 38,166 (5.5%) |
Health Insurance Coverage by Citizenship Status in Will County
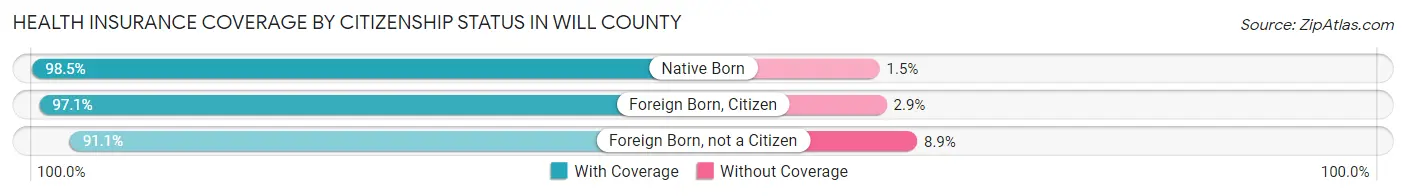
| Citizenship Status | With Coverage | Without Coverage |
| Native Born | 46,701 (98.5%) | 725 (1.5%) |
| Foreign Born, Citizen | 127,242 (97.1%) | 3,820 (2.9%) |
| Foreign Born, not a Citizen | 56,638 (91.1%) | 5,526 (8.9%) |
Health Insurance Coverage by Household Income in Will County
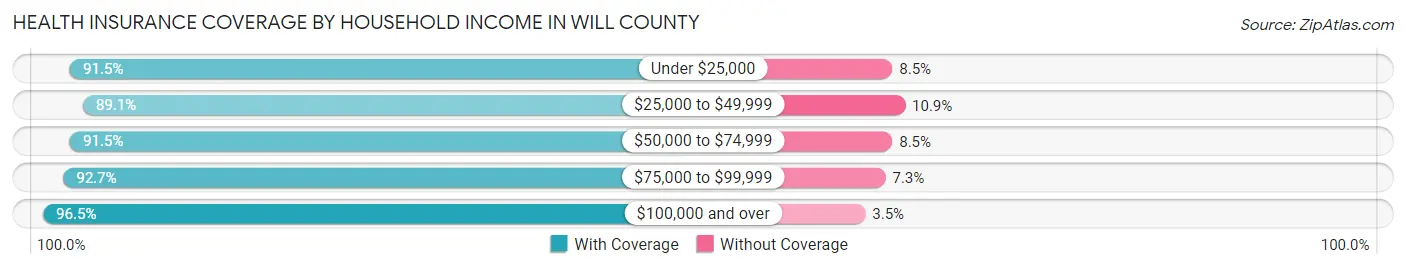
| Household Income | With Coverage | Without Coverage |
| Under $25,000 | 34,830 (91.5%) | 3,248 (8.5%) |
| $25,000 to $49,999 | 57,105 (89.1%) | 7,007 (10.9%) |
| $50,000 to $74,999 | 74,816 (91.5%) | 6,968 (8.5%) |
| $75,000 to $99,999 | 80,328 (92.7%) | 6,288 (7.3%) |
| $100,000 and over | 403,258 (96.5%) | 14,560 (3.5%) |
Public vs Private Health Insurance Coverage by Age in Will County
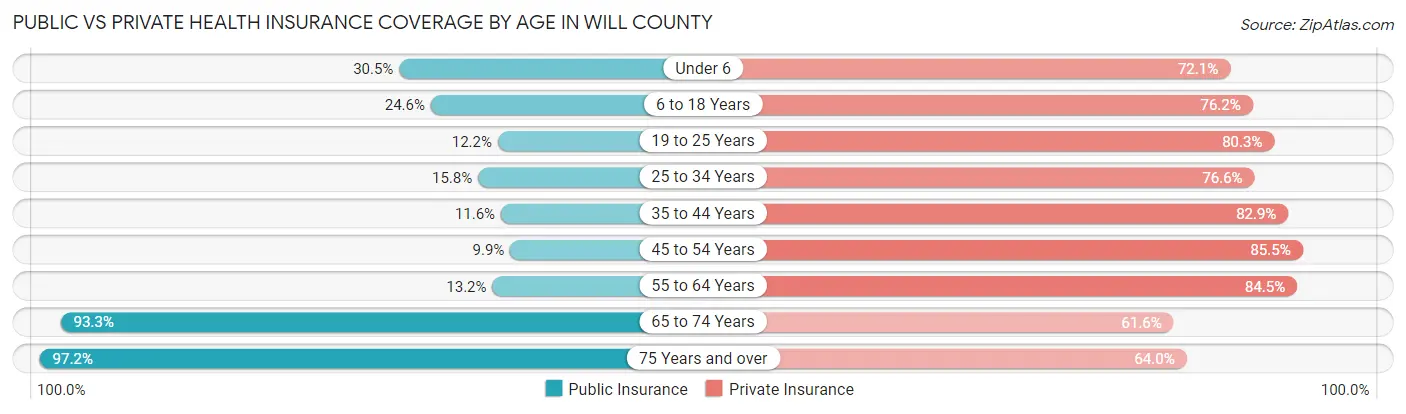
| Age Bracket | Public Insurance | Private Insurance |
| Under 6 | 14,450 (30.5%) | 34,169 (72.1%) |
| 6 to 18 Years | 32,236 (24.6%) | 99,908 (76.2%) |
| 19 to 25 Years | 7,562 (12.2%) | 49,890 (80.3%) |
| 25 to 34 Years | 11,584 (15.8%) | 56,011 (76.6%) |
| 35 to 44 Years | 10,797 (11.6%) | 77,253 (82.9%) |
| 45 to 54 Years | 9,927 (9.9%) | 86,024 (85.5%) |
| 55 to 64 Years | 11,771 (13.2%) | 75,480 (84.5%) |
| 65 to 74 Years | 53,898 (93.3%) | 35,564 (61.6%) |
| 75 Years and over | 34,762 (97.2%) | 22,873 (64.0%) |
| Total | 186,987 (27.1%) | 537,172 (77.8%) |
Disability Status by Sex by Age in Will County
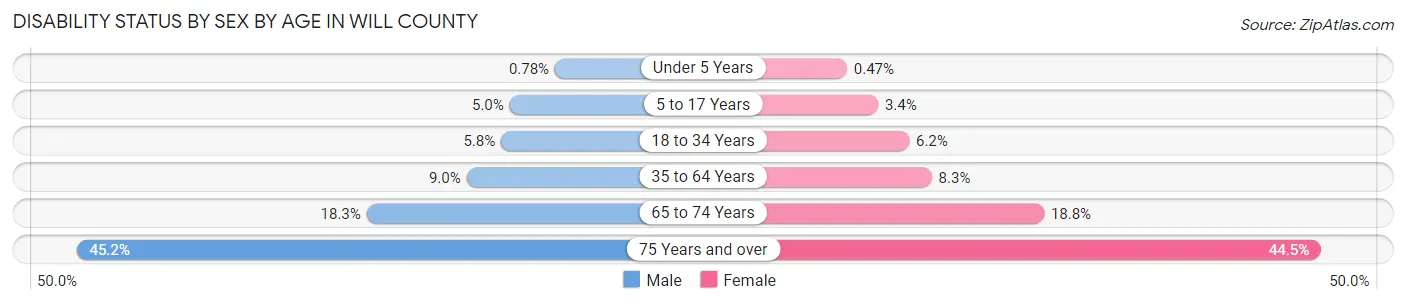
| Age Bracket | Male | Female |
| Under 5 Years | 153 (0.8%) | 90 (0.5%) |
| 5 to 17 Years | 3,294 (5.0%) | 2,126 (3.4%) |
| 18 to 34 Years | 4,308 (5.8%) | 4,448 (6.2%) |
| 35 to 64 Years | 12,693 (9.0%) | 11,830 (8.3%) |
| 65 to 74 Years | 5,029 (18.3%) | 5,669 (18.8%) |
| 75 Years and over | 6,686 (45.2%) | 9,322 (44.5%) |
Disability Class by Sex by Age in Will County
Disability Class: Hearing Difficulty
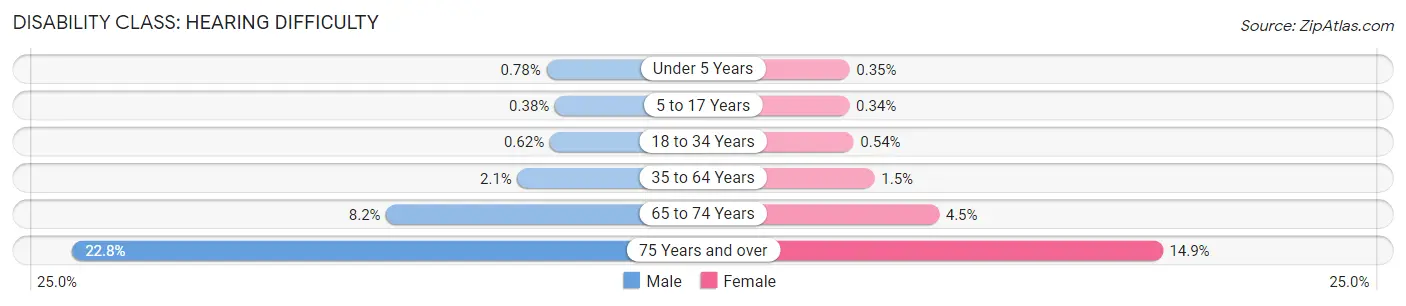
| Age Bracket | Male | Female |
| Under 5 Years | 153 (0.8%) | 67 (0.4%) |
| 5 to 17 Years | 253 (0.4%) | 216 (0.3%) |
| 18 to 34 Years | 464 (0.6%) | 384 (0.5%) |
| 35 to 64 Years | 3,003 (2.1%) | 2,141 (1.5%) |
| 65 to 74 Years | 2,262 (8.2%) | 1,360 (4.5%) |
| 75 Years and over | 3,372 (22.8%) | 3,119 (14.9%) |
Disability Class: Vision Difficulty
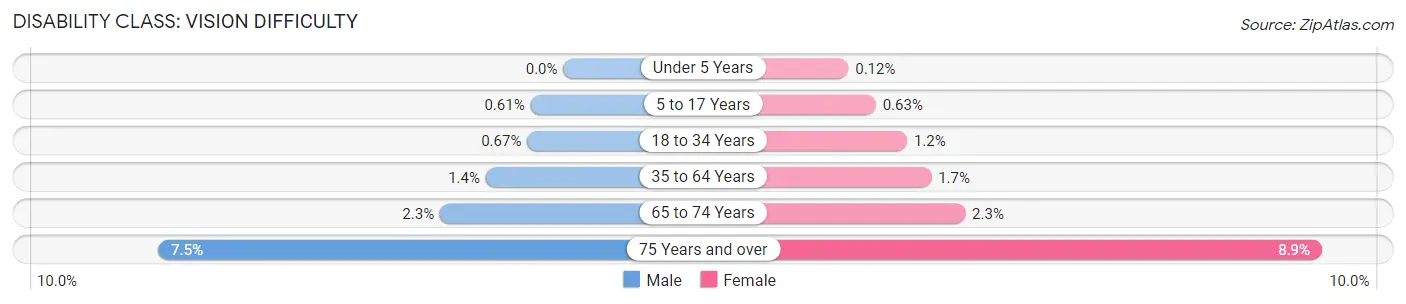
| Age Bracket | Male | Female |
| Under 5 Years | 0 (0.0%) | 23 (0.1%) |
| 5 to 17 Years | 403 (0.6%) | 399 (0.6%) |
| 18 to 34 Years | 501 (0.7%) | 862 (1.2%) |
| 35 to 64 Years | 2,035 (1.4%) | 2,349 (1.7%) |
| 65 to 74 Years | 631 (2.3%) | 692 (2.3%) |
| 75 Years and over | 1,113 (7.5%) | 1,867 (8.9%) |
Disability Class: Cognitive Difficulty
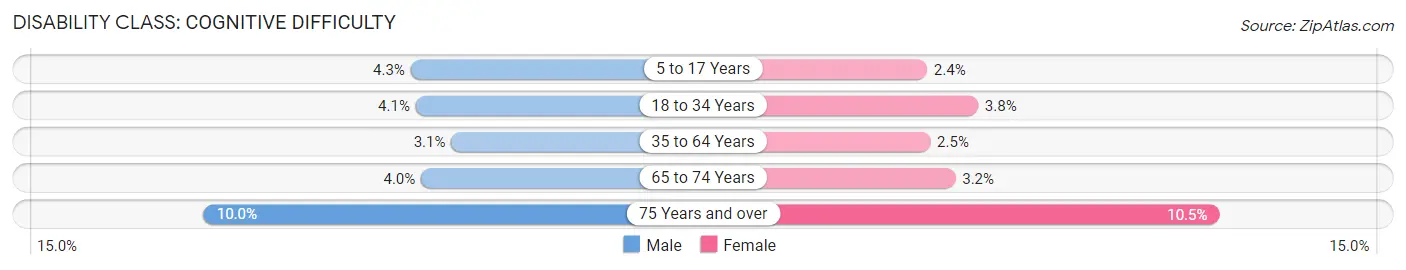
| Age Bracket | Male | Female |
| 5 to 17 Years | 2,810 (4.3%) | 1,497 (2.4%) |
| 18 to 34 Years | 3,065 (4.1%) | 2,701 (3.8%) |
| 35 to 64 Years | 4,417 (3.1%) | 3,488 (2.5%) |
| 65 to 74 Years | 1,091 (4.0%) | 955 (3.2%) |
| 75 Years and over | 1,482 (10.0%) | 2,202 (10.5%) |
Disability Class: Ambulatory Difficulty

| Age Bracket | Male | Female |
| 5 to 17 Years | 297 (0.4%) | 301 (0.5%) |
| 18 to 34 Years | 559 (0.7%) | 797 (1.1%) |
| 35 to 64 Years | 6,042 (4.3%) | 5,783 (4.1%) |
| 65 to 74 Years | 2,625 (9.5%) | 3,976 (13.2%) |
| 75 Years and over | 3,711 (25.1%) | 6,727 (32.1%) |
Disability Class: Self-Care Difficulty
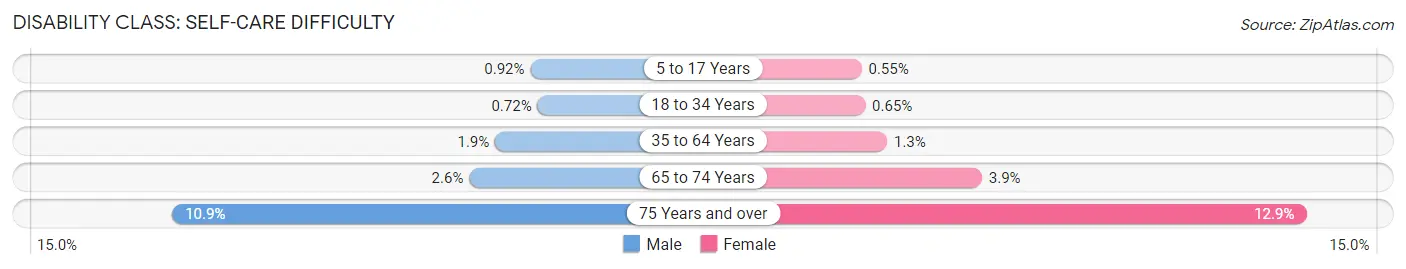
| Age Bracket | Male | Female |
| 5 to 17 Years | 608 (0.9%) | 350 (0.5%) |
| 18 to 34 Years | 534 (0.7%) | 467 (0.6%) |
| 35 to 64 Years | 2,687 (1.9%) | 1,793 (1.3%) |
| 65 to 74 Years | 722 (2.6%) | 1,177 (3.9%) |
| 75 Years and over | 1,611 (10.9%) | 2,709 (12.9%) |
Technology Access in Will County
Computing Device Access in Will County
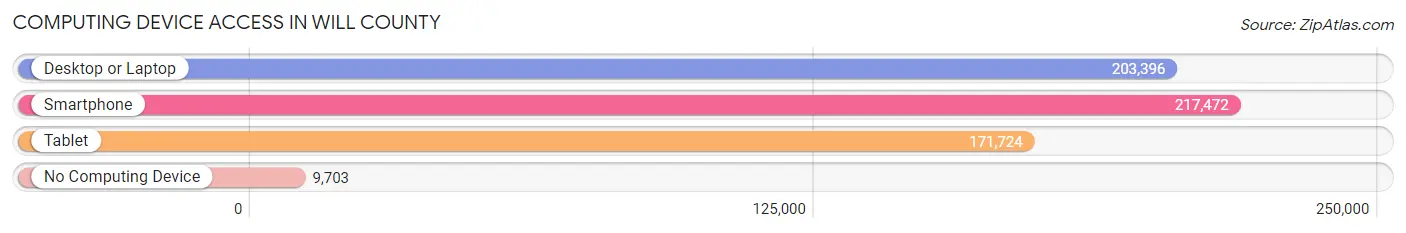
| Device Type | # Households | % Households |
| Desktop or Laptop | 203,396 | 85.1% |
| Smartphone | 217,472 | 91.0% |
| Tablet | 171,724 | 71.8% |
| No Computing Device | 9,703 | 4.1% |
| Total | 239,064 | 100.0% |
Internet Access in Will County
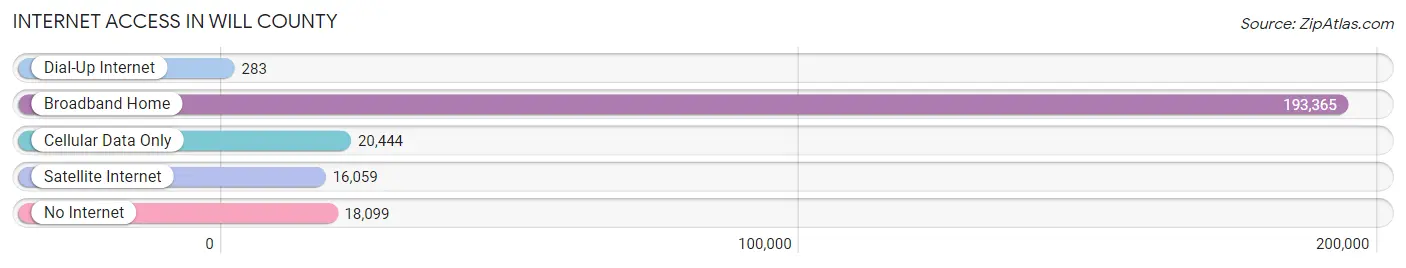
| Internet Type | # Households | % Households |
| Dial-Up Internet | 283 | 0.1% |
| Broadband Home | 193,365 | 80.9% |
| Cellular Data Only | 20,444 | 8.6% |
| Satellite Internet | 16,059 | 6.7% |
| No Internet | 18,099 | 7.6% |
| Total | 239,064 | 100.0% |
Will County Summary
Will County is located in the northeastern corner of Illinois and is part of the Chicago metropolitan area. It is the fourth most populous county in the state, with a population of 677,560 as of the 2010 census. The county seat is Joliet, and the largest city is Naperville. Will County is bordered by Cook County to the north, DuPage County to the east, Kendall County to the south, and Grundy and LaSalle Counties to the west.
History
Will County was formed in 1836 from parts of Cook and Iroquois Counties. It was named after Dr. Conrad Will, a prominent local politician and physician. The county was initially settled by immigrants from the eastern United States, and the population grew rapidly in the 19th century. The county was home to several Native American tribes, including the Potawatomi, Ottawa, and Chippewa.
The county was an important transportation hub in the 19th century, with the Illinois and Michigan Canal connecting the Great Lakes to the Mississippi River. The canal was completed in 1848 and was a major factor in the county’s growth. The county was also home to several railroads, including the Chicago and Alton Railroad, the Chicago, Rock Island and Pacific Railroad, and the Chicago, Burlington and Quincy Railroad.
Geography
Will County covers an area of 849 square miles, making it the second largest county in Illinois. The county is located in the northeastern corner of the state, and is part of the Chicago metropolitan area. The county is bordered by Cook County to the north, DuPage County to the east, Kendall County to the south, and Grundy and LaSalle Counties to the west.
The county is divided into two distinct regions. The northern part of the county is part of the Chicago metropolitan area and is largely urban and suburban. The southern part of the county is more rural, with rolling hills and farmland. The Kankakee River runs through the county, and there are several lakes and reservoirs, including Lake Renwick and Lake Channahon.
Economy
Will County has a diverse economy, with a mix of manufacturing, retail, and service industries. The county is home to several major employers, including Caterpillar, Inc., Amazon, and Walgreens. The county is also home to several universities and colleges, including the University of St. Francis, Lewis University, and Joliet Junior College.
The county is also home to several major transportation hubs, including the Chicago Midway International Airport, the Joliet Union Station, and the Joliet Intermodal Center. The county is also home to several major highways, including Interstate 55, Interstate 80, and Interstate 57.
Demographics
As of the 2010 census, Will County had a population of 677,560. The racial makeup of the county was 77.3% White, 11.3% African American, 0.4% Native American, 4.2% Asian, and 6.8% from other races. Hispanic or Latino of any race were 18.3% of the population.
The median household income in the county was $76,824, and the median family income was $90,917. The per capita income was $32,945. The poverty rate was 8.3%.
Will County is home to a large number of immigrants, with the largest groups coming from Mexico, India, Poland, and the Philippines. The county is also home to a large number of religious groups, including Catholics, Protestants, Muslims, and Jews.
Common Questions
What is the Total Population of Will County?
Total Population of Will County is 696,774.
What is the Total Male Population of Will County?
Total Male Population of Will County is 348,352.
What is the Total Female Population of Will County?
Total Female Population of Will County is 348,422.
What is the Ratio of Males per 100 Females in Will County?
There are 99.98 Males per 100 Females in Will County.
What is the Ratio of Females per 100 Males in Will County?
There are 100.02 Females per 100 Males in Will County.
What is the Median Population Age in Will County?
Median Population Age in Will County is 38.7 Years.
What is the Average Family Size in Will County
Average Family Size in Will County is 3.4 People.
What is the Average Household Size in Will County
Average Household Size in Will County is 2.9 People.
What is Per Capita Income in Will County?
Per Capita income in Will County is $44,356.
What is the Median Family Income in Will County?
Median Family Income in Will County is $119,675.
What is the Median Household income in Will County?
Median Household Income in Will County is $103,678.
What is Income or Wage Gap in Will County?
Income or Wage Gap in Will County is 36.5%.
Women in Will County earn 63.5 cents for every dollar earned by a man.
What is Family Income Deficit in Will County?
Family Income Deficit in Will County is $12,072.
Families that are below poverty line in Will County earn $12,072 less on average than the poverty threshold level.
What is Inequality or Gini Index in Will County?
Inequality or Gini Index in Will County is 0.41.
How Large is the Labor Force in Will County?
There are 378,677 People in the Labor Forcein in Will County.
What is the Percentage of People in the Labor Force in Will County?
68.8% of People are in the Labor Force in Will County.
What is the Unemployment Rate in Will County?
Unemployment Rate in Will County is 5.0%.