Kendall County, IL
Kendall County Map
Kendall County Overview
132,795
TOTAL POPULATION
66,370
MALE POPULATION
66,425
FEMALE POPULATION
99.92
MALES / 100 FEMALES
100.08
FEMALES / 100 MALES
36.1
MEDIAN AGE
3.5
AVG FAMILY SIZE
3.0
AVG HOUSEHOLD SIZE
$40,761
PER CAPITA INCOME
$114,678
AVG FAMILY INCOME
$106,358
AVG HOUSEHOLD INCOME
31.3%
WAGE / INCOME GAP [ % ]
68.7¢/ $1
WAGE / INCOME GAP [ $ ]
$13,944
FAMILY INCOME DEFICIT
0.35
INEQUALITY / GINI INDEX
72,596
LABOR FORCE [ PEOPLE ]
72.3%
PERCENT IN LABOR FORCE
4.3%
UNEMPLOYMENT RATE
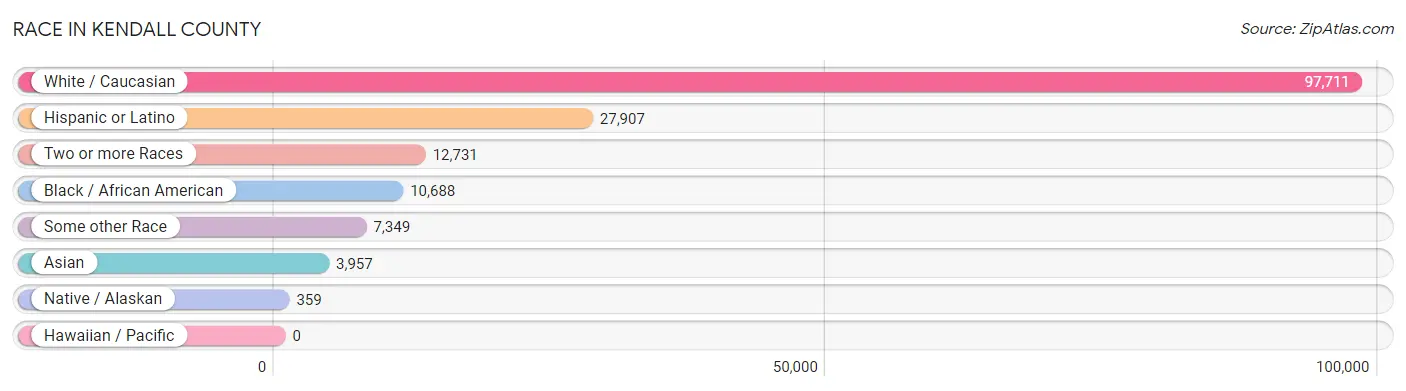
Race in Kendall County
The most populous races in Kendall County are White / Caucasian (97,711 | 73.6%), Hispanic or Latino (27,907 | 21.0%), and Two or more Races (12,731 | 9.6%).
| Race | # Population | % Population |
| Asian | 3,957 | 3.0% |
| Black / African American | 10,688 | 8.1% |
| Hawaiian / Pacific | 0 | 0.0% |
| Hispanic or Latino | 27,907 | 21.0% |
| Native / Alaskan | 359 | 0.3% |
| White / Caucasian | 97,711 | 73.6% |
| Two or more Races | 12,731 | 9.6% |
| Some other Race | 7,349 | 5.5% |
| Total | 132,795 | 100.0% |
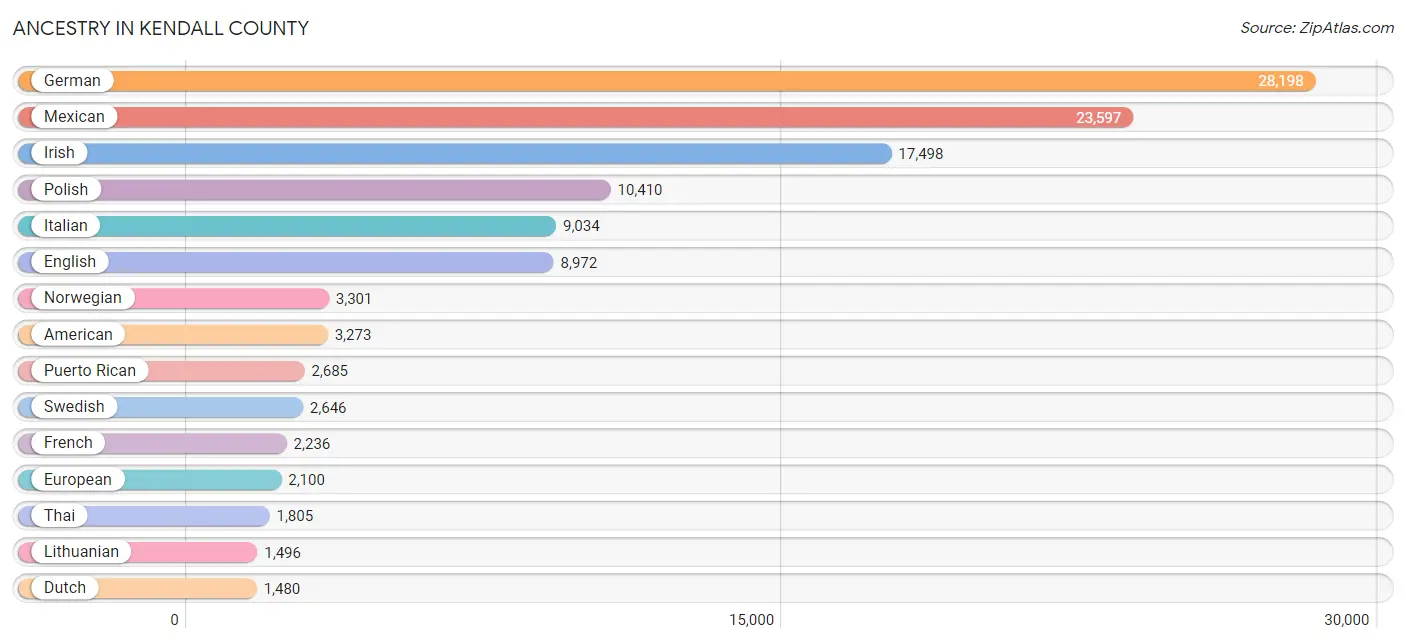
Ancestry in Kendall County
The most populous ancestries reported in Kendall County are German (28,198 | 21.2%), Mexican (23,597 | 17.8%), Irish (17,498 | 13.2%), Polish (10,410 | 7.8%), and Italian (9,034 | 6.8%), together accounting for 66.8% of all Kendall County residents.
| Ancestry | # Population | % Population |
| African | 157 | 0.1% |
| Albanian | 224 | 0.2% |
| American | 3,273 | 2.5% |
| Apache | 22 | 0.0% |
| Arab | 281 | 0.2% |
| Argentinean | 33 | 0.0% |
| Assyrian / Chaldean / Syriac | 3 | 0.0% |
| Australian | 4 | 0.0% |
| Austrian | 278 | 0.2% |
| Barbadian | 18 | 0.0% |
| Belgian | 495 | 0.4% |
| Bhutanese | 273 | 0.2% |
| Blackfeet | 89 | 0.1% |
| Brazilian | 31 | 0.0% |
| British | 501 | 0.4% |
| Bulgarian | 64 | 0.1% |
| Burmese | 441 | 0.3% |
| Cambodian | 6 | 0.0% |
| Canadian | 152 | 0.1% |
| Central American | 449 | 0.3% |
| Central American Indian | 108 | 0.1% |
| Cherokee | 328 | 0.3% |
| Chippewa | 9 | 0.0% |
| Choctaw | 40 | 0.0% |
| Colombian | 22 | 0.0% |
| Croatian | 564 | 0.4% |
| Cuban | 172 | 0.1% |
| Czech | 1,320 | 1.0% |
| Czechoslovakian | 177 | 0.1% |
| Danish | 628 | 0.5% |
| Dominican | 148 | 0.1% |
| Dutch | 1,480 | 1.1% |
| Eastern European | 218 | 0.2% |
| Ecuadorian | 246 | 0.2% |
| English | 8,972 | 6.8% |
| Estonian | 33 | 0.0% |
| Ethiopian | 20 | 0.0% |
| European | 2,100 | 1.6% |
| Finnish | 47 | 0.0% |
| French | 2,236 | 1.7% |
| French Canadian | 330 | 0.3% |
| German | 28,198 | 21.2% |
| Greek | 957 | 0.7% |
| Guatemalan | 205 | 0.2% |
| Haitian | 14 | 0.0% |
| Honduran | 44 | 0.0% |
| Hungarian | 494 | 0.4% |
| Indian (Asian) | 928 | 0.7% |
| Indonesian | 2 | 0.0% |
| Irish | 17,498 | 13.2% |
| Israeli | 6 | 0.0% |
| Italian | 9,034 | 6.8% |
| Jamaican | 109 | 0.1% |
| Japanese | 29 | 0.0% |
| Korean | 1,470 | 1.1% |
| Latvian | 43 | 0.0% |
| Lebanese | 1 | 0.0% |
| Liberian | 17 | 0.0% |
| Lithuanian | 1,496 | 1.1% |
| Luxembourger | 257 | 0.2% |
| Malaysian | 127 | 0.1% |
| Mexican | 23,597 | 17.8% |
| Mexican American Indian | 177 | 0.1% |
| Native Hawaiian | 125 | 0.1% |
| Nicaraguan | 21 | 0.0% |
| Nigerian | 229 | 0.2% |
| Northern European | 124 | 0.1% |
| Norwegian | 3,301 | 2.5% |
| Pakistani | 85 | 0.1% |
| Panamanian | 72 | 0.1% |
| Peruvian | 161 | 0.1% |
| Polish | 10,410 | 7.8% |
| Portuguese | 97 | 0.1% |
| Puerto Rican | 2,685 | 2.0% |
| Romanian | 835 | 0.6% |
| Russian | 1,092 | 0.8% |
| Salvadoran | 107 | 0.1% |
| Scandinavian | 140 | 0.1% |
| Scotch-Irish | 493 | 0.4% |
| Scottish | 1,200 | 0.9% |
| Serbian | 89 | 0.1% |
| Sioux | 6 | 0.0% |
| Slavic | 120 | 0.1% |
| Slovak | 339 | 0.3% |
| Slovene | 229 | 0.2% |
| South American | 510 | 0.4% |
| Spaniard | 46 | 0.0% |
| Spanish | 213 | 0.2% |
| Sri Lankan | 246 | 0.2% |
| Subsaharan African | 553 | 0.4% |
| Swedish | 2,646 | 2.0% |
| Swiss | 225 | 0.2% |
| Thai | 1,805 | 1.4% |
| Ukrainian | 187 | 0.1% |
| Venezuelan | 48 | 0.0% |
| Welsh | 347 | 0.3% |
| West Indian | 16 | 0.0% |
| Yugoslavian | 28 | 0.0% | View All 98 Rows |
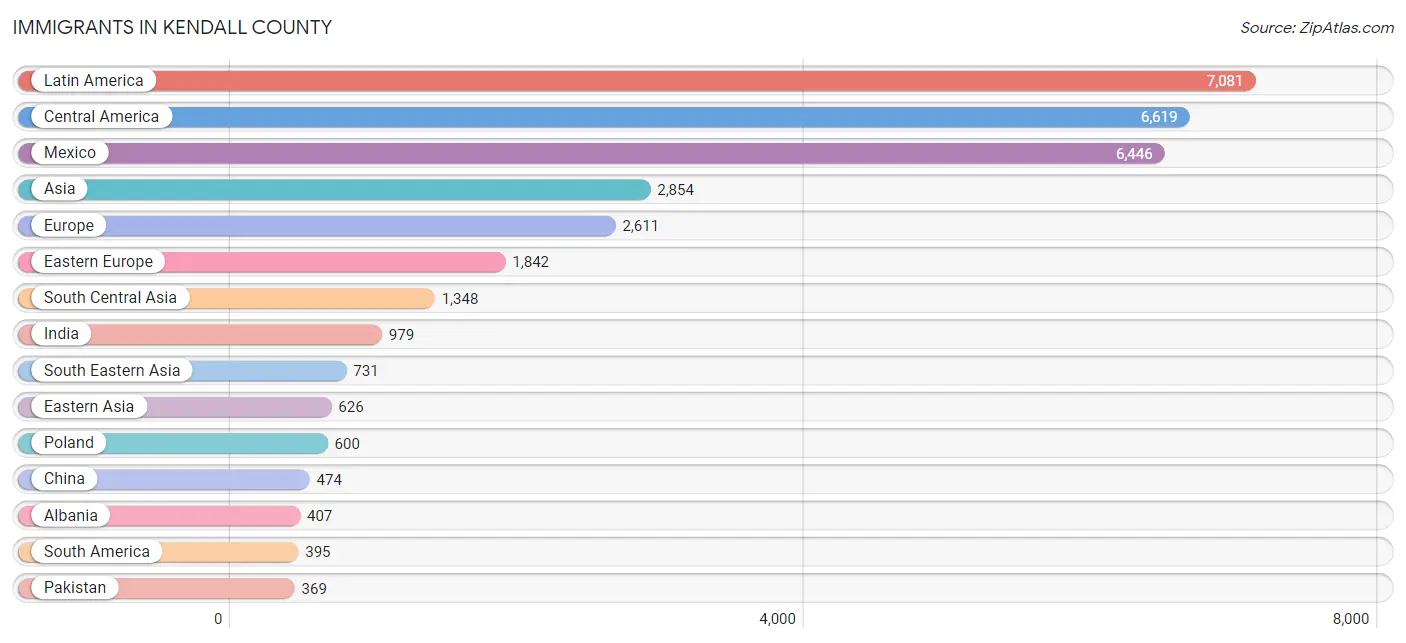
Immigrants in Kendall County
The most numerous immigrant groups reported in Kendall County came from Latin America (7,081 | 5.3%), Central America (6,619 | 5.0%), Mexico (6,446 | 4.9%), Asia (2,854 | 2.1%), and Europe (2,611 | 2.0%), together accounting for 19.3% of all Kendall County residents.
| Immigration Origin | # Population | % Population |
| Africa | 357 | 0.3% |
| Albania | 407 | 0.3% |
| Asia | 2,854 | 2.1% |
| Austria | 79 | 0.1% |
| Barbados | 31 | 0.0% |
| Bosnia and Herzegovina | 19 | 0.0% |
| Brazil | 72 | 0.1% |
| Bulgaria | 40 | 0.0% |
| Cambodia | 4 | 0.0% |
| Cameroon | 91 | 0.1% |
| Canada | 78 | 0.1% |
| Caribbean | 67 | 0.1% |
| Central America | 6,619 | 5.0% |
| China | 474 | 0.4% |
| Colombia | 55 | 0.0% |
| Dominican Republic | 8 | 0.0% |
| Eastern Africa | 20 | 0.0% |
| Eastern Asia | 626 | 0.5% |
| Eastern Europe | 1,842 | 1.4% |
| Ecuador | 209 | 0.2% |
| El Salvador | 136 | 0.1% |
| England | 68 | 0.1% |
| Ethiopia | 20 | 0.0% |
| Europe | 2,611 | 2.0% |
| France | 178 | 0.1% |
| Germany | 24 | 0.0% |
| Greece | 31 | 0.0% |
| Guatemala | 37 | 0.0% |
| Hong Kong | 69 | 0.1% |
| Hungary | 14 | 0.0% |
| India | 979 | 0.7% |
| Iraq | 132 | 0.1% |
| Italy | 210 | 0.2% |
| Jamaica | 28 | 0.0% |
| Japan | 36 | 0.0% |
| Jordan | 14 | 0.0% |
| Korea | 116 | 0.1% |
| Laos | 81 | 0.1% |
| Latin America | 7,081 | 5.3% |
| Latvia | 4 | 0.0% |
| Liberia | 12 | 0.0% |
| Lithuania | 132 | 0.1% |
| Malaysia | 60 | 0.1% |
| Mexico | 6,446 | 4.9% |
| Middle Africa | 91 | 0.1% |
| Moldova | 295 | 0.2% |
| Morocco | 24 | 0.0% |
| Nigeria | 210 | 0.2% |
| North Macedonia | 9 | 0.0% |
| Northern Africa | 24 | 0.0% |
| Northern Europe | 235 | 0.2% |
| Pakistan | 369 | 0.3% |
| Philippines | 366 | 0.3% |
| Poland | 600 | 0.4% |
| Romania | 31 | 0.0% |
| Russia | 192 | 0.1% |
| Scotland | 115 | 0.1% |
| South America | 395 | 0.3% |
| South Central Asia | 1,348 | 1.0% |
| South Eastern Asia | 731 | 0.5% |
| Southern Europe | 241 | 0.2% |
| Switzerland | 12 | 0.0% |
| Syria | 3 | 0.0% |
| Taiwan | 24 | 0.0% |
| Thailand | 58 | 0.0% |
| Ukraine | 92 | 0.1% |
| Venezuela | 48 | 0.0% |
| Vietnam | 160 | 0.1% |
| Western Africa | 222 | 0.2% |
| Western Asia | 149 | 0.1% |
| Western Europe | 293 | 0.2% | View All 71 Rows |
Sex and Age in Kendall County
Sex and Age in Kendall County
The most populous age groups in Kendall County are 5 to 9 Years (6,206 | 9.3%) for men and 40 to 44 Years (5,990 | 9.0%) for women.

| Age Bracket | Male | Female |
| Under 5 Years | 4,233 (6.4%) | 3,994 (6.0%) |
| 5 to 9 Years | 6,206 (9.3%) | 5,650 (8.5%) |
| 10 to 14 Years | 4,851 (7.3%) | 4,859 (7.3%) |
| 15 to 19 Years | 5,527 (8.3%) | 5,062 (7.6%) |
| 20 to 24 Years | 3,993 (6.0%) | 3,511 (5.3%) |
| 25 to 29 Years | 3,549 (5.3%) | 4,050 (6.1%) |
| 30 to 34 Years | 4,263 (6.4%) | 4,438 (6.7%) |
| 35 to 39 Years | 5,046 (7.6%) | 4,844 (7.3%) |
| 40 to 44 Years | 5,774 (8.7%) | 5,990 (9.0%) |
| 45 to 49 Years | 5,201 (7.8%) | 4,991 (7.5%) |
| 50 to 54 Years | 4,616 (7.0%) | 4,370 (6.6%) |
| 55 to 59 Years | 4,066 (6.1%) | 3,649 (5.5%) |
| 60 to 64 Years | 2,622 (4.0%) | 3,128 (4.7%) |
| 65 to 69 Years | 2,538 (3.8%) | 2,744 (4.1%) |
| 70 to 74 Years | 1,666 (2.5%) | 1,984 (3.0%) |
| 75 to 79 Years | 1,300 (2.0%) | 1,375 (2.1%) |
| 80 to 84 Years | 422 (0.6%) | 760 (1.1%) |
| 85 Years and over | 497 (0.7%) | 1,026 (1.5%) |
| Total | 66,370 (100.0%) | 66,425 (100.0%) |
Families and Households in Kendall County
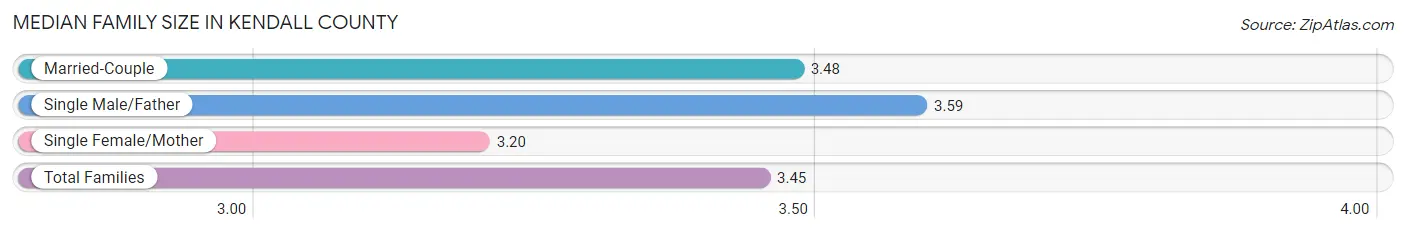
Median Family Size in Kendall County
The median family size in Kendall County is 3.45 persons per family, with single male/father families (2,516 | 7.3%) accounting for the largest median family size of 3.59 persons per family. On the other hand, single female/mother families (4,810 | 14.1%) represent the smallest median family size with 3.20 persons per family.
| Family Type | # Families | Family Size |
| Married-Couple | 26,899 (78.6%) | 3.48 |
| Single Male/Father | 2,516 (7.3%) | 3.59 |
| Single Female/Mother | 4,810 (14.1%) | 3.20 |
| Total Families | 34,225 (100.0%) | 3.45 |
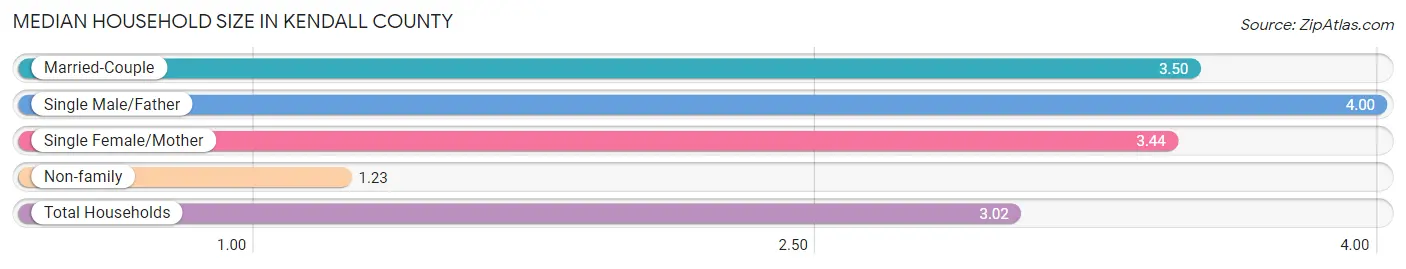
Median Household Size in Kendall County
The median household size in Kendall County is 3.02 persons per household, with single male/father households (2,516 | 5.7%) accounting for the largest median household size of 4 persons per household. non-family households (9,653 | 22.0%) represent the smallest median household size with 1.23 persons per household.
| Household Type | # Households | Household Size |
| Married-Couple | 26,899 (61.3%) | 3.50 |
| Single Male/Father | 2,516 (5.7%) | 4.00 |
| Single Female/Mother | 4,810 (11.0%) | 3.44 |
| Non-family | 9,653 (22.0%) | 1.23 |
| Total Households | 43,878 (100.0%) | 3.02 |
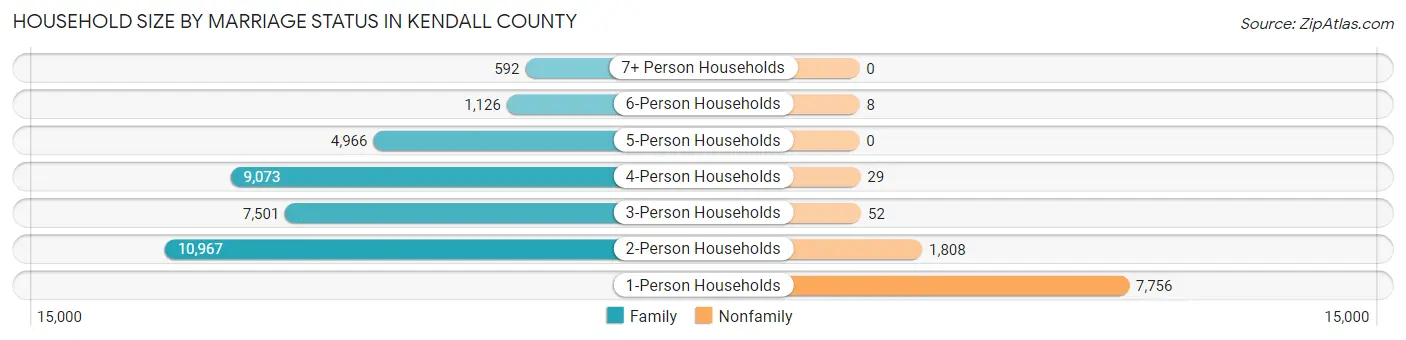
Household Size by Marriage Status in Kendall County
Out of a total of 43,878 households in Kendall County, 34,225 (78.0%) are family households, while 9,653 (22.0%) are nonfamily households. The most numerous type of family households are 2-person households, comprising 10,967, and the most common type of nonfamily households are 1-person households, comprising 7,756.
| Household Size | Family Households | Nonfamily Households |
| 1-Person Households | - | 7,756 (17.7%) |
| 2-Person Households | 10,967 (25.0%) | 1,808 (4.1%) |
| 3-Person Households | 7,501 (17.1%) | 52 (0.1%) |
| 4-Person Households | 9,073 (20.7%) | 29 (0.1%) |
| 5-Person Households | 4,966 (11.3%) | 0 (0.0%) |
| 6-Person Households | 1,126 (2.6%) | 8 (0.0%) |
| 7+ Person Households | 592 (1.3%) | 0 (0.0%) |
| Total | 34,225 (78.0%) | 9,653 (22.0%) |
Female Fertility in Kendall County
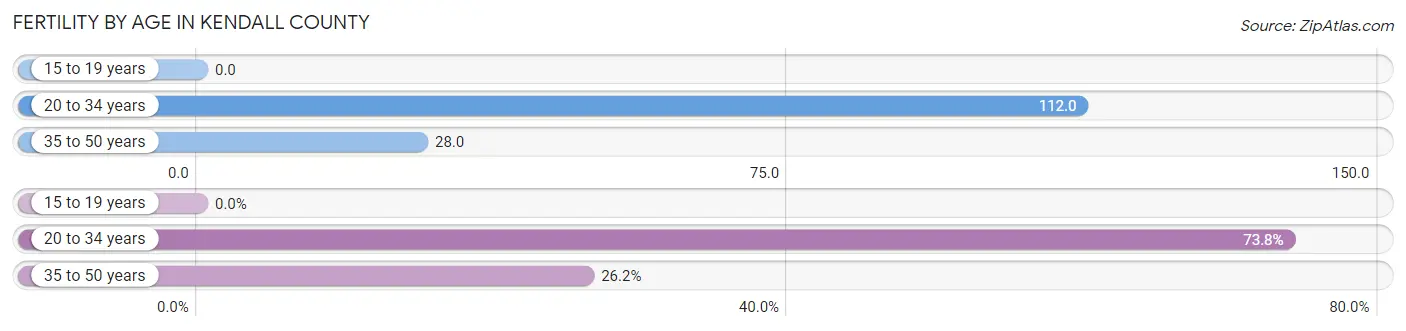
Fertility by Age in Kendall County
Average fertility rate in Kendall County is 53.0 births per 1,000 women. Women in the age bracket of 20 to 34 years have the highest fertility rate with 112.0 births per 1,000 women. Women in the age bracket of 20 to 34 years acount for 73.8% of all women with births.
| Age Bracket | Women with Births | Births / 1,000 Women |
| 15 to 19 years | 0 (0.0%) | 0.0 |
| 20 to 34 years | 1,343 (73.8%) | 112.0 |
| 35 to 50 years | 477 (26.2%) | 28.0 |
| Total | 1,820 (100.0%) | 53.0 |
Fertility by Age by Marriage Status in Kendall County
78.4% of women with births (1,820) in Kendall County are married. The highest percentage of unmarried women with births falls into 20 to 34 years age bracket with 25.9% of them unmarried at the time of birth, while the lowest percentage of unmarried women with births belong to 35 to 50 years age bracket with 9.6% of them unmarried.
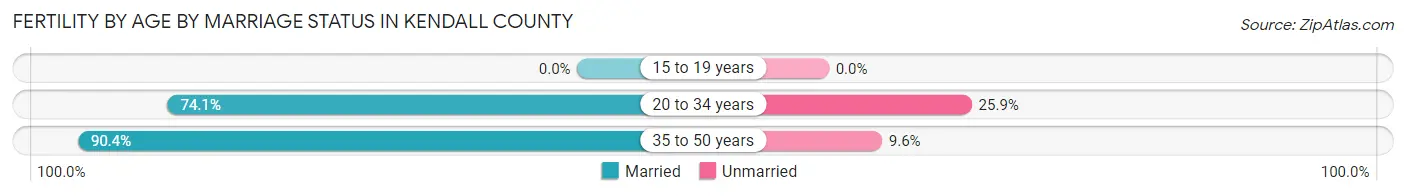
| Age Bracket | Married | Unmarried |
| 15 to 19 years | 0 (0.0%) | 0 (0.0%) |
| 20 to 34 years | 995 (74.1%) | 348 (25.9%) |
| 35 to 50 years | 431 (90.4%) | 46 (9.6%) |
| Total | 1,427 (78.4%) | 393 (21.6%) |
Fertility by Education in Kendall County
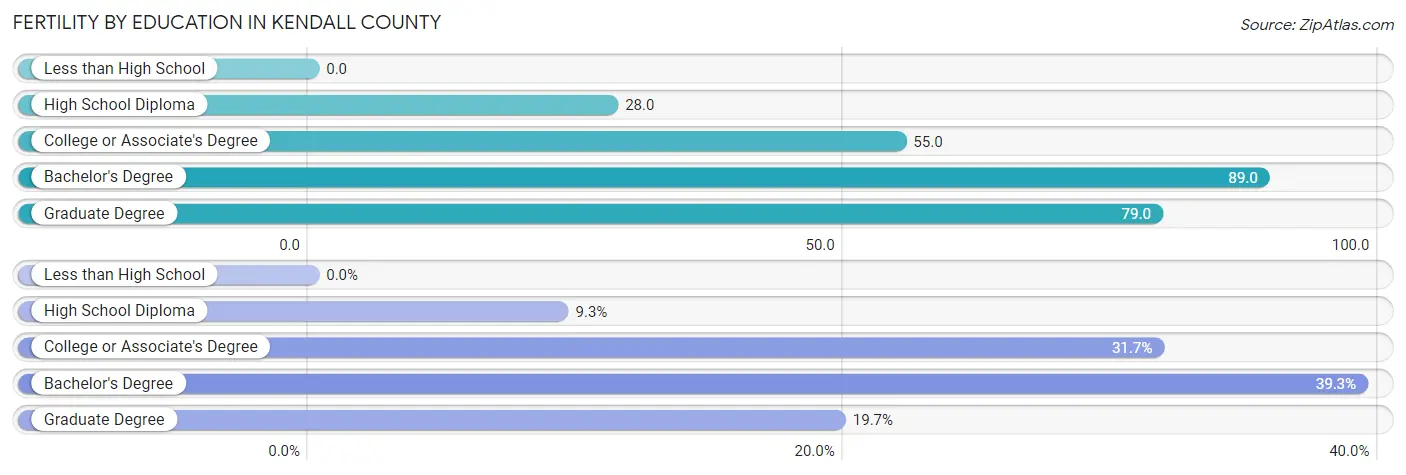
| Educational Attainment | Women with Births | Births / 1,000 Women |
| Less than High School | 0 (0.0%) | 0.0 |
| High School Diploma | 170 (9.3%) | 28.0 |
| College or Associate's Degree | 576 (31.7%) | 55.0 |
| Bachelor's Degree | 715 (39.3%) | 89.0 |
| Graduate Degree | 359 (19.7%) | 79.0 |
| Total | 1,820 (100.0%) | 53.0 |
Fertility by Education by Marriage Status in Kendall County
21.6% of women with births in Kendall County are unmarried. Women with the educational attainment of graduate degree are most likely to be married with 100.0% of them married at childbirth, while women with the educational attainment of high school diploma are least likely to be married with 64.7% of them unmarried at childbirth.
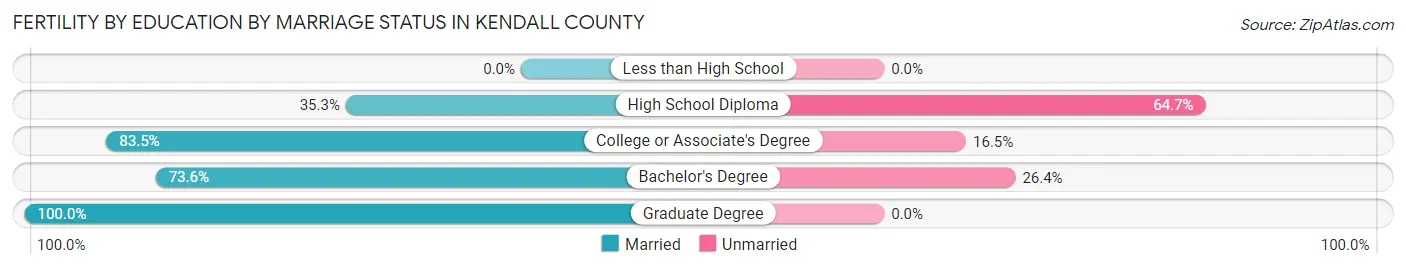
| Educational Attainment | Married | Unmarried |
| Less than High School | 0 (0.0%) | 0 (0.0%) |
| High School Diploma | 60 (35.3%) | 110 (64.7%) |
| College or Associate's Degree | 481 (83.5%) | 95 (16.5%) |
| Bachelor's Degree | 526 (73.6%) | 189 (26.4%) |
| Graduate Degree | 359 (100.0%) | 0 (0.0%) |
| Total | 1,427 (78.4%) | 393 (21.6%) |
Income in Kendall County
Income Overview in Kendall County
Per Capita Income in Kendall County is $40,761, while median incomes of families and households are $114,678 and $106,358 respectively.
| Characteristic | Number | Measure |
| Per Capita Income | 132,795 | $40,761 |
| Median Family Income | 34,225 | $114,678 |
| Mean Family Income | 34,225 | $131,253 |
| Median Household Income | 43,878 | $106,358 |
| Mean Household Income | 43,878 | $121,223 |
| Income Deficit | 34,225 | $13,944 |
| Wage / Income Gap (%) | 132,795 | 31.34% |
| Wage / Income Gap ($) | 132,795 | 68.66¢ per $1 |
| Gini / Inequality Index | 132,795 | 0.35 |
Earnings by Sex in Kendall County
Average Earnings in Kendall County are $50,772, $60,922 for men and $41,828 for women, a difference of 31.3%.
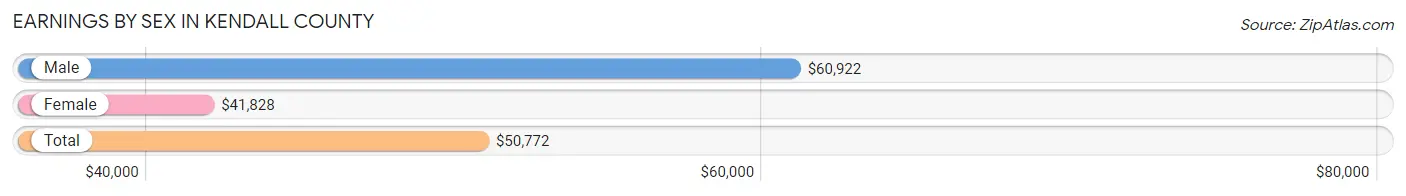
| Sex | Number | Average Earnings |
| Male | 39,687 (53.0%) | $60,922 |
| Female | 35,216 (47.0%) | $41,828 |
| Total | 74,903 (100.0%) | $50,772 |
Earnings by Sex by Income Bracket in Kendall County
The most common earnings brackets in Kendall County are $100,000+ for men (9,084 | 22.9%) and $55,000 to $64,999 for women (3,709 | 10.5%).
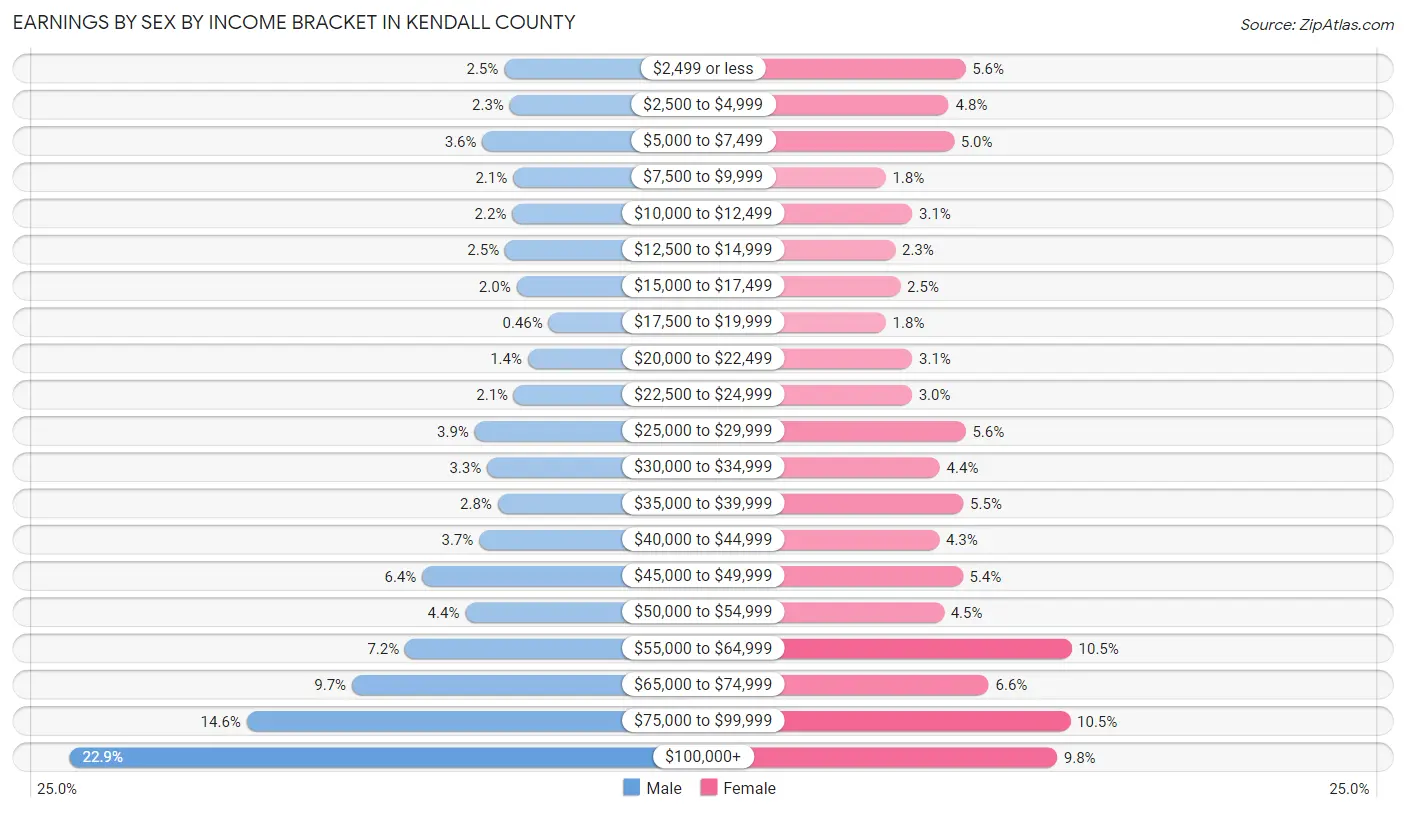
| Income | Male | Female |
| $2,499 or less | 1,010 (2.5%) | 1,953 (5.6%) |
| $2,500 to $4,999 | 906 (2.3%) | 1,681 (4.8%) |
| $5,000 to $7,499 | 1,411 (3.6%) | 1,765 (5.0%) |
| $7,500 to $9,999 | 842 (2.1%) | 639 (1.8%) |
| $10,000 to $12,499 | 856 (2.2%) | 1,076 (3.1%) |
| $12,500 to $14,999 | 994 (2.5%) | 796 (2.3%) |
| $15,000 to $17,499 | 779 (2.0%) | 880 (2.5%) |
| $17,500 to $19,999 | 184 (0.5%) | 641 (1.8%) |
| $20,000 to $22,499 | 566 (1.4%) | 1,079 (3.1%) |
| $22,500 to $24,999 | 826 (2.1%) | 1,070 (3.0%) |
| $25,000 to $29,999 | 1,557 (3.9%) | 1,958 (5.6%) |
| $30,000 to $34,999 | 1,326 (3.3%) | 1,531 (4.3%) |
| $35,000 to $39,999 | 1,127 (2.8%) | 1,921 (5.4%) |
| $40,000 to $44,999 | 1,471 (3.7%) | 1,522 (4.3%) |
| $45,000 to $49,999 | 2,534 (6.4%) | 1,907 (5.4%) |
| $50,000 to $54,999 | 1,731 (4.4%) | 1,598 (4.5%) |
| $55,000 to $64,999 | 2,849 (7.2%) | 3,709 (10.5%) |
| $65,000 to $74,999 | 3,839 (9.7%) | 2,340 (6.6%) |
| $75,000 to $99,999 | 5,795 (14.6%) | 3,683 (10.5%) |
| $100,000+ | 9,084 (22.9%) | 3,467 (9.8%) |
| Total | 39,687 (100.0%) | 35,216 (100.0%) |
Earnings by Sex by Educational Attainment in Kendall County
Average earnings in Kendall County are $69,202 for men and $47,326 for women, a difference of 31.6%. Men with an educational attainment of graduate degree enjoy the highest average annual earnings of $100,100, while those with less than high school education earn the least with $45,070. Women with an educational attainment of graduate degree earn the most with the average annual earnings of $71,588, while those with less than high school education have the smallest earnings of $21,179.
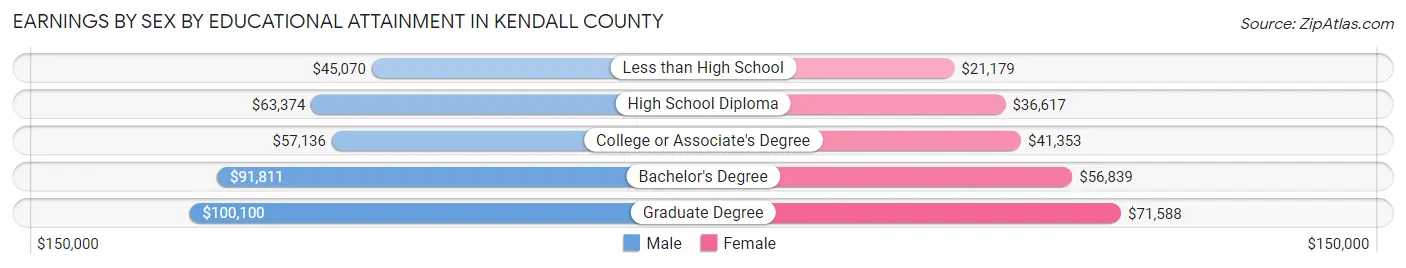
| Educational Attainment | Male Income | Female Income |
| Less than High School | $45,070 | $21,179 |
| High School Diploma | $63,374 | $36,617 |
| College or Associate's Degree | $57,136 | $41,353 |
| Bachelor's Degree | $91,811 | $56,839 |
| Graduate Degree | $100,100 | $71,588 |
| Total | $69,202 | $47,326 |
Family Income in Kendall County
Family Income Brackets in Kendall County
According to the Kendall County family income data, there are 10,062 families falling into the $100,000 to $149,999 income range, which is the most common income bracket and makes up 29.4% of all families. Conversely, the $10,000 to $14,999 income bracket is the least frequent group with only 376 families (1.1%) belonging to this category.
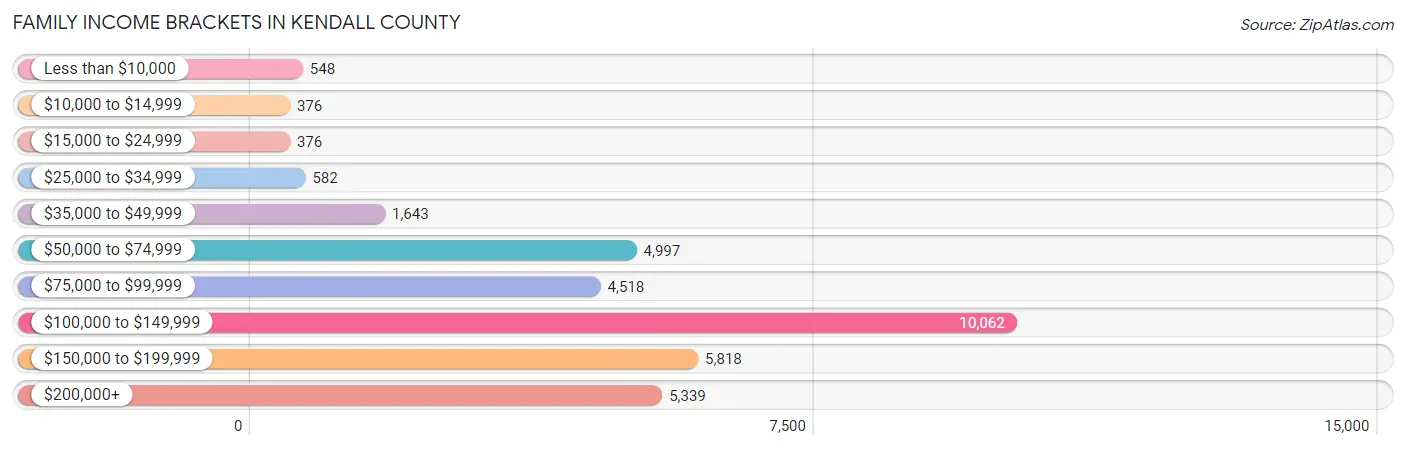
| Income Bracket | # Families | % Families |
| Less than $10,000 | 548 | 1.6% |
| $10,000 to $14,999 | 376 | 1.1% |
| $15,000 to $24,999 | 376 | 1.1% |
| $25,000 to $34,999 | 582 | 1.7% |
| $35,000 to $49,999 | 1,643 | 4.8% |
| $50,000 to $74,999 | 4,997 | 14.6% |
| $75,000 to $99,999 | 4,518 | 13.2% |
| $100,000 to $149,999 | 10,062 | 29.4% |
| $150,000 to $199,999 | 5,818 | 17.0% |
| $200,000+ | 5,339 | 15.6% |
Family Income by Famaliy Size in Kendall County
4-person families (8,561 | 25.0%) account for the highest median family income in Kendall County with $138,111 per family, while 2-person families (11,380 | 33.3%) have the highest median income of $51,298 per family member.
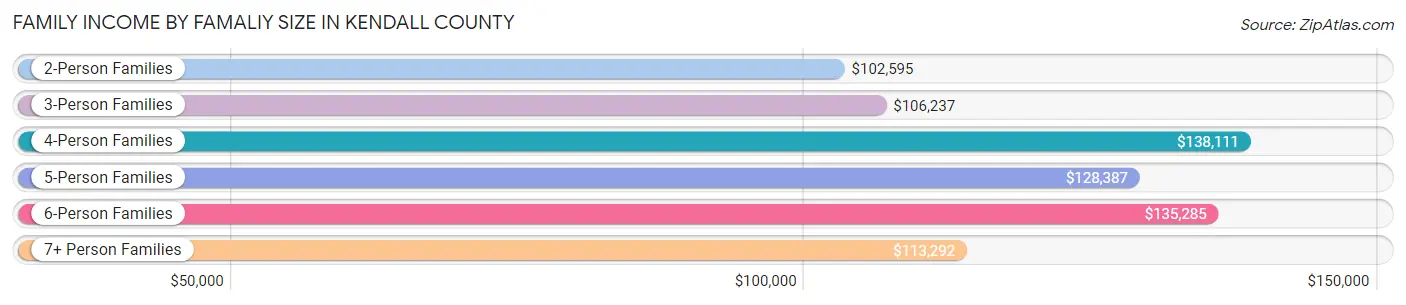
| Income Bracket | # Families | Median Income |
| 2-Person Families | 11,380 (33.3%) | $102,595 |
| 3-Person Families | 8,062 (23.6%) | $106,237 |
| 4-Person Families | 8,561 (25.0%) | $138,111 |
| 5-Person Families | 4,680 (13.7%) | $128,387 |
| 6-Person Families | 1,041 (3.0%) | $135,285 |
| 7+ Person Families | 501 (1.5%) | $113,292 |
| Total | 34,225 (100.0%) | $114,678 |
Family Income by Number of Earners in Kendall County
The median family income in Kendall County is $114,678, with families comprising 3+ earners (7,038) having the highest median family income of $148,565, while families with no earners (2,774) have the lowest median family income of $66,858, accounting for 20.6% and 8.1% of families, respectively.
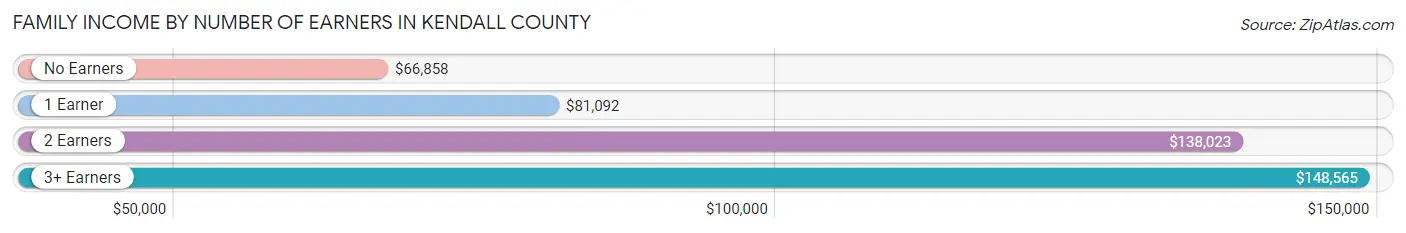
| Number of Earners | # Families | Median Income |
| No Earners | 2,774 (8.1%) | $66,858 |
| 1 Earner | 9,452 (27.6%) | $81,092 |
| 2 Earners | 14,961 (43.7%) | $138,023 |
| 3+ Earners | 7,038 (20.6%) | $148,565 |
| Total | 34,225 (100.0%) | $114,678 |
Household Income in Kendall County
Household Income Brackets in Kendall County
With 11,891 households falling in the category, the $100,000 to $149,999 income range is the most frequent in Kendall County, accounting for 27.1% of all households. In contrast, only 614 households (1.4%) fall into the $10,000 to $14,999 income bracket, making it the least populous group.
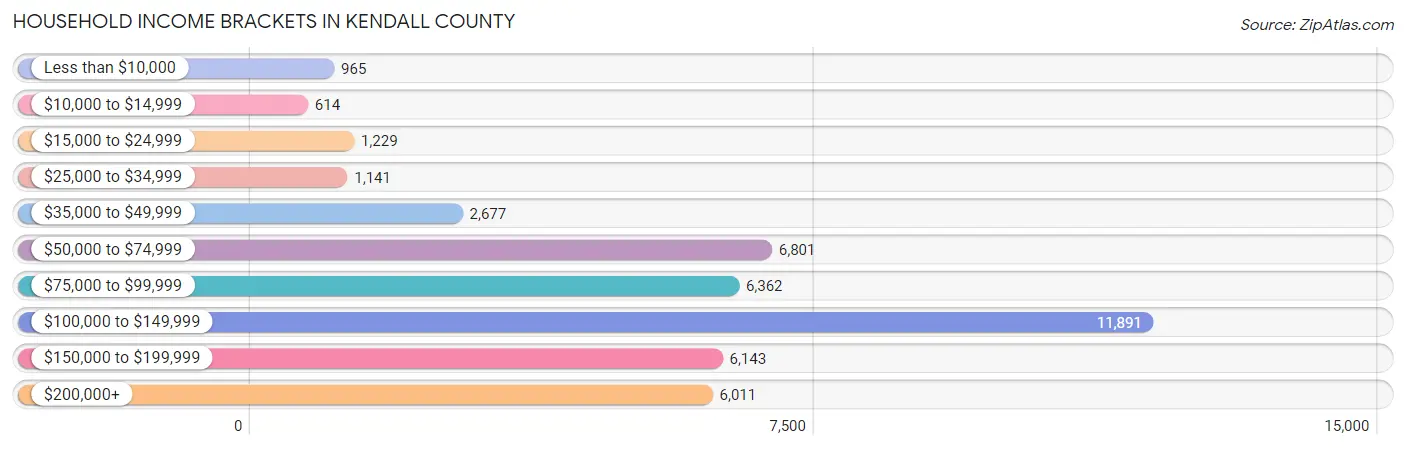
| Income Bracket | # Households | % Households |
| Less than $10,000 | 965 | 2.2% |
| $10,000 to $14,999 | 614 | 1.4% |
| $15,000 to $24,999 | 1,229 | 2.8% |
| $25,000 to $34,999 | 1,141 | 2.6% |
| $35,000 to $49,999 | 2,677 | 6.1% |
| $50,000 to $74,999 | 6,801 | 15.5% |
| $75,000 to $99,999 | 6,362 | 14.5% |
| $100,000 to $149,999 | 11,891 | 27.1% |
| $150,000 to $199,999 | 6,143 | 14.0% |
| $200,000+ | 6,011 | 13.7% |
Household Income by Householder Age in Kendall County
The median household income in Kendall County is $106,358, with the highest median household income of $114,664 found in the 45 to 64 years age bracket for the primary householder. A total of 17,990 households (41.0%) fall into this category. Meanwhile, the 65+ years age bracket for the primary householder has the lowest median household income of $68,219, with 8,321 households (19.0%) in this group.
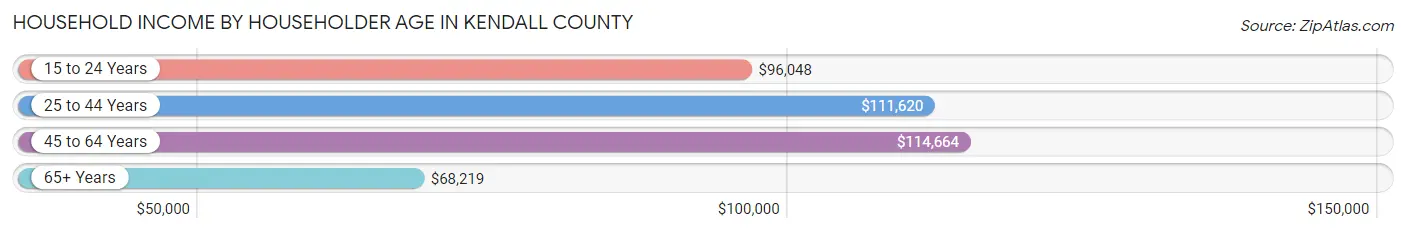
| Income Bracket | # Households | Median Income |
| 15 to 24 Years | 398 (0.9%) | $96,048 |
| 25 to 44 Years | 17,169 (39.1%) | $111,620 |
| 45 to 64 Years | 17,990 (41.0%) | $114,664 |
| 65+ Years | 8,321 (19.0%) | $68,219 |
| Total | 43,878 (100.0%) | $106,358 |
Poverty in Kendall County
Income Below Poverty by Sex and Age in Kendall County
With 4.0% poverty level for males and 5.5% for females among the residents of Kendall County, 15 year old males and 18 to 24 year old females are the most vulnerable to poverty, with 398 males (29.2%) and 455 females (8.8%) in their respective age groups living below the poverty level.
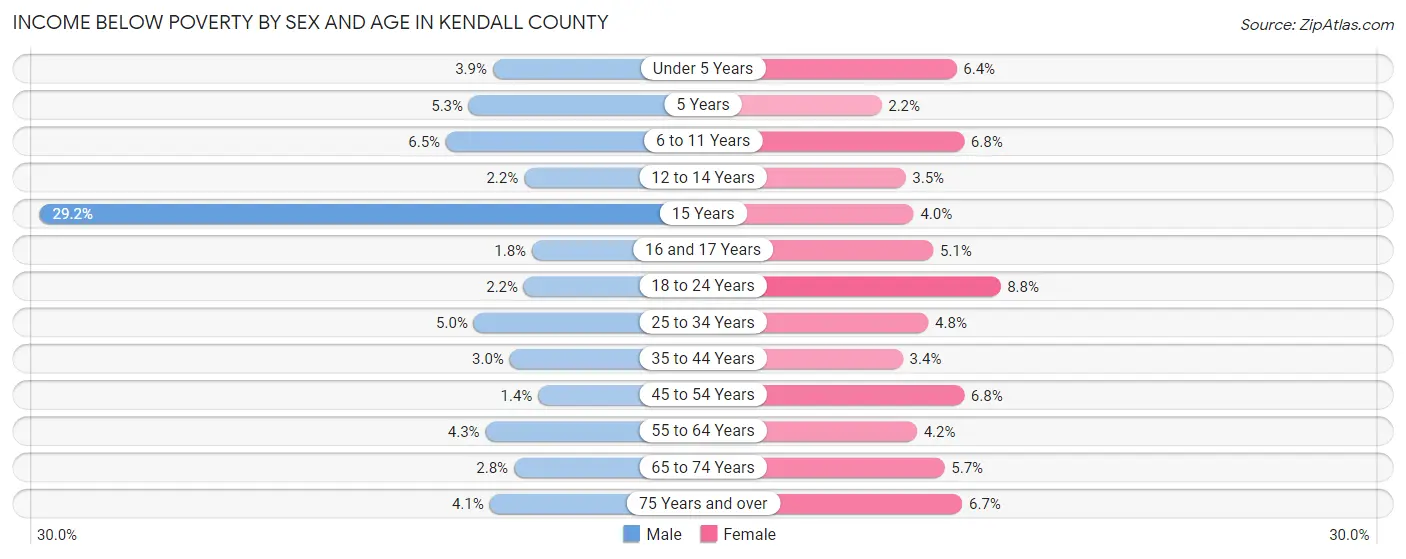
| Age Bracket | Male | Female |
| Under 5 Years | 165 (3.9%) | 254 (6.4%) |
| 5 Years | 51 (5.3%) | 14 (2.2%) |
| 6 to 11 Years | 473 (6.5%) | 466 (6.8%) |
| 12 to 14 Years | 61 (2.2%) | 104 (3.5%) |
| 15 Years | 398 (29.2%) | 49 (4.0%) |
| 16 and 17 Years | 38 (1.8%) | 111 (5.1%) |
| 18 to 24 Years | 131 (2.2%) | 455 (8.8%) |
| 25 to 34 Years | 388 (5.0%) | 408 (4.8%) |
| 35 to 44 Years | 322 (3.0%) | 367 (3.4%) |
| 45 to 54 Years | 137 (1.4%) | 636 (6.8%) |
| 55 to 64 Years | 290 (4.3%) | 282 (4.2%) |
| 65 to 74 Years | 115 (2.8%) | 266 (5.7%) |
| 75 Years and over | 91 (4.1%) | 208 (6.7%) |
| Total | 2,660 (4.0%) | 3,620 (5.5%) |
Income Above Poverty by Sex and Age in Kendall County
According to the poverty statistics in Kendall County, males aged 45 to 54 years and females aged 5 years are the age groups that are most secure financially, with 98.6% of males and 97.8% of females in these age groups living above the poverty line.
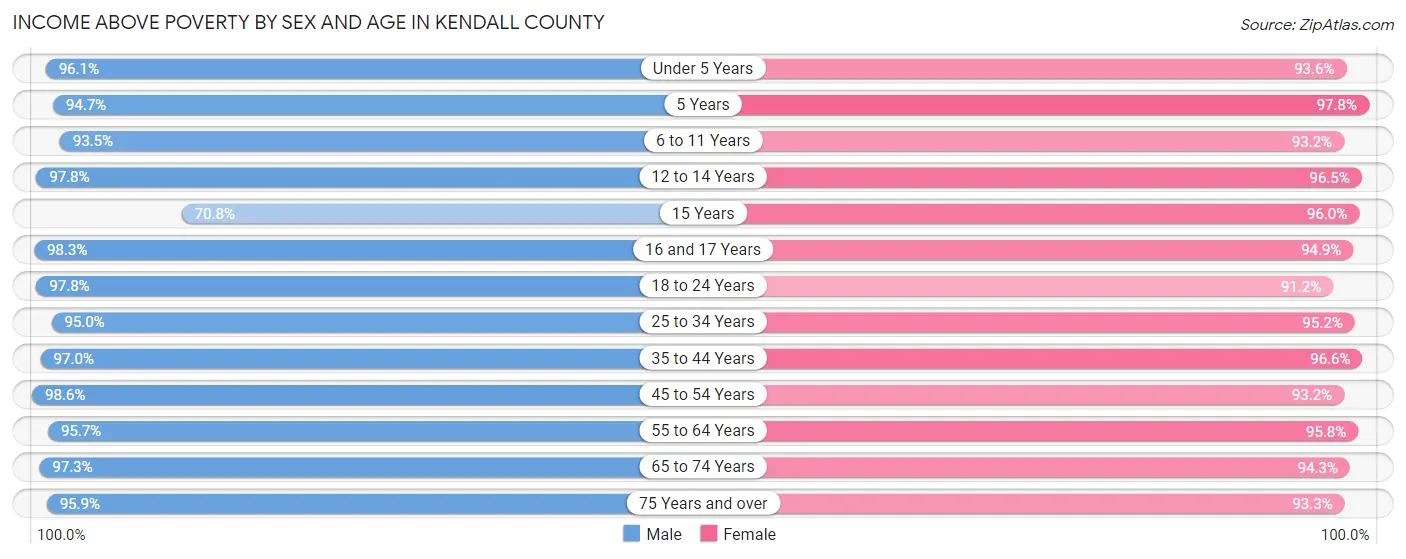
| Age Bracket | Male | Female |
| Under 5 Years | 4,035 (96.1%) | 3,728 (93.6%) |
| 5 Years | 919 (94.7%) | 623 (97.8%) |
| 6 to 11 Years | 6,758 (93.5%) | 6,382 (93.2%) |
| 12 to 14 Years | 2,719 (97.8%) | 2,833 (96.5%) |
| 15 Years | 967 (70.8%) | 1,178 (96.0%) |
| 16 and 17 Years | 2,134 (98.3%) | 2,074 (94.9%) |
| 18 to 24 Years | 5,836 (97.8%) | 4,702 (91.2%) |
| 25 to 34 Years | 7,391 (95.0%) | 8,080 (95.2%) |
| 35 to 44 Years | 10,459 (97.0%) | 10,467 (96.6%) |
| 45 to 54 Years | 9,674 (98.6%) | 8,719 (93.2%) |
| 55 to 64 Years | 6,390 (95.7%) | 6,487 (95.8%) |
| 65 to 74 Years | 4,072 (97.3%) | 4,390 (94.3%) |
| 75 Years and over | 2,123 (95.9%) | 2,897 (93.3%) |
| Total | 63,477 (96.0%) | 62,560 (94.5%) |
Income Below Poverty Among Married-Couple Families in Kendall County
The poverty statistics for married-couple families in Kendall County show that 0.7% or 191 of the total 26,899 families live below the poverty line. Families with 5 or more children have the highest poverty rate of 12.1%, comprising of 19 families. On the other hand, families with 1 or 2 children have the lowest poverty rate of 0.4%, which includes 51 families.
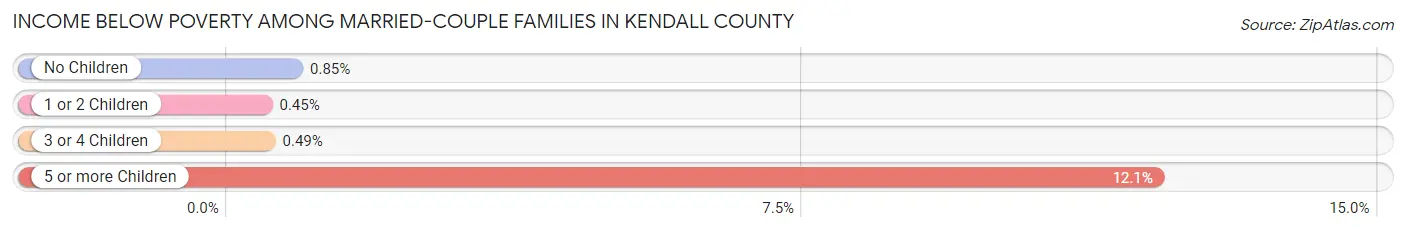
| Children | Above Poverty | Below Poverty |
| No Children | 12,537 (99.2%) | 108 (0.9%) |
| 1 or 2 Children | 11,372 (99.6%) | 51 (0.4%) |
| 3 or 4 Children | 2,661 (99.5%) | 13 (0.5%) |
| 5 or more Children | 138 (87.9%) | 19 (12.1%) |
| Total | 26,708 (99.3%) | 191 (0.7%) |
Income Below Poverty Among Single-Parent Households in Kendall County
According to the poverty data in Kendall County, 5.2% or 131 single-father households and 17.4% or 836 single-mother households are living below the poverty line. Among single-father households, those with 3 or 4 children have the highest poverty rate, with 73 households (31.2%) experiencing poverty. Likewise, among single-mother households, those with 3 or 4 children have the highest poverty rate, with 163 households (27.0%) falling below the poverty line.
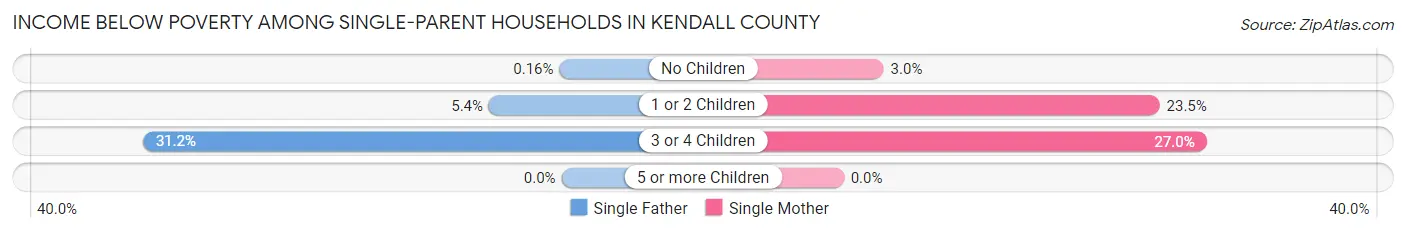
| Children | Single Father | Single Mother |
| No Children | 2 (0.2%) | 46 (3.0%) |
| 1 or 2 Children | 56 (5.4%) | 627 (23.5%) |
| 3 or 4 Children | 73 (31.2%) | 163 (27.0%) |
| 5 or more Children | 0 (0.0%) | 0 (0.0%) |
| Total | 131 (5.2%) | 836 (17.4%) |
Income Below Poverty Among Married-Couple vs Single-Parent Households in Kendall County
The poverty data for Kendall County shows that 191 of the married-couple family households (0.7%) and 967 of the single-parent households (13.2%) are living below the poverty level. Within the married-couple family households, those with 5 or more children have the highest poverty rate, with 19 households (12.1%) falling below the poverty line. Among the single-parent households, those with 3 or 4 children have the highest poverty rate, with 236 household (28.2%) living below poverty.
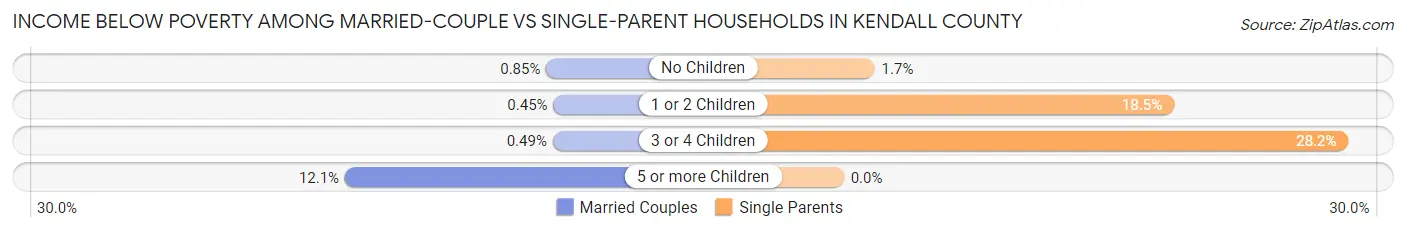
| Children | Married-Couple Families | Single-Parent Households |
| No Children | 108 (0.9%) | 48 (1.7%) |
| 1 or 2 Children | 51 (0.4%) | 683 (18.5%) |
| 3 or 4 Children | 13 (0.5%) | 236 (28.2%) |
| 5 or more Children | 19 (12.1%) | 0 (0.0%) |
| Total | 191 (0.7%) | 967 (13.2%) |
Employment Characteristics in Kendall County
Employment by Class of Employer in Kendall County
Among the 68,047 employed individuals in Kendall County, private company employees (48,844 | 71.8%), local government employees (6,486 | 9.5%), and not-for-profit organizations (4,326 | 6.4%) make up the most common classes of employment.
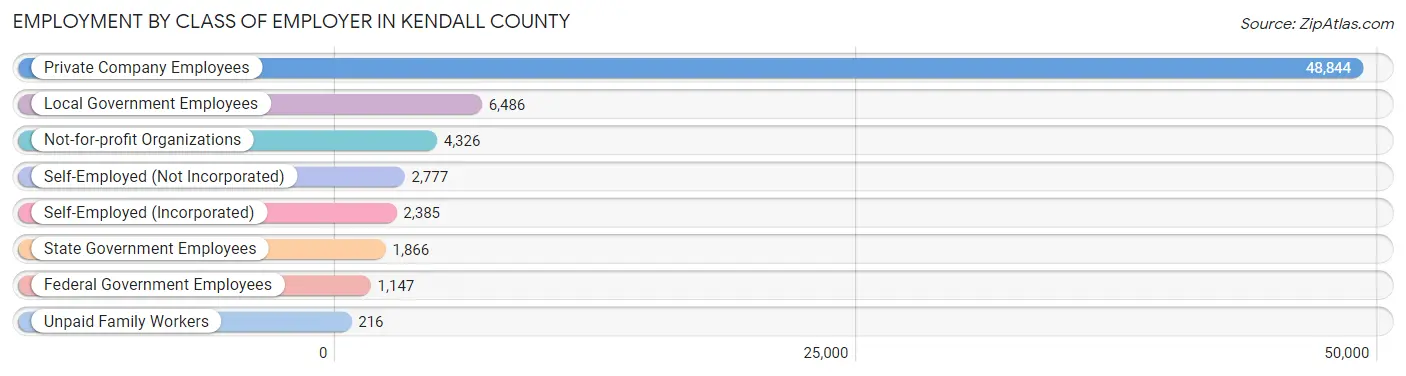
| Employer Class | # Employees | % Employees |
| Private Company Employees | 48,844 | 71.8% |
| Self-Employed (Incorporated) | 2,385 | 3.5% |
| Self-Employed (Not Incorporated) | 2,777 | 4.1% |
| Not-for-profit Organizations | 4,326 | 6.4% |
| Local Government Employees | 6,486 | 9.5% |
| State Government Employees | 1,866 | 2.7% |
| Federal Government Employees | 1,147 | 1.7% |
| Unpaid Family Workers | 216 | 0.3% |
| Total | 68,047 | 100.0% |
Employment Status by Age in Kendall County
According to the labor force statistics for Kendall County, out of the total population over 16 years of age (100,410), 72.3% or 72,596 individuals are in the labor force, with 4.3% or 3,122 of them unemployed. The age group with the highest labor force participation rate is 30 to 34 years, with 92.2% or 8,022 individuals in the labor force. Within the labor force, the 16 to 19 years age range has the highest percentage of unemployed individuals, with 17.9% or 769 of them being unemployed.
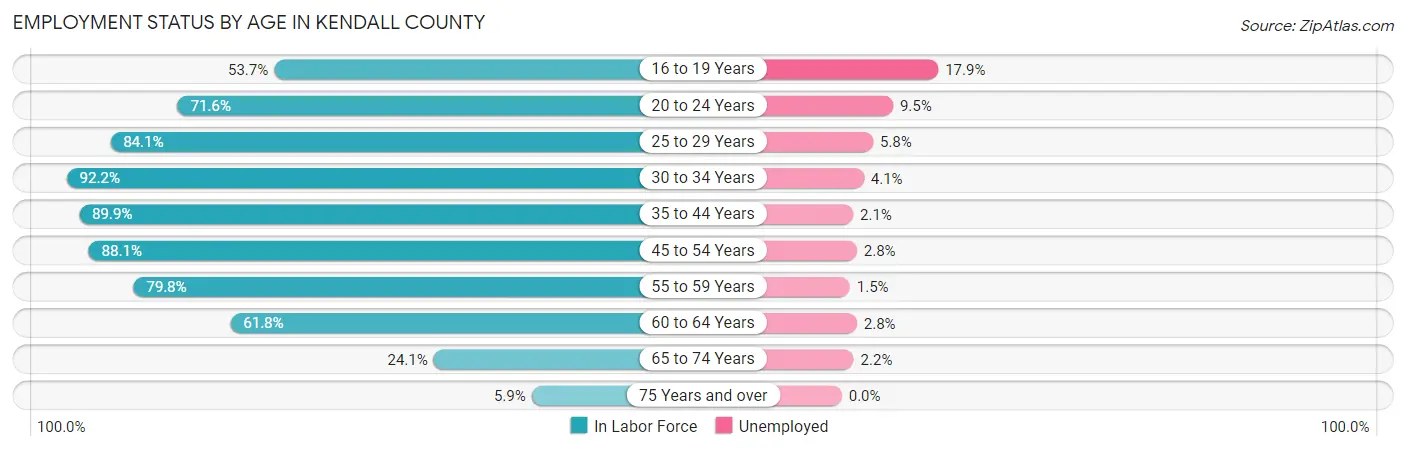
| Age Bracket | In Labor Force | Unemployed |
| 16 to 19 Years | 4,294 (53.7%) | 769 (17.9%) |
| 20 to 24 Years | 5,373 (71.6%) | 510 (9.5%) |
| 25 to 29 Years | 6,391 (84.1%) | 371 (5.8%) |
| 30 to 34 Years | 8,022 (92.2%) | 329 (4.1%) |
| 35 to 44 Years | 19,467 (89.9%) | 409 (2.1%) |
| 45 to 54 Years | 16,896 (88.1%) | 473 (2.8%) |
| 55 to 59 Years | 6,157 (79.8%) | 92 (1.5%) |
| 60 to 64 Years | 3,554 (61.8%) | 100 (2.8%) |
| 65 to 74 Years | 2,153 (24.1%) | 47 (2.2%) |
| 75 Years and over | 317 (5.9%) | 0 (0.0%) |
| Total | 72,596 (72.3%) | 3,122 (4.3%) |
Employment Status by Educational Attainment in Kendall County
According to labor force statistics for Kendall County, 85.7% of individuals (60,502) out of the total population between 25 and 64 years of age (70,597) are in the labor force, with 2.9% or 1,755 of them being unemployed. The group with the highest labor force participation rate are those with the educational attainment of bachelor's degree or higher, with 90.2% or 24,441 individuals in the labor force. Within the labor force, individuals with less than high school education have the highest percentage of unemployment, with 13.7% or 454 of them being unemployed.
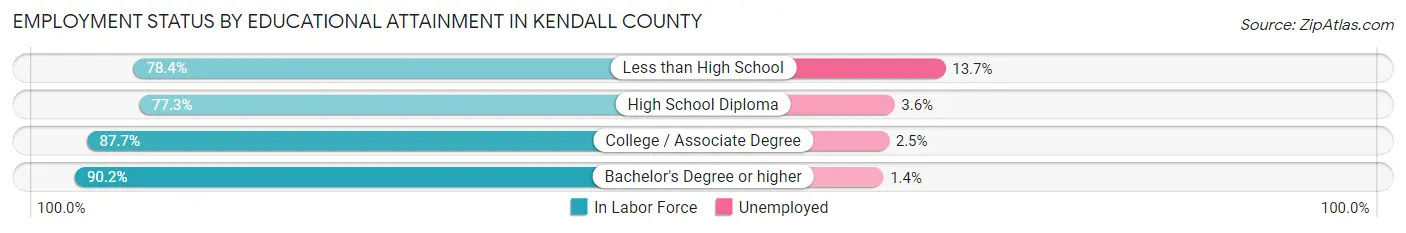
| Educational Attainment | In Labor Force | Unemployed |
| Less than High School | 3,311 (78.4%) | 579 (13.7%) |
| High School Diploma | 12,574 (77.3%) | 586 (3.6%) |
| College / Associate Degree | 20,180 (87.7%) | 575 (2.5%) |
| Bachelor's Degree or higher | 24,441 (90.2%) | 379 (1.4%) |
| Total | 60,502 (85.7%) | 2,047 (2.9%) |
Employment Occupations by Sex in Kendall County
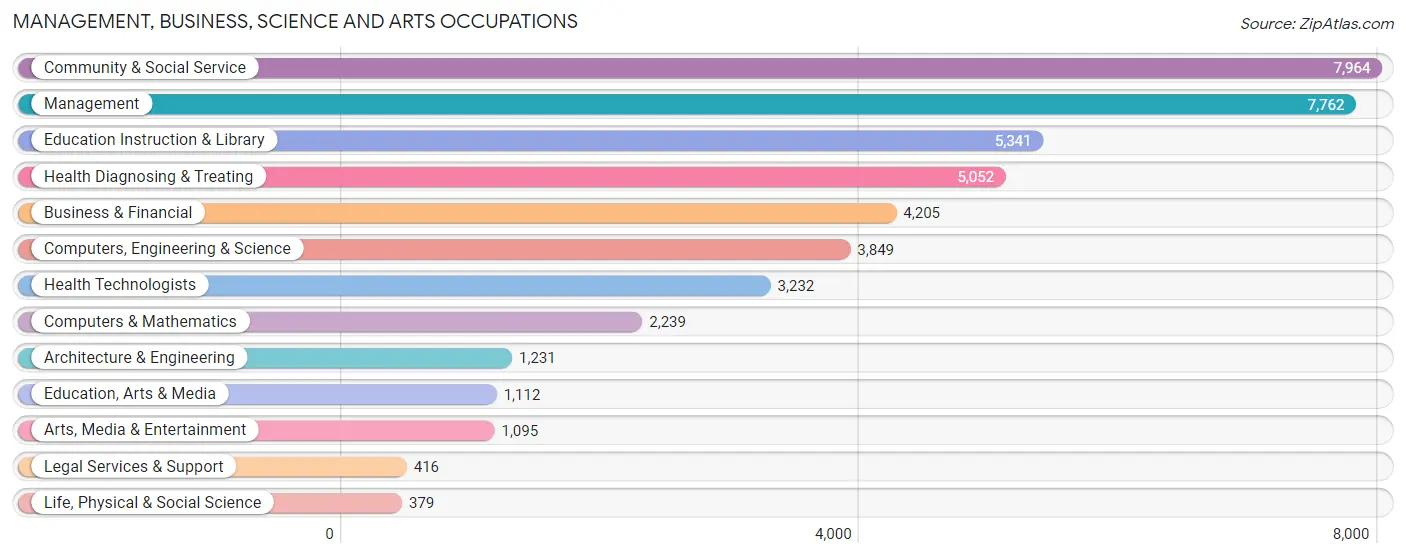
Management, Business, Science and Arts Occupations
The most common Management, Business, Science and Arts occupations in Kendall County are Community & Social Service (7,964 | 11.5%), Management (7,762 | 11.2%), Education Instruction & Library (5,341 | 7.7%), Health Diagnosing & Treating (5,052 | 7.3%), and Business & Financial (4,205 | 6.0%).
Management, Business, Science and Arts Occupations by Sex
Within the Management, Business, Science and Arts occupations in Kendall County, the most male-oriented occupations are Architecture & Engineering (88.5%), Computers, Engineering & Science (77.2%), and Computers & Mathematics (73.8%), while the most female-oriented occupations are Health Technologists (89.8%), Education, Arts & Media (78.9%), and Health Diagnosing & Treating (73.6%).
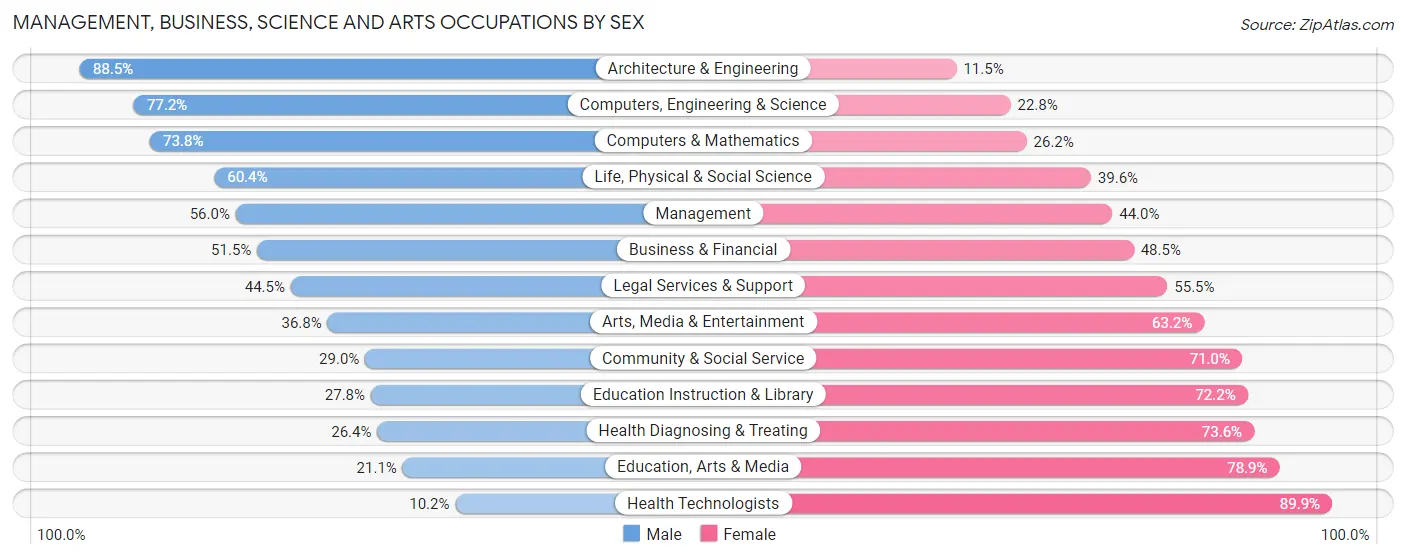
| Occupation | Male | Female |
| Management | 4,344 (56.0%) | 3,418 (44.0%) |
| Business & Financial | 2,165 (51.5%) | 2,040 (48.5%) |
| Computers, Engineering & Science | 2,971 (77.2%) | 878 (22.8%) |
| Computers & Mathematics | 1,653 (73.8%) | 586 (26.2%) |
| Architecture & Engineering | 1,089 (88.5%) | 142 (11.5%) |
| Life, Physical & Social Science | 229 (60.4%) | 150 (39.6%) |
| Community & Social Service | 2,306 (29.0%) | 5,658 (71.0%) |
| Education, Arts & Media | 235 (21.1%) | 877 (78.9%) |
| Legal Services & Support | 185 (44.5%) | 231 (55.5%) |
| Education Instruction & Library | 1,483 (27.8%) | 3,858 (72.2%) |
| Arts, Media & Entertainment | 403 (36.8%) | 692 (63.2%) |
| Health Diagnosing & Treating | 1,335 (26.4%) | 3,717 (73.6%) |
| Health Technologists | 328 (10.2%) | 2,904 (89.8%) |
| Total (Category) | 13,121 (45.5%) | 15,711 (54.5%) |
| Total (Overall) | 37,251 (53.6%) | 32,239 (46.4%) |
Services Occupations
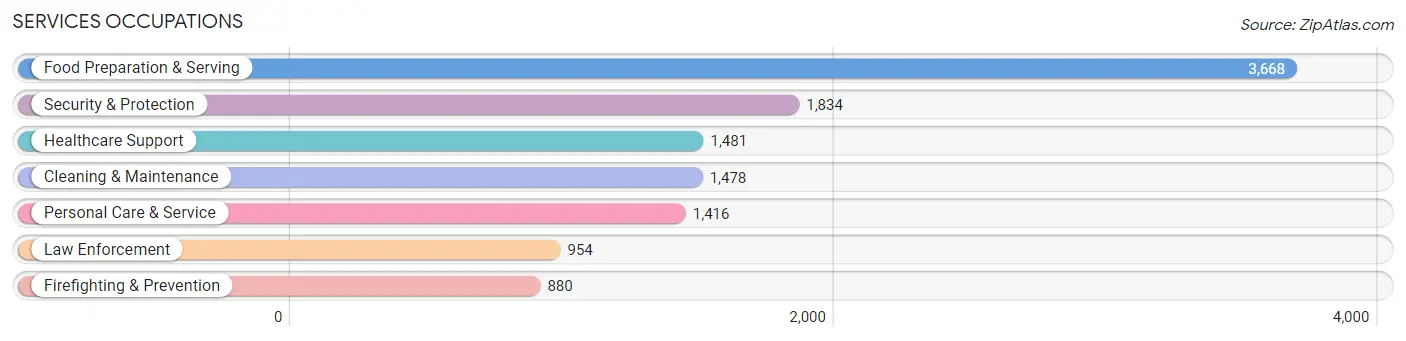
The most common Services occupations in Kendall County are Food Preparation & Serving (3,668 | 5.3%), Security & Protection (1,834 | 2.6%), Healthcare Support (1,481 | 2.1%), Cleaning & Maintenance (1,478 | 2.1%), and Personal Care & Service (1,416 | 2.0%).
Services Occupations by Sex
Within the Services occupations in Kendall County, the most male-oriented occupations are Law Enforcement (86.7%), Security & Protection (73.9%), and Cleaning & Maintenance (72.6%), while the most female-oriented occupations are Personal Care & Service (93.1%), Healthcare Support (81.7%), and Food Preparation & Serving (59.5%).
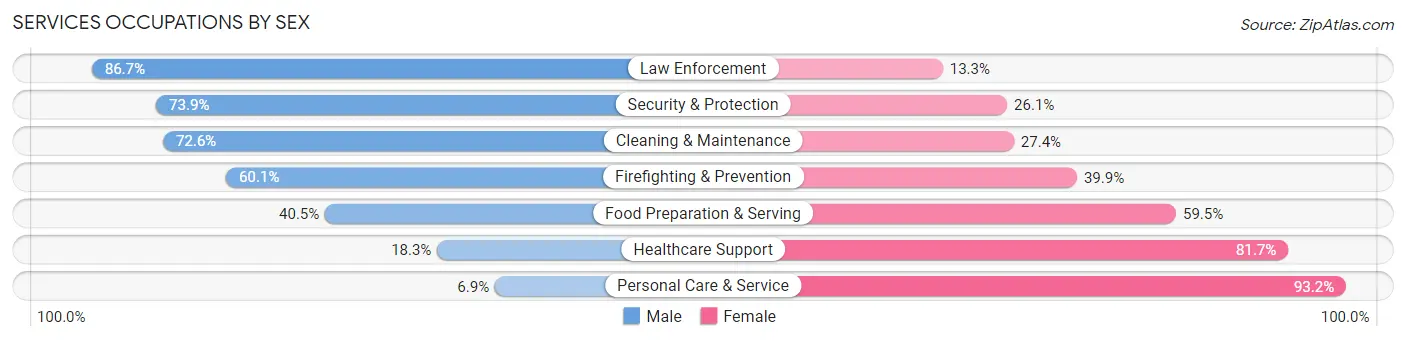
| Occupation | Male | Female |
| Healthcare Support | 271 (18.3%) | 1,210 (81.7%) |
| Security & Protection | 1,356 (73.9%) | 478 (26.1%) |
| Firefighting & Prevention | 529 (60.1%) | 351 (39.9%) |
| Law Enforcement | 827 (86.7%) | 127 (13.3%) |
| Food Preparation & Serving | 1,485 (40.5%) | 2,183 (59.5%) |
| Cleaning & Maintenance | 1,073 (72.6%) | 405 (27.4%) |
| Personal Care & Service | 97 (6.9%) | 1,319 (93.1%) |
| Total (Category) | 4,282 (43.3%) | 5,595 (56.7%) |
| Total (Overall) | 37,251 (53.6%) | 32,239 (46.4%) |
Sales and Office Occupations
The most common Sales and Office occupations in Kendall County are Office & Administration (7,748 | 11.2%), and Sales & Related (7,188 | 10.3%).

Sales and Office Occupations by Sex
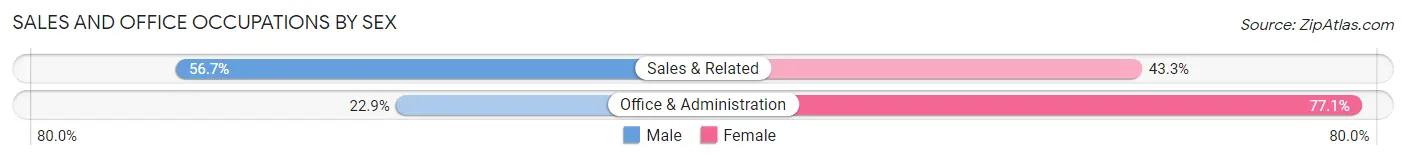
| Occupation | Male | Female |
| Sales & Related | 4,076 (56.7%) | 3,112 (43.3%) |
| Office & Administration | 1,777 (22.9%) | 5,971 (77.1%) |
| Total (Category) | 5,853 (39.2%) | 9,083 (60.8%) |
| Total (Overall) | 37,251 (53.6%) | 32,239 (46.4%) |
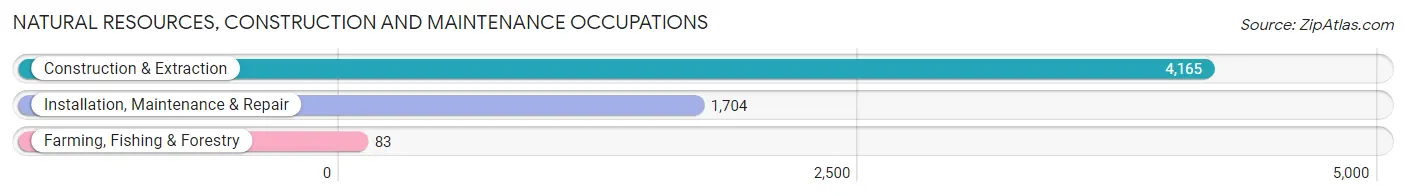
Natural Resources, Construction and Maintenance Occupations
The most common Natural Resources, Construction and Maintenance occupations in Kendall County are Construction & Extraction (4,165 | 6.0%), Installation, Maintenance & Repair (1,704 | 2.5%), and Farming, Fishing & Forestry (83 | 0.1%).
Natural Resources, Construction and Maintenance Occupations by Sex
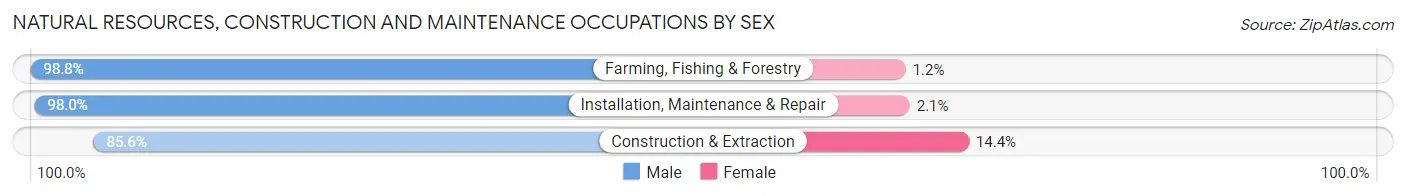
| Occupation | Male | Female |
| Farming, Fishing & Forestry | 82 (98.8%) | 1 (1.2%) |
| Construction & Extraction | 3,567 (85.6%) | 598 (14.4%) |
| Installation, Maintenance & Repair | 1,669 (98.0%) | 35 (2.1%) |
| Total (Category) | 5,318 (89.3%) | 634 (10.6%) |
| Total (Overall) | 37,251 (53.6%) | 32,239 (46.4%) |
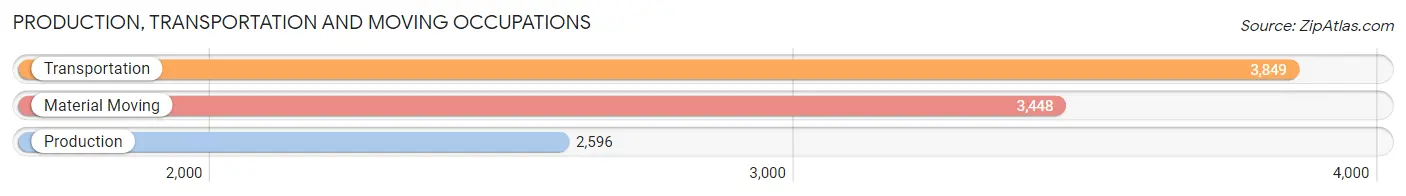
Production, Transportation and Moving Occupations
The most common Production, Transportation and Moving occupations in Kendall County are Transportation (3,849 | 5.5%), Material Moving (3,448 | 5.0%), and Production (2,596 | 3.7%).
Production, Transportation and Moving Occupations by Sex
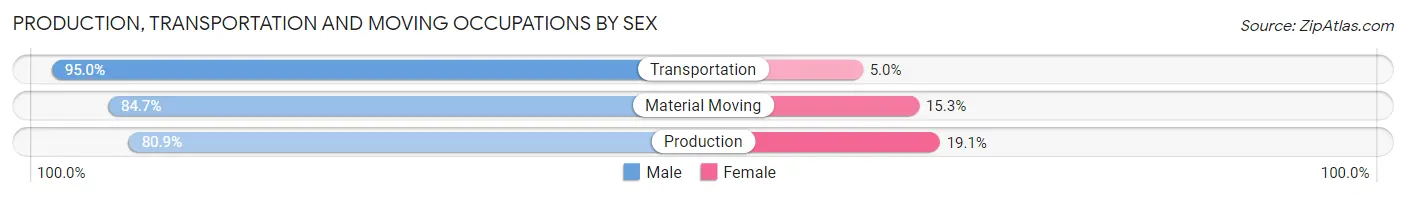
| Occupation | Male | Female |
| Production | 2,100 (80.9%) | 496 (19.1%) |
| Transportation | 3,657 (95.0%) | 192 (5.0%) |
| Material Moving | 2,920 (84.7%) | 528 (15.3%) |
| Total (Category) | 8,677 (87.7%) | 1,216 (12.3%) |
| Total (Overall) | 37,251 (53.6%) | 32,239 (46.4%) |
Employment Industries by Sex in Kendall County
Employment Industries in Kendall County
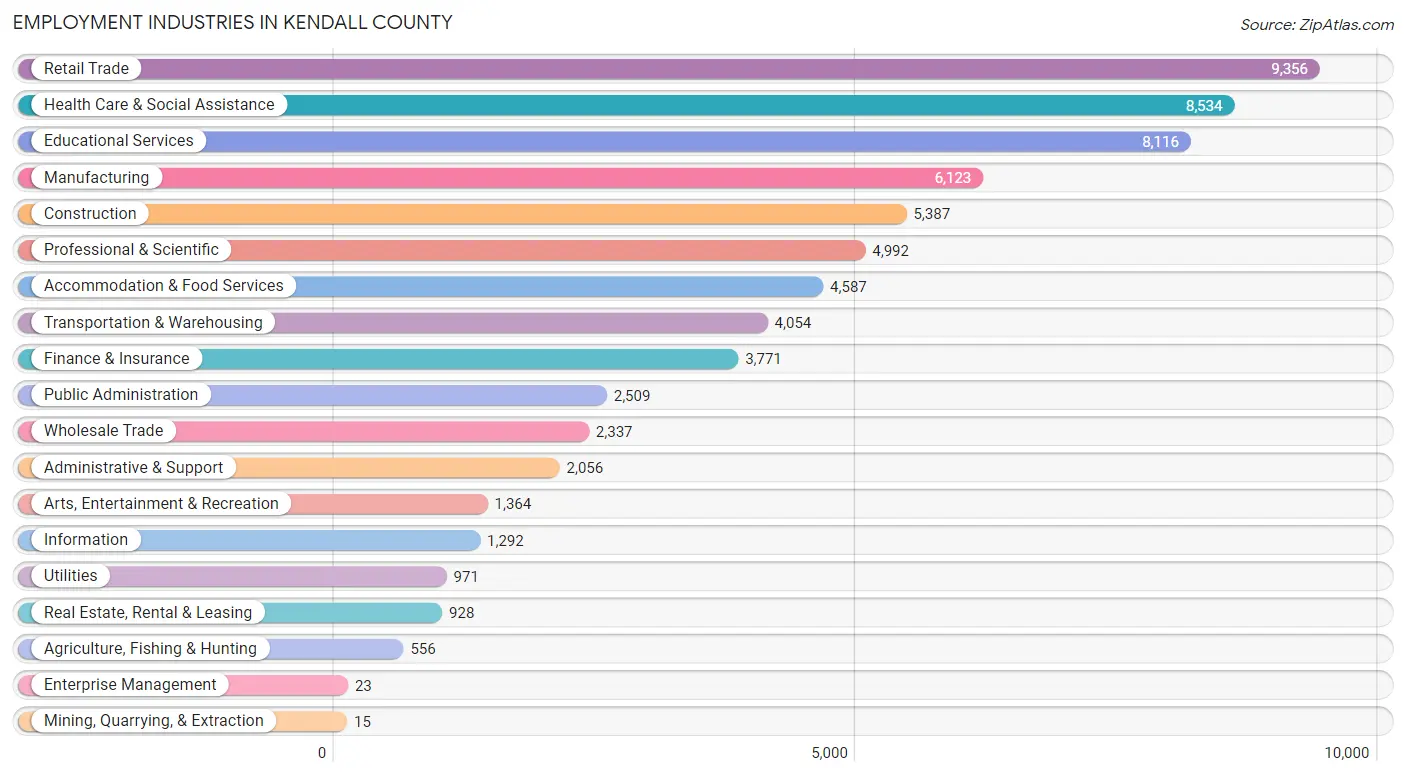
The major employment industries in Kendall County include Retail Trade (9,356 | 13.5%), Health Care & Social Assistance (8,534 | 12.3%), Educational Services (8,116 | 11.7%), Manufacturing (6,123 | 8.8%), and Construction (5,387 | 7.7%).
Employment Industries by Sex in Kendall County
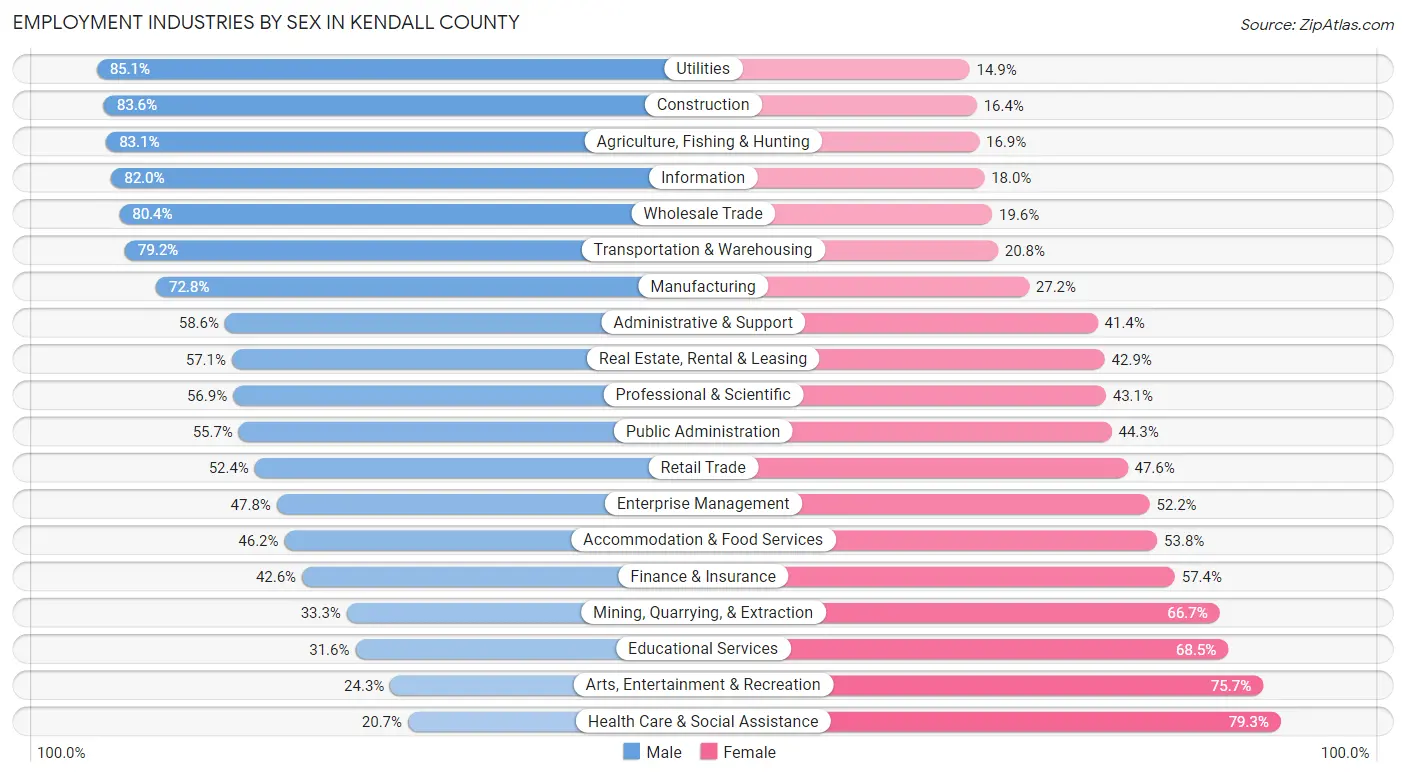
The Kendall County industries that see more men than women are Utilities (85.1%), Construction (83.6%), and Agriculture, Fishing & Hunting (83.1%), whereas the industries that tend to have a higher number of women are Health Care & Social Assistance (79.3%), Arts, Entertainment & Recreation (75.7%), and Educational Services (68.4%).
| Industry | Male | Female |
| Agriculture, Fishing & Hunting | 462 (83.1%) | 94 (16.9%) |
| Mining, Quarrying, & Extraction | 5 (33.3%) | 10 (66.7%) |
| Construction | 4,503 (83.6%) | 884 (16.4%) |
| Manufacturing | 4,457 (72.8%) | 1,666 (27.2%) |
| Wholesale Trade | 1,879 (80.4%) | 458 (19.6%) |
| Retail Trade | 4,900 (52.4%) | 4,456 (47.6%) |
| Transportation & Warehousing | 3,212 (79.2%) | 842 (20.8%) |
| Utilities | 826 (85.1%) | 145 (14.9%) |
| Information | 1,060 (82.0%) | 232 (18.0%) |
| Finance & Insurance | 1,606 (42.6%) | 2,165 (57.4%) |
| Real Estate, Rental & Leasing | 530 (57.1%) | 398 (42.9%) |
| Professional & Scientific | 2,839 (56.9%) | 2,153 (43.1%) |
| Enterprise Management | 11 (47.8%) | 12 (52.2%) |
| Administrative & Support | 1,204 (58.6%) | 852 (41.4%) |
| Educational Services | 2,561 (31.6%) | 5,555 (68.4%) |
| Health Care & Social Assistance | 1,764 (20.7%) | 6,770 (79.3%) |
| Arts, Entertainment & Recreation | 332 (24.3%) | 1,032 (75.7%) |
| Accommodation & Food Services | 2,121 (46.2%) | 2,466 (53.8%) |
| Public Administration | 1,397 (55.7%) | 1,112 (44.3%) |
| Total | 37,251 (53.6%) | 32,239 (46.4%) |
Education in Kendall County
School Enrollment in Kendall County
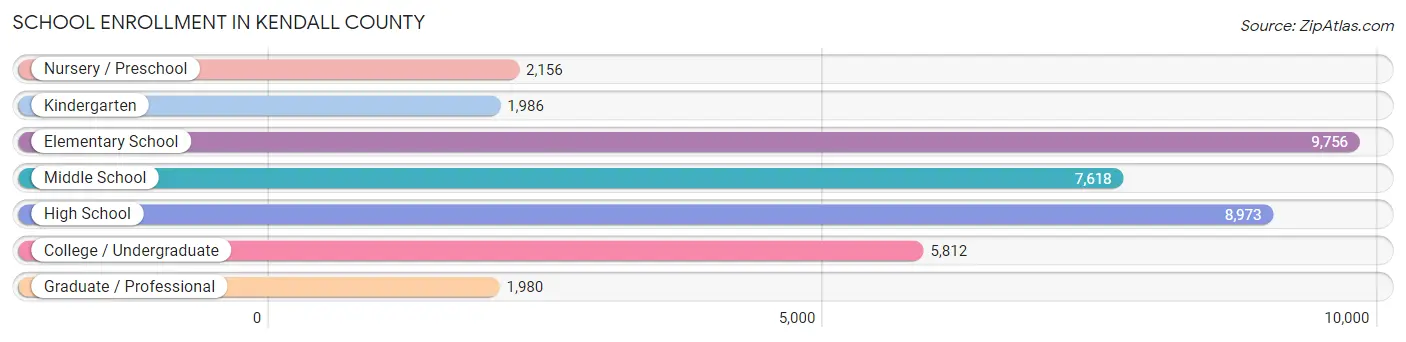
The most common levels of schooling among the 38,281 students in Kendall County are elementary school (9,756 | 25.5%), high school (8,973 | 23.4%), and middle school (7,618 | 19.9%).
| School Level | # Students | % Students |
| Nursery / Preschool | 2,156 | 5.6% |
| Kindergarten | 1,986 | 5.2% |
| Elementary School | 9,756 | 25.5% |
| Middle School | 7,618 | 19.9% |
| High School | 8,973 | 23.4% |
| College / Undergraduate | 5,812 | 15.2% |
| Graduate / Professional | 1,980 | 5.2% |
| Total | 38,281 | 100.0% |
School Enrollment by Age by Funding Source in Kendall County
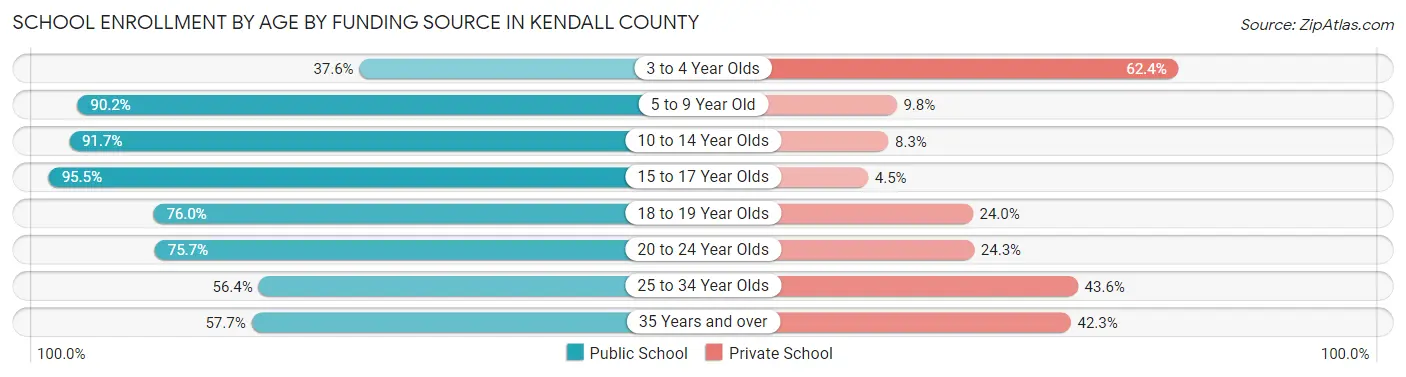
Out of a total of 38,281 students who are enrolled in schools in Kendall County, 5,972 (15.6%) attend a private institution, while the remaining 32,309 (84.4%) are enrolled in public schools. The age group of 3 to 4 year olds has the highest likelihood of being enrolled in private schools, with 988 (62.4% in the age bracket) enrolled. Conversely, the age group of 15 to 17 year olds has the lowest likelihood of being enrolled in a private school, with 6,472 (95.5% in the age bracket) attending a public institution.
| Age Bracket | Public School | Private School |
| 3 to 4 Year Olds | 596 (37.6%) | 988 (62.4%) |
| 5 to 9 Year Old | 10,375 (90.2%) | 1,132 (9.8%) |
| 10 to 14 Year Olds | 8,865 (91.7%) | 799 (8.3%) |
| 15 to 17 Year Olds | 6,472 (95.5%) | 305 (4.5%) |
| 18 to 19 Year Olds | 1,817 (76.0%) | 574 (24.0%) |
| 20 to 24 Year Olds | 2,182 (75.7%) | 699 (24.3%) |
| 25 to 34 Year Olds | 927 (56.4%) | 716 (43.6%) |
| 35 Years and over | 1,059 (57.7%) | 775 (42.3%) |
| Total | 32,309 (84.4%) | 5,972 (15.6%) |
Educational Attainment by Field of Study in Kendall County
Business (6,827 | 21.0%), education (5,062 | 15.6%), science & technology (3,604 | 11.1%), social sciences (2,309 | 7.1%), and psychology (2,117 | 6.5%) are the most common fields of study among 32,439 individuals in Kendall County who have obtained a bachelor's degree or higher.
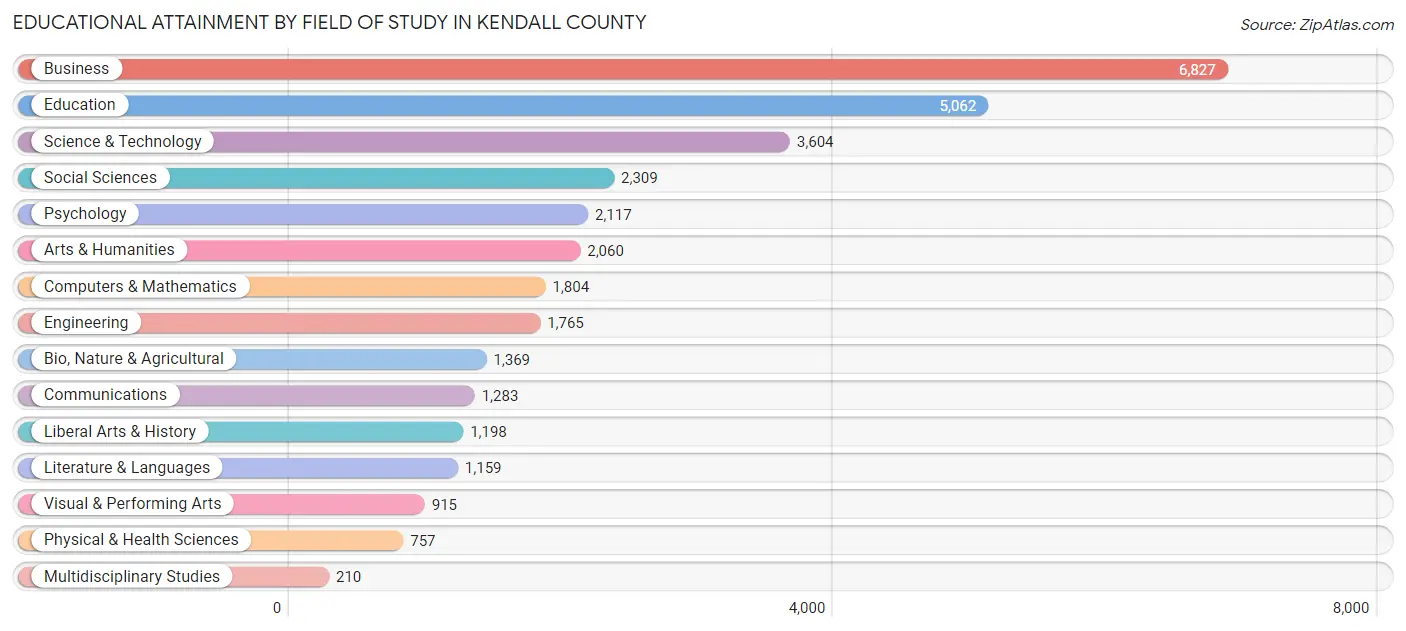
| Field of Study | # Graduates | % Graduates |
| Computers & Mathematics | 1,804 | 5.6% |
| Bio, Nature & Agricultural | 1,369 | 4.2% |
| Physical & Health Sciences | 757 | 2.3% |
| Psychology | 2,117 | 6.5% |
| Social Sciences | 2,309 | 7.1% |
| Engineering | 1,765 | 5.4% |
| Multidisciplinary Studies | 210 | 0.6% |
| Science & Technology | 3,604 | 11.1% |
| Business | 6,827 | 21.0% |
| Education | 5,062 | 15.6% |
| Literature & Languages | 1,159 | 3.6% |
| Liberal Arts & History | 1,198 | 3.7% |
| Visual & Performing Arts | 915 | 2.8% |
| Communications | 1,283 | 4.0% |
| Arts & Humanities | 2,060 | 6.4% |
| Total | 32,439 | 100.0% |
Transportation & Commute in Kendall County
Vehicle Availability by Sex in Kendall County
The most prevalent vehicle ownership categories in Kendall County are males with 2 vehicles (15,937, accounting for 43.7%) and females with 2 vehicles (13,435, making up 50.5%).
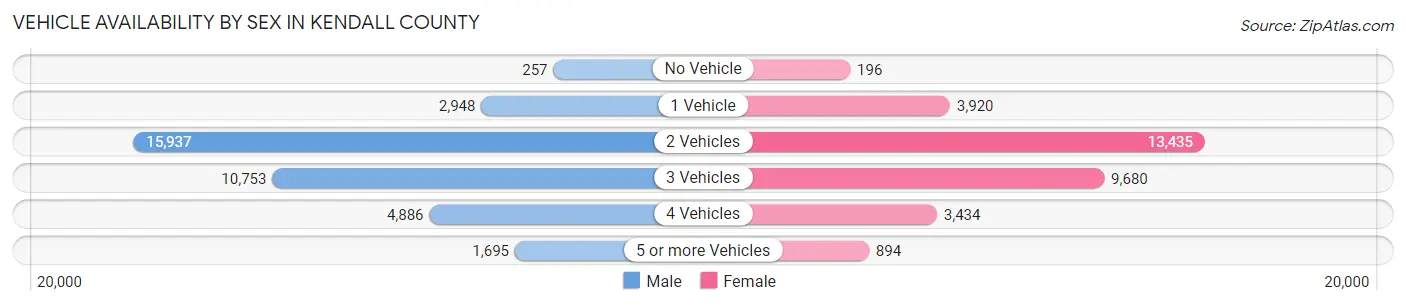
| Vehicles Available | Male | Female |
| No Vehicle | 257 (0.7%) | 196 (0.6%) |
| 1 Vehicle | 2,948 (8.1%) | 3,920 (12.4%) |
| 2 Vehicles | 15,937 (43.7%) | 13,435 (42.6%) |
| 3 Vehicles | 10,753 (29.5%) | 9,680 (30.7%) |
| 4 Vehicles | 4,886 (13.4%) | 3,434 (10.9%) |
| 5 or more Vehicles | 1,695 (4.6%) | 894 (2.8%) |
| Total | 36,476 (100.0%) | 31,559 (100.0%) |
Commute Time in Kendall County
The most frequently occuring commute durations in Kendall County are 45 to 59 minutes (8,217 commuters, 13.7%), 30 to 34 minutes (7,680 commuters, 12.8%), and 60 to 89 minutes (7,586 commuters, 12.7%).
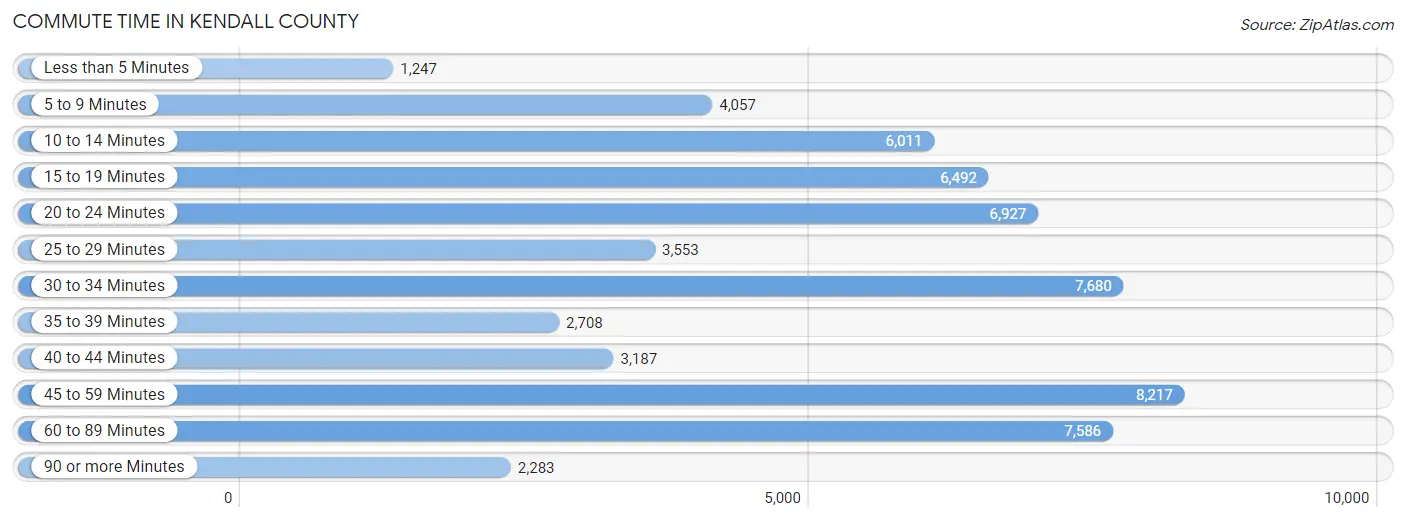
| Commute Time | # Commuters | % Commuters |
| Less than 5 Minutes | 1,247 | 2.1% |
| 5 to 9 Minutes | 4,057 | 6.8% |
| 10 to 14 Minutes | 6,011 | 10.0% |
| 15 to 19 Minutes | 6,492 | 10.8% |
| 20 to 24 Minutes | 6,927 | 11.6% |
| 25 to 29 Minutes | 3,553 | 5.9% |
| 30 to 34 Minutes | 7,680 | 12.8% |
| 35 to 39 Minutes | 2,708 | 4.5% |
| 40 to 44 Minutes | 3,187 | 5.3% |
| 45 to 59 Minutes | 8,217 | 13.7% |
| 60 to 89 Minutes | 7,586 | 12.7% |
| 90 or more Minutes | 2,283 | 3.8% |
Commute Time by Sex in Kendall County
The most common commute times in Kendall County are 60 to 89 minutes (5,472 commuters, 16.6%) for males and 20 to 24 minutes (3,776 commuters, 14.0%) for females.
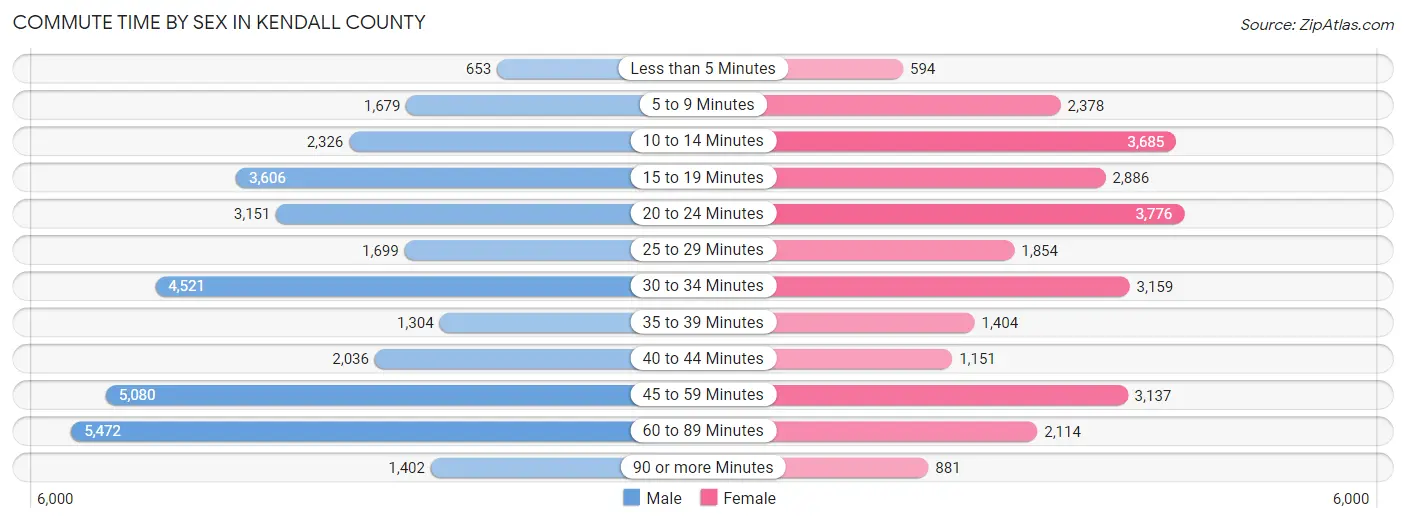
| Commute Time | Male | Female |
| Less than 5 Minutes | 653 (2.0%) | 594 (2.2%) |
| 5 to 9 Minutes | 1,679 (5.1%) | 2,378 (8.8%) |
| 10 to 14 Minutes | 2,326 (7.1%) | 3,685 (13.6%) |
| 15 to 19 Minutes | 3,606 (11.0%) | 2,886 (10.7%) |
| 20 to 24 Minutes | 3,151 (9.6%) | 3,776 (14.0%) |
| 25 to 29 Minutes | 1,699 (5.2%) | 1,854 (6.9%) |
| 30 to 34 Minutes | 4,521 (13.7%) | 3,159 (11.7%) |
| 35 to 39 Minutes | 1,304 (4.0%) | 1,404 (5.2%) |
| 40 to 44 Minutes | 2,036 (6.2%) | 1,151 (4.3%) |
| 45 to 59 Minutes | 5,080 (15.4%) | 3,137 (11.6%) |
| 60 to 89 Minutes | 5,472 (16.6%) | 2,114 (7.8%) |
| 90 or more Minutes | 1,402 (4.3%) | 881 (3.3%) |
Time of Departure to Work by Sex in Kendall County
The most frequent times of departure to work in Kendall County are 7:00 AM to 7:29 AM (4,870, 14.8%) for males and 7:00 AM to 7:29 AM (4,726, 17.5%) for females.
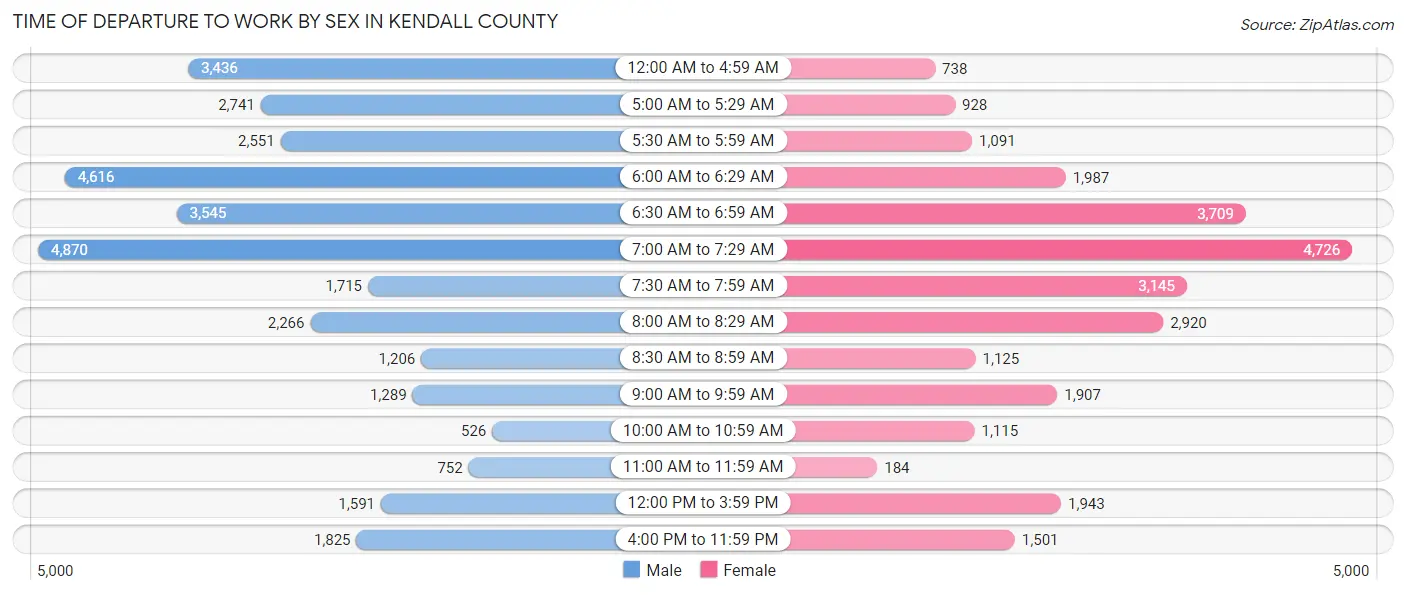
| Time of Departure | Male | Female |
| 12:00 AM to 4:59 AM | 3,436 (10.4%) | 738 (2.7%) |
| 5:00 AM to 5:29 AM | 2,741 (8.3%) | 928 (3.4%) |
| 5:30 AM to 5:59 AM | 2,551 (7.7%) | 1,091 (4.0%) |
| 6:00 AM to 6:29 AM | 4,616 (14.0%) | 1,987 (7.3%) |
| 6:30 AM to 6:59 AM | 3,545 (10.8%) | 3,709 (13.7%) |
| 7:00 AM to 7:29 AM | 4,870 (14.8%) | 4,726 (17.5%) |
| 7:30 AM to 7:59 AM | 1,715 (5.2%) | 3,145 (11.6%) |
| 8:00 AM to 8:29 AM | 2,266 (6.9%) | 2,920 (10.8%) |
| 8:30 AM to 8:59 AM | 1,206 (3.7%) | 1,125 (4.2%) |
| 9:00 AM to 9:59 AM | 1,289 (3.9%) | 1,907 (7.1%) |
| 10:00 AM to 10:59 AM | 526 (1.6%) | 1,115 (4.1%) |
| 11:00 AM to 11:59 AM | 752 (2.3%) | 184 (0.7%) |
| 12:00 PM to 3:59 PM | 1,591 (4.8%) | 1,943 (7.2%) |
| 4:00 PM to 11:59 PM | 1,825 (5.5%) | 1,501 (5.6%) |
| Total | 32,929 (100.0%) | 27,019 (100.0%) |
Housing Occupancy in Kendall County
Occupancy by Ownership in Kendall County
Of the total 43,878 dwellings in Kendall County, owner-occupied units account for 36,899 (84.1%), while renter-occupied units make up 6,979 (15.9%).
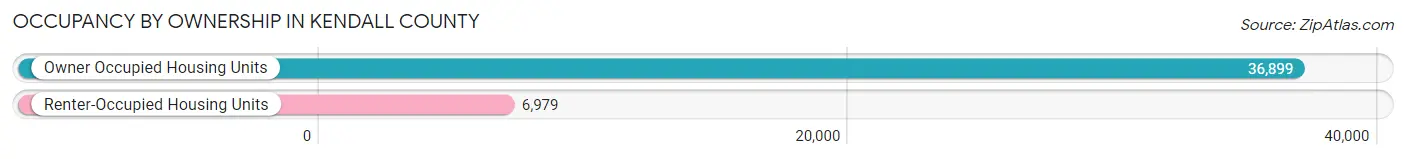
| Occupancy | # Housing Units | % Housing Units |
| Owner Occupied Housing Units | 36,899 | 84.1% |
| Renter-Occupied Housing Units | 6,979 | 15.9% |
| Total Occupied Housing Units | 43,878 | 100.0% |
Occupancy by Household Size in Kendall County
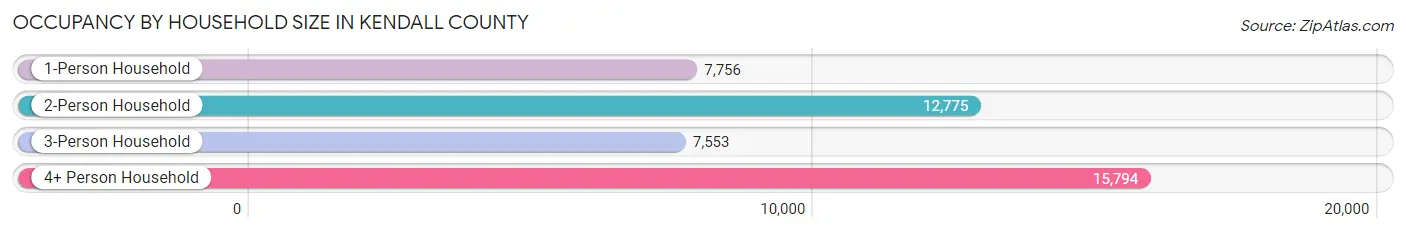
| Household Size | # Housing Units | % Housing Units |
| 1-Person Household | 7,756 | 17.7% |
| 2-Person Household | 12,775 | 29.1% |
| 3-Person Household | 7,553 | 17.2% |
| 4+ Person Household | 15,794 | 36.0% |
| Total Housing Units | 43,878 | 100.0% |
Occupancy by Ownership by Household Size in Kendall County
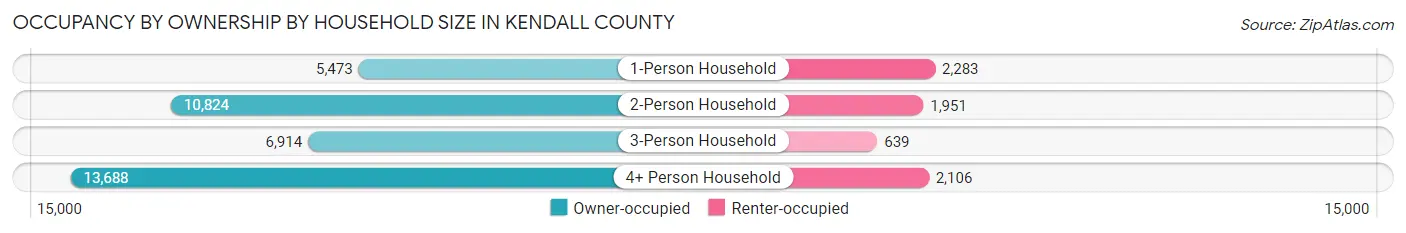
| Household Size | Owner-occupied | Renter-occupied |
| 1-Person Household | 5,473 (70.6%) | 2,283 (29.4%) |
| 2-Person Household | 10,824 (84.7%) | 1,951 (15.3%) |
| 3-Person Household | 6,914 (91.5%) | 639 (8.5%) |
| 4+ Person Household | 13,688 (86.7%) | 2,106 (13.3%) |
| Total Housing Units | 36,899 (84.1%) | 6,979 (15.9%) |
Occupancy by Educational Attainment in Kendall County

| Household Size | Owner-occupied | Renter-occupied |
| Less than High School | 1,875 (82.9%) | 386 (17.1%) |
| High School Diploma | 7,933 (83.1%) | 1,614 (16.9%) |
| College/Associate Degree | 12,228 (80.5%) | 2,965 (19.5%) |
| Bachelor's Degree or higher | 14,863 (88.1%) | 2,014 (11.9%) |
Occupancy by Age of Householder in Kendall County
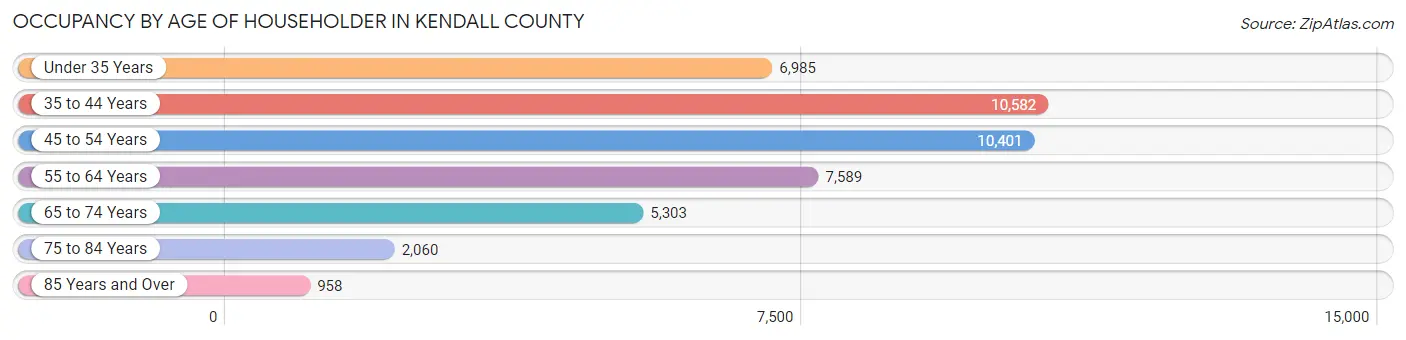
| Age Bracket | # Households | % Households |
| Under 35 Years | 6,985 | 15.9% |
| 35 to 44 Years | 10,582 | 24.1% |
| 45 to 54 Years | 10,401 | 23.7% |
| 55 to 64 Years | 7,589 | 17.3% |
| 65 to 74 Years | 5,303 | 12.1% |
| 75 to 84 Years | 2,060 | 4.7% |
| 85 Years and Over | 958 | 2.2% |
| Total | 43,878 | 100.0% |
Housing Finances in Kendall County
Median Income by Occupancy in Kendall County
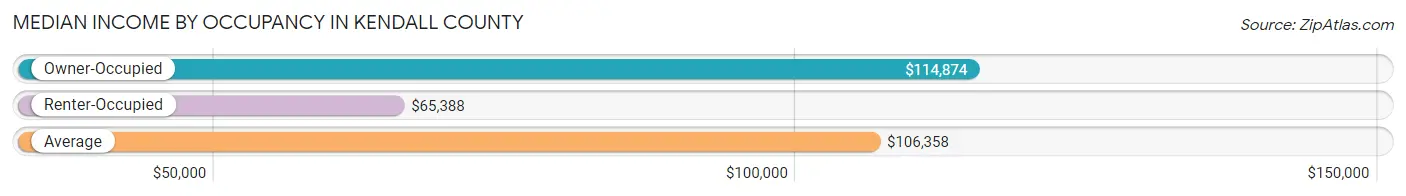
| Occupancy Type | # Households | Median Income |
| Owner-Occupied | 36,899 (84.1%) | $114,874 |
| Renter-Occupied | 6,979 (15.9%) | $65,388 |
| Average | 43,878 (100.0%) | $106,358 |
Occupancy by Householder Income Bracket in Kendall County
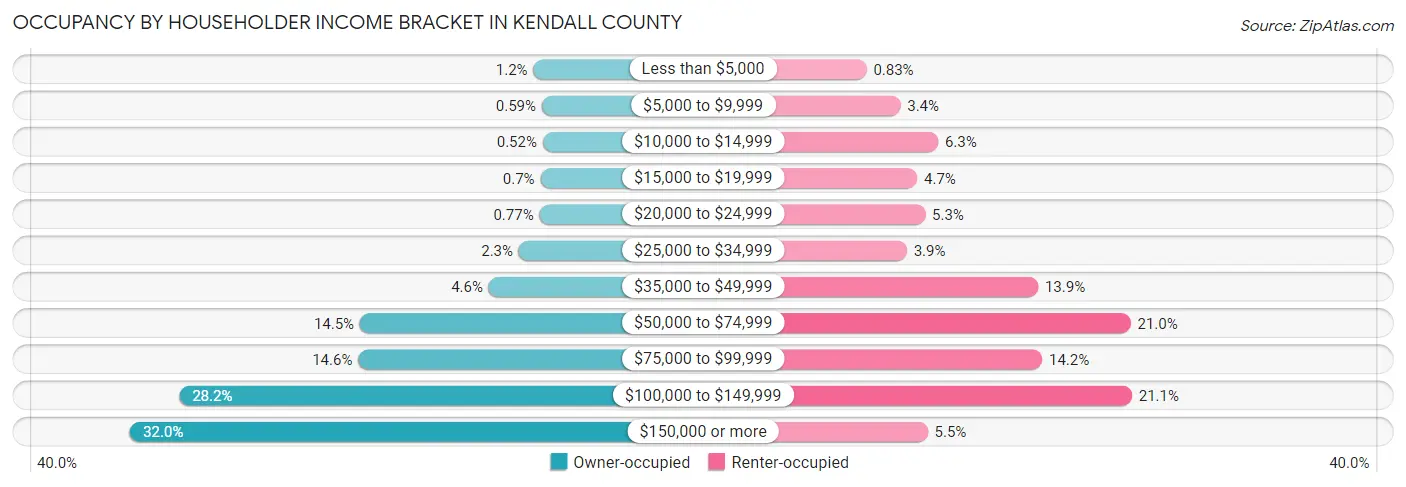
| Income Bracket | Owner-occupied | Renter-occupied |
| Less than $5,000 | 455 (1.2%) | 58 (0.8%) |
| $5,000 to $9,999 | 218 (0.6%) | 238 (3.4%) |
| $10,000 to $14,999 | 192 (0.5%) | 438 (6.3%) |
| $15,000 to $19,999 | 258 (0.7%) | 327 (4.7%) |
| $20,000 to $24,999 | 283 (0.8%) | 370 (5.3%) |
| $25,000 to $34,999 | 863 (2.3%) | 272 (3.9%) |
| $35,000 to $49,999 | 1,710 (4.6%) | 970 (13.9%) |
| $50,000 to $74,999 | 5,333 (14.4%) | 1,462 (20.9%) |
| $75,000 to $99,999 | 5,379 (14.6%) | 992 (14.2%) |
| $100,000 to $149,999 | 10,412 (28.2%) | 1,469 (21.0%) |
| $150,000 or more | 11,796 (32.0%) | 383 (5.5%) |
| Total | 36,899 (100.0%) | 6,979 (100.0%) |
Monthly Housing Cost Tiers in Kendall County
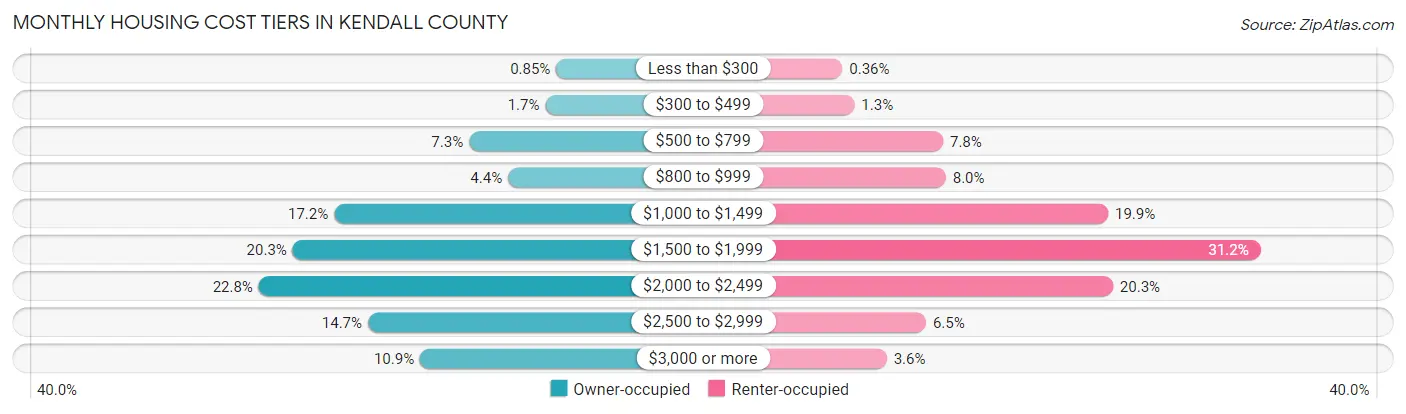
| Monthly Cost | Owner-occupied | Renter-occupied |
| Less than $300 | 315 (0.9%) | 25 (0.4%) |
| $300 to $499 | 608 (1.7%) | 87 (1.3%) |
| $500 to $799 | 2,683 (7.3%) | 543 (7.8%) |
| $800 to $999 | 1,623 (4.4%) | 557 (8.0%) |
| $1,000 to $1,499 | 6,350 (17.2%) | 1,391 (19.9%) |
| $1,500 to $1,999 | 7,475 (20.3%) | 2,175 (31.2%) |
| $2,000 to $2,499 | 8,398 (22.8%) | 1,416 (20.3%) |
| $2,500 to $2,999 | 5,433 (14.7%) | 455 (6.5%) |
| $3,000 or more | 4,014 (10.9%) | 253 (3.6%) |
| Total | 36,899 (100.0%) | 6,979 (100.0%) |
Physical Housing Characteristics in Kendall County
Housing Structures in Kendall County
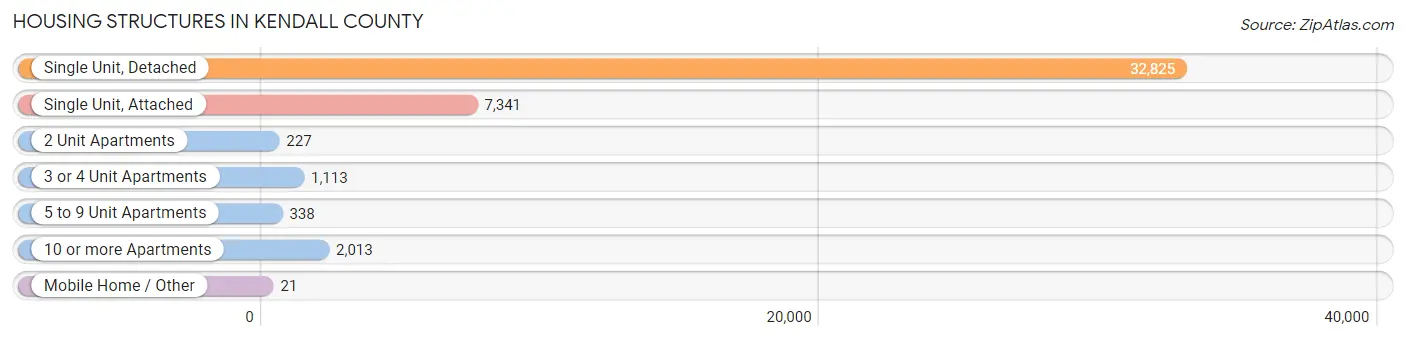
| Structure Type | # Housing Units | % Housing Units |
| Single Unit, Detached | 32,825 | 74.8% |
| Single Unit, Attached | 7,341 | 16.7% |
| 2 Unit Apartments | 227 | 0.5% |
| 3 or 4 Unit Apartments | 1,113 | 2.5% |
| 5 to 9 Unit Apartments | 338 | 0.8% |
| 10 or more Apartments | 2,013 | 4.6% |
| Mobile Home / Other | 21 | 0.1% |
| Total | 43,878 | 100.0% |
Housing Structures by Occupancy in Kendall County
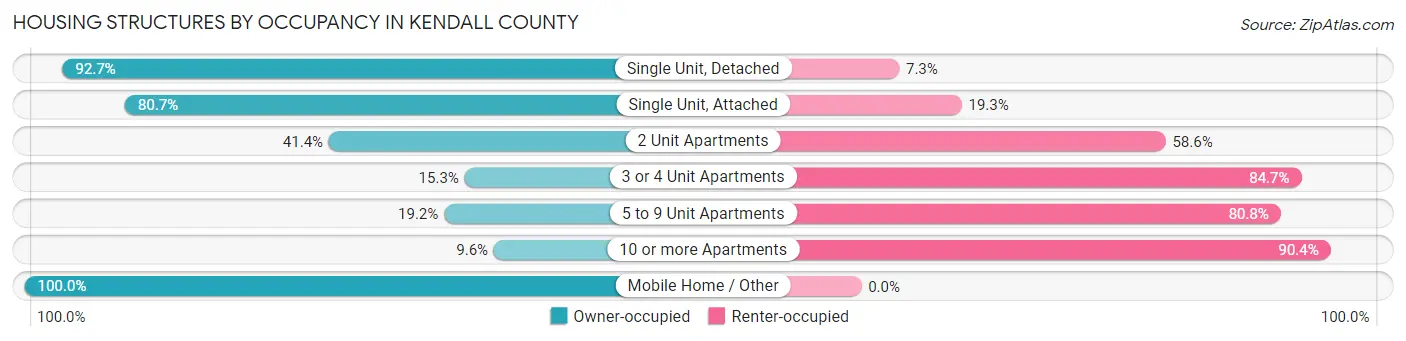
| Structure Type | Owner-occupied | Renter-occupied |
| Single Unit, Detached | 30,432 (92.7%) | 2,393 (7.3%) |
| Single Unit, Attached | 5,923 (80.7%) | 1,418 (19.3%) |
| 2 Unit Apartments | 94 (41.4%) | 133 (58.6%) |
| 3 or 4 Unit Apartments | 170 (15.3%) | 943 (84.7%) |
| 5 to 9 Unit Apartments | 65 (19.2%) | 273 (80.8%) |
| 10 or more Apartments | 194 (9.6%) | 1,819 (90.4%) |
| Mobile Home / Other | 21 (100.0%) | 0 (0.0%) |
| Total | 36,899 (84.1%) | 6,979 (15.9%) |
Housing Structures by Number of Rooms in Kendall County
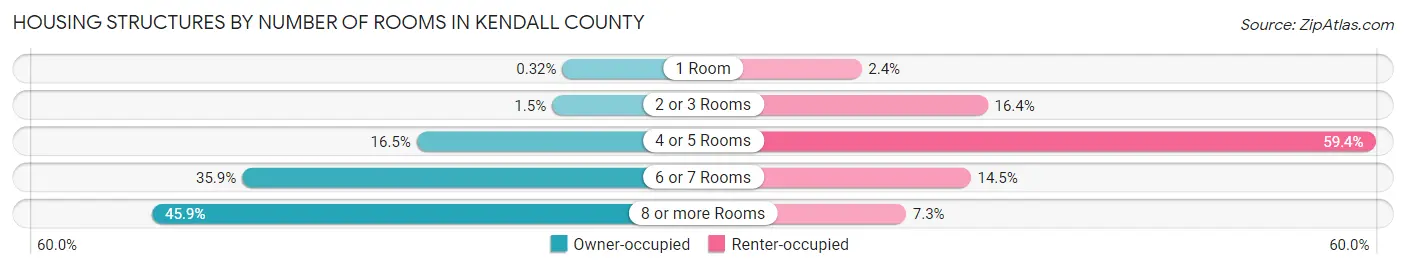
| Number of Rooms | Owner-occupied | Renter-occupied |
| 1 Room | 118 (0.3%) | 166 (2.4%) |
| 2 or 3 Rooms | 541 (1.5%) | 1,143 (16.4%) |
| 4 or 5 Rooms | 6,086 (16.5%) | 4,147 (59.4%) |
| 6 or 7 Rooms | 13,234 (35.9%) | 1,012 (14.5%) |
| 8 or more Rooms | 16,920 (45.9%) | 511 (7.3%) |
| Total | 36,899 (100.0%) | 6,979 (100.0%) |
Housing Structure by Heating Type in Kendall County
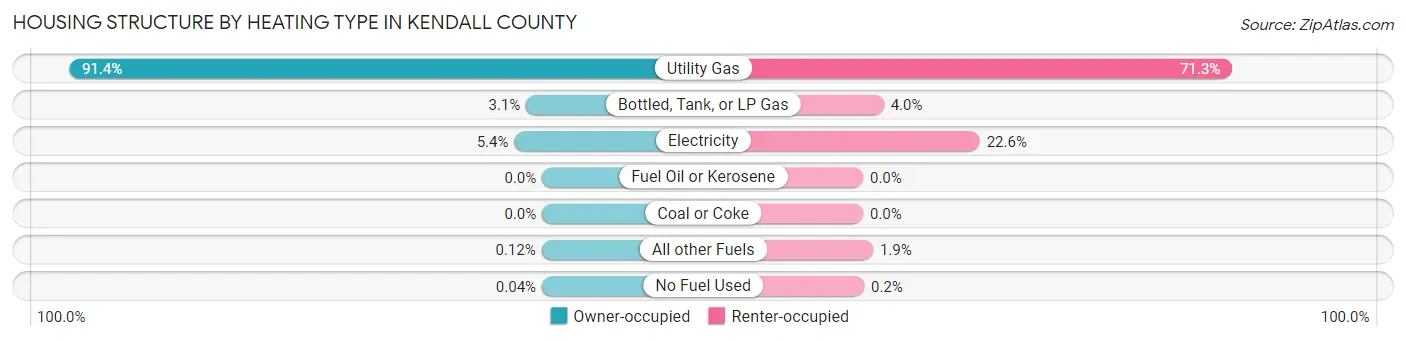
| Heating Type | Owner-occupied | Renter-occupied |
| Utility Gas | 33,726 (91.4%) | 4,978 (71.3%) |
| Bottled, Tank, or LP Gas | 1,133 (3.1%) | 279 (4.0%) |
| Electricity | 1,982 (5.4%) | 1,574 (22.6%) |
| Fuel Oil or Kerosene | 0 (0.0%) | 0 (0.0%) |
| Coal or Coke | 0 (0.0%) | 0 (0.0%) |
| All other Fuels | 44 (0.1%) | 134 (1.9%) |
| No Fuel Used | 14 (0.0%) | 14 (0.2%) |
| Total | 36,899 (100.0%) | 6,979 (100.0%) |
Household Vehicle Usage in Kendall County
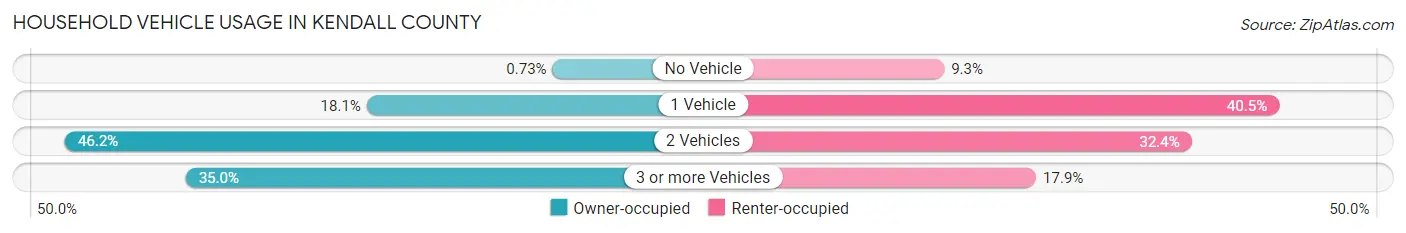
| Vehicles per Household | Owner-occupied | Renter-occupied |
| No Vehicle | 270 (0.7%) | 647 (9.3%) |
| 1 Vehicle | 6,669 (18.1%) | 2,828 (40.5%) |
| 2 Vehicles | 17,059 (46.2%) | 2,258 (32.4%) |
| 3 or more Vehicles | 12,901 (35.0%) | 1,246 (17.8%) |
| Total | 36,899 (100.0%) | 6,979 (100.0%) |
Real Estate & Mortgages in Kendall County
Real Estate and Mortgage Overview in Kendall County
| Characteristic | Without Mortgage | With Mortgage |
| Housing Units | 7,831 | 29,068 |
| Median Property Value | $273,700 | $291,700 |
| Median Household Income | $88,682 | $10,248 |
| Monthly Housing Costs | $901 | $3,948 |
| Real Estate Taxes | $6,745 | $198 |
Property Value by Mortgage Status in Kendall County
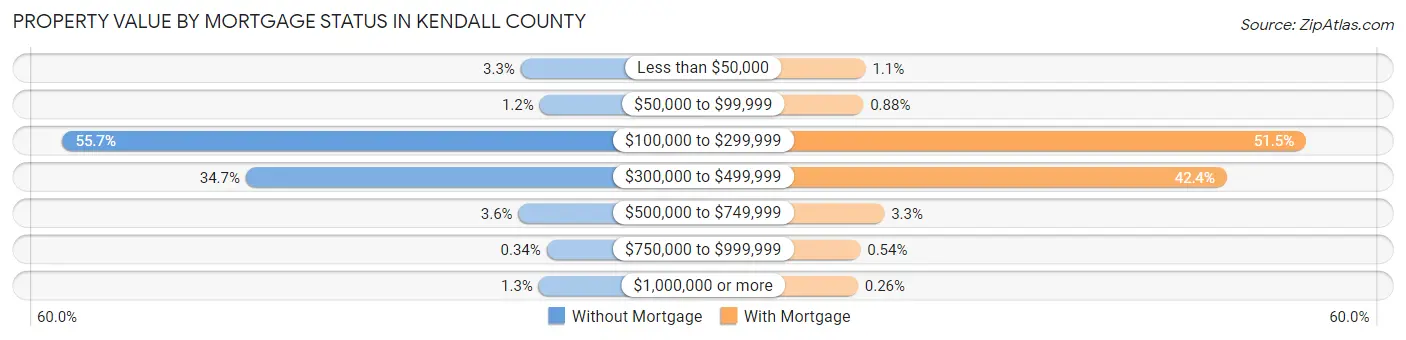
| Property Value | Without Mortgage | With Mortgage |
| Less than $50,000 | 259 (3.3%) | 328 (1.1%) |
| $50,000 to $99,999 | 90 (1.1%) | 256 (0.9%) |
| $100,000 to $299,999 | 4,359 (55.7%) | 14,964 (51.5%) |
| $300,000 to $499,999 | 2,719 (34.7%) | 12,335 (42.4%) |
| $500,000 to $749,999 | 279 (3.6%) | 952 (3.3%) |
| $750,000 to $999,999 | 27 (0.3%) | 158 (0.5%) |
| $1,000,000 or more | 98 (1.3%) | 75 (0.3%) |
| Total | 7,831 (100.0%) | 29,068 (100.0%) |
Household Income by Mortgage Status in Kendall County
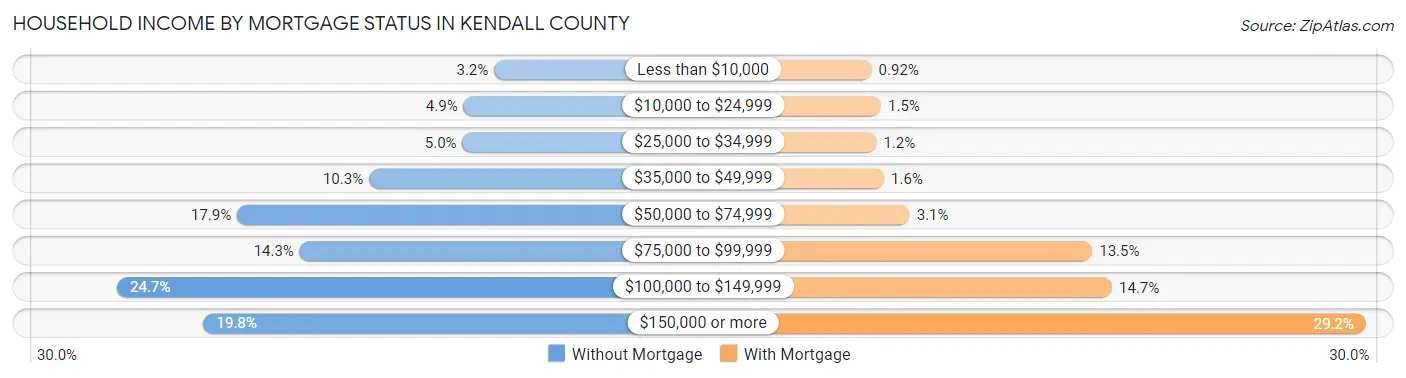
| Household Income | Without Mortgage | With Mortgage |
| Less than $10,000 | 248 (3.2%) | 268 (0.9%) |
| $10,000 to $24,999 | 385 (4.9%) | 425 (1.5%) |
| $25,000 to $34,999 | 390 (5.0%) | 348 (1.2%) |
| $35,000 to $49,999 | 808 (10.3%) | 473 (1.6%) |
| $50,000 to $74,999 | 1,399 (17.9%) | 902 (3.1%) |
| $75,000 to $99,999 | 1,118 (14.3%) | 3,934 (13.5%) |
| $100,000 to $149,999 | 1,935 (24.7%) | 4,261 (14.7%) |
| $150,000 or more | 1,548 (19.8%) | 8,477 (29.2%) |
| Total | 7,831 (100.0%) | 29,068 (100.0%) |
Property Value to Household Income Ratio in Kendall County
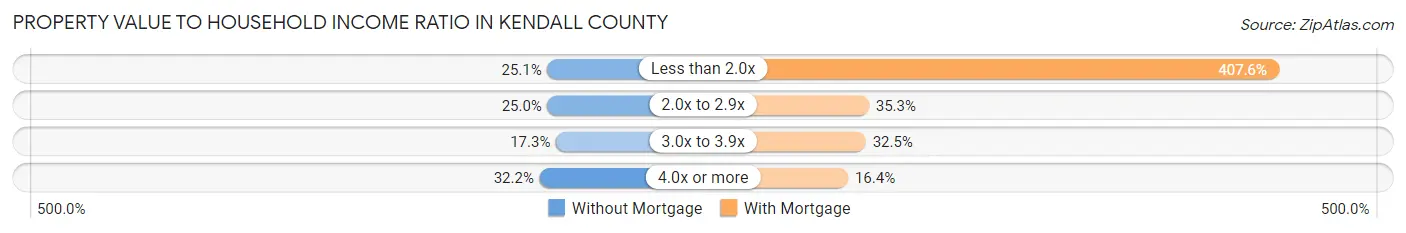
| Value-to-Income Ratio | Without Mortgage | With Mortgage |
| Less than 2.0x | 1,966 (25.1%) | 118,488 (407.6%) |
| 2.0x to 2.9x | 1,958 (25.0%) | 10,257 (35.3%) |
| 3.0x to 3.9x | 1,351 (17.2%) | 9,448 (32.5%) |
| 4.0x or more | 2,522 (32.2%) | 4,770 (16.4%) |
| Total | 7,831 (100.0%) | 29,068 (100.0%) |
Real Estate Taxes by Mortgage Status in Kendall County

| Property Taxes | Without Mortgage | With Mortgage |
| Less than $800 | 120 (1.5%) | 314 (1.1%) |
| $800 to $1,499 | 40 (0.5%) | 315 (1.1%) |
| $800 to $1,499 | 7,468 (95.4%) | 143 (0.5%) |
| Total | 7,831 (100.0%) | 29,068 (100.0%) |
Health & Disability in Kendall County
Health Insurance Coverage by Age in Kendall County
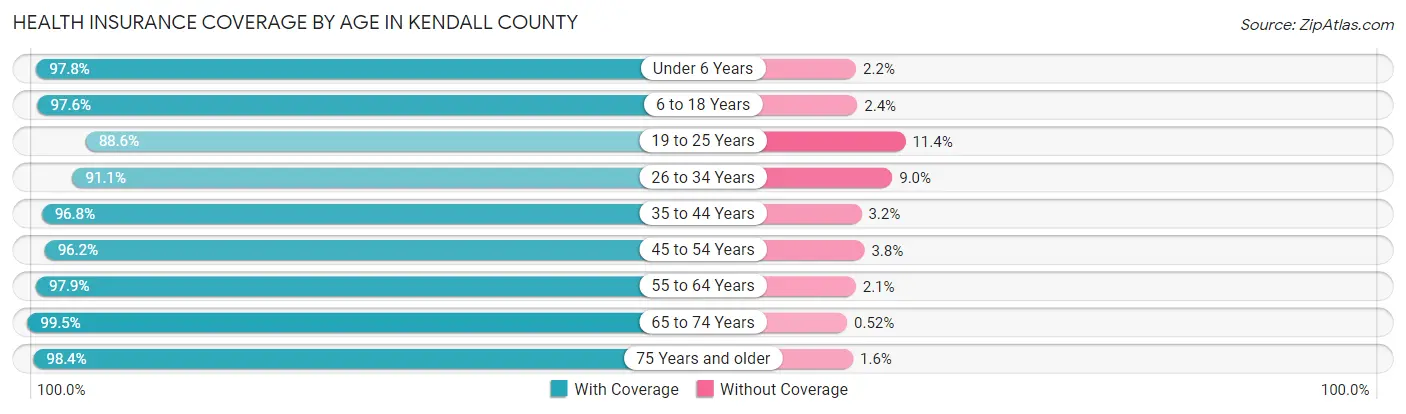
| Age Bracket | With Coverage | Without Coverage |
| Under 6 Years | 9,617 (97.8%) | 217 (2.2%) |
| 6 to 18 Years | 28,270 (97.6%) | 707 (2.4%) |
| 19 to 25 Years | 8,893 (88.6%) | 1,145 (11.4%) |
| 26 to 34 Years | 13,905 (91.0%) | 1,366 (8.9%) |
| 35 to 44 Years | 20,912 (96.8%) | 692 (3.2%) |
| 45 to 54 Years | 18,434 (96.2%) | 721 (3.8%) |
| 55 to 64 Years | 13,161 (97.9%) | 288 (2.1%) |
| 65 to 74 Years | 8,797 (99.5%) | 46 (0.5%) |
| 75 Years and older | 5,232 (98.4%) | 87 (1.6%) |
| Total | 127,221 (96.0%) | 5,269 (4.0%) |
Health Insurance Coverage by Citizenship Status in Kendall County
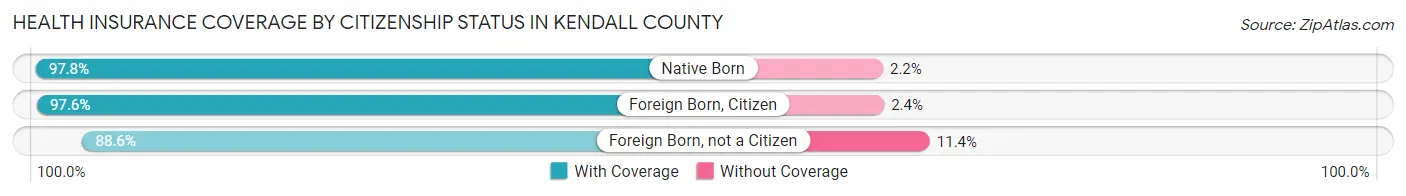
| Citizenship Status | With Coverage | Without Coverage |
| Native Born | 9,617 (97.8%) | 217 (2.2%) |
| Foreign Born, Citizen | 28,270 (97.6%) | 707 (2.4%) |
| Foreign Born, not a Citizen | 8,893 (88.6%) | 1,145 (11.4%) |
Health Insurance Coverage by Household Income in Kendall County
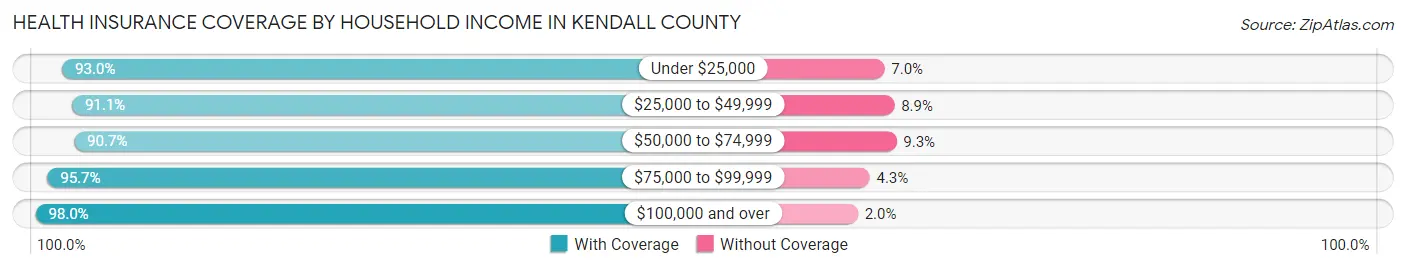
| Household Income | With Coverage | Without Coverage |
| Under $25,000 | 4,810 (93.0%) | 364 (7.0%) |
| $25,000 to $49,999 | 7,265 (91.1%) | 708 (8.9%) |
| $50,000 to $74,999 | 17,059 (90.7%) | 1,747 (9.3%) |
| $75,000 to $99,999 | 17,198 (95.7%) | 765 (4.3%) |
| $100,000 and over | 80,829 (98.0%) | 1,685 (2.0%) |
Public vs Private Health Insurance Coverage by Age in Kendall County
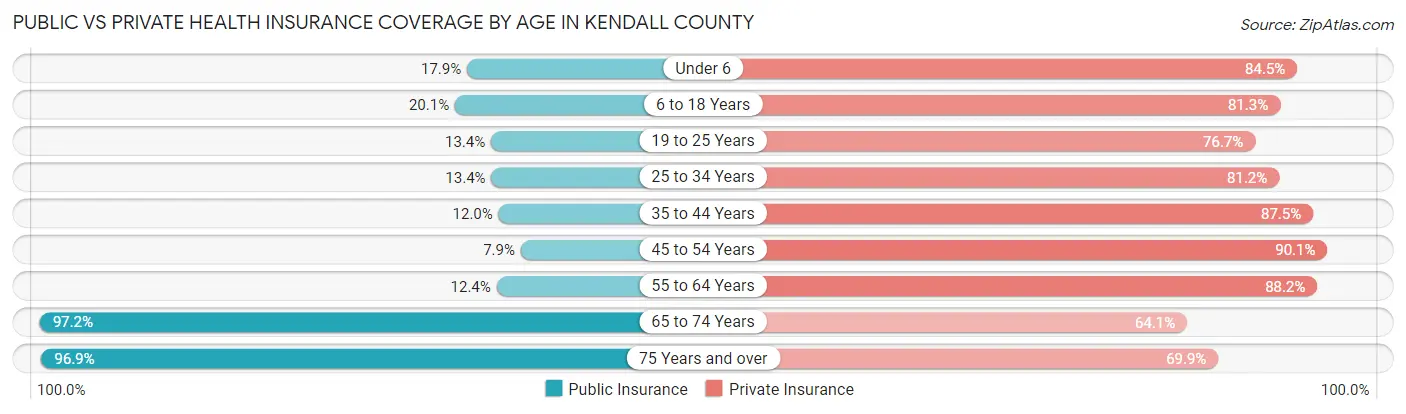
| Age Bracket | Public Insurance | Private Insurance |
| Under 6 | 1,758 (17.9%) | 8,312 (84.5%) |
| 6 to 18 Years | 5,826 (20.1%) | 23,567 (81.3%) |
| 19 to 25 Years | 1,347 (13.4%) | 7,701 (76.7%) |
| 25 to 34 Years | 2,038 (13.4%) | 12,394 (81.2%) |
| 35 to 44 Years | 2,597 (12.0%) | 18,896 (87.5%) |
| 45 to 54 Years | 1,513 (7.9%) | 17,260 (90.1%) |
| 55 to 64 Years | 1,666 (12.4%) | 11,868 (88.2%) |
| 65 to 74 Years | 8,594 (97.2%) | 5,667 (64.1%) |
| 75 Years and over | 5,153 (96.9%) | 3,716 (69.9%) |
| Total | 30,492 (23.0%) | 109,381 (82.6%) |
Disability Status by Sex by Age in Kendall County
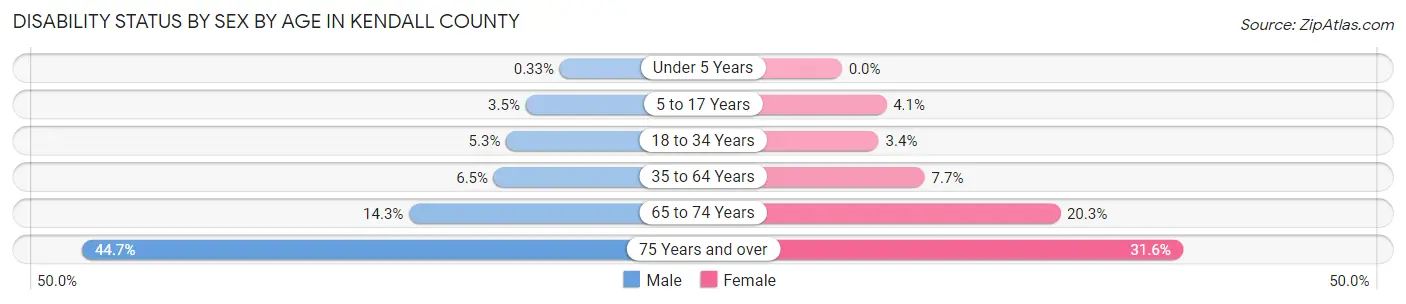
| Age Bracket | Male | Female |
| Under 5 Years | 14 (0.3%) | 0 (0.0%) |
| 5 to 17 Years | 509 (3.5%) | 574 (4.1%) |
| 18 to 34 Years | 728 (5.3%) | 466 (3.4%) |
| 35 to 64 Years | 1,757 (6.5%) | 2,073 (7.7%) |
| 65 to 74 Years | 599 (14.3%) | 943 (20.3%) |
| 75 Years and over | 989 (44.7%) | 982 (31.6%) |
Disability Class by Sex by Age in Kendall County
Disability Class: Hearing Difficulty
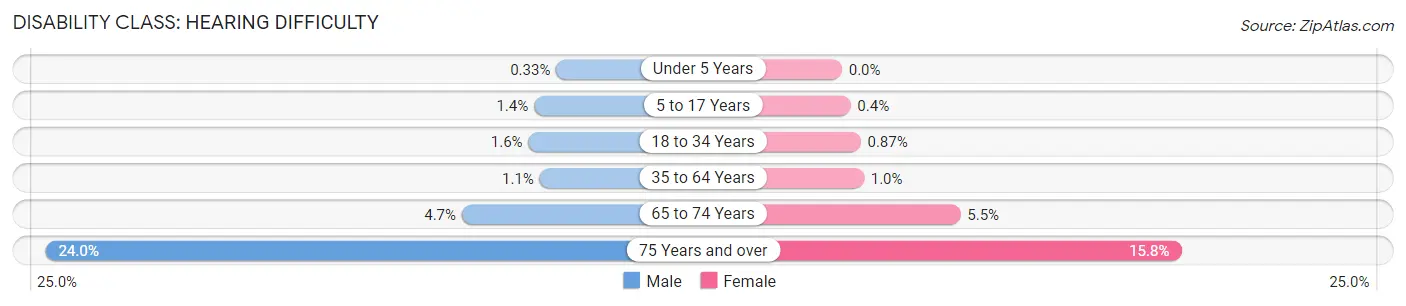
| Age Bracket | Male | Female |
| Under 5 Years | 14 (0.3%) | 0 (0.0%) |
| 5 to 17 Years | 199 (1.4%) | 55 (0.4%) |
| 18 to 34 Years | 223 (1.6%) | 118 (0.9%) |
| 35 to 64 Years | 300 (1.1%) | 276 (1.0%) |
| 65 to 74 Years | 197 (4.7%) | 256 (5.5%) |
| 75 Years and over | 532 (24.0%) | 489 (15.8%) |
Disability Class: Vision Difficulty
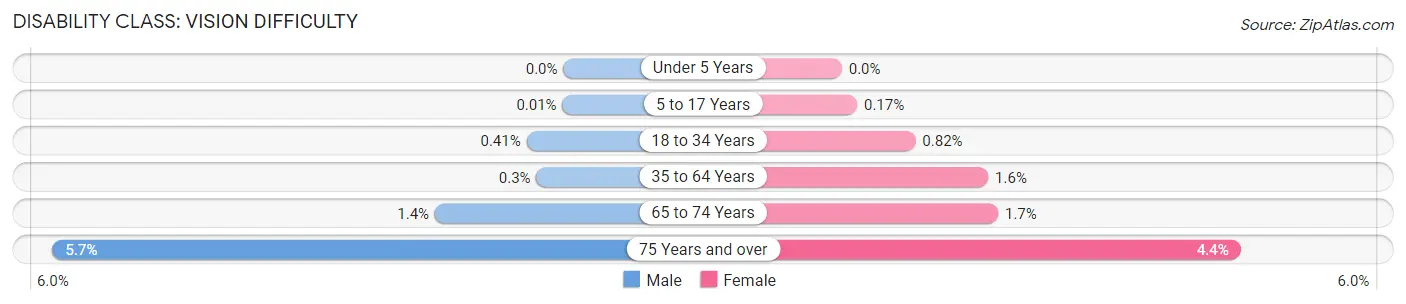
| Age Bracket | Male | Female |
| Under 5 Years | 0 (0.0%) | 0 (0.0%) |
| 5 to 17 Years | 2 (0.0%) | 24 (0.2%) |
| 18 to 34 Years | 56 (0.4%) | 112 (0.8%) |
| 35 to 64 Years | 82 (0.3%) | 440 (1.6%) |
| 65 to 74 Years | 60 (1.4%) | 81 (1.7%) |
| 75 Years and over | 126 (5.7%) | 138 (4.4%) |
Disability Class: Cognitive Difficulty
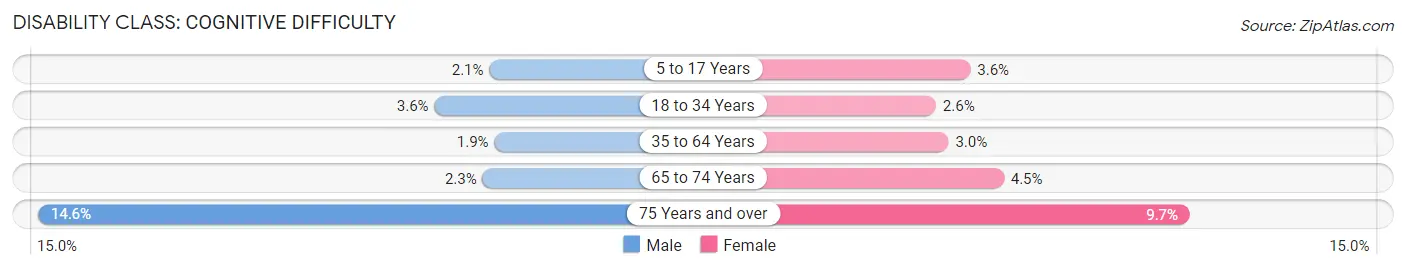
| Age Bracket | Male | Female |
| 5 to 17 Years | 300 (2.1%) | 498 (3.6%) |
| 18 to 34 Years | 494 (3.6%) | 357 (2.6%) |
| 35 to 64 Years | 522 (1.9%) | 801 (3.0%) |
| 65 to 74 Years | 94 (2.2%) | 210 (4.5%) |
| 75 Years and over | 324 (14.6%) | 301 (9.7%) |
Disability Class: Ambulatory Difficulty

| Age Bracket | Male | Female |
| 5 to 17 Years | 98 (0.7%) | 0 (0.0%) |
| 18 to 34 Years | 50 (0.4%) | 20 (0.2%) |
| 35 to 64 Years | 1,138 (4.2%) | 968 (3.6%) |
| 65 to 74 Years | 365 (8.7%) | 716 (15.4%) |
| 75 Years and over | 639 (28.9%) | 704 (22.7%) |
Disability Class: Self-Care Difficulty
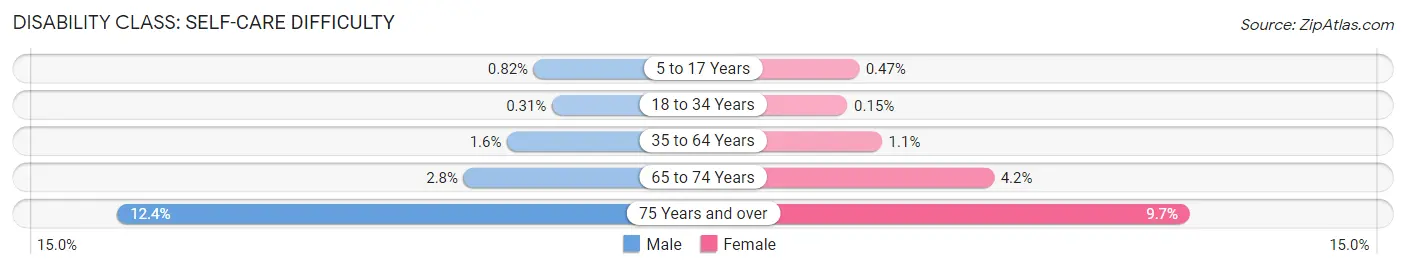
| Age Bracket | Male | Female |
| 5 to 17 Years | 120 (0.8%) | 65 (0.5%) |
| 18 to 34 Years | 42 (0.3%) | 20 (0.2%) |
| 35 to 64 Years | 426 (1.6%) | 300 (1.1%) |
| 65 to 74 Years | 116 (2.8%) | 197 (4.2%) |
| 75 Years and over | 275 (12.4%) | 301 (9.7%) |
Technology Access in Kendall County
Computing Device Access in Kendall County
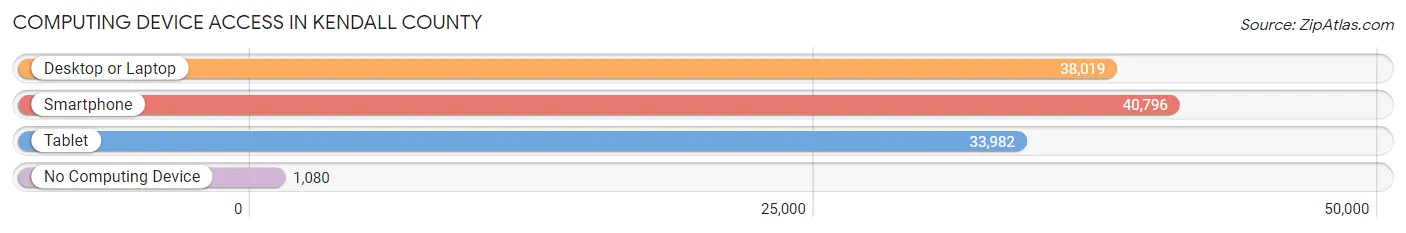
| Device Type | # Households | % Households |
| Desktop or Laptop | 38,019 | 86.7% |
| Smartphone | 40,796 | 93.0% |
| Tablet | 33,982 | 77.4% |
| No Computing Device | 1,080 | 2.5% |
| Total | 43,878 | 100.0% |
Internet Access in Kendall County
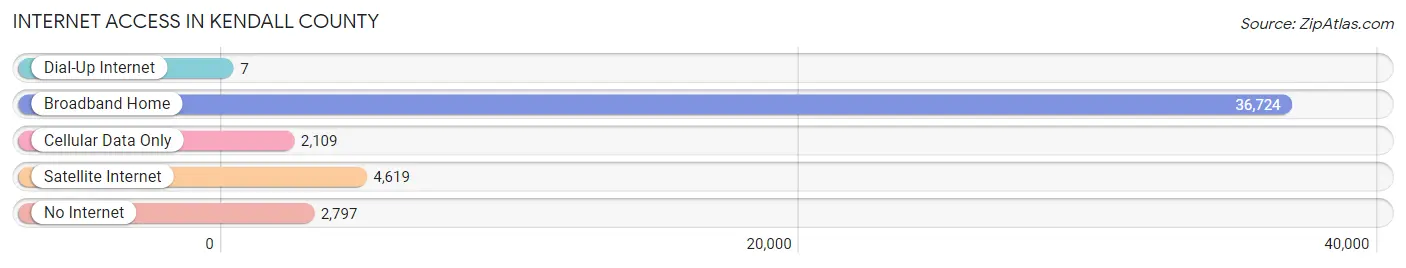
| Internet Type | # Households | % Households |
| Dial-Up Internet | 7 | 0.0% |
| Broadband Home | 36,724 | 83.7% |
| Cellular Data Only | 2,109 | 4.8% |
| Satellite Internet | 4,619 | 10.5% |
| No Internet | 2,797 | 6.4% |
| Total | 43,878 | 100.0% |
Kendall County Summary
Kendall County is a county located in the U.S. state of Illinois. As of the 2010 census, the population was 114,736. The county seat is Yorkville. Kendall County is part of the Chicago-Naperville-Elgin, IL-IN-WI Metropolitan Statistical Area.
History
Kendall County was formed in 1841 out of parts of LaSalle and Kane counties. It was named after Amos Kendall, a Postmaster General of the United States. The first county seat was Oswego, but it was moved to Yorkville in 1841.
Geography
Kendall County is located in the northeastern part of Illinois, along the Fox River. It is bordered by LaSalle County to the north, Kane County to the east, Will County to the south, and DeKalb County to the west. The county has a total area of 576 square miles, of which 571 square miles is land and 5.2 square miles (0.9%) is water.
Economy
Kendall County has a diverse economy, with a mix of manufacturing, retail, and service industries. The county is home to several large employers, including Caterpillar, Inc., John Deere, and the Kendall County Health Department. The county also has a strong agricultural sector, with corn, soybeans, and wheat being the primary crops.
Demographics
As of the 2010 census, there were 114,736 people, 40,837 households, and 31,845 families residing in the county. The population density was 200.3 people per square mile. The racial makeup of the county was 87.3% White, 5.7% Black or African American, 0.3% Native American, 2.7% Asian, 0.1% Pacific Islander, 2.2% from other races, and 2.0% from two or more races. 8.7% of the population were Hispanic or Latino of any race.
The median income for a household in the county was $86,845 and the median income for a family was $102,865. The per capita income for the county was $37,945. About 4.2% of families and 5.7% of the population were below the poverty line, including 6.7% of those under age 18 and 4.2% of those age 65 or over.
Kendall County is a rapidly growing area, with a population that is expected to continue to increase in the coming years. The county is home to a number of small towns and villages, as well as larger cities such as Aurora and Oswego. The county is also home to a number of parks and recreational areas, making it a popular destination for outdoor enthusiasts.
Common Questions
What is the Total Population of Kendall County?
Total Population of Kendall County is 132,795.
What is the Total Male Population of Kendall County?
Total Male Population of Kendall County is 66,370.
What is the Total Female Population of Kendall County?
Total Female Population of Kendall County is 66,425.
What is the Ratio of Males per 100 Females in Kendall County?
There are 99.92 Males per 100 Females in Kendall County.
What is the Ratio of Females per 100 Males in Kendall County?
There are 100.08 Females per 100 Males in Kendall County.
What is the Median Population Age in Kendall County?
Median Population Age in Kendall County is 36.1 Years.
What is the Average Family Size in Kendall County
Average Family Size in Kendall County is 3.5 People.
What is the Average Household Size in Kendall County
Average Household Size in Kendall County is 3.0 People.
What is Per Capita Income in Kendall County?
Per Capita income in Kendall County is $40,761.
What is the Median Family Income in Kendall County?
Median Family Income in Kendall County is $114,678.
What is the Median Household income in Kendall County?
Median Household Income in Kendall County is $106,358.
What is Income or Wage Gap in Kendall County?
Income or Wage Gap in Kendall County is 31.3%.
Women in Kendall County earn 68.7 cents for every dollar earned by a man.
What is Family Income Deficit in Kendall County?
Family Income Deficit in Kendall County is $13,944.
Families that are below poverty line in Kendall County earn $13,944 less on average than the poverty threshold level.
What is Inequality or Gini Index in Kendall County?
Inequality or Gini Index in Kendall County is 0.35.
How Large is the Labor Force in Kendall County?
There are 72,596 People in the Labor Forcein in Kendall County.
What is the Percentage of People in the Labor Force in Kendall County?
72.3% of People are in the Labor Force in Kendall County.
What is the Unemployment Rate in Kendall County?
Unemployment Rate in Kendall County is 4.3%.