Kane County, IL
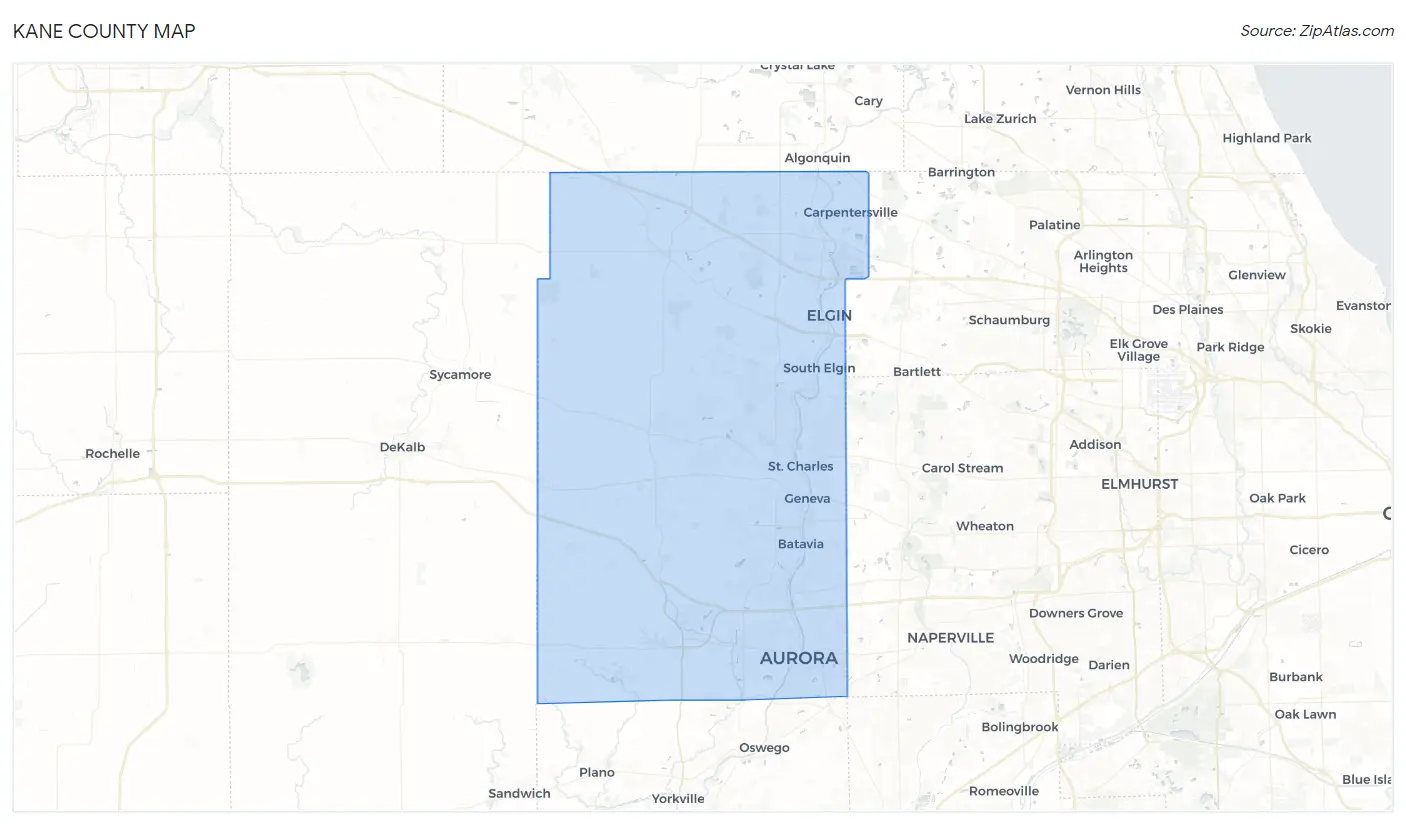
Kane County Map
Kane County Overview
517,254
TOTAL POPULATION
259,491
MALE POPULATION
257,763
FEMALE POPULATION
100.67
MALES / 100 FEMALES
99.33
FEMALES / 100 MALES
38.3
MEDIAN AGE
3.3
AVG FAMILY SIZE
2.8
AVG HOUSEHOLD SIZE
$44,523
PER CAPITA INCOME
$112,260
AVG FAMILY INCOME
$96,400
AVG HOUSEHOLD INCOME
35.3%
WAGE / INCOME GAP [ % ]
64.7¢/ $1
WAGE / INCOME GAP [ $ ]
$10,519
FAMILY INCOME DEFICIT
0.44
INEQUALITY / GINI INDEX
283,172
LABOR FORCE [ PEOPLE ]
69.6%
PERCENT IN LABOR FORCE
5.0%
UNEMPLOYMENT RATE
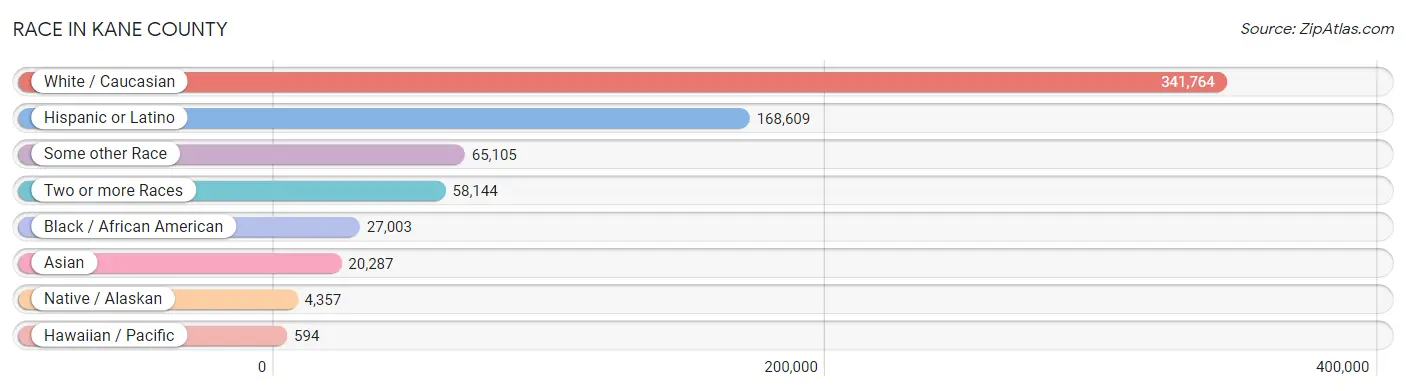
Race in Kane County
The most populous races in Kane County are White / Caucasian (341,764 | 66.1%), Hispanic or Latino (168,609 | 32.6%), and Some other Race (65,105 | 12.6%).
| Race | # Population | % Population |
| Asian | 20,287 | 3.9% |
| Black / African American | 27,003 | 5.2% |
| Hawaiian / Pacific | 594 | 0.1% |
| Hispanic or Latino | 168,609 | 32.6% |
| Native / Alaskan | 4,357 | 0.8% |
| White / Caucasian | 341,764 | 66.1% |
| Two or more Races | 58,144 | 11.2% |
| Some other Race | 65,105 | 12.6% |
| Total | 517,254 | 100.0% |
Ancestry in Kane County
The most populous ancestries reported in Kane County are Mexican (140,614 | 27.2%), German (94,474 | 18.3%), Irish (55,370 | 10.7%), Italian (38,469 | 7.4%), and Polish (35,309 | 6.8%), together accounting for 70.4% of all Kane County residents.

| Ancestry | # Population | % Population |
| African | 807 | 0.2% |
| Alaska Native | 52 | 0.0% |
| Albanian | 604 | 0.1% |
| Alsatian | 17 | 0.0% |
| American | 13,824 | 2.7% |
| Apache | 47 | 0.0% |
| Arab | 1,663 | 0.3% |
| Argentinean | 303 | 0.1% |
| Armenian | 247 | 0.1% |
| Assyrian / Chaldean / Syriac | 303 | 0.1% |
| Australian | 104 | 0.0% |
| Austrian | 1,427 | 0.3% |
| Bahamian | 19 | 0.0% |
| Bangladeshi | 76 | 0.0% |
| Barbadian | 29 | 0.0% |
| Belgian | 640 | 0.1% |
| Belizean | 68 | 0.0% |
| Bhutanese | 1,056 | 0.2% |
| Blackfeet | 126 | 0.0% |
| Bolivian | 112 | 0.0% |
| Brazilian | 78 | 0.0% |
| British | 1,490 | 0.3% |
| British West Indian | 3 | 0.0% |
| Bulgarian | 164 | 0.0% |
| Burmese | 1,999 | 0.4% |
| Cajun | 46 | 0.0% |
| Cambodian | 36 | 0.0% |
| Canadian | 903 | 0.2% |
| Cape Verdean | 38 | 0.0% |
| Celtic | 44 | 0.0% |
| Central American | 5,574 | 1.1% |
| Central American Indian | 427 | 0.1% |
| Cherokee | 485 | 0.1% |
| Chickasaw | 10 | 0.0% |
| Chilean | 279 | 0.1% |
| Chinese | 12 | 0.0% |
| Chippewa | 217 | 0.0% |
| Choctaw | 62 | 0.0% |
| Colombian | 1,364 | 0.3% |
| Costa Rican | 238 | 0.1% |
| Cree | 4 | 0.0% |
| Creek | 21 | 0.0% |
| Croatian | 1,275 | 0.3% |
| Cuban | 1,130 | 0.2% |
| Cypriot | 7 | 0.0% |
| Czech | 4,485 | 0.9% |
| Czechoslovakian | 513 | 0.1% |
| Danish | 2,161 | 0.4% |
| Delaware | 31 | 0.0% |
| Dominican | 365 | 0.1% |
| Dutch | 5,628 | 1.1% |
| Eastern European | 1,053 | 0.2% |
| Ecuadorian | 653 | 0.1% |
| Egyptian | 119 | 0.0% |
| English | 33,235 | 6.4% |
| Estonian | 44 | 0.0% |
| Ethiopian | 85 | 0.0% |
| European | 8,634 | 1.7% |
| Fijian | 3 | 0.0% |
| Filipino | 54 | 0.0% |
| Finnish | 816 | 0.2% |
| French | 8,827 | 1.7% |
| French Canadian | 1,803 | 0.4% |
| German | 94,474 | 18.3% |
| Ghanaian | 20 | 0.0% |
| Greek | 3,312 | 0.6% |
| Guamanian / Chamorro | 38 | 0.0% |
| Guatemalan | 1,640 | 0.3% |
| Guyanese | 21 | 0.0% |
| Haitian | 239 | 0.1% |
| Honduran | 243 | 0.1% |
| Hungarian | 2,130 | 0.4% |
| Icelander | 132 | 0.0% |
| Indian (Asian) | 2,109 | 0.4% |
| Indonesian | 271 | 0.1% |
| Inupiat | 128 | 0.0% |
| Iranian | 379 | 0.1% |
| Iraqi | 182 | 0.0% |
| Irish | 55,370 | 10.7% |
| Iroquois | 77 | 0.0% |
| Israeli | 228 | 0.0% |
| Italian | 38,469 | 7.4% |
| Jamaican | 351 | 0.1% |
| Japanese | 68 | 0.0% |
| Jordanian | 12 | 0.0% |
| Kenyan | 42 | 0.0% |
| Korean | 6,728 | 1.3% |
| Laotian | 341 | 0.1% |
| Latvian | 103 | 0.0% |
| Lebanese | 200 | 0.0% |
| Lithuanian | 2,114 | 0.4% |
| Luxembourger | 1,045 | 0.2% |
| Macedonian | 170 | 0.0% |
| Malaysian | 1,938 | 0.4% |
| Menominee | 16 | 0.0% |
| Mexican | 140,614 | 27.2% |
| Mexican American Indian | 2,783 | 0.5% |
| Mongolian | 32 | 0.0% |
| Moroccan | 40 | 0.0% |
| Native Hawaiian | 218 | 0.0% |
| Navajo | 14 | 0.0% |
| Nicaraguan | 207 | 0.0% |
| Nigerian | 515 | 0.1% |
| Northern European | 1,286 | 0.3% |
| Norwegian | 9,243 | 1.8% |
| Osage | 3 | 0.0% |
| Ottawa | 37 | 0.0% |
| Pakistani | 640 | 0.1% |
| Palestinian | 58 | 0.0% |
| Panamanian | 506 | 0.1% |
| Pennsylvania German | 99 | 0.0% |
| Peruvian | 462 | 0.1% |
| Polish | 35,309 | 6.8% |
| Portuguese | 412 | 0.1% |
| Potawatomi | 13 | 0.0% |
| Puerto Rican | 11,262 | 2.2% |
| Romanian | 1,385 | 0.3% |
| Russian | 2,754 | 0.5% |
| Salvadoran | 2,740 | 0.5% |
| Samoan | 165 | 0.0% |
| Scandinavian | 1,363 | 0.3% |
| Scotch-Irish | 2,416 | 0.5% |
| Scottish | 6,162 | 1.2% |
| Serbian | 685 | 0.1% |
| Sioux | 92 | 0.0% |
| Slavic | 186 | 0.0% |
| Slovak | 917 | 0.2% |
| Slovene | 466 | 0.1% |
| Somali | 10 | 0.0% |
| South American | 3,920 | 0.8% |
| Spaniard | 1,058 | 0.2% |
| Spanish | 940 | 0.2% |
| Spanish American | 14 | 0.0% |
| Sri Lankan | 994 | 0.2% |
| Subsaharan African | 1,597 | 0.3% |
| Swedish | 13,319 | 2.6% |
| Swiss | 1,413 | 0.3% |
| Syrian | 651 | 0.1% |
| Thai | 6,825 | 1.3% |
| Tohono O'Odham | 29 | 0.0% |
| Trinidadian and Tobagonian | 43 | 0.0% |
| Tsimshian | 8 | 0.0% |
| Turkish | 253 | 0.1% |
| U.S. Virgin Islander | 10 | 0.0% |
| Ugandan | 3 | 0.0% |
| Ukrainian | 2,086 | 0.4% |
| Venezuelan | 613 | 0.1% |
| Vietnamese | 15 | 0.0% |
| Welsh | 1,566 | 0.3% |
| West Indian | 91 | 0.0% |
| Yugoslavian | 389 | 0.1% | View All 151 Rows |
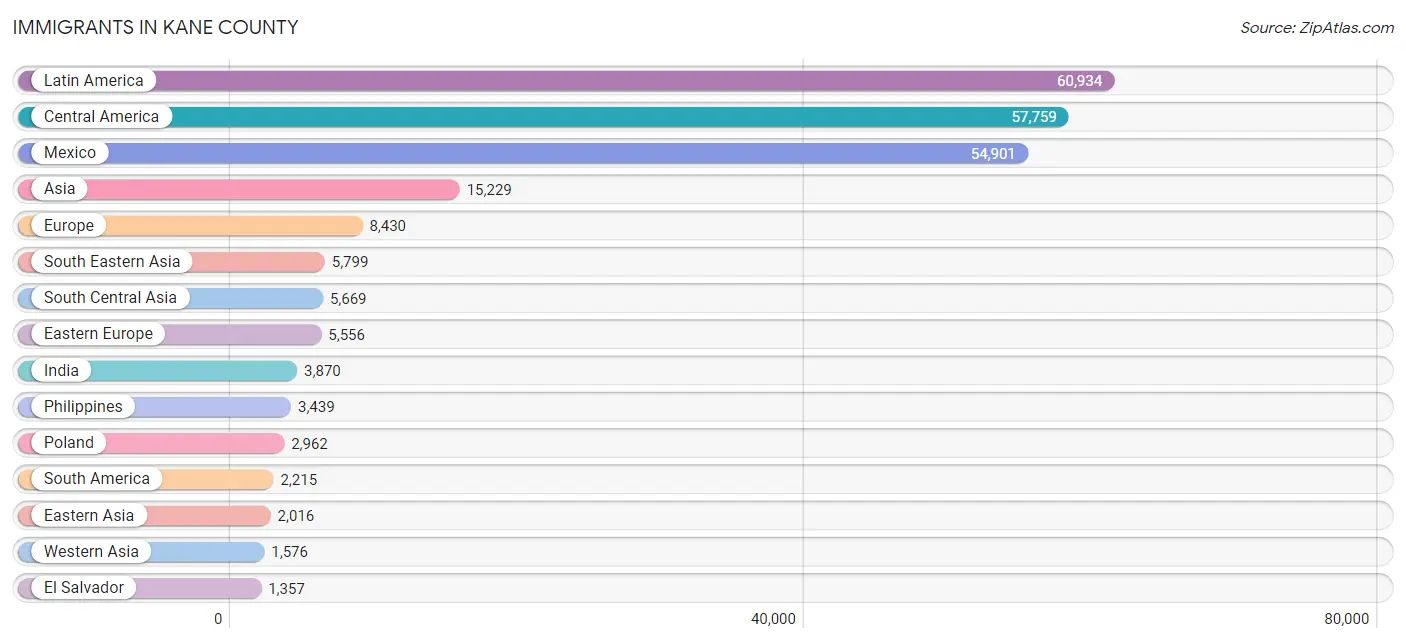
Immigrants in Kane County
The most numerous immigrant groups reported in Kane County came from Latin America (60,934 | 11.8%), Central America (57,759 | 11.2%), Mexico (54,901 | 10.6%), Asia (15,229 | 2.9%), and Europe (8,430 | 1.6%), together accounting for 38.1% of all Kane County residents.
| Immigration Origin | # Population | % Population |
| Africa | 1,032 | 0.2% |
| Albania | 170 | 0.0% |
| Argentina | 181 | 0.0% |
| Armenia | 26 | 0.0% |
| Asia | 15,229 | 2.9% |
| Australia | 69 | 0.0% |
| Austria | 29 | 0.0% |
| Azores | 5 | 0.0% |
| Bahamas | 9 | 0.0% |
| Bangladesh | 60 | 0.0% |
| Barbados | 10 | 0.0% |
| Belarus | 13 | 0.0% |
| Belgium | 22 | 0.0% |
| Belize | 47 | 0.0% |
| Bolivia | 170 | 0.0% |
| Bosnia and Herzegovina | 261 | 0.1% |
| Brazil | 153 | 0.0% |
| Bulgaria | 61 | 0.0% |
| Cambodia | 12 | 0.0% |
| Canada | 809 | 0.2% |
| Caribbean | 960 | 0.2% |
| Central America | 57,759 | 11.2% |
| Chile | 138 | 0.0% |
| China | 708 | 0.1% |
| Colombia | 850 | 0.2% |
| Costa Rica | 198 | 0.0% |
| Croatia | 59 | 0.0% |
| Cuba | 491 | 0.1% |
| Czechoslovakia | 154 | 0.0% |
| Denmark | 15 | 0.0% |
| Dominican Republic | 152 | 0.0% |
| Eastern Africa | 377 | 0.1% |
| Eastern Asia | 2,016 | 0.4% |
| Eastern Europe | 5,556 | 1.1% |
| Ecuador | 308 | 0.1% |
| Egypt | 21 | 0.0% |
| El Salvador | 1,357 | 0.3% |
| England | 242 | 0.1% |
| Eritrea | 17 | 0.0% |
| Ethiopia | 101 | 0.0% |
| Europe | 8,430 | 1.6% |
| France | 131 | 0.0% |
| Germany | 657 | 0.1% |
| Ghana | 116 | 0.0% |
| Greece | 253 | 0.1% |
| Guatemala | 707 | 0.1% |
| Haiti | 50 | 0.0% |
| Honduras | 207 | 0.0% |
| Hong Kong | 81 | 0.0% |
| Hungary | 29 | 0.0% |
| India | 3,870 | 0.7% |
| Indonesia | 308 | 0.1% |
| Iran | 306 | 0.1% |
| Iraq | 453 | 0.1% |
| Ireland | 188 | 0.0% |
| Italy | 439 | 0.1% |
| Jamaica | 145 | 0.0% |
| Japan | 158 | 0.0% |
| Jordan | 12 | 0.0% |
| Kenya | 167 | 0.0% |
| Korea | 1,114 | 0.2% |
| Laos | 1,043 | 0.2% |
| Latin America | 60,934 | 11.8% |
| Lebanon | 4 | 0.0% |
| Lithuania | 242 | 0.1% |
| Malaysia | 59 | 0.0% |
| Mexico | 54,901 | 10.6% |
| Middle Africa | 24 | 0.0% |
| Moldova | 180 | 0.0% |
| Morocco | 19 | 0.0% |
| Nepal | 145 | 0.0% |
| Netherlands | 20 | 0.0% |
| Nicaragua | 73 | 0.0% |
| Nigeria | 387 | 0.1% |
| North Macedonia | 137 | 0.0% |
| Northern Africa | 80 | 0.0% |
| Northern Europe | 1,071 | 0.2% |
| Norway | 17 | 0.0% |
| Oceania | 198 | 0.0% |
| Pakistan | 1,165 | 0.2% |
| Panama | 269 | 0.1% |
| Peru | 119 | 0.0% |
| Philippines | 3,439 | 0.7% |
| Poland | 2,962 | 0.6% |
| Portugal | 5 | 0.0% |
| Romania | 257 | 0.1% |
| Russia | 370 | 0.1% |
| Saudi Arabia | 27 | 0.0% |
| Scotland | 105 | 0.0% |
| Serbia | 45 | 0.0% |
| Singapore | 12 | 0.0% |
| Somalia | 10 | 0.0% |
| South Africa | 8 | 0.0% |
| South America | 2,215 | 0.4% |
| South Central Asia | 5,669 | 1.1% |
| South Eastern Asia | 5,799 | 1.1% |
| Southern Europe | 791 | 0.2% |
| Spain | 94 | 0.0% |
| Sri Lanka | 22 | 0.0% |
| Sweden | 126 | 0.0% |
| Switzerland | 14 | 0.0% |
| Syria | 557 | 0.1% |
| Taiwan | 162 | 0.0% |
| Thailand | 253 | 0.1% |
| Trinidad and Tobago | 73 | 0.0% |
| Turkey | 98 | 0.0% |
| Uganda | 3 | 0.0% |
| Ukraine | 561 | 0.1% |
| Venezuela | 296 | 0.1% |
| Vietnam | 483 | 0.1% |
| West Indies | 30 | 0.0% |
| Western Africa | 534 | 0.1% |
| Western Asia | 1,576 | 0.3% |
| Western Europe | 873 | 0.2% |
| Zaire | 24 | 0.0% |
| Zimbabwe | 10 | 0.0% | View All 116 Rows |
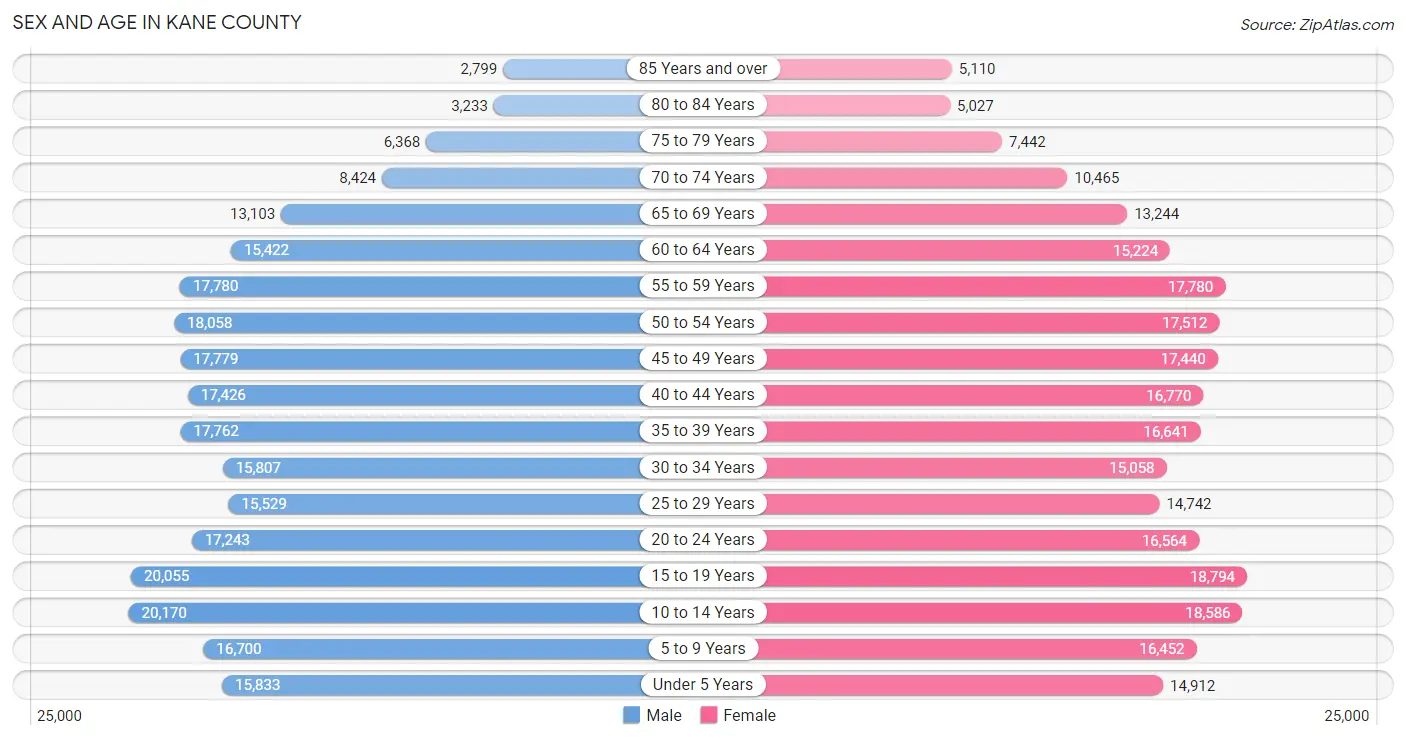
Sex and Age in Kane County
Sex and Age in Kane County
The most populous age groups in Kane County are 10 to 14 Years (20,170 | 7.8%) for men and 15 to 19 Years (18,794 | 7.3%) for women.
| Age Bracket | Male | Female |
| Under 5 Years | 15,833 (6.1%) | 14,912 (5.8%) |
| 5 to 9 Years | 16,700 (6.4%) | 16,452 (6.4%) |
| 10 to 14 Years | 20,170 (7.8%) | 18,586 (7.2%) |
| 15 to 19 Years | 20,055 (7.7%) | 18,794 (7.3%) |
| 20 to 24 Years | 17,243 (6.6%) | 16,564 (6.4%) |
| 25 to 29 Years | 15,529 (6.0%) | 14,742 (5.7%) |
| 30 to 34 Years | 15,807 (6.1%) | 15,058 (5.8%) |
| 35 to 39 Years | 17,762 (6.8%) | 16,641 (6.5%) |
| 40 to 44 Years | 17,426 (6.7%) | 16,770 (6.5%) |
| 45 to 49 Years | 17,779 (6.9%) | 17,440 (6.8%) |
| 50 to 54 Years | 18,058 (7.0%) | 17,512 (6.8%) |
| 55 to 59 Years | 17,780 (6.9%) | 17,780 (6.9%) |
| 60 to 64 Years | 15,422 (5.9%) | 15,224 (5.9%) |
| 65 to 69 Years | 13,103 (5.1%) | 13,244 (5.1%) |
| 70 to 74 Years | 8,424 (3.3%) | 10,465 (4.1%) |
| 75 to 79 Years | 6,368 (2.5%) | 7,442 (2.9%) |
| 80 to 84 Years | 3,233 (1.3%) | 5,027 (1.9%) |
| 85 Years and over | 2,799 (1.1%) | 5,110 (2.0%) |
| Total | 259,491 (100.0%) | 257,763 (100.0%) |
Families and Households in Kane County
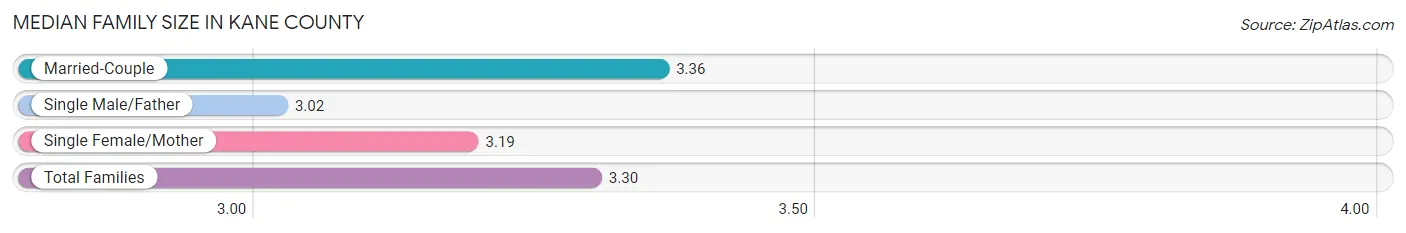
Median Family Size in Kane County
The median family size in Kane County is 3.30 persons per family, with married-couple families (100,801 | 76.3%) accounting for the largest median family size of 3.36 persons per family. On the other hand, single male/father families (10,607 | 8.0%) represent the smallest median family size with 3.02 persons per family.
| Family Type | # Families | Family Size |
| Married-Couple | 100,801 (76.3%) | 3.36 |
| Single Male/Father | 10,607 (8.0%) | 3.02 |
| Single Female/Mother | 20,725 (15.7%) | 3.19 |
| Total Families | 132,133 (100.0%) | 3.30 |
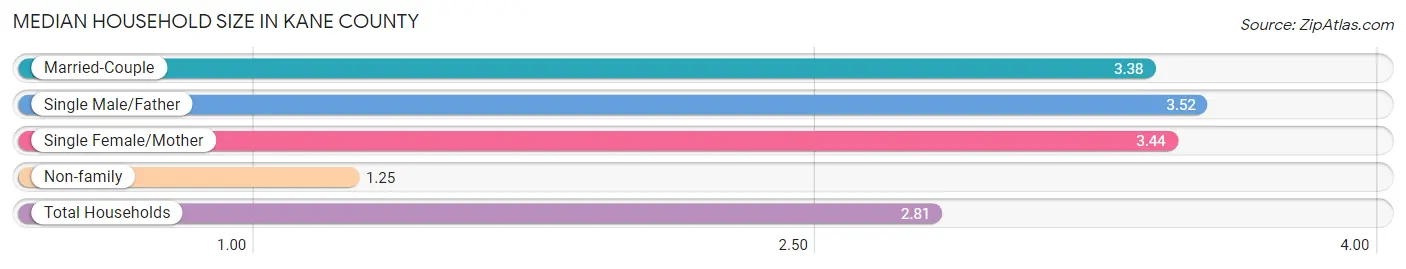
Median Household Size in Kane County
The median household size in Kane County is 2.81 persons per household, with single male/father households (10,607 | 5.8%) accounting for the largest median household size of 3.52 persons per household. non-family households (50,186 | 27.5%) represent the smallest median household size with 1.25 persons per household.
| Household Type | # Households | Household Size |
| Married-Couple | 100,801 (55.3%) | 3.38 |
| Single Male/Father | 10,607 (5.8%) | 3.52 |
| Single Female/Mother | 20,725 (11.4%) | 3.44 |
| Non-family | 50,186 (27.5%) | 1.25 |
| Total Households | 182,319 (100.0%) | 2.81 |
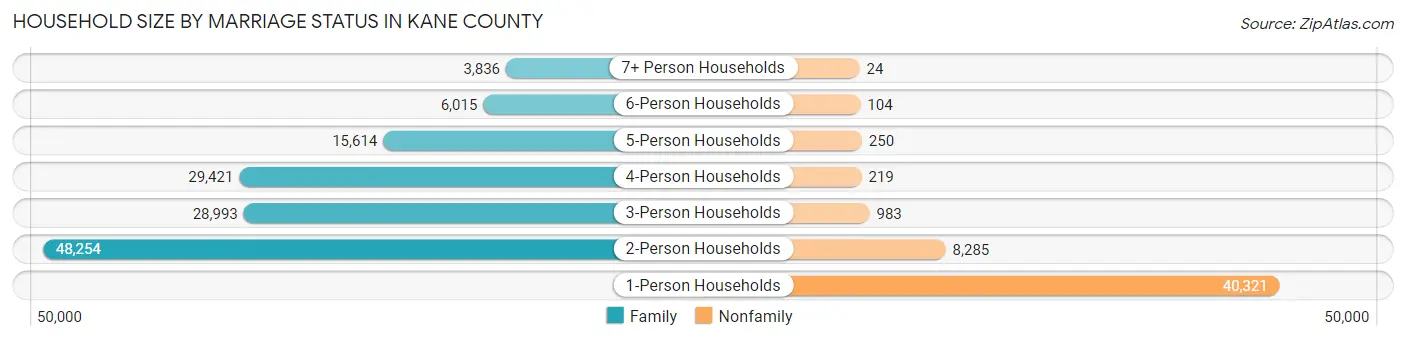
Household Size by Marriage Status in Kane County
Out of a total of 182,319 households in Kane County, 132,133 (72.5%) are family households, while 50,186 (27.5%) are nonfamily households. The most numerous type of family households are 2-person households, comprising 48,254, and the most common type of nonfamily households are 1-person households, comprising 40,321.
| Household Size | Family Households | Nonfamily Households |
| 1-Person Households | - | 40,321 (22.1%) |
| 2-Person Households | 48,254 (26.5%) | 8,285 (4.5%) |
| 3-Person Households | 28,993 (15.9%) | 983 (0.5%) |
| 4-Person Households | 29,421 (16.1%) | 219 (0.1%) |
| 5-Person Households | 15,614 (8.6%) | 250 (0.1%) |
| 6-Person Households | 6,015 (3.3%) | 104 (0.1%) |
| 7+ Person Households | 3,836 (2.1%) | 24 (0.0%) |
| Total | 132,133 (72.5%) | 50,186 (27.5%) |
Female Fertility in Kane County
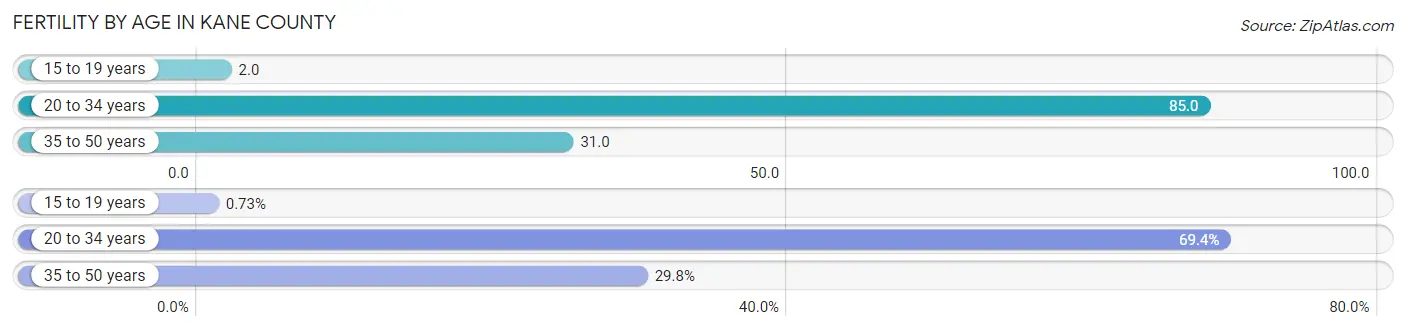
Fertility by Age in Kane County
Average fertility rate in Kane County is 47.0 births per 1,000 women. Women in the age bracket of 20 to 34 years have the highest fertility rate with 85.0 births per 1,000 women. Women in the age bracket of 20 to 34 years acount for 69.4% of all women with births.
| Age Bracket | Women with Births | Births / 1,000 Women |
| 15 to 19 years | 41 (0.7%) | 2.0 |
| 20 to 34 years | 3,925 (69.4%) | 85.0 |
| 35 to 50 years | 1,687 (29.8%) | 31.0 |
| Total | 5,653 (100.0%) | 47.0 |
Fertility by Age by Marriage Status in Kane County
73.9% of women with births (5,653) in Kane County are married. The highest percentage of unmarried women with births falls into 15 to 19 years age bracket with 100.0% of them unmarried at the time of birth, while the lowest percentage of unmarried women with births belong to 35 to 50 years age bracket with 21.8% of them unmarried.
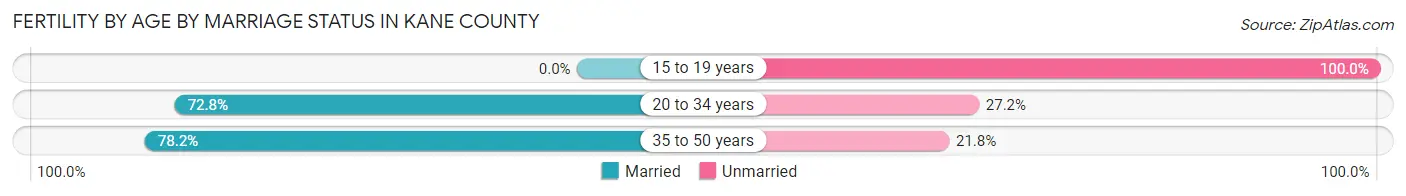
| Age Bracket | Married | Unmarried |
| 15 to 19 years | 0 (0.0%) | 41 (100.0%) |
| 20 to 34 years | 2,857 (72.8%) | 1,068 (27.2%) |
| 35 to 50 years | 1,319 (78.2%) | 368 (21.8%) |
| Total | 4,178 (73.9%) | 1,475 (26.1%) |
Fertility by Education in Kane County
Average fertility rate in Kane County is 47.0 births per 1,000 women. Women with the education attainment of graduate degree have the highest fertility rate of 65.0 births per 1,000 women, while women with the education attainment of less than high school have the lowest fertility at 29.0 births per 1,000 women. Women with the education attainment of college or associate's degree represent 30.0% of all women with births.
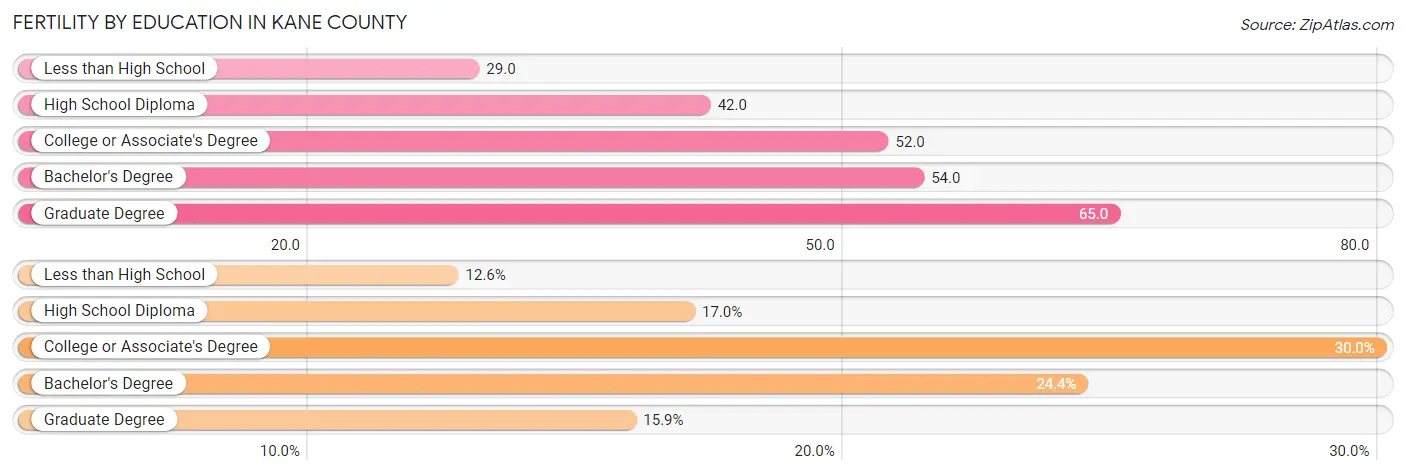
| Educational Attainment | Women with Births | Births / 1,000 Women |
| Less than High School | 713 (12.6%) | 29.0 |
| High School Diploma | 963 (17.0%) | 42.0 |
| College or Associate's Degree | 1,696 (30.0%) | 52.0 |
| Bachelor's Degree | 1,380 (24.4%) | 54.0 |
| Graduate Degree | 901 (15.9%) | 65.0 |
| Total | 5,653 (100.0%) | 47.0 |
Fertility by Education by Marriage Status in Kane County
26.1% of women with births in Kane County are unmarried. Women with the educational attainment of graduate degree are most likely to be married with 97.9% of them married at childbirth, while women with the educational attainment of less than high school are least likely to be married with 41.6% of them unmarried at childbirth.
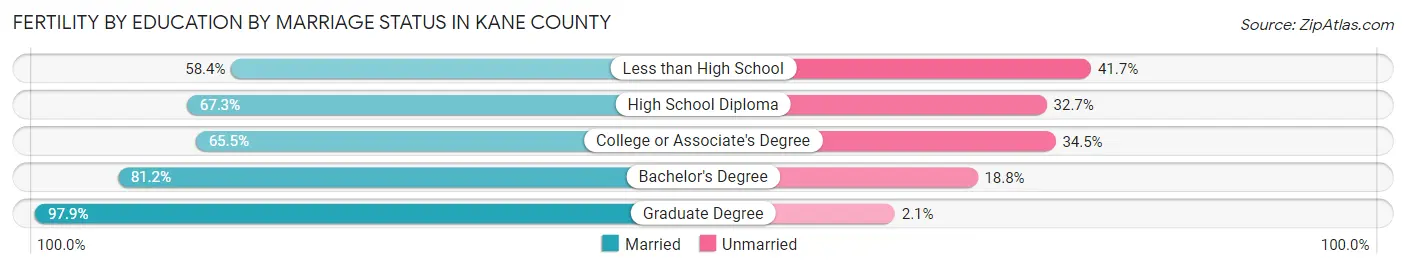
| Educational Attainment | Married | Unmarried |
| Less than High School | 416 (58.4%) | 297 (41.6%) |
| High School Diploma | 648 (67.3%) | 315 (32.7%) |
| College or Associate's Degree | 1,111 (65.5%) | 585 (34.5%) |
| Bachelor's Degree | 1,121 (81.2%) | 259 (18.8%) |
| Graduate Degree | 882 (97.9%) | 19 (2.1%) |
| Total | 4,178 (73.9%) | 1,475 (26.1%) |
Income in Kane County
Income Overview in Kane County
Per Capita Income in Kane County is $44,523, while median incomes of families and households are $112,260 and $96,400 respectively.
| Characteristic | Number | Measure |
| Per Capita Income | 517,254 | $44,523 |
| Median Family Income | 132,133 | $112,260 |
| Mean Family Income | 132,133 | $141,722 |
| Median Household Income | 182,319 | $96,400 |
| Mean Household Income | 182,319 | $125,010 |
| Income Deficit | 132,133 | $10,519 |
| Wage / Income Gap (%) | 517,254 | 35.28% |
| Wage / Income Gap ($) | 517,254 | 64.72¢ per $1 |
| Gini / Inequality Index | 517,254 | 0.44 |
Earnings by Sex in Kane County
Average Earnings in Kane County are $44,470, $54,447 for men and $35,240 for women, a difference of 35.3%.
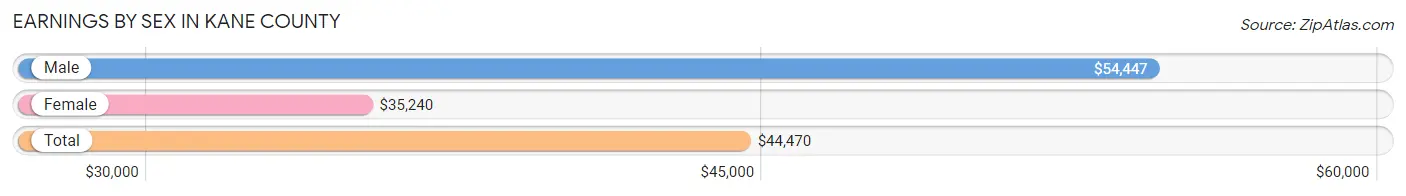
| Sex | Number | Average Earnings |
| Male | 157,910 (53.7%) | $54,447 |
| Female | 135,862 (46.3%) | $35,240 |
| Total | 293,772 (100.0%) | $44,470 |
Earnings by Sex by Income Bracket in Kane County
The most common earnings brackets in Kane County are $100,000+ for men (37,296 | 23.6%) and $100,000+ for women (13,823 | 10.2%).
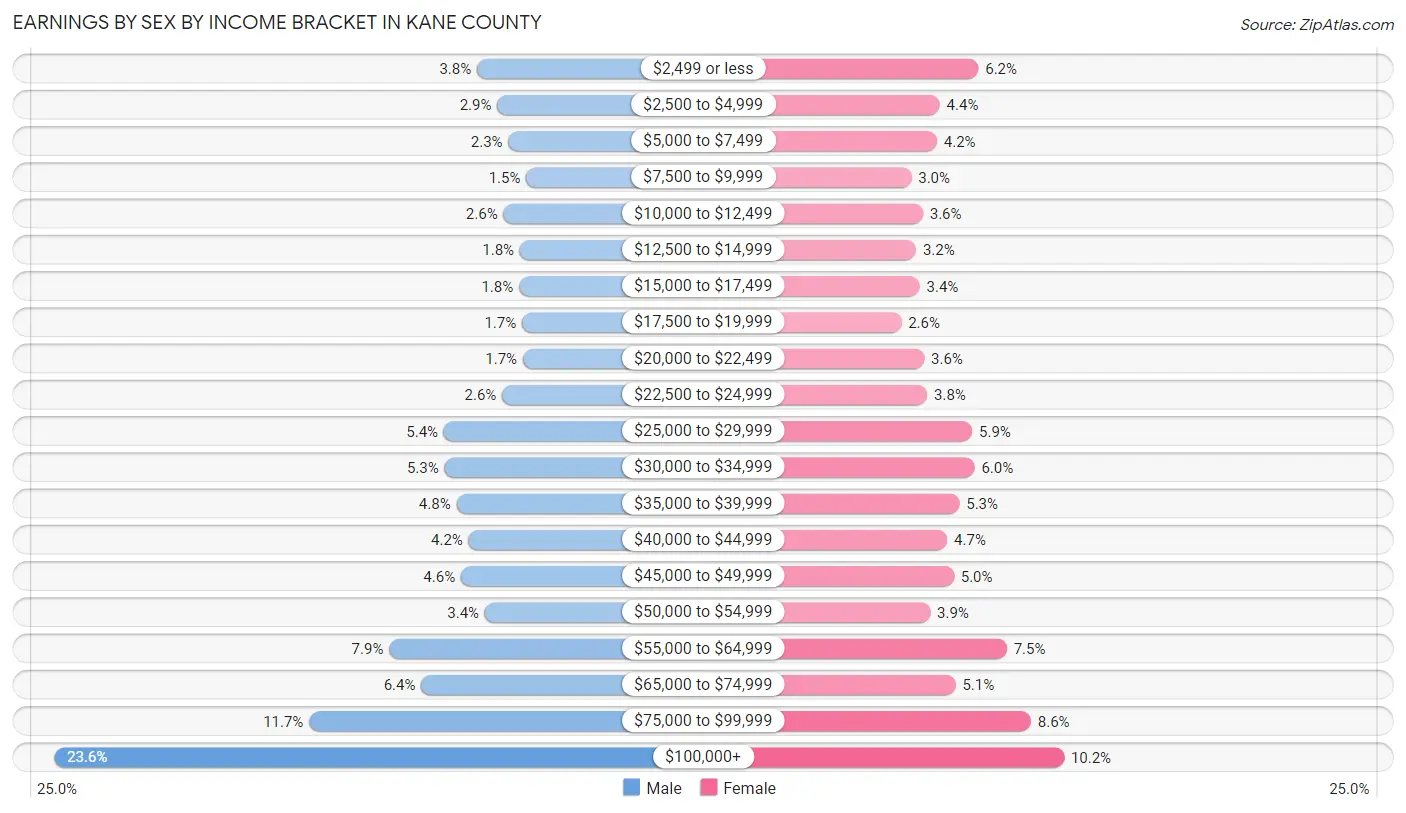
| Income | Male | Female |
| $2,499 or less | 6,009 (3.8%) | 8,373 (6.2%) |
| $2,500 to $4,999 | 4,510 (2.9%) | 5,916 (4.3%) |
| $5,000 to $7,499 | 3,696 (2.3%) | 5,730 (4.2%) |
| $7,500 to $9,999 | 2,373 (1.5%) | 4,105 (3.0%) |
| $10,000 to $12,499 | 4,066 (2.6%) | 4,832 (3.6%) |
| $12,500 to $14,999 | 2,850 (1.8%) | 4,402 (3.2%) |
| $15,000 to $17,499 | 2,906 (1.8%) | 4,632 (3.4%) |
| $17,500 to $19,999 | 2,685 (1.7%) | 3,467 (2.5%) |
| $20,000 to $22,499 | 2,614 (1.7%) | 4,924 (3.6%) |
| $22,500 to $24,999 | 4,148 (2.6%) | 5,106 (3.8%) |
| $25,000 to $29,999 | 8,460 (5.4%) | 7,981 (5.9%) |
| $30,000 to $34,999 | 8,415 (5.3%) | 8,130 (6.0%) |
| $35,000 to $39,999 | 7,534 (4.8%) | 7,154 (5.3%) |
| $40,000 to $44,999 | 6,638 (4.2%) | 6,380 (4.7%) |
| $45,000 to $49,999 | 7,205 (4.6%) | 6,804 (5.0%) |
| $50,000 to $54,999 | 5,425 (3.4%) | 5,292 (3.9%) |
| $55,000 to $64,999 | 12,514 (7.9%) | 10,178 (7.5%) |
| $65,000 to $74,999 | 10,142 (6.4%) | 6,917 (5.1%) |
| $75,000 to $99,999 | 18,424 (11.7%) | 11,716 (8.6%) |
| $100,000+ | 37,296 (23.6%) | 13,823 (10.2%) |
| Total | 157,910 (100.0%) | 135,862 (100.0%) |
Earnings by Sex by Educational Attainment in Kane County
Average earnings in Kane County are $63,466 for men and $42,189 for women, a difference of 33.5%. Men with an educational attainment of graduate degree enjoy the highest average annual earnings of $112,727, while those with less than high school education earn the least with $38,269. Women with an educational attainment of graduate degree earn the most with the average annual earnings of $72,884, while those with less than high school education have the smallest earnings of $24,664.
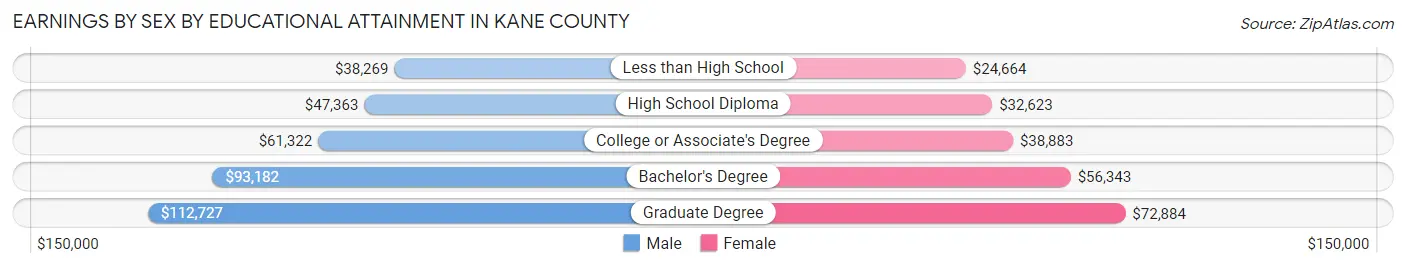
| Educational Attainment | Male Income | Female Income |
| Less than High School | $38,269 | $24,664 |
| High School Diploma | $47,363 | $32,623 |
| College or Associate's Degree | $61,322 | $38,883 |
| Bachelor's Degree | $93,182 | $56,343 |
| Graduate Degree | $112,727 | $72,884 |
| Total | $63,466 | $42,189 |
Family Income in Kane County
Family Income Brackets in Kane County
According to the Kane County family income data, there are 31,448 families falling into the $100,000 to $149,999 income range, which is the most common income bracket and makes up 23.8% of all families. Conversely, the $10,000 to $14,999 income bracket is the least frequent group with only 1,453 families (1.1%) belonging to this category.
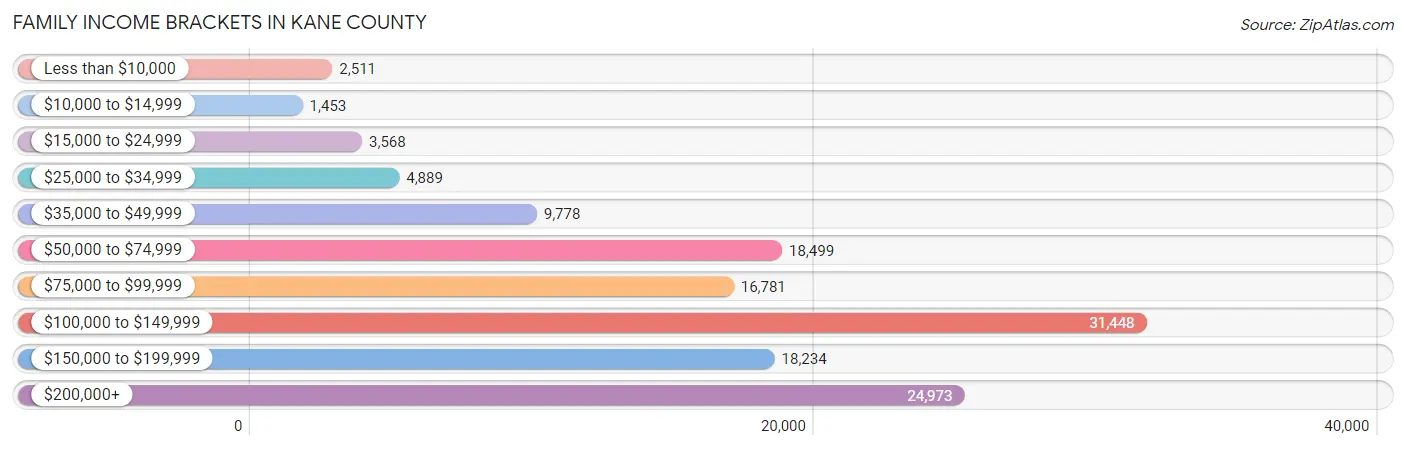
| Income Bracket | # Families | % Families |
| Less than $10,000 | 2,511 | 1.9% |
| $10,000 to $14,999 | 1,453 | 1.1% |
| $15,000 to $24,999 | 3,568 | 2.7% |
| $25,000 to $34,999 | 4,889 | 3.7% |
| $35,000 to $49,999 | 9,778 | 7.4% |
| $50,000 to $74,999 | 18,499 | 14.0% |
| $75,000 to $99,999 | 16,781 | 12.7% |
| $100,000 to $149,999 | 31,448 | 23.8% |
| $150,000 to $199,999 | 18,234 | 13.8% |
| $200,000+ | 24,973 | 18.9% |
Family Income by Famaliy Size in Kane County
4-person families (28,175 | 21.3%) account for the highest median family income in Kane County with $134,250 per family, while 2-person families (51,828 | 39.2%) have the highest median income of $48,108 per family member.
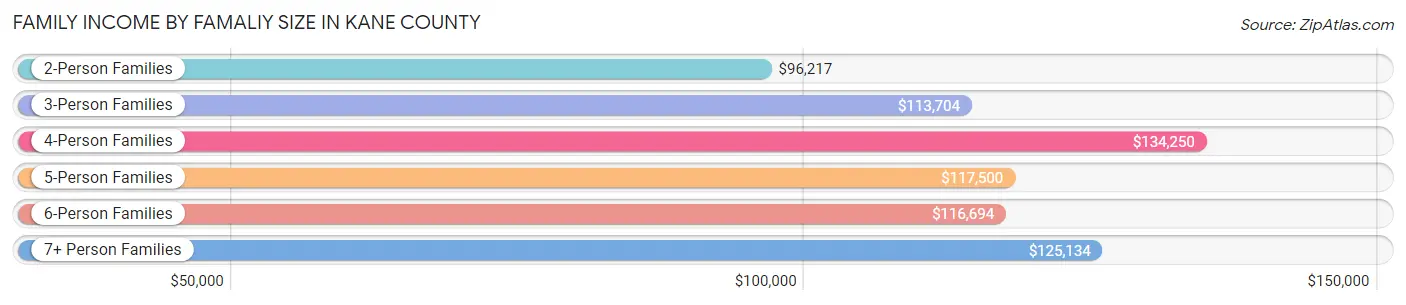
| Income Bracket | # Families | Median Income |
| 2-Person Families | 51,828 (39.2%) | $96,217 |
| 3-Person Families | 29,019 (22.0%) | $113,704 |
| 4-Person Families | 28,175 (21.3%) | $134,250 |
| 5-Person Families | 14,642 (11.1%) | $117,500 |
| 6-Person Families | 5,389 (4.1%) | $116,694 |
| 7+ Person Families | 3,080 (2.3%) | $125,134 |
| Total | 132,133 (100.0%) | $112,260 |
Family Income by Number of Earners in Kane County
The median family income in Kane County is $112,260, with families comprising 3+ earners (25,475) having the highest median family income of $145,721, while families with no earners (13,756) have the lowest median family income of $61,572, accounting for 19.3% and 10.4% of families, respectively.
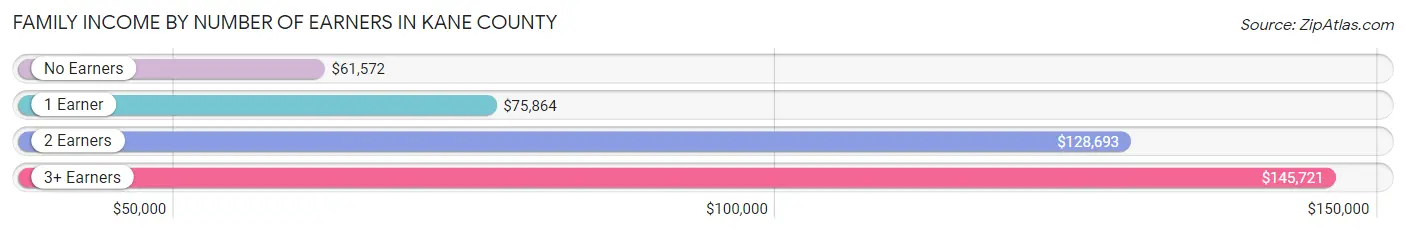
| Number of Earners | # Families | Median Income |
| No Earners | 13,756 (10.4%) | $61,572 |
| 1 Earner | 34,599 (26.2%) | $75,864 |
| 2 Earners | 58,303 (44.1%) | $128,693 |
| 3+ Earners | 25,475 (19.3%) | $145,721 |
| Total | 132,133 (100.0%) | $112,260 |
Household Income in Kane County
Household Income Brackets in Kane County
With 39,199 households falling in the category, the $100,000 to $149,999 income range is the most frequent in Kane County, accounting for 21.5% of all households. In contrast, only 3,646 households (2.0%) fall into the $10,000 to $14,999 income bracket, making it the least populous group.
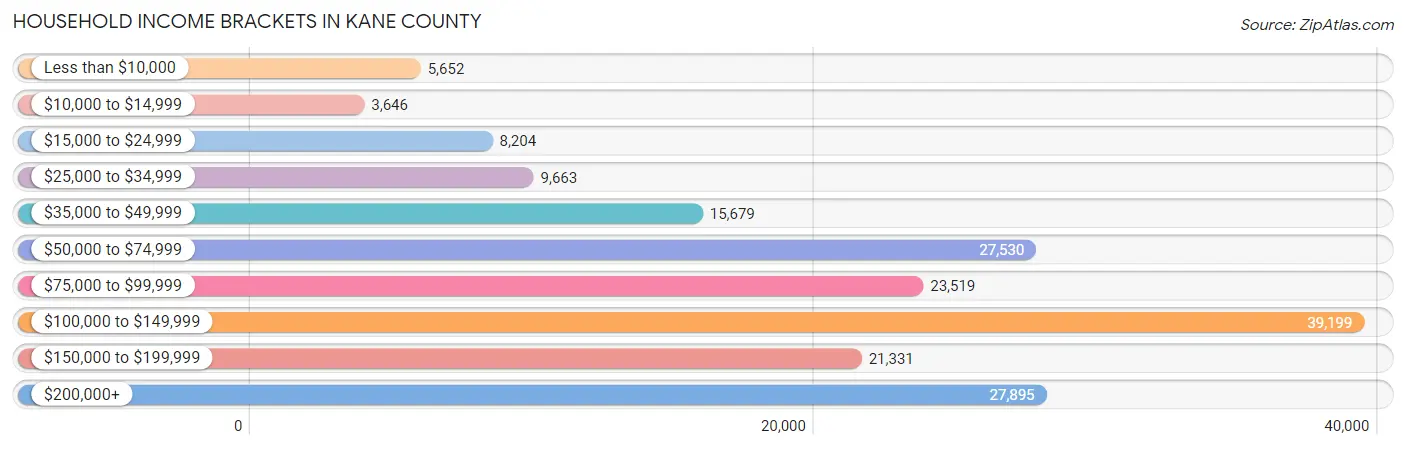
| Income Bracket | # Households | % Households |
| Less than $10,000 | 5,652 | 3.1% |
| $10,000 to $14,999 | 3,646 | 2.0% |
| $15,000 to $24,999 | 8,204 | 4.5% |
| $25,000 to $34,999 | 9,663 | 5.3% |
| $35,000 to $49,999 | 15,679 | 8.6% |
| $50,000 to $74,999 | 27,530 | 15.1% |
| $75,000 to $99,999 | 23,519 | 12.9% |
| $100,000 to $149,999 | 39,199 | 21.5% |
| $150,000 to $199,999 | 21,331 | 11.7% |
| $200,000+ | 27,895 | 15.3% |
Household Income by Householder Age in Kane County
The median household income in Kane County is $96,400, with the highest median household income of $117,668 found in the 45 to 64 years age bracket for the primary householder. A total of 74,819 households (41.0%) fall into this category. Meanwhile, the 15 to 24 years age bracket for the primary householder has the lowest median household income of $55,501, with 4,377 households (2.4%) in this group.
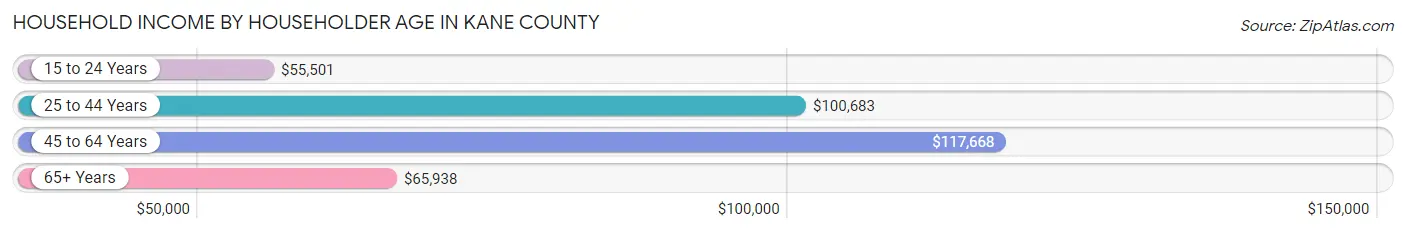
| Income Bracket | # Households | Median Income |
| 15 to 24 Years | 4,377 (2.4%) | $55,501 |
| 25 to 44 Years | 57,683 (31.6%) | $100,683 |
| 45 to 64 Years | 74,819 (41.0%) | $117,668 |
| 65+ Years | 45,440 (24.9%) | $65,938 |
| Total | 182,319 (100.0%) | $96,400 |
Poverty in Kane County
Income Below Poverty by Sex and Age in Kane County
With 7.2% poverty level for males and 9.4% for females among the residents of Kane County, 5 year old males and 5 year old females are the most vulnerable to poverty, with 523 males (16.3%) and 608 females (17.7%) in their respective age groups living below the poverty level.
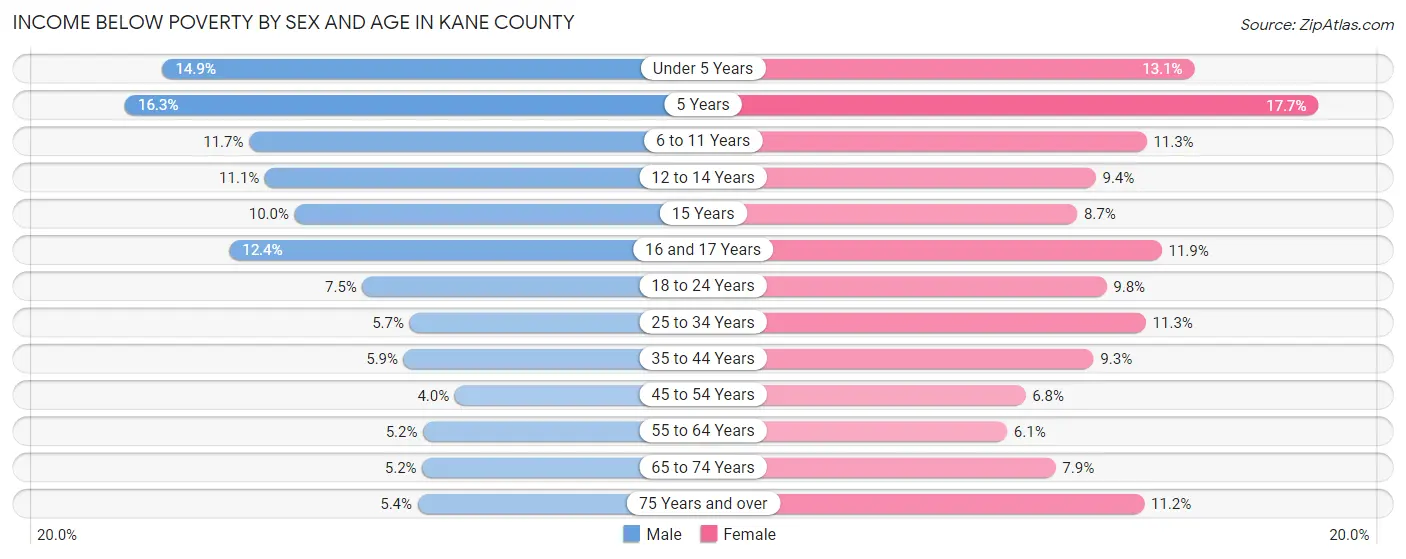
| Age Bracket | Male | Female |
| Under 5 Years | 2,290 (14.9%) | 1,947 (13.1%) |
| 5 Years | 523 (16.3%) | 608 (17.7%) |
| 6 to 11 Years | 2,421 (11.7%) | 2,208 (11.3%) |
| 12 to 14 Years | 1,350 (11.1%) | 1,070 (9.4%) |
| 15 Years | 411 (10.0%) | 314 (8.7%) |
| 16 and 17 Years | 1,037 (12.4%) | 982 (11.9%) |
| 18 to 24 Years | 1,788 (7.4%) | 2,255 (9.8%) |
| 25 to 34 Years | 1,774 (5.7%) | 3,355 (11.3%) |
| 35 to 44 Years | 2,068 (5.9%) | 3,116 (9.3%) |
| 45 to 54 Years | 1,436 (4.0%) | 2,372 (6.8%) |
| 55 to 64 Years | 1,713 (5.2%) | 2,012 (6.1%) |
| 65 to 74 Years | 1,114 (5.2%) | 1,856 (7.9%) |
| 75 Years and over | 640 (5.4%) | 1,898 (11.2%) |
| Total | 18,565 (7.2%) | 23,993 (9.4%) |
Income Above Poverty by Sex and Age in Kane County
According to the poverty statistics in Kane County, males aged 45 to 54 years and females aged 55 to 64 years are the age groups that are most secure financially, with 96.0% of males and 93.9% of females in these age groups living above the poverty line.
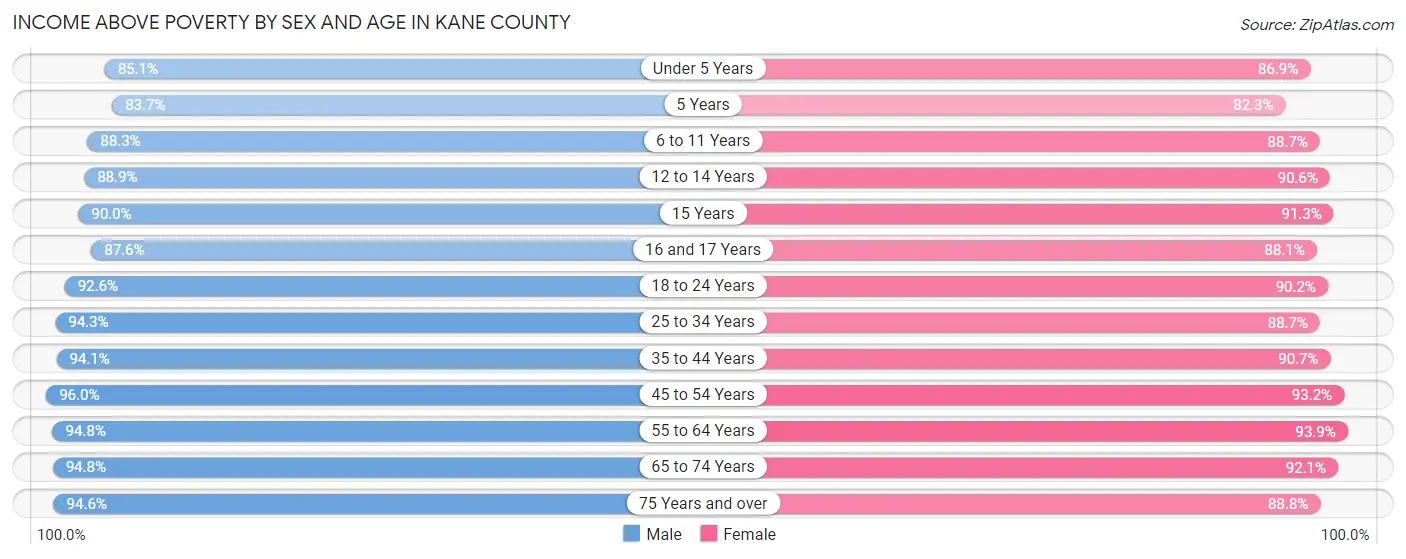
| Age Bracket | Male | Female |
| Under 5 Years | 13,104 (85.1%) | 12,922 (86.9%) |
| 5 Years | 2,692 (83.7%) | 2,829 (82.3%) |
| 6 to 11 Years | 18,336 (88.3%) | 17,311 (88.7%) |
| 12 to 14 Years | 10,849 (88.9%) | 10,288 (90.6%) |
| 15 Years | 3,711 (90.0%) | 3,281 (91.3%) |
| 16 and 17 Years | 7,327 (87.6%) | 7,292 (88.1%) |
| 18 to 24 Years | 22,200 (92.5%) | 20,711 (90.2%) |
| 25 to 34 Years | 29,364 (94.3%) | 26,394 (88.7%) |
| 35 to 44 Years | 32,888 (94.1%) | 30,238 (90.7%) |
| 45 to 54 Years | 34,283 (96.0%) | 32,472 (93.2%) |
| 55 to 64 Years | 31,220 (94.8%) | 30,802 (93.9%) |
| 65 to 74 Years | 20,184 (94.8%) | 21,548 (92.1%) |
| 75 Years and over | 11,222 (94.6%) | 15,016 (88.8%) |
| Total | 237,380 (92.7%) | 231,104 (90.6%) |
Income Below Poverty Among Married-Couple Families in Kane County
The poverty statistics for married-couple families in Kane County show that 3.1% or 3,119 of the total 100,801 families live below the poverty line. Families with 5 or more children have the highest poverty rate of 25.9%, comprising of 119 families. On the other hand, families with no children have the lowest poverty rate of 1.8%, which includes 989 families.
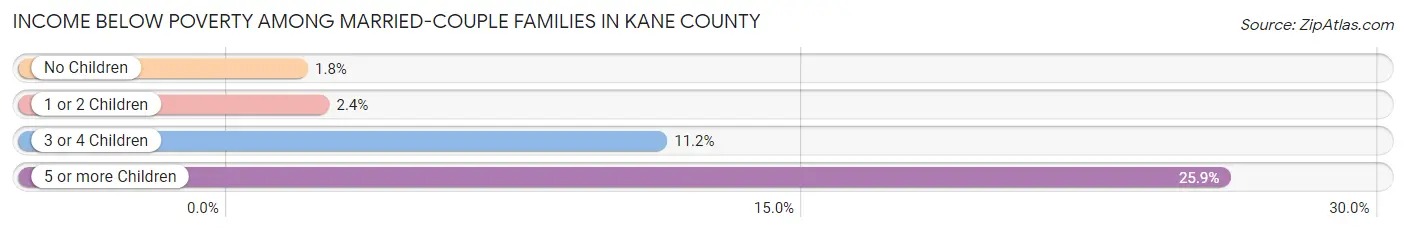
| Children | Above Poverty | Below Poverty |
| No Children | 53,046 (98.2%) | 989 (1.8%) |
| 1 or 2 Children | 35,202 (97.6%) | 863 (2.4%) |
| 3 or 4 Children | 9,094 (88.8%) | 1,148 (11.2%) |
| 5 or more Children | 340 (74.1%) | 119 (25.9%) |
| Total | 97,682 (96.9%) | 3,119 (3.1%) |
Income Below Poverty Among Single-Parent Households in Kane County
According to the poverty data in Kane County, 7.6% or 807 single-father households and 20.2% or 4,180 single-mother households are living below the poverty line. Among single-father households, those with 1 or 2 children have the highest poverty rate, with 510 households (11.0%) experiencing poverty. Likewise, among single-mother households, those with 5 or more children have the highest poverty rate, with 183 households (52.6%) falling below the poverty line.
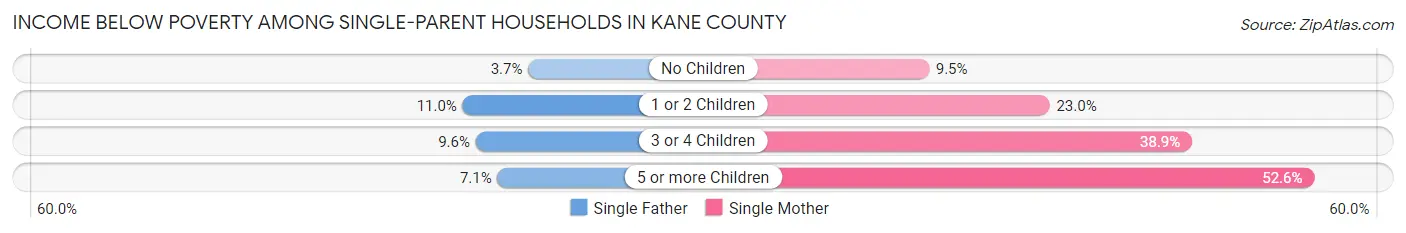
| Children | Single Father | Single Mother |
| No Children | 173 (3.7%) | 757 (9.5%) |
| 1 or 2 Children | 510 (11.0%) | 2,304 (23.0%) |
| 3 or 4 Children | 116 (9.6%) | 936 (38.9%) |
| 5 or more Children | 8 (7.1%) | 183 (52.6%) |
| Total | 807 (7.6%) | 4,180 (20.2%) |
Income Below Poverty Among Married-Couple vs Single-Parent Households in Kane County
The poverty data for Kane County shows that 3,119 of the married-couple family households (3.1%) and 4,987 of the single-parent households (15.9%) are living below the poverty level. Within the married-couple family households, those with 5 or more children have the highest poverty rate, with 119 households (25.9%) falling below the poverty line. Among the single-parent households, those with 5 or more children have the highest poverty rate, with 191 household (41.5%) living below poverty.
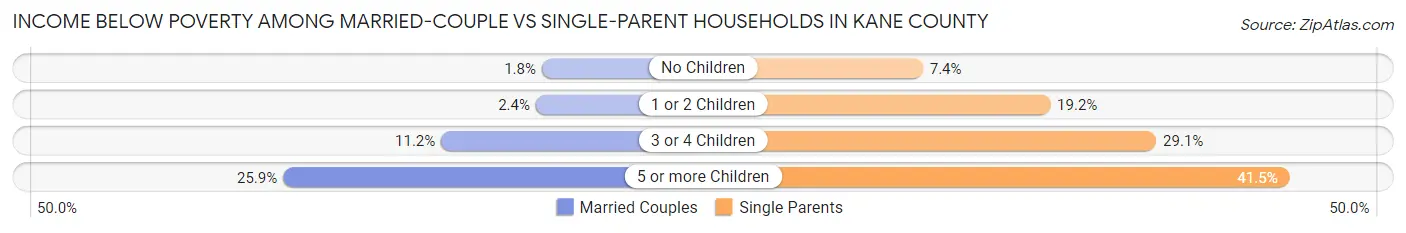
| Children | Married-Couple Families | Single-Parent Households |
| No Children | 989 (1.8%) | 930 (7.4%) |
| 1 or 2 Children | 863 (2.4%) | 2,814 (19.2%) |
| 3 or 4 Children | 1,148 (11.2%) | 1,052 (29.1%) |
| 5 or more Children | 119 (25.9%) | 191 (41.5%) |
| Total | 3,119 (3.1%) | 4,987 (15.9%) |
Employment Characteristics in Kane County
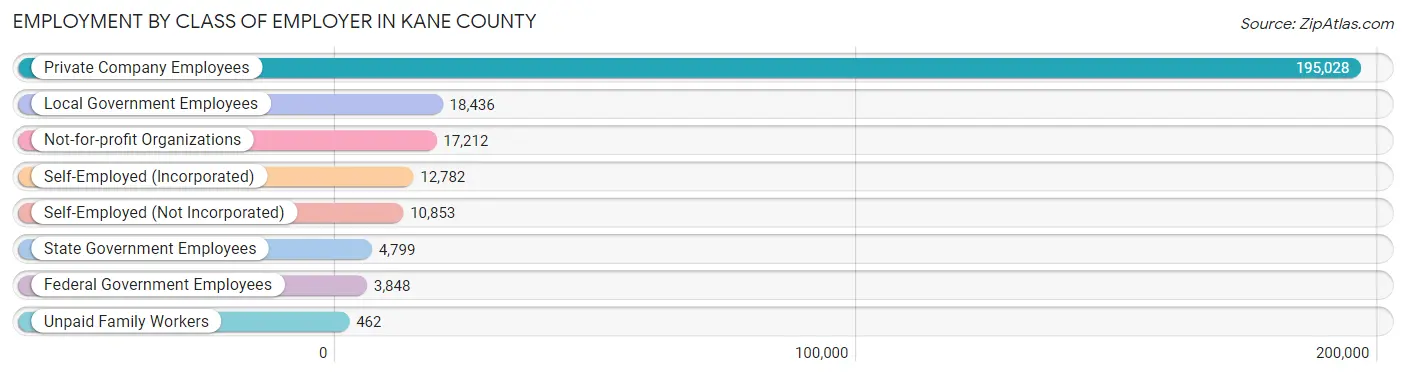
Employment by Class of Employer in Kane County
Among the 263,420 employed individuals in Kane County, private company employees (195,028 | 74.0%), local government employees (18,436 | 7.0%), and not-for-profit organizations (17,212 | 6.5%) make up the most common classes of employment.
| Employer Class | # Employees | % Employees |
| Private Company Employees | 195,028 | 74.0% |
| Self-Employed (Incorporated) | 12,782 | 4.9% |
| Self-Employed (Not Incorporated) | 10,853 | 4.1% |
| Not-for-profit Organizations | 17,212 | 6.5% |
| Local Government Employees | 18,436 | 7.0% |
| State Government Employees | 4,799 | 1.8% |
| Federal Government Employees | 3,848 | 1.5% |
| Unpaid Family Workers | 462 | 0.2% |
| Total | 263,420 | 100.0% |
Employment Status by Age in Kane County
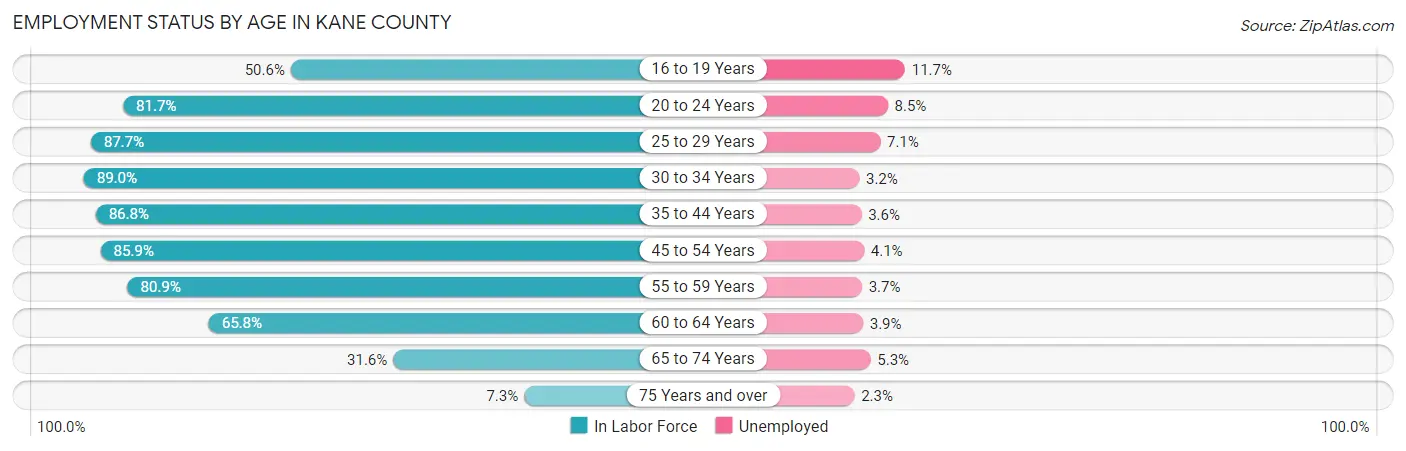
According to the labor force statistics for Kane County, out of the total population over 16 years of age (406,856), 69.6% or 283,172 individuals are in the labor force, with 5.0% or 14,159 of them unemployed. The age group with the highest labor force participation rate is 30 to 34 years, with 89.0% or 27,470 individuals in the labor force. Within the labor force, the 16 to 19 years age range has the highest percentage of unemployed individuals, with 11.7% or 1,841 of them being unemployed.
| Age Bracket | In Labor Force | Unemployed |
| 16 to 19 Years | 15,739 (50.6%) | 1,841 (11.7%) |
| 20 to 24 Years | 27,620 (81.7%) | 2,348 (8.5%) |
| 25 to 29 Years | 26,548 (87.7%) | 1,885 (7.1%) |
| 30 to 34 Years | 27,470 (89.0%) | 879 (3.2%) |
| 35 to 44 Years | 59,544 (86.8%) | 2,144 (3.6%) |
| 45 to 54 Years | 60,808 (85.9%) | 2,493 (4.1%) |
| 55 to 59 Years | 28,768 (80.9%) | 1,064 (3.7%) |
| 60 to 64 Years | 20,165 (65.8%) | 786 (3.9%) |
| 65 to 74 Years | 14,295 (31.6%) | 758 (5.3%) |
| 75 Years and over | 2,188 (7.3%) | 50 (2.3%) |
| Total | 283,172 (69.6%) | 14,159 (5.0%) |
Employment Status by Educational Attainment in Kane County
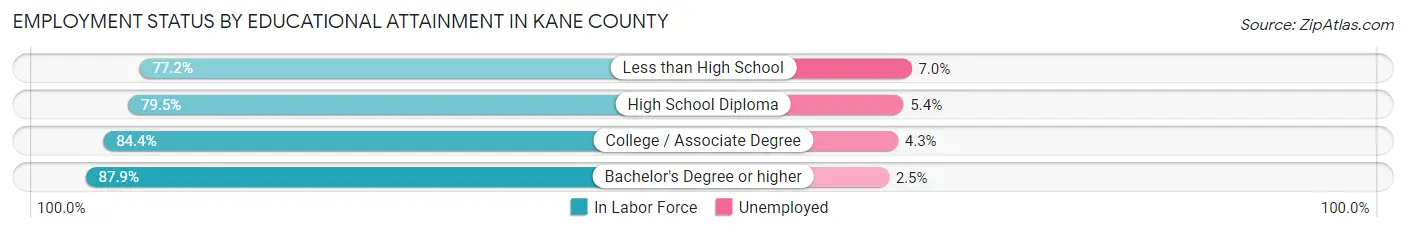
According to labor force statistics for Kane County, 83.7% of individuals (223,253) out of the total population between 25 and 64 years of age (266,730) are in the labor force, with 4.1% or 9,153 of them being unemployed. The group with the highest labor force participation rate are those with the educational attainment of bachelor's degree or higher, with 87.9% or 88,667 individuals in the labor force. Within the labor force, individuals with less than high school education have the highest percentage of unemployment, with 7.0% or 1,977 of them being unemployed.
| Educational Attainment | In Labor Force | Unemployed |
| Less than High School | 28,244 (77.2%) | 2,561 (7.0%) |
| High School Diploma | 43,828 (79.5%) | 2,977 (5.4%) |
| College / Associate Degree | 62,576 (84.4%) | 3,188 (4.3%) |
| Bachelor's Degree or higher | 88,667 (87.9%) | 2,522 (2.5%) |
| Total | 223,253 (83.7%) | 10,936 (4.1%) |
Employment Occupations by Sex in Kane County
Management, Business, Science and Arts Occupations
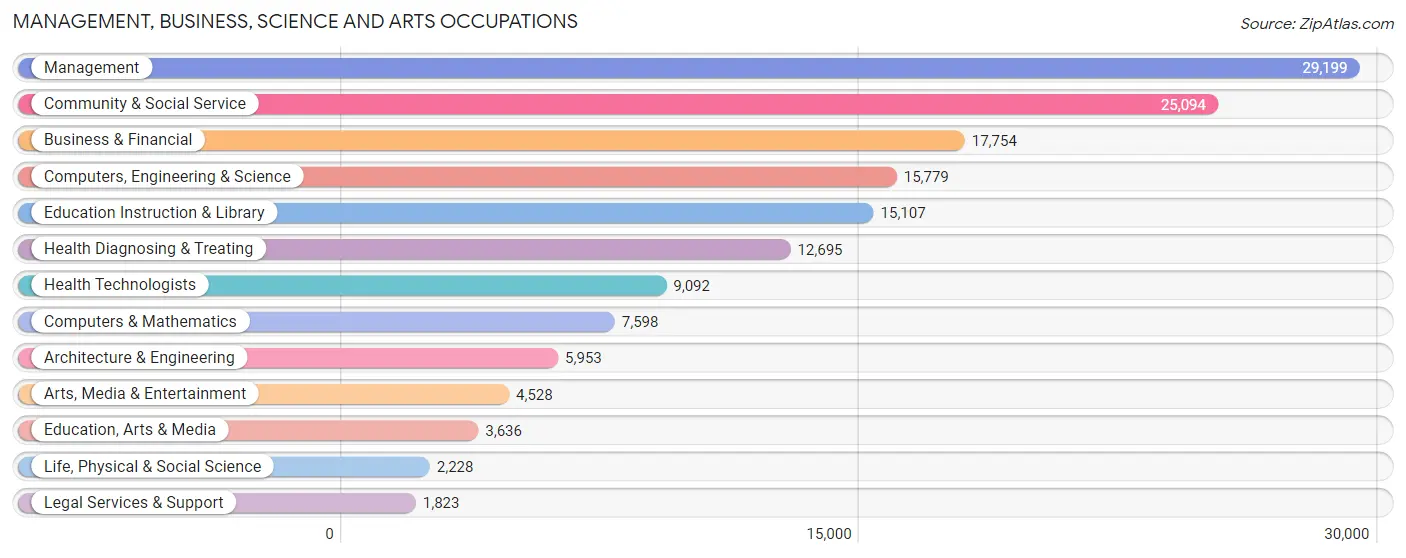
The most common Management, Business, Science and Arts occupations in Kane County are Management (29,199 | 10.9%), Community & Social Service (25,094 | 9.3%), Business & Financial (17,754 | 6.6%), Computers, Engineering & Science (15,779 | 5.9%), and Education Instruction & Library (15,107 | 5.6%).
Management, Business, Science and Arts Occupations by Sex
Within the Management, Business, Science and Arts occupations in Kane County, the most male-oriented occupations are Architecture & Engineering (86.0%), Computers, Engineering & Science (78.1%), and Computers & Mathematics (77.8%), while the most female-oriented occupations are Health Technologists (79.8%), Health Diagnosing & Treating (79.0%), and Education Instruction & Library (75.9%).
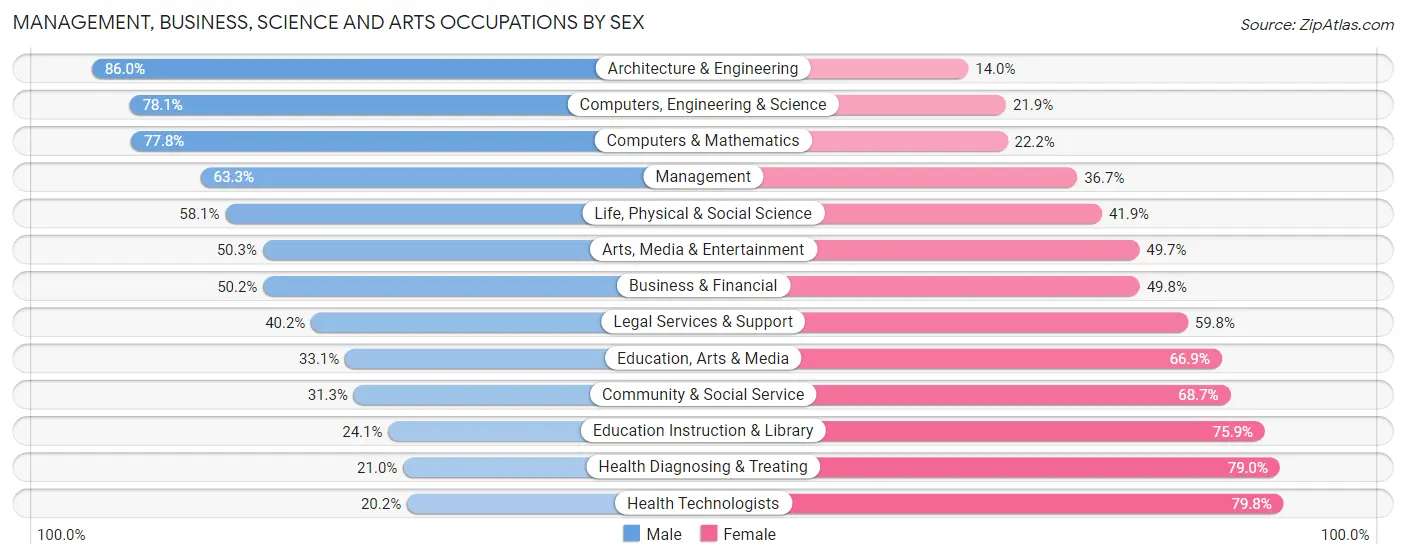
| Occupation | Male | Female |
| Management | 18,475 (63.3%) | 10,724 (36.7%) |
| Business & Financial | 8,917 (50.2%) | 8,837 (49.8%) |
| Computers, Engineering & Science | 12,326 (78.1%) | 3,453 (21.9%) |
| Computers & Mathematics | 5,912 (77.8%) | 1,686 (22.2%) |
| Architecture & Engineering | 5,119 (86.0%) | 834 (14.0%) |
| Life, Physical & Social Science | 1,295 (58.1%) | 933 (41.9%) |
| Community & Social Service | 7,863 (31.3%) | 17,231 (68.7%) |
| Education, Arts & Media | 1,205 (33.1%) | 2,431 (66.9%) |
| Legal Services & Support | 733 (40.2%) | 1,090 (59.8%) |
| Education Instruction & Library | 3,646 (24.1%) | 11,461 (75.9%) |
| Arts, Media & Entertainment | 2,279 (50.3%) | 2,249 (49.7%) |
| Health Diagnosing & Treating | 2,670 (21.0%) | 10,025 (79.0%) |
| Health Technologists | 1,839 (20.2%) | 7,253 (79.8%) |
| Total (Category) | 50,251 (50.0%) | 50,270 (50.0%) |
| Total (Overall) | 144,861 (53.9%) | 123,922 (46.1%) |
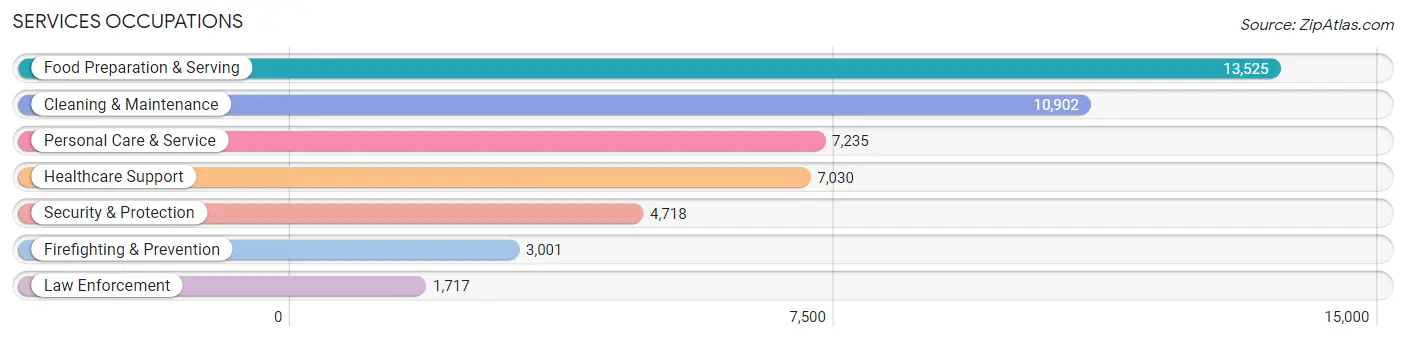
Services Occupations
The most common Services occupations in Kane County are Food Preparation & Serving (13,525 | 5.0%), Cleaning & Maintenance (10,902 | 4.1%), Personal Care & Service (7,235 | 2.7%), Healthcare Support (7,030 | 2.6%), and Security & Protection (4,718 | 1.8%).
Services Occupations by Sex
Within the Services occupations in Kane County, the most male-oriented occupations are Law Enforcement (79.8%), Security & Protection (77.3%), and Firefighting & Prevention (75.9%), while the most female-oriented occupations are Healthcare Support (88.9%), Personal Care & Service (78.3%), and Food Preparation & Serving (57.0%).
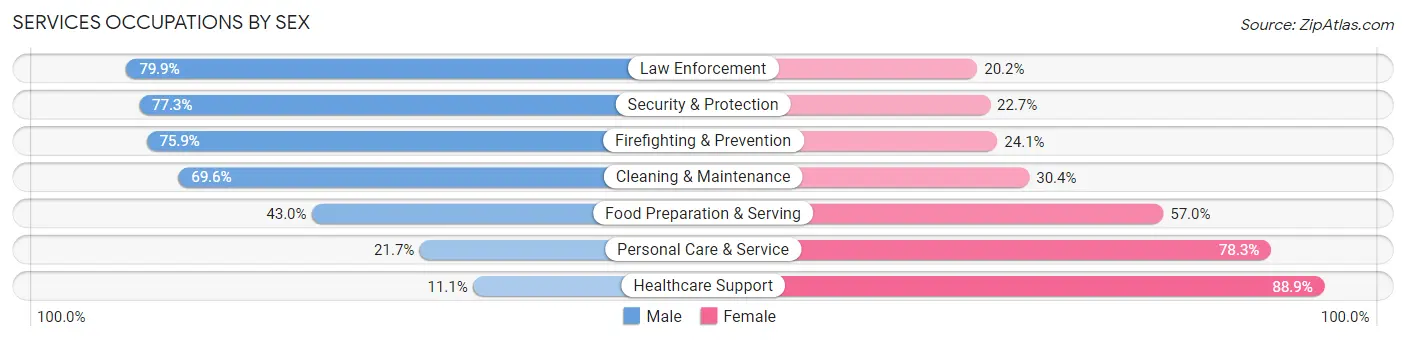
| Occupation | Male | Female |
| Healthcare Support | 780 (11.1%) | 6,250 (88.9%) |
| Security & Protection | 3,648 (77.3%) | 1,070 (22.7%) |
| Firefighting & Prevention | 2,277 (75.9%) | 724 (24.1%) |
| Law Enforcement | 1,371 (79.8%) | 346 (20.2%) |
| Food Preparation & Serving | 5,818 (43.0%) | 7,707 (57.0%) |
| Cleaning & Maintenance | 7,583 (69.6%) | 3,319 (30.4%) |
| Personal Care & Service | 1,568 (21.7%) | 5,667 (78.3%) |
| Total (Category) | 19,397 (44.7%) | 24,013 (55.3%) |
| Total (Overall) | 144,861 (53.9%) | 123,922 (46.1%) |
Sales and Office Occupations
The most common Sales and Office occupations in Kane County are Office & Administration (30,935 | 11.5%), and Sales & Related (29,165 | 10.8%).

Sales and Office Occupations by Sex

| Occupation | Male | Female |
| Sales & Related | 15,983 (54.8%) | 13,182 (45.2%) |
| Office & Administration | 8,098 (26.2%) | 22,837 (73.8%) |
| Total (Category) | 24,081 (40.1%) | 36,019 (59.9%) |
| Total (Overall) | 144,861 (53.9%) | 123,922 (46.1%) |
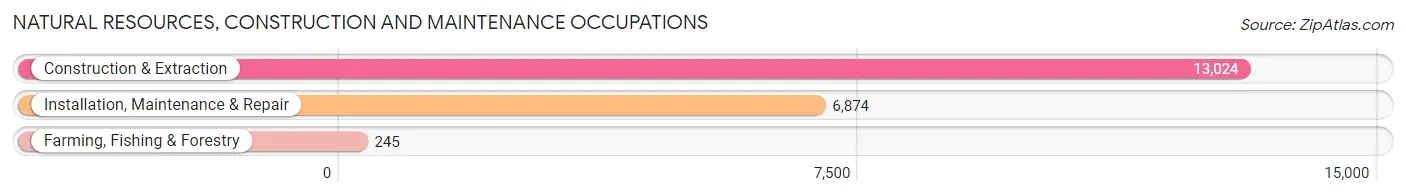
Natural Resources, Construction and Maintenance Occupations
The most common Natural Resources, Construction and Maintenance occupations in Kane County are Construction & Extraction (13,024 | 4.9%), Installation, Maintenance & Repair (6,874 | 2.6%), and Farming, Fishing & Forestry (245 | 0.1%).
Natural Resources, Construction and Maintenance Occupations by Sex
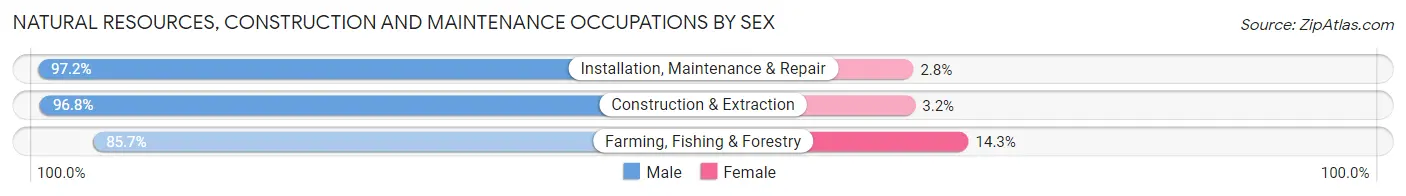
| Occupation | Male | Female |
| Farming, Fishing & Forestry | 210 (85.7%) | 35 (14.3%) |
| Construction & Extraction | 12,606 (96.8%) | 418 (3.2%) |
| Installation, Maintenance & Repair | 6,680 (97.2%) | 194 (2.8%) |
| Total (Category) | 19,496 (96.8%) | 647 (3.2%) |
| Total (Overall) | 144,861 (53.9%) | 123,922 (46.1%) |
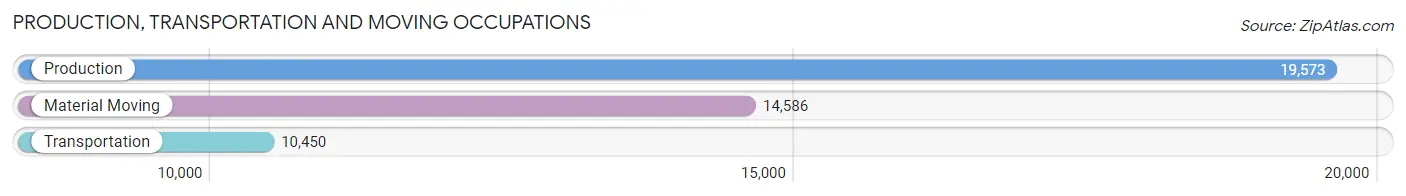
Production, Transportation and Moving Occupations
The most common Production, Transportation and Moving occupations in Kane County are Production (19,573 | 7.3%), Material Moving (14,586 | 5.4%), and Transportation (10,450 | 3.9%).
Production, Transportation and Moving Occupations by Sex
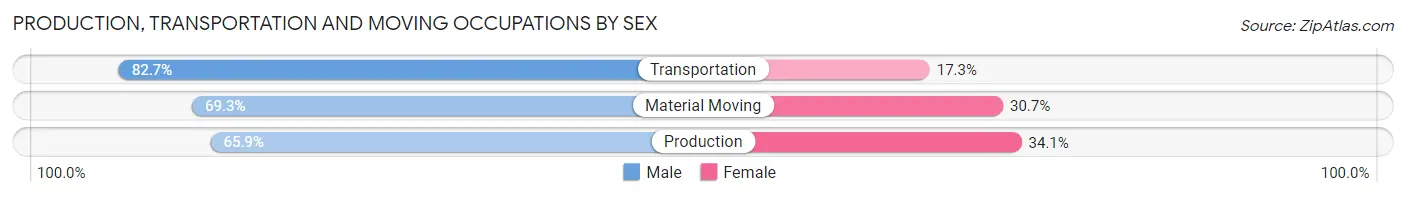
| Occupation | Male | Female |
| Production | 12,891 (65.9%) | 6,682 (34.1%) |
| Transportation | 8,642 (82.7%) | 1,808 (17.3%) |
| Material Moving | 10,103 (69.3%) | 4,483 (30.7%) |
| Total (Category) | 31,636 (70.9%) | 12,973 (29.1%) |
| Total (Overall) | 144,861 (53.9%) | 123,922 (46.1%) |
Employment Industries by Sex in Kane County
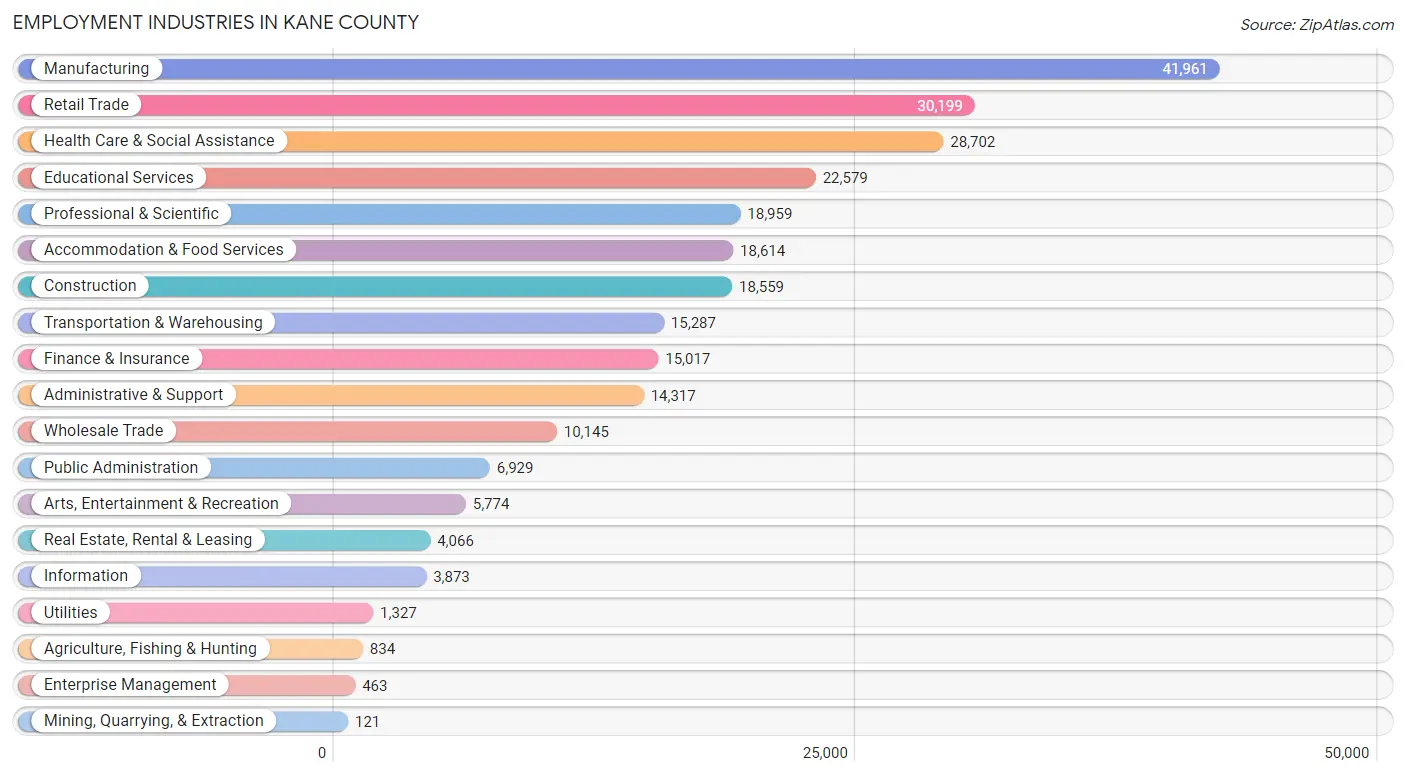
Employment Industries in Kane County
The major employment industries in Kane County include Manufacturing (41,961 | 15.6%), Retail Trade (30,199 | 11.2%), Health Care & Social Assistance (28,702 | 10.7%), Educational Services (22,579 | 8.4%), and Professional & Scientific (18,959 | 7.0%).
Employment Industries by Sex in Kane County
The Kane County industries that see more men than women are Mining, Quarrying, & Extraction (91.7%), Construction (88.9%), and Utilities (81.3%), whereas the industries that tend to have a higher number of women are Health Care & Social Assistance (79.9%), Educational Services (68.8%), and Accommodation & Food Services (56.4%).
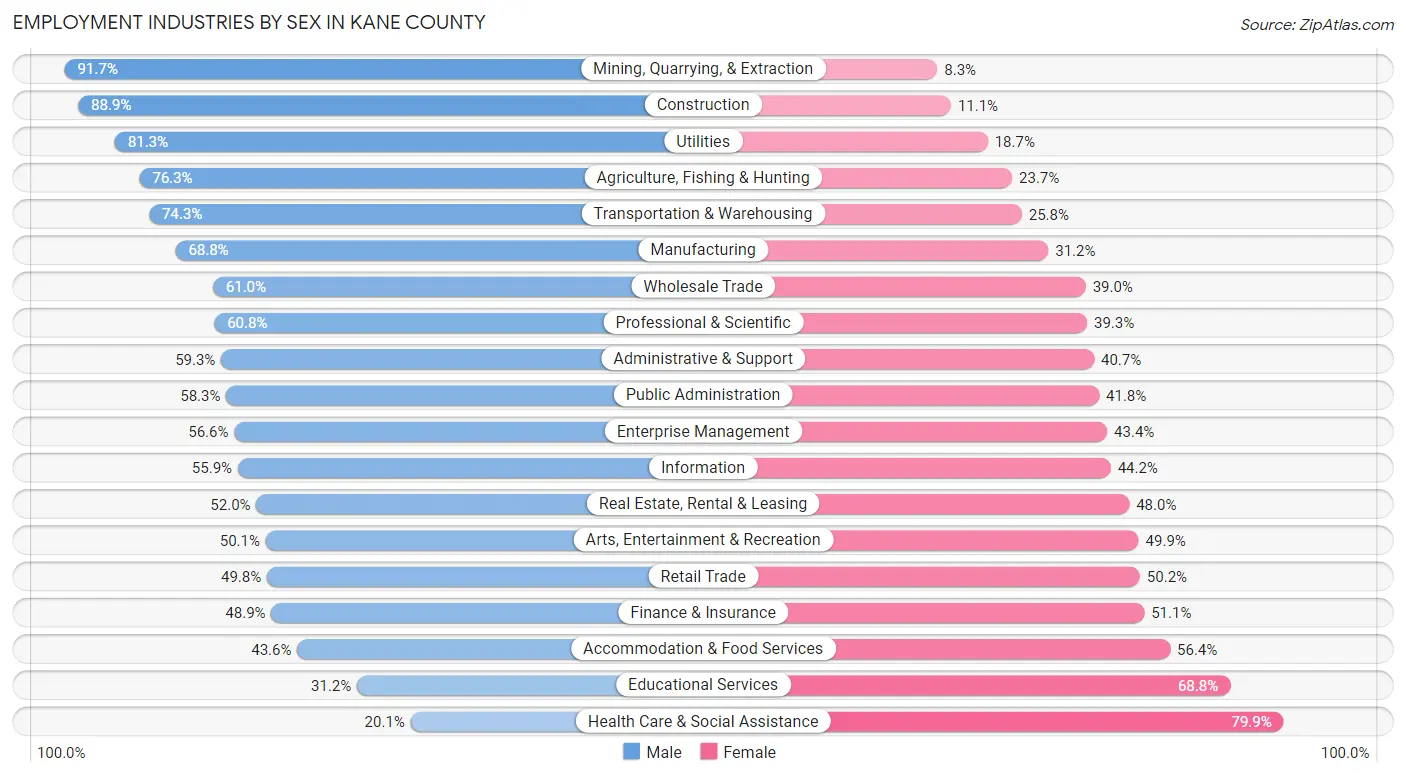
| Industry | Male | Female |
| Agriculture, Fishing & Hunting | 636 (76.3%) | 198 (23.7%) |
| Mining, Quarrying, & Extraction | 111 (91.7%) | 10 (8.3%) |
| Construction | 16,503 (88.9%) | 2,056 (11.1%) |
| Manufacturing | 28,856 (68.8%) | 13,105 (31.2%) |
| Wholesale Trade | 6,192 (61.0%) | 3,953 (39.0%) |
| Retail Trade | 15,043 (49.8%) | 15,156 (50.2%) |
| Transportation & Warehousing | 11,350 (74.3%) | 3,937 (25.8%) |
| Utilities | 1,079 (81.3%) | 248 (18.7%) |
| Information | 2,163 (55.8%) | 1,710 (44.2%) |
| Finance & Insurance | 7,345 (48.9%) | 7,672 (51.1%) |
| Real Estate, Rental & Leasing | 2,115 (52.0%) | 1,951 (48.0%) |
| Professional & Scientific | 11,517 (60.8%) | 7,442 (39.3%) |
| Enterprise Management | 262 (56.6%) | 201 (43.4%) |
| Administrative & Support | 8,491 (59.3%) | 5,826 (40.7%) |
| Educational Services | 7,038 (31.2%) | 15,541 (68.8%) |
| Health Care & Social Assistance | 5,765 (20.1%) | 22,937 (79.9%) |
| Arts, Entertainment & Recreation | 2,891 (50.1%) | 2,883 (49.9%) |
| Accommodation & Food Services | 8,108 (43.6%) | 10,506 (56.4%) |
| Public Administration | 4,036 (58.3%) | 2,893 (41.7%) |
| Total | 144,861 (53.9%) | 123,922 (46.1%) |
Education in Kane County
School Enrollment in Kane County
The most common levels of schooling among the 134,790 students in Kane County are high school (32,870 | 24.4%), middle school (31,102 | 23.1%), and elementary school (24,750 | 18.4%).
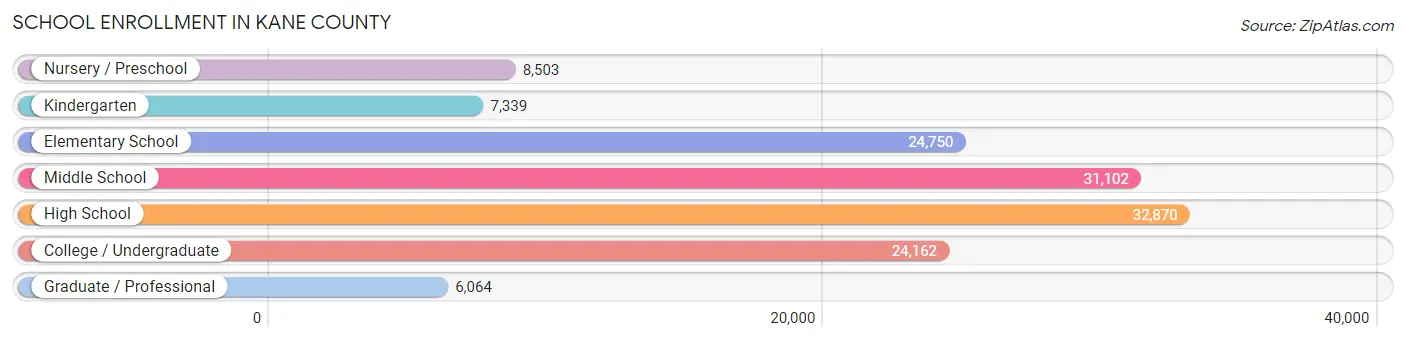
| School Level | # Students | % Students |
| Nursery / Preschool | 8,503 | 6.3% |
| Kindergarten | 7,339 | 5.4% |
| Elementary School | 24,750 | 18.4% |
| Middle School | 31,102 | 23.1% |
| High School | 32,870 | 24.4% |
| College / Undergraduate | 24,162 | 17.9% |
| Graduate / Professional | 6,064 | 4.5% |
| Total | 134,790 | 100.0% |
School Enrollment by Age by Funding Source in Kane County
Out of a total of 134,790 students who are enrolled in schools in Kane County, 19,545 (14.5%) attend a private institution, while the remaining 115,245 (85.5%) are enrolled in public schools. The age group of 35 years and over has the highest likelihood of being enrolled in private schools, with 2,178 (35.6% in the age bracket) enrolled. Conversely, the age group of 10 to 14 year olds has the lowest likelihood of being enrolled in a private school, with 35,759 (93.2% in the age bracket) attending a public institution.
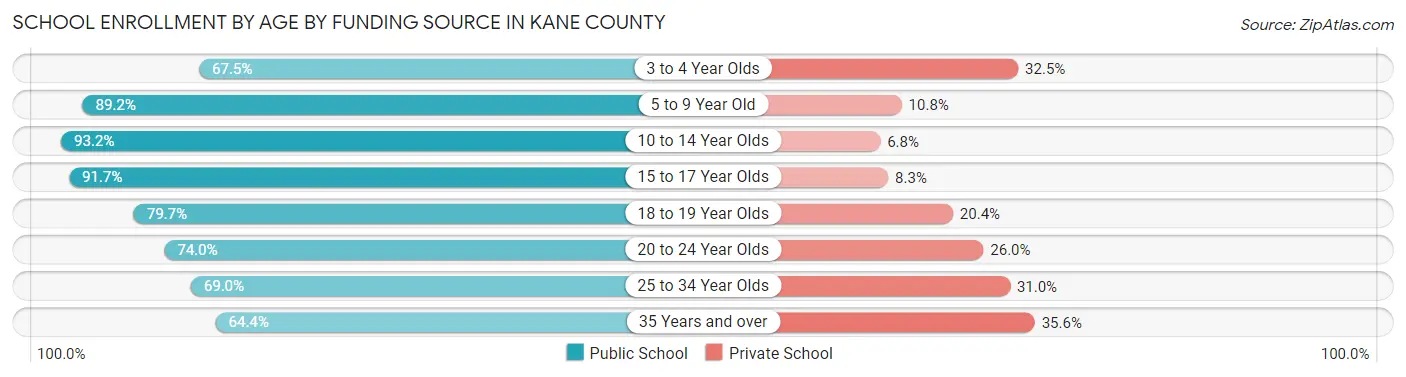
| Age Bracket | Public School | Private School |
| 3 to 4 Year Olds | 4,366 (67.5%) | 2,102 (32.5%) |
| 5 to 9 Year Old | 27,653 (89.2%) | 3,349 (10.8%) |
| 10 to 14 Year Olds | 35,759 (93.2%) | 2,614 (6.8%) |
| 15 to 17 Year Olds | 21,889 (91.7%) | 1,978 (8.3%) |
| 18 to 19 Year Olds | 7,775 (79.6%) | 1,987 (20.3%) |
| 20 to 24 Year Olds | 9,834 (74.0%) | 3,459 (26.0%) |
| 25 to 34 Year Olds | 4,077 (69.0%) | 1,829 (31.0%) |
| 35 Years and over | 3,941 (64.4%) | 2,178 (35.6%) |
| Total | 115,245 (85.5%) | 19,545 (14.5%) |
Educational Attainment by Field of Study in Kane County
Business (29,878 | 22.5%), education (17,362 | 13.1%), science & technology (12,490 | 9.4%), engineering (10,134 | 7.6%), and arts & humanities (8,405 | 6.3%) are the most common fields of study among 132,716 individuals in Kane County who have obtained a bachelor's degree or higher.
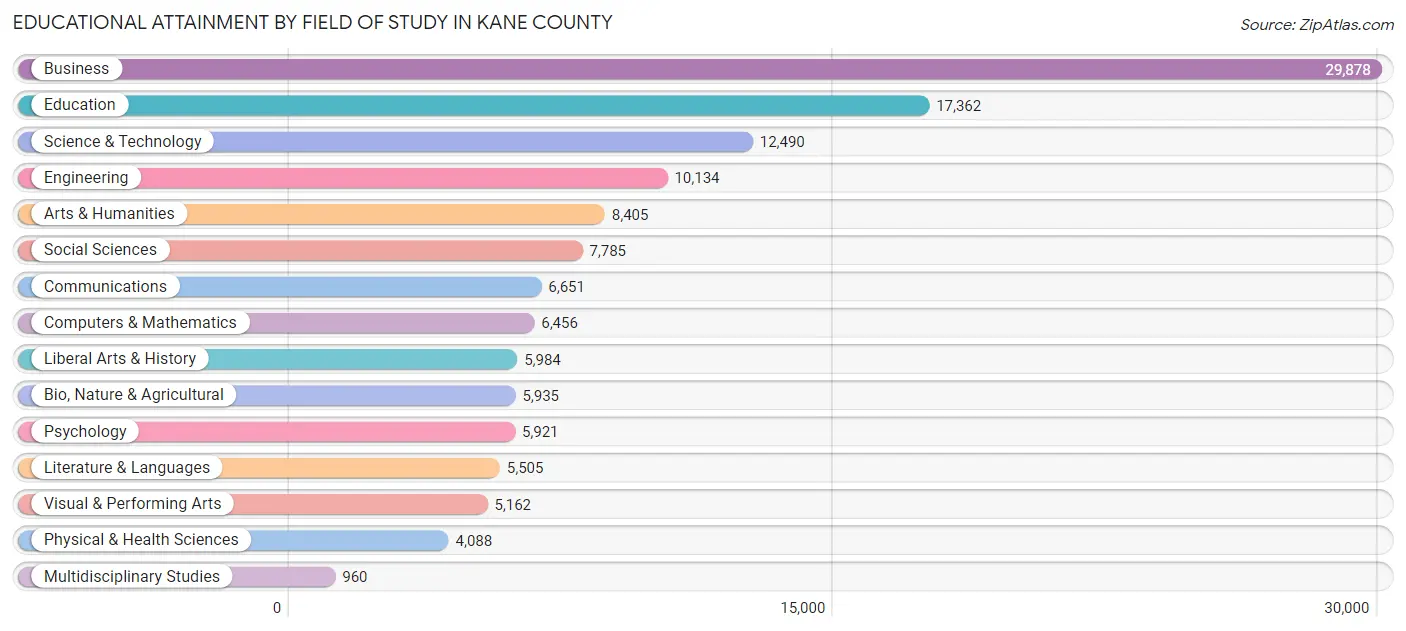
| Field of Study | # Graduates | % Graduates |
| Computers & Mathematics | 6,456 | 4.9% |
| Bio, Nature & Agricultural | 5,935 | 4.5% |
| Physical & Health Sciences | 4,088 | 3.1% |
| Psychology | 5,921 | 4.5% |
| Social Sciences | 7,785 | 5.9% |
| Engineering | 10,134 | 7.6% |
| Multidisciplinary Studies | 960 | 0.7% |
| Science & Technology | 12,490 | 9.4% |
| Business | 29,878 | 22.5% |
| Education | 17,362 | 13.1% |
| Literature & Languages | 5,505 | 4.2% |
| Liberal Arts & History | 5,984 | 4.5% |
| Visual & Performing Arts | 5,162 | 3.9% |
| Communications | 6,651 | 5.0% |
| Arts & Humanities | 8,405 | 6.3% |
| Total | 132,716 | 100.0% |
Transportation & Commute in Kane County
Vehicle Availability by Sex in Kane County
The most prevalent vehicle ownership categories in Kane County are males with 2 vehicles (59,980, accounting for 42.2%) and females with 2 vehicles (49,112, making up 49.8%).

| Vehicles Available | Male | Female |
| No Vehicle | 2,777 (1.9%) | 1,837 (1.5%) |
| 1 Vehicle | 15,952 (11.2%) | 19,208 (15.9%) |
| 2 Vehicles | 59,980 (42.2%) | 49,112 (40.7%) |
| 3 Vehicles | 38,220 (26.9%) | 29,695 (24.6%) |
| 4 Vehicles | 16,430 (11.6%) | 14,284 (11.8%) |
| 5 or more Vehicles | 8,768 (6.2%) | 6,379 (5.3%) |
| Total | 142,127 (100.0%) | 120,515 (100.0%) |
Commute Time in Kane County
The most frequently occuring commute durations in Kane County are 15 to 19 minutes (31,594 commuters, 13.8%), 20 to 24 minutes (29,904 commuters, 13.0%), and 30 to 34 minutes (29,528 commuters, 12.9%).
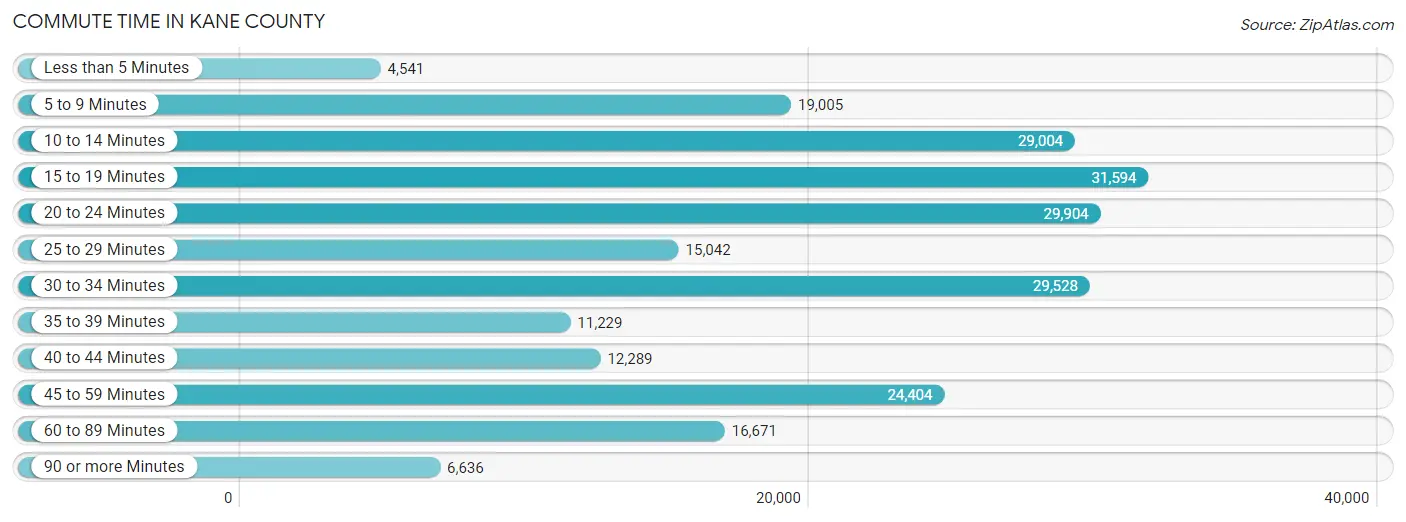
| Commute Time | # Commuters | % Commuters |
| Less than 5 Minutes | 4,541 | 2.0% |
| 5 to 9 Minutes | 19,005 | 8.3% |
| 10 to 14 Minutes | 29,004 | 12.6% |
| 15 to 19 Minutes | 31,594 | 13.8% |
| 20 to 24 Minutes | 29,904 | 13.0% |
| 25 to 29 Minutes | 15,042 | 6.5% |
| 30 to 34 Minutes | 29,528 | 12.9% |
| 35 to 39 Minutes | 11,229 | 4.9% |
| 40 to 44 Minutes | 12,289 | 5.3% |
| 45 to 59 Minutes | 24,404 | 10.6% |
| 60 to 89 Minutes | 16,671 | 7.2% |
| 90 or more Minutes | 6,636 | 2.9% |
Commute Time by Sex in Kane County
The most common commute times in Kane County are 30 to 34 minutes (16,892 commuters, 13.5%) for males and 15 to 19 minutes (15,961 commuters, 15.3%) for females.
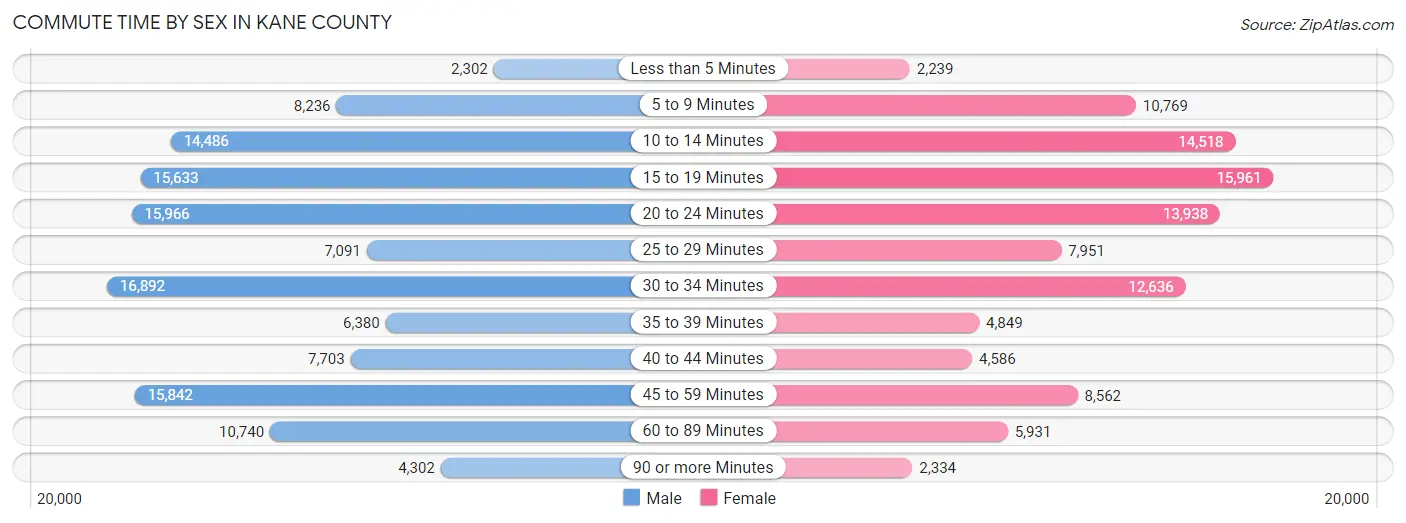
| Commute Time | Male | Female |
| Less than 5 Minutes | 2,302 (1.8%) | 2,239 (2.1%) |
| 5 to 9 Minutes | 8,236 (6.6%) | 10,769 (10.3%) |
| 10 to 14 Minutes | 14,486 (11.5%) | 14,518 (13.9%) |
| 15 to 19 Minutes | 15,633 (12.4%) | 15,961 (15.3%) |
| 20 to 24 Minutes | 15,966 (12.7%) | 13,938 (13.4%) |
| 25 to 29 Minutes | 7,091 (5.7%) | 7,951 (7.6%) |
| 30 to 34 Minutes | 16,892 (13.5%) | 12,636 (12.1%) |
| 35 to 39 Minutes | 6,380 (5.1%) | 4,849 (4.6%) |
| 40 to 44 Minutes | 7,703 (6.1%) | 4,586 (4.4%) |
| 45 to 59 Minutes | 15,842 (12.6%) | 8,562 (8.2%) |
| 60 to 89 Minutes | 10,740 (8.6%) | 5,931 (5.7%) |
| 90 or more Minutes | 4,302 (3.4%) | 2,334 (2.2%) |
Time of Departure to Work by Sex in Kane County
The most frequent times of departure to work in Kane County are 7:00 AM to 7:29 AM (16,935, 13.5%) for males and 7:00 AM to 7:29 AM (16,169, 15.5%) for females.
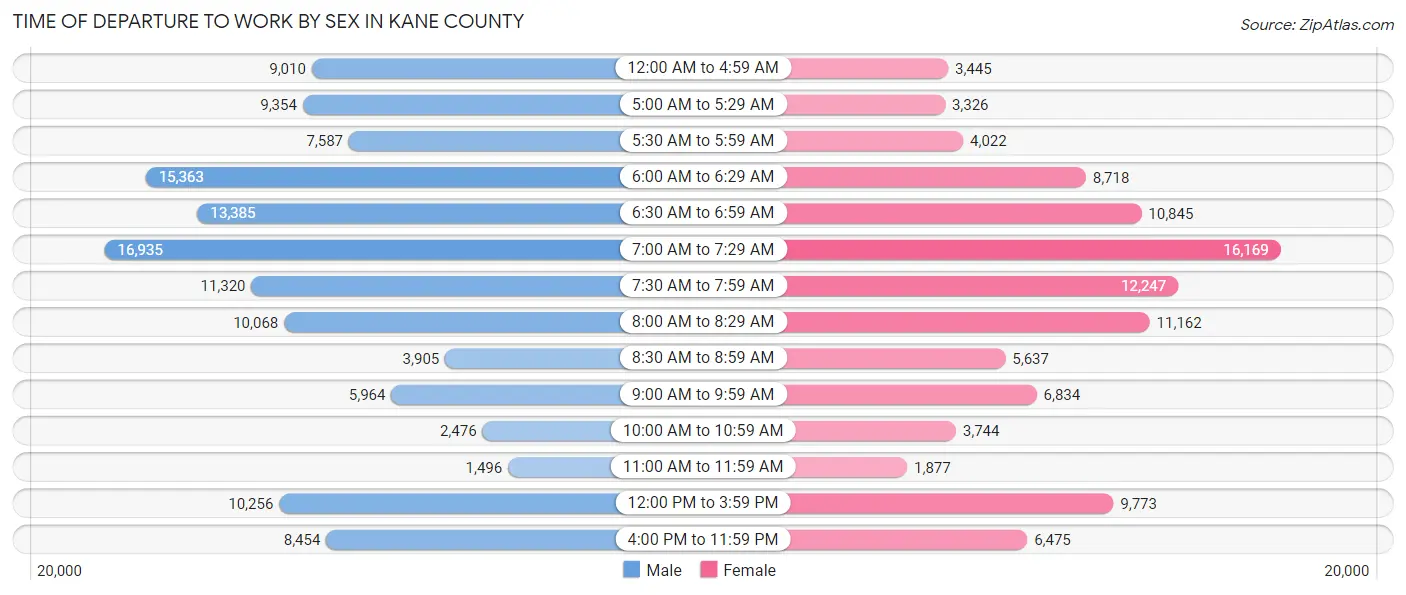
| Time of Departure | Male | Female |
| 12:00 AM to 4:59 AM | 9,010 (7.2%) | 3,445 (3.3%) |
| 5:00 AM to 5:29 AM | 9,354 (7.4%) | 3,326 (3.2%) |
| 5:30 AM to 5:59 AM | 7,587 (6.0%) | 4,022 (3.9%) |
| 6:00 AM to 6:29 AM | 15,363 (12.2%) | 8,718 (8.4%) |
| 6:30 AM to 6:59 AM | 13,385 (10.7%) | 10,845 (10.4%) |
| 7:00 AM to 7:29 AM | 16,935 (13.5%) | 16,169 (15.5%) |
| 7:30 AM to 7:59 AM | 11,320 (9.0%) | 12,247 (11.7%) |
| 8:00 AM to 8:29 AM | 10,068 (8.0%) | 11,162 (10.7%) |
| 8:30 AM to 8:59 AM | 3,905 (3.1%) | 5,637 (5.4%) |
| 9:00 AM to 9:59 AM | 5,964 (4.8%) | 6,834 (6.6%) |
| 10:00 AM to 10:59 AM | 2,476 (2.0%) | 3,744 (3.6%) |
| 11:00 AM to 11:59 AM | 1,496 (1.2%) | 1,877 (1.8%) |
| 12:00 PM to 3:59 PM | 10,256 (8.2%) | 9,773 (9.4%) |
| 4:00 PM to 11:59 PM | 8,454 (6.7%) | 6,475 (6.2%) |
| Total | 125,573 (100.0%) | 104,274 (100.0%) |
Housing Occupancy in Kane County
Occupancy by Ownership in Kane County
Of the total 182,319 dwellings in Kane County, owner-occupied units account for 137,062 (75.2%), while renter-occupied units make up 45,257 (24.8%).
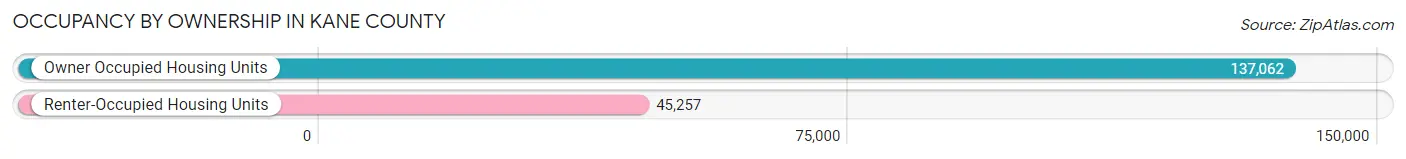
| Occupancy | # Housing Units | % Housing Units |
| Owner Occupied Housing Units | 137,062 | 75.2% |
| Renter-Occupied Housing Units | 45,257 | 24.8% |
| Total Occupied Housing Units | 182,319 | 100.0% |
Occupancy by Household Size in Kane County
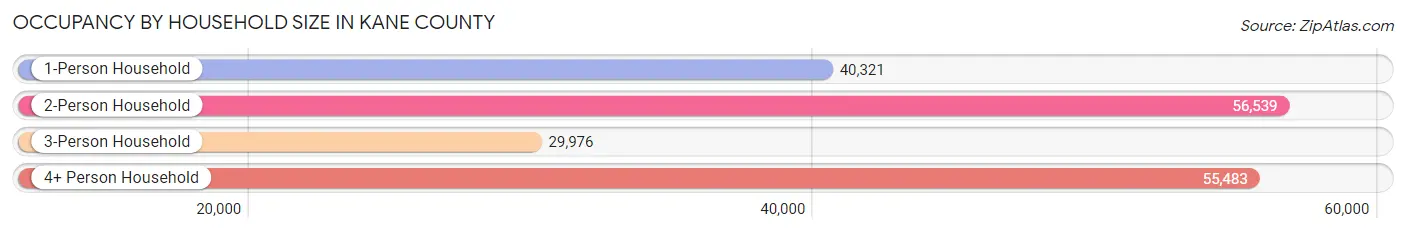
| Household Size | # Housing Units | % Housing Units |
| 1-Person Household | 40,321 | 22.1% |
| 2-Person Household | 56,539 | 31.0% |
| 3-Person Household | 29,976 | 16.4% |
| 4+ Person Household | 55,483 | 30.4% |
| Total Housing Units | 182,319 | 100.0% |
Occupancy by Ownership by Household Size in Kane County
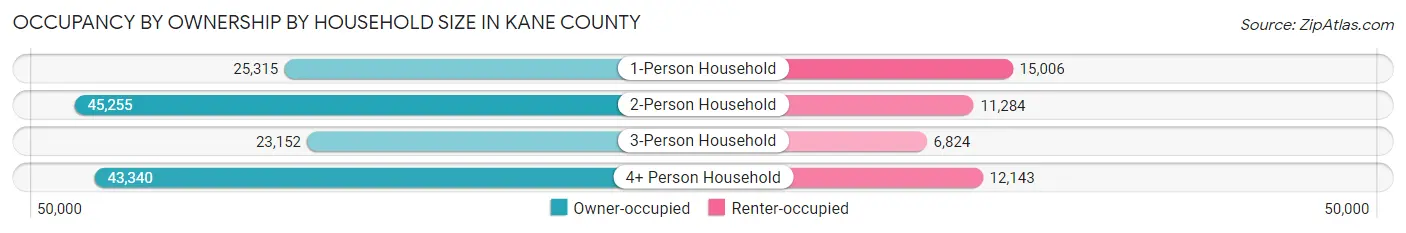
| Household Size | Owner-occupied | Renter-occupied |
| 1-Person Household | 25,315 (62.8%) | 15,006 (37.2%) |
| 2-Person Household | 45,255 (80.0%) | 11,284 (20.0%) |
| 3-Person Household | 23,152 (77.2%) | 6,824 (22.8%) |
| 4+ Person Household | 43,340 (78.1%) | 12,143 (21.9%) |
| Total Housing Units | 137,062 (75.2%) | 45,257 (24.8%) |
Occupancy by Educational Attainment in Kane County
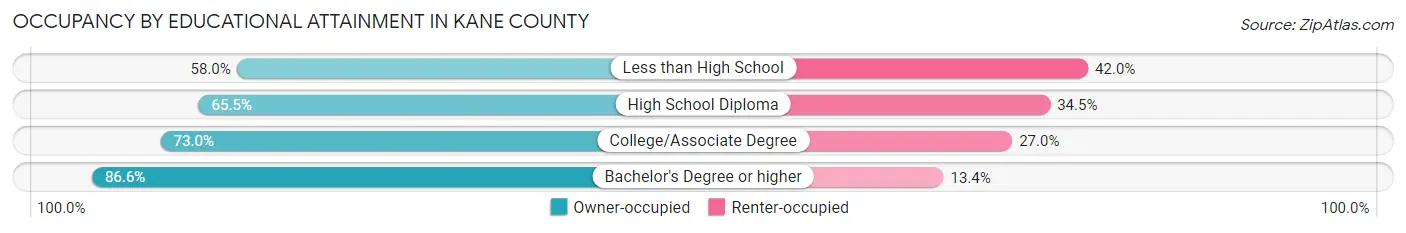
| Household Size | Owner-occupied | Renter-occupied |
| Less than High School | 11,321 (58.0%) | 8,208 (42.0%) |
| High School Diploma | 24,409 (65.5%) | 12,861 (34.5%) |
| College/Associate Degree | 39,789 (73.0%) | 14,701 (27.0%) |
| Bachelor's Degree or higher | 61,543 (86.6%) | 9,487 (13.4%) |
Occupancy by Age of Householder in Kane County
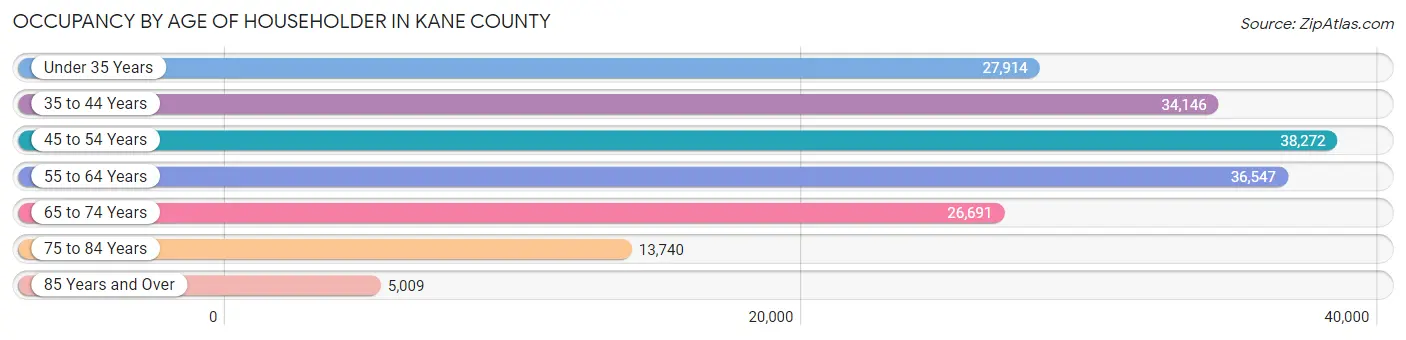
| Age Bracket | # Households | % Households |
| Under 35 Years | 27,914 | 15.3% |
| 35 to 44 Years | 34,146 | 18.7% |
| 45 to 54 Years | 38,272 | 21.0% |
| 55 to 64 Years | 36,547 | 20.1% |
| 65 to 74 Years | 26,691 | 14.6% |
| 75 to 84 Years | 13,740 | 7.5% |
| 85 Years and Over | 5,009 | 2.8% |
| Total | 182,319 | 100.0% |
Housing Finances in Kane County
Median Income by Occupancy in Kane County
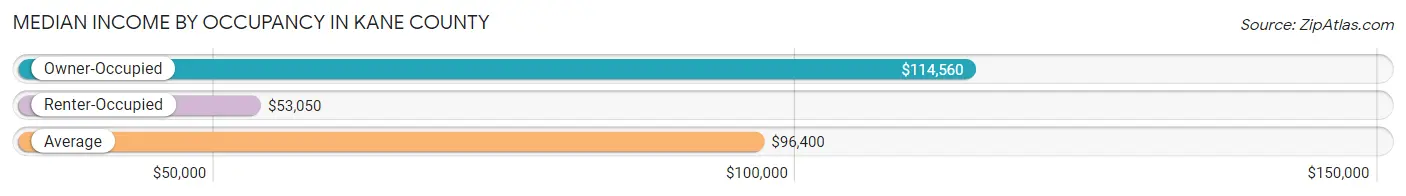
| Occupancy Type | # Households | Median Income |
| Owner-Occupied | 137,062 (75.2%) | $114,560 |
| Renter-Occupied | 45,257 (24.8%) | $53,050 |
| Average | 182,319 (100.0%) | $96,400 |
Occupancy by Householder Income Bracket in Kane County
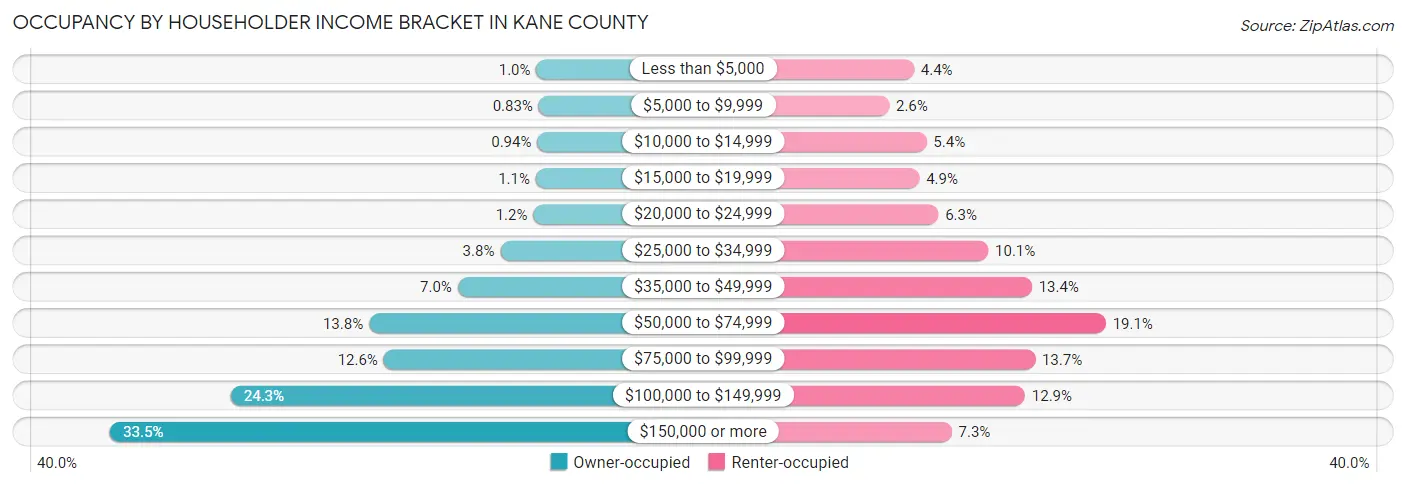
| Income Bracket | Owner-occupied | Renter-occupied |
| Less than $5,000 | 1,389 (1.0%) | 2,008 (4.4%) |
| $5,000 to $9,999 | 1,132 (0.8%) | 1,153 (2.5%) |
| $10,000 to $14,999 | 1,287 (0.9%) | 2,445 (5.4%) |
| $15,000 to $19,999 | 1,445 (1.1%) | 2,193 (4.9%) |
| $20,000 to $24,999 | 1,702 (1.2%) | 2,853 (6.3%) |
| $25,000 to $34,999 | 5,155 (3.8%) | 4,569 (10.1%) |
| $35,000 to $49,999 | 9,597 (7.0%) | 6,075 (13.4%) |
| $50,000 to $74,999 | 18,862 (13.8%) | 8,627 (19.1%) |
| $75,000 to $99,999 | 17,324 (12.6%) | 6,185 (13.7%) |
| $100,000 to $149,999 | 33,280 (24.3%) | 5,837 (12.9%) |
| $150,000 or more | 45,889 (33.5%) | 3,312 (7.3%) |
| Total | 137,062 (100.0%) | 45,257 (100.0%) |
Monthly Housing Cost Tiers in Kane County
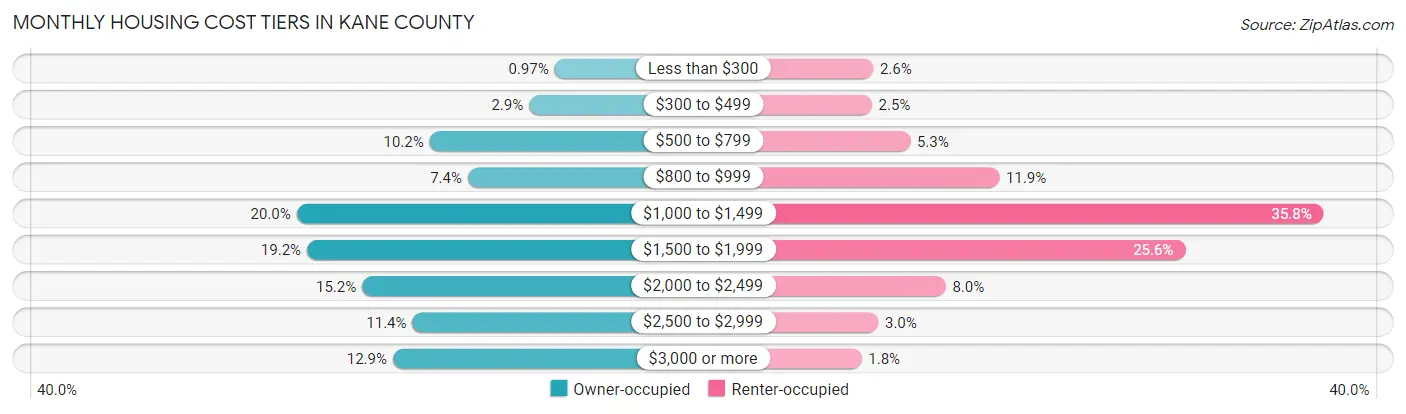
| Monthly Cost | Owner-occupied | Renter-occupied |
| Less than $300 | 1,332 (1.0%) | 1,186 (2.6%) |
| $300 to $499 | 3,907 (2.9%) | 1,142 (2.5%) |
| $500 to $799 | 13,933 (10.2%) | 2,418 (5.3%) |
| $800 to $999 | 10,086 (7.4%) | 5,386 (11.9%) |
| $1,000 to $1,499 | 27,370 (20.0%) | 16,204 (35.8%) |
| $1,500 to $1,999 | 26,335 (19.2%) | 11,591 (25.6%) |
| $2,000 to $2,499 | 20,761 (15.1%) | 3,602 (8.0%) |
| $2,500 to $2,999 | 15,679 (11.4%) | 1,354 (3.0%) |
| $3,000 or more | 17,659 (12.9%) | 795 (1.8%) |
| Total | 137,062 (100.0%) | 45,257 (100.0%) |
Physical Housing Characteristics in Kane County
Housing Structures in Kane County
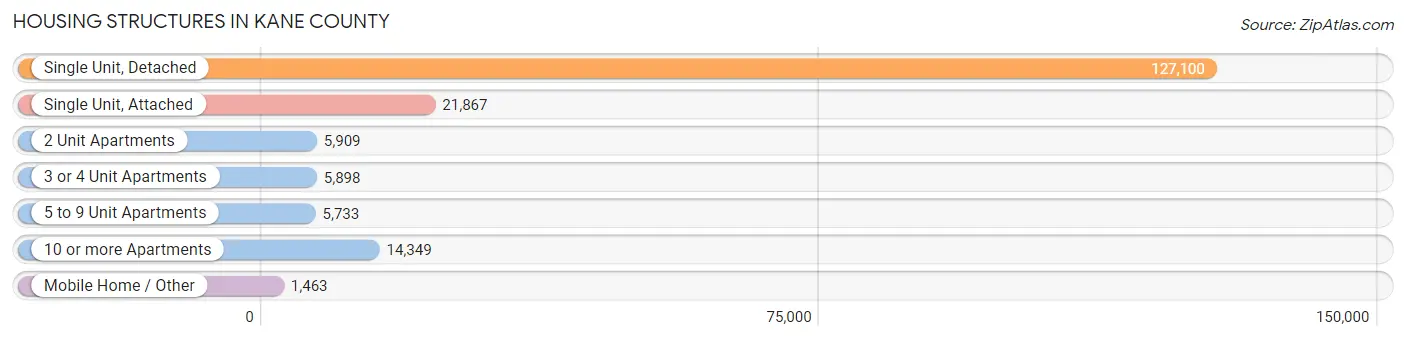
| Structure Type | # Housing Units | % Housing Units |
| Single Unit, Detached | 127,100 | 69.7% |
| Single Unit, Attached | 21,867 | 12.0% |
| 2 Unit Apartments | 5,909 | 3.2% |
| 3 or 4 Unit Apartments | 5,898 | 3.2% |
| 5 to 9 Unit Apartments | 5,733 | 3.1% |
| 10 or more Apartments | 14,349 | 7.9% |
| Mobile Home / Other | 1,463 | 0.8% |
| Total | 182,319 | 100.0% |
Housing Structures by Occupancy in Kane County
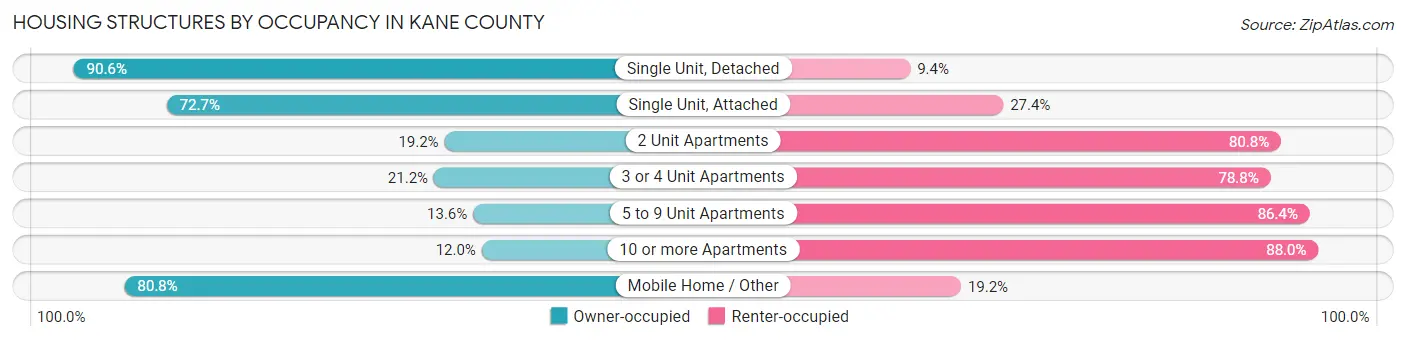
| Structure Type | Owner-occupied | Renter-occupied |
| Single Unit, Detached | 115,108 (90.6%) | 11,992 (9.4%) |
| Single Unit, Attached | 15,887 (72.7%) | 5,980 (27.4%) |
| 2 Unit Apartments | 1,132 (19.2%) | 4,777 (80.8%) |
| 3 or 4 Unit Apartments | 1,250 (21.2%) | 4,648 (78.8%) |
| 5 to 9 Unit Apartments | 782 (13.6%) | 4,951 (86.4%) |
| 10 or more Apartments | 1,721 (12.0%) | 12,628 (88.0%) |
| Mobile Home / Other | 1,182 (80.8%) | 281 (19.2%) |
| Total | 137,062 (75.2%) | 45,257 (24.8%) |
Housing Structures by Number of Rooms in Kane County
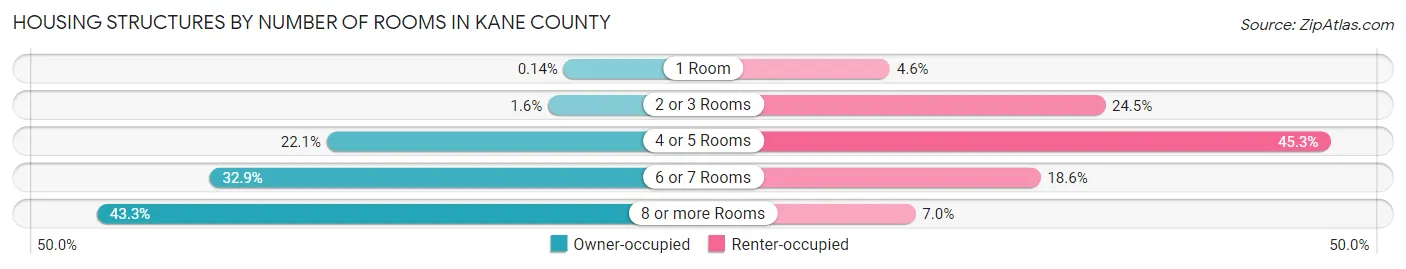
| Number of Rooms | Owner-occupied | Renter-occupied |
| 1 Room | 197 (0.1%) | 2,089 (4.6%) |
| 2 or 3 Rooms | 2,186 (1.6%) | 11,096 (24.5%) |
| 4 or 5 Rooms | 30,221 (22.1%) | 20,518 (45.3%) |
| 6 or 7 Rooms | 45,091 (32.9%) | 8,394 (18.5%) |
| 8 or more Rooms | 59,367 (43.3%) | 3,160 (7.0%) |
| Total | 137,062 (100.0%) | 45,257 (100.0%) |
Housing Structure by Heating Type in Kane County
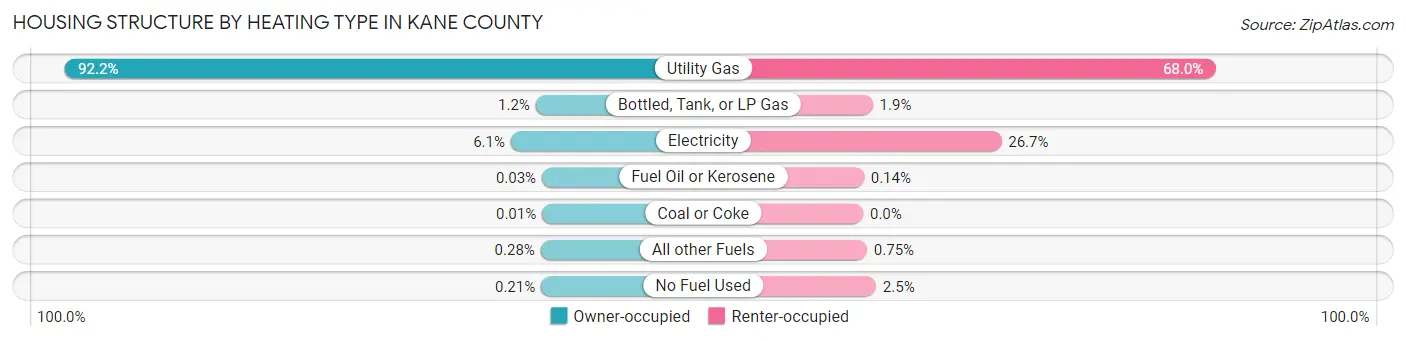
| Heating Type | Owner-occupied | Renter-occupied |
| Utility Gas | 126,320 (92.2%) | 30,793 (68.0%) |
| Bottled, Tank, or LP Gas | 1,700 (1.2%) | 841 (1.9%) |
| Electricity | 8,299 (6.0%) | 12,093 (26.7%) |
| Fuel Oil or Kerosene | 46 (0.0%) | 63 (0.1%) |
| Coal or Coke | 18 (0.0%) | 0 (0.0%) |
| All other Fuels | 385 (0.3%) | 340 (0.7%) |
| No Fuel Used | 294 (0.2%) | 1,127 (2.5%) |
| Total | 137,062 (100.0%) | 45,257 (100.0%) |
Household Vehicle Usage in Kane County
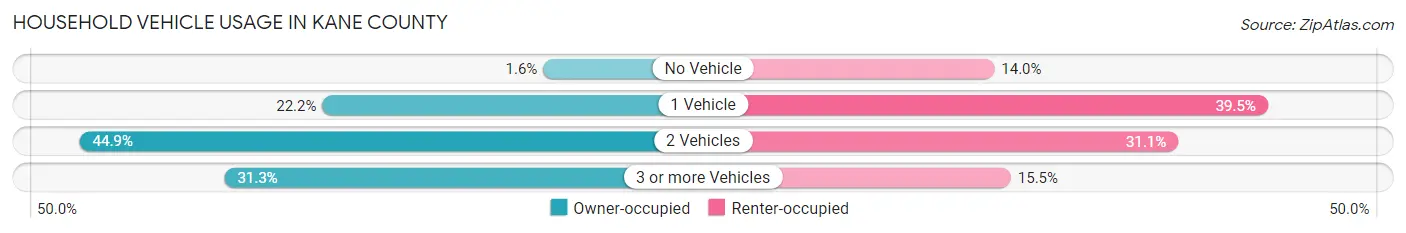
| Vehicles per Household | Owner-occupied | Renter-occupied |
| No Vehicle | 2,184 (1.6%) | 6,314 (14.0%) |
| 1 Vehicle | 30,440 (22.2%) | 17,858 (39.5%) |
| 2 Vehicles | 61,487 (44.9%) | 14,073 (31.1%) |
| 3 or more Vehicles | 42,951 (31.3%) | 7,012 (15.5%) |
| Total | 137,062 (100.0%) | 45,257 (100.0%) |
Real Estate & Mortgages in Kane County
Real Estate and Mortgage Overview in Kane County
| Characteristic | Without Mortgage | With Mortgage |
| Housing Units | 43,127 | 93,935 |
| Median Property Value | $273,000 | $297,800 |
| Median Household Income | $85,728 | $35,914 |
| Monthly Housing Costs | $896 | $17,382 |
| Real Estate Taxes | $6,399 | $870 |
Property Value by Mortgage Status in Kane County
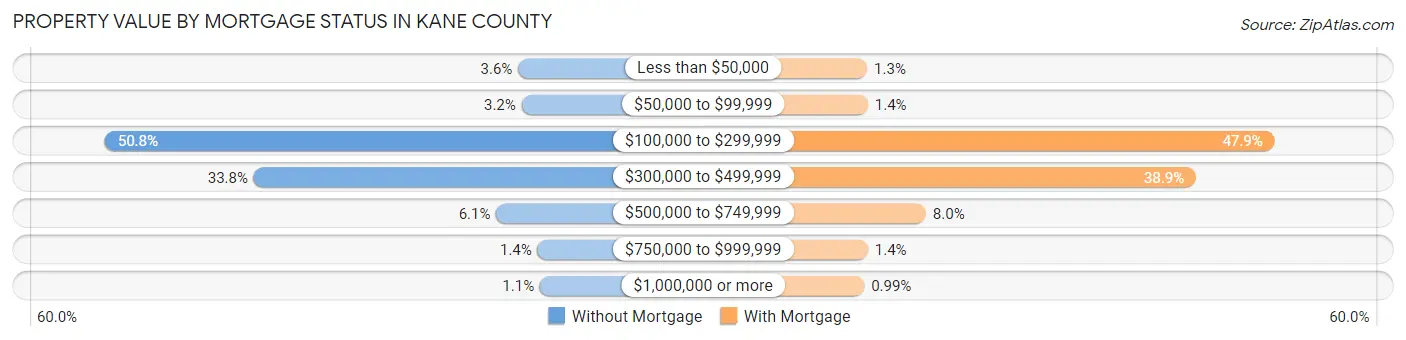
| Property Value | Without Mortgage | With Mortgage |
| Less than $50,000 | 1,548 (3.6%) | 1,252 (1.3%) |
| $50,000 to $99,999 | 1,381 (3.2%) | 1,321 (1.4%) |
| $100,000 to $299,999 | 21,922 (50.8%) | 44,994 (47.9%) |
| $300,000 to $499,999 | 14,583 (33.8%) | 36,560 (38.9%) |
| $500,000 to $749,999 | 2,626 (6.1%) | 7,552 (8.0%) |
| $750,000 to $999,999 | 591 (1.4%) | 1,323 (1.4%) |
| $1,000,000 or more | 476 (1.1%) | 933 (1.0%) |
| Total | 43,127 (100.0%) | 93,935 (100.0%) |
Household Income by Mortgage Status in Kane County
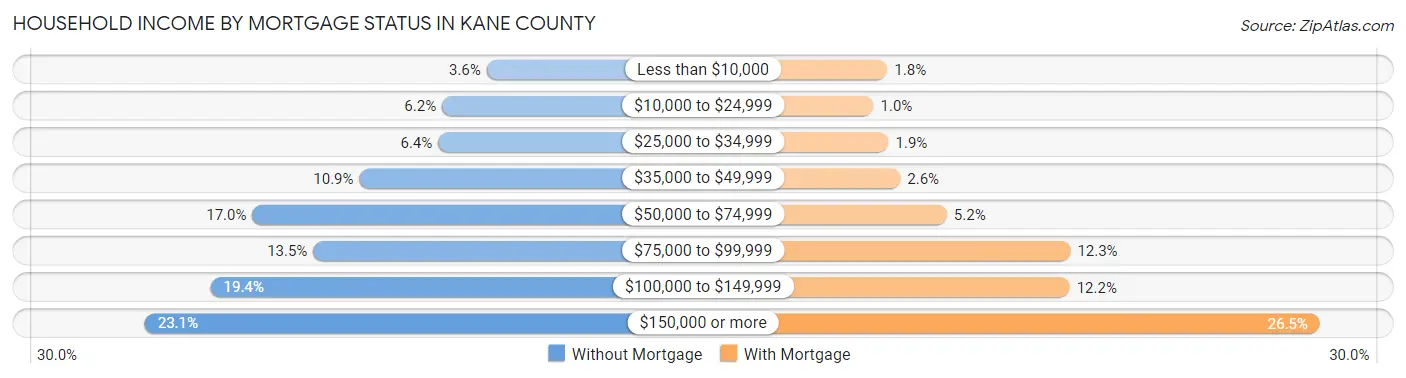
| Household Income | Without Mortgage | With Mortgage |
| Less than $10,000 | 1,552 (3.6%) | 1,706 (1.8%) |
| $10,000 to $24,999 | 2,654 (6.1%) | 969 (1.0%) |
| $25,000 to $34,999 | 2,748 (6.4%) | 1,780 (1.9%) |
| $35,000 to $49,999 | 4,690 (10.9%) | 2,407 (2.6%) |
| $50,000 to $74,999 | 7,327 (17.0%) | 4,907 (5.2%) |
| $75,000 to $99,999 | 5,826 (13.5%) | 11,535 (12.3%) |
| $100,000 to $149,999 | 8,355 (19.4%) | 11,498 (12.2%) |
| $150,000 or more | 9,975 (23.1%) | 24,925 (26.5%) |
| Total | 43,127 (100.0%) | 93,935 (100.0%) |
Property Value to Household Income Ratio in Kane County
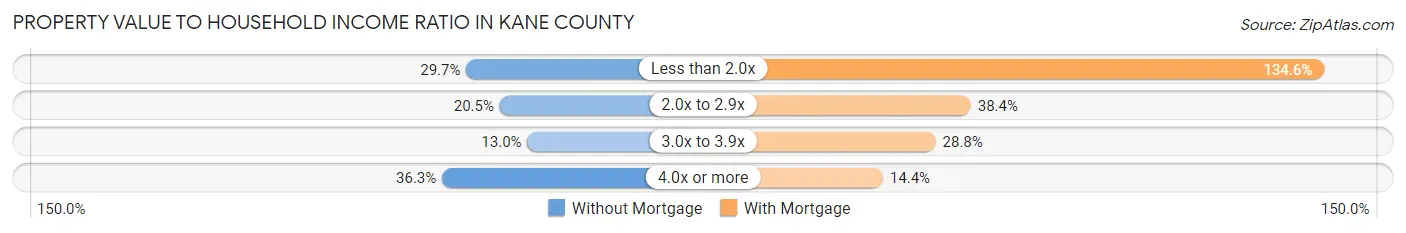
| Value-to-Income Ratio | Without Mortgage | With Mortgage |
| Less than 2.0x | 12,794 (29.7%) | 126,461 (134.6%) |
| 2.0x to 2.9x | 8,858 (20.5%) | 36,056 (38.4%) |
| 3.0x to 3.9x | 5,621 (13.0%) | 27,047 (28.8%) |
| 4.0x or more | 15,639 (36.3%) | 13,562 (14.4%) |
| Total | 43,127 (100.0%) | 93,935 (100.0%) |
Real Estate Taxes by Mortgage Status in Kane County

| Property Taxes | Without Mortgage | With Mortgage |
| Less than $800 | 1,631 (3.8%) | 256 (0.3%) |
| $800 to $1,499 | 1,014 (2.4%) | 1,331 (1.4%) |
| $800 to $1,499 | 39,290 (91.1%) | 1,073 (1.1%) |
| Total | 43,127 (100.0%) | 93,935 (100.0%) |
Health & Disability in Kane County
Health Insurance Coverage by Age in Kane County
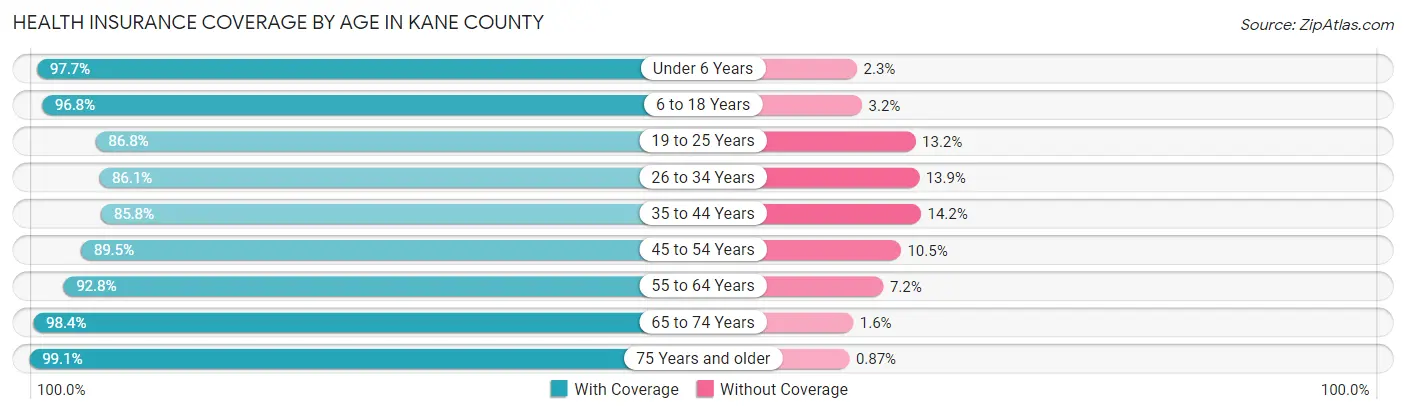
| Age Bracket | With Coverage | Without Coverage |
| Under 6 Years | 36,651 (97.7%) | 858 (2.3%) |
| 6 to 18 Years | 93,360 (96.8%) | 3,108 (3.2%) |
| 19 to 25 Years | 40,903 (86.8%) | 6,224 (13.2%) |
| 26 to 34 Years | 47,060 (86.1%) | 7,578 (13.9%) |
| 35 to 44 Years | 58,538 (85.8%) | 9,704 (14.2%) |
| 45 to 54 Years | 63,170 (89.5%) | 7,393 (10.5%) |
| 55 to 64 Years | 61,004 (92.8%) | 4,741 (7.2%) |
| 65 to 74 Years | 43,993 (98.4%) | 709 (1.6%) |
| 75 Years and older | 28,527 (99.1%) | 249 (0.9%) |
| Total | 473,206 (92.1%) | 40,564 (7.9%) |
Health Insurance Coverage by Citizenship Status in Kane County
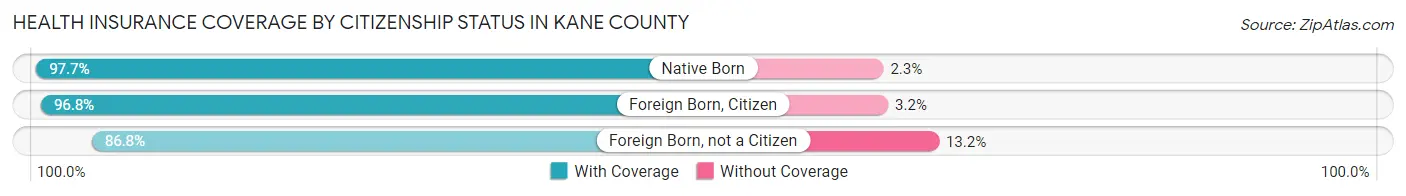
| Citizenship Status | With Coverage | Without Coverage |
| Native Born | 36,651 (97.7%) | 858 (2.3%) |
| Foreign Born, Citizen | 93,360 (96.8%) | 3,108 (3.2%) |
| Foreign Born, not a Citizen | 40,903 (86.8%) | 6,224 (13.2%) |
Health Insurance Coverage by Household Income in Kane County
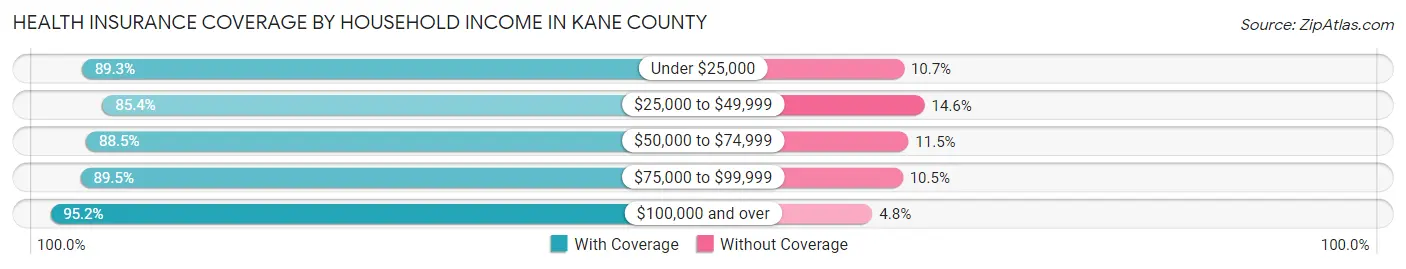
| Household Income | With Coverage | Without Coverage |
| Under $25,000 | 27,699 (89.3%) | 3,321 (10.7%) |
| $25,000 to $49,999 | 48,184 (85.4%) | 8,225 (14.6%) |
| $50,000 to $74,999 | 60,027 (88.5%) | 7,829 (11.5%) |
| $75,000 to $99,999 | 60,306 (89.5%) | 7,057 (10.5%) |
| $100,000 and over | 275,346 (95.2%) | 13,890 (4.8%) |
Public vs Private Health Insurance Coverage by Age in Kane County
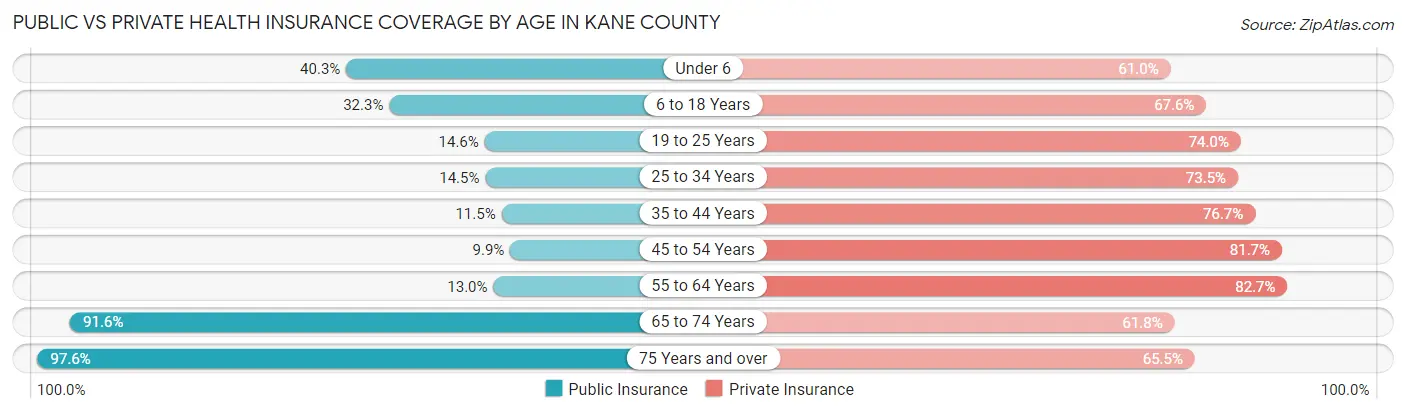
| Age Bracket | Public Insurance | Private Insurance |
| Under 6 | 15,121 (40.3%) | 22,883 (61.0%) |
| 6 to 18 Years | 31,177 (32.3%) | 65,242 (67.6%) |
| 19 to 25 Years | 6,886 (14.6%) | 34,891 (74.0%) |
| 25 to 34 Years | 7,910 (14.5%) | 40,169 (73.5%) |
| 35 to 44 Years | 7,831 (11.5%) | 52,349 (76.7%) |
| 45 to 54 Years | 6,962 (9.9%) | 57,633 (81.7%) |
| 55 to 64 Years | 8,537 (13.0%) | 54,374 (82.7%) |
| 65 to 74 Years | 40,923 (91.5%) | 27,606 (61.8%) |
| 75 Years and over | 28,091 (97.6%) | 18,853 (65.5%) |
| Total | 153,438 (29.9%) | 374,000 (72.8%) |
Disability Status by Sex by Age in Kane County
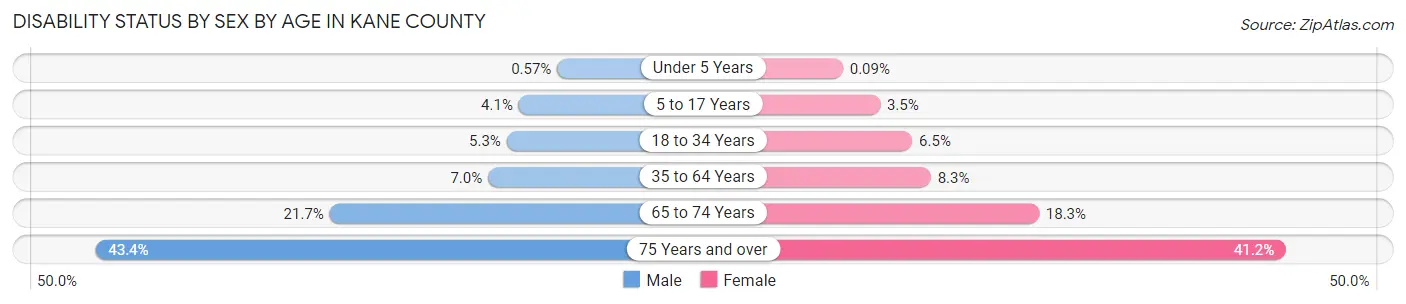
| Age Bracket | Male | Female |
| Under 5 Years | 91 (0.6%) | 13 (0.1%) |
| 5 to 17 Years | 2,042 (4.1%) | 1,660 (3.5%) |
| 18 to 34 Years | 2,925 (5.3%) | 3,469 (6.5%) |
| 35 to 64 Years | 7,245 (7.0%) | 8,330 (8.3%) |
| 65 to 74 Years | 4,620 (21.7%) | 4,280 (18.3%) |
| 75 Years and over | 5,152 (43.4%) | 6,974 (41.2%) |
Disability Class by Sex by Age in Kane County
Disability Class: Hearing Difficulty
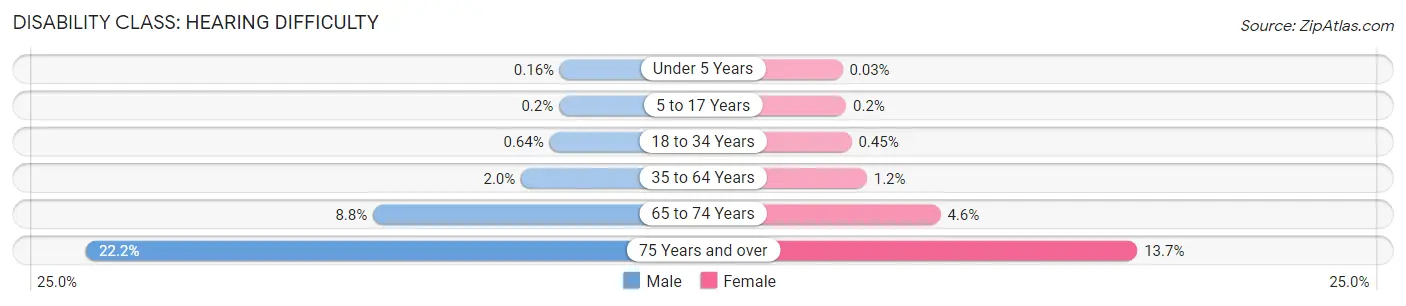
| Age Bracket | Male | Female |
| Under 5 Years | 25 (0.2%) | 4 (0.0%) |
| 5 to 17 Years | 101 (0.2%) | 96 (0.2%) |
| 18 to 34 Years | 357 (0.6%) | 240 (0.4%) |
| 35 to 64 Years | 2,030 (2.0%) | 1,174 (1.2%) |
| 65 to 74 Years | 1,880 (8.8%) | 1,071 (4.6%) |
| 75 Years and over | 2,628 (22.2%) | 2,319 (13.7%) |
Disability Class: Vision Difficulty
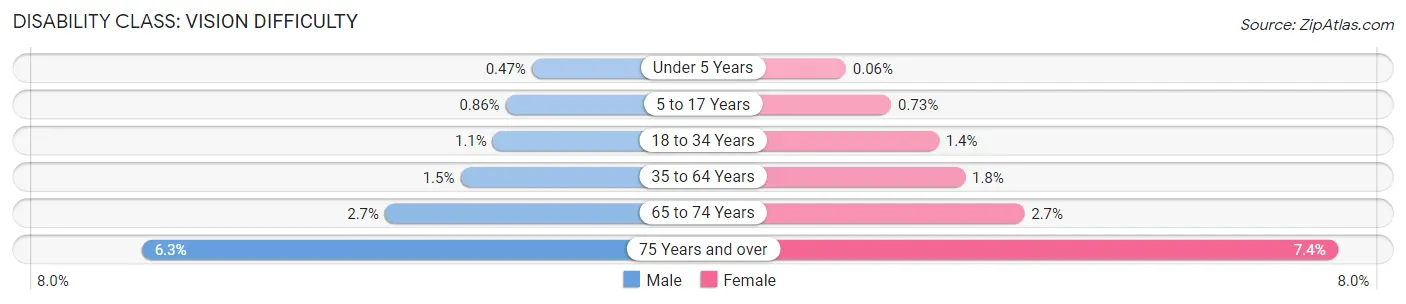
| Age Bracket | Male | Female |
| Under 5 Years | 74 (0.5%) | 9 (0.1%) |
| 5 to 17 Years | 423 (0.9%) | 343 (0.7%) |
| 18 to 34 Years | 582 (1.1%) | 766 (1.4%) |
| 35 to 64 Years | 1,588 (1.5%) | 1,851 (1.8%) |
| 65 to 74 Years | 565 (2.6%) | 635 (2.7%) |
| 75 Years and over | 743 (6.3%) | 1,245 (7.4%) |
Disability Class: Cognitive Difficulty
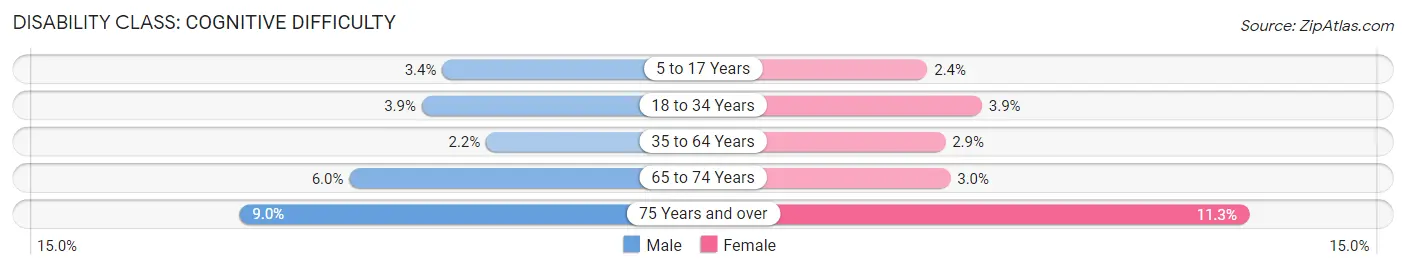
| Age Bracket | Male | Female |
| 5 to 17 Years | 1,664 (3.4%) | 1,116 (2.4%) |
| 18 to 34 Years | 2,191 (3.9%) | 2,073 (3.9%) |
| 35 to 64 Years | 2,222 (2.1%) | 2,912 (2.9%) |
| 65 to 74 Years | 1,269 (6.0%) | 707 (3.0%) |
| 75 Years and over | 1,070 (9.0%) | 1,917 (11.3%) |
Disability Class: Ambulatory Difficulty
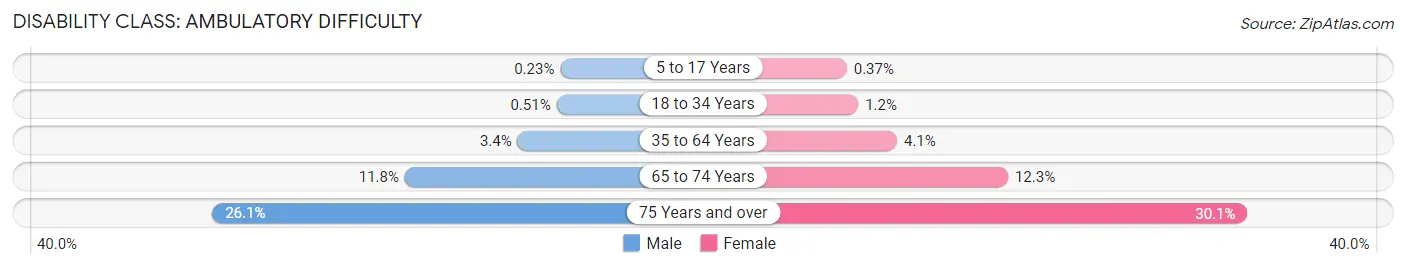
| Age Bracket | Male | Female |
| 5 to 17 Years | 113 (0.2%) | 173 (0.4%) |
| 18 to 34 Years | 284 (0.5%) | 650 (1.2%) |
| 35 to 64 Years | 3,526 (3.4%) | 4,138 (4.1%) |
| 65 to 74 Years | 2,507 (11.8%) | 2,887 (12.3%) |
| 75 Years and over | 3,092 (26.1%) | 5,093 (30.1%) |
Disability Class: Self-Care Difficulty
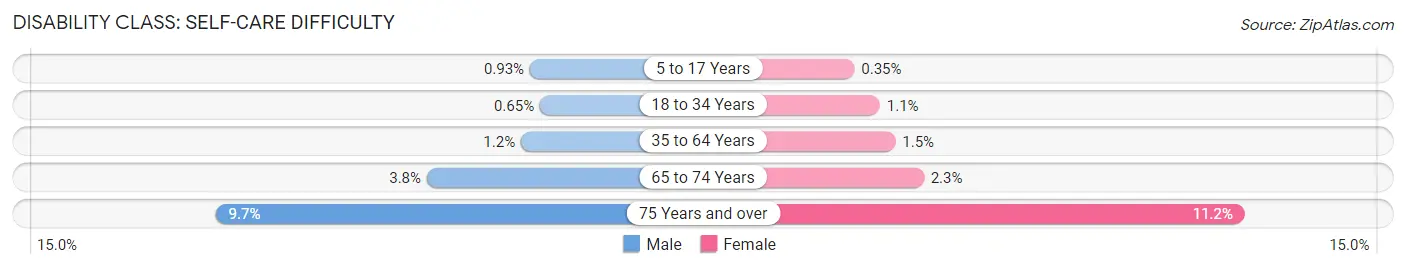
| Age Bracket | Male | Female |
| 5 to 17 Years | 457 (0.9%) | 166 (0.4%) |
| 18 to 34 Years | 364 (0.6%) | 564 (1.1%) |
| 35 to 64 Years | 1,226 (1.2%) | 1,503 (1.5%) |
| 65 to 74 Years | 809 (3.8%) | 533 (2.3%) |
| 75 Years and over | 1,148 (9.7%) | 1,898 (11.2%) |
Technology Access in Kane County
Computing Device Access in Kane County
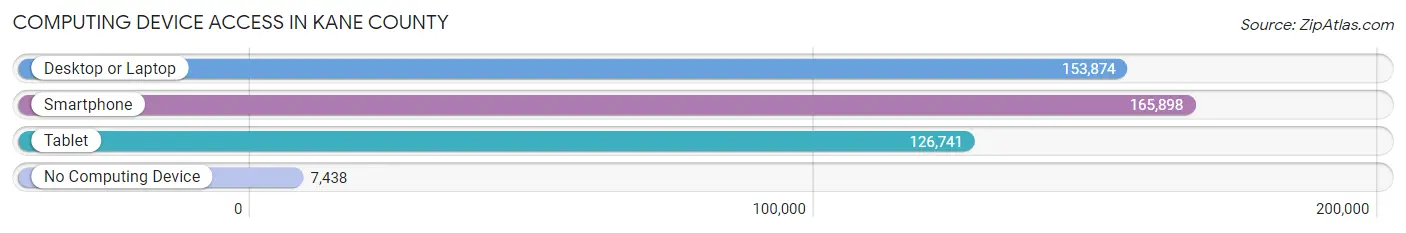
| Device Type | # Households | % Households |
| Desktop or Laptop | 153,874 | 84.4% |
| Smartphone | 165,898 | 91.0% |
| Tablet | 126,741 | 69.5% |
| No Computing Device | 7,438 | 4.1% |
| Total | 182,319 | 100.0% |
Internet Access in Kane County
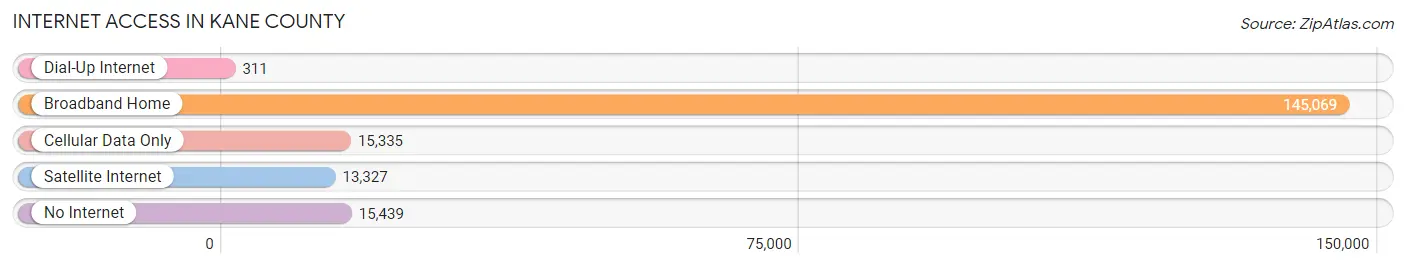
| Internet Type | # Households | % Households |
| Dial-Up Internet | 311 | 0.2% |
| Broadband Home | 145,069 | 79.6% |
| Cellular Data Only | 15,335 | 8.4% |
| Satellite Internet | 13,327 | 7.3% |
| No Internet | 15,439 | 8.5% |
| Total | 182,319 | 100.0% |
Kane County Summary
Kane County, Illinois is located in the northeastern corner of the state, and is part of the Chicago metropolitan area. It is bordered by Cook, DuPage, DeKalb, Kendall, and McHenry counties. The county seat is Geneva, and the largest city is Aurora. As of the 2010 census, the population was 515,269, making it the fifth-most populous county in Illinois.
History
Kane County was formed in 1836 from a portion of Cook County. It was named after Elias Kane, a United States Senator from Illinois. The first county seat was established in Geneva in 1836, and the county government was organized in 1837.
Geography
Kane County covers an area of 524 square miles, and is located in the northeastern corner of Illinois. It is bordered by Cook, DuPage, DeKalb, Kendall, and McHenry counties. The Fox River runs through the county, and the county is home to several lakes, including Lake Geneva, Lake St. Charles, and Lake Holiday.
The county is mostly flat, with some rolling hills in the western part of the county. The highest point in the county is located in the far northwest corner, at an elevation of 845 feet.
Economy
Kane County has a diverse economy, with a mix of manufacturing, retail, and service industries. The largest employers in the county are the Aurora Public Schools, Delnor Hospital, and the Kane County government.
The county is home to several major companies, including Caterpillar, Inc., John Deere, and the Fermi National Accelerator Laboratory. The county is also home to several universities and colleges, including Aurora University, Elgin Community College, and Waubonsee Community College.
Demographics
As of the 2010 census, the population of Kane County was 515,269. The racial makeup of the county was 77.2% White, 11.3% Black or African American, 5.2% Asian, 0.3% Native American, and 4.9% from other races. Hispanic or Latino of any race made up 14.7% of the population.
The median household income in the county was $76,845, and the median family income was $90,890. The per capita income was $33,945. About 8.2% of the population was below the poverty line.
Kane County is home to a large number of immigrants, with the largest groups coming from Mexico, India, and China. The county is also home to a large number of people of German, Irish, and Polish descent.
Common Questions
What is the Total Population of Kane County?
Total Population of Kane County is 517,254.
What is the Total Male Population of Kane County?
Total Male Population of Kane County is 259,491.
What is the Total Female Population of Kane County?
Total Female Population of Kane County is 257,763.
What is the Ratio of Males per 100 Females in Kane County?
There are 100.67 Males per 100 Females in Kane County.
What is the Ratio of Females per 100 Males in Kane County?
There are 99.33 Females per 100 Males in Kane County.
What is the Median Population Age in Kane County?
Median Population Age in Kane County is 38.3 Years.
What is the Average Family Size in Kane County
Average Family Size in Kane County is 3.3 People.
What is the Average Household Size in Kane County
Average Household Size in Kane County is 2.8 People.
What is Per Capita Income in Kane County?
Per Capita income in Kane County is $44,523.
What is the Median Family Income in Kane County?
Median Family Income in Kane County is $112,260.
What is the Median Household income in Kane County?
Median Household Income in Kane County is $96,400.
What is Income or Wage Gap in Kane County?
Income or Wage Gap in Kane County is 35.3%.
Women in Kane County earn 64.7 cents for every dollar earned by a man.
What is Family Income Deficit in Kane County?
Family Income Deficit in Kane County is $10,519.
Families that are below poverty line in Kane County earn $10,519 less on average than the poverty threshold level.
What is Inequality or Gini Index in Kane County?
Inequality or Gini Index in Kane County is 0.44.
How Large is the Labor Force in Kane County?
There are 283,172 People in the Labor Forcein in Kane County.
What is the Percentage of People in the Labor Force in Kane County?
69.6% of People are in the Labor Force in Kane County.
What is the Unemployment Rate in Kane County?
Unemployment Rate in Kane County is 5.0%.