DuPage County, IL
DuPage County Map
DuPage County Overview
930,559
TOTAL POPULATION
461,287
MALE POPULATION
469,272
FEMALE POPULATION
98.30
MALES / 100 FEMALES
101.73
FEMALES / 100 MALES
39.9
MEDIAN AGE
3.2
AVG FAMILY SIZE
2.6
AVG HOUSEHOLD SIZE
$55,107
PER CAPITA INCOME
$131,904
AVG FAMILY INCOME
$107,035
AVG HOUSEHOLD INCOME
36.4%
WAGE / INCOME GAP [ % ]
63.6¢/ $1
WAGE / INCOME GAP [ $ ]
$10,909
FAMILY INCOME DEFICIT
0.46
INEQUALITY / GINI INDEX
514,514
LABOR FORCE [ PEOPLE ]
68.7%
PERCENT IN LABOR FORCE
4.7%
UNEMPLOYMENT RATE
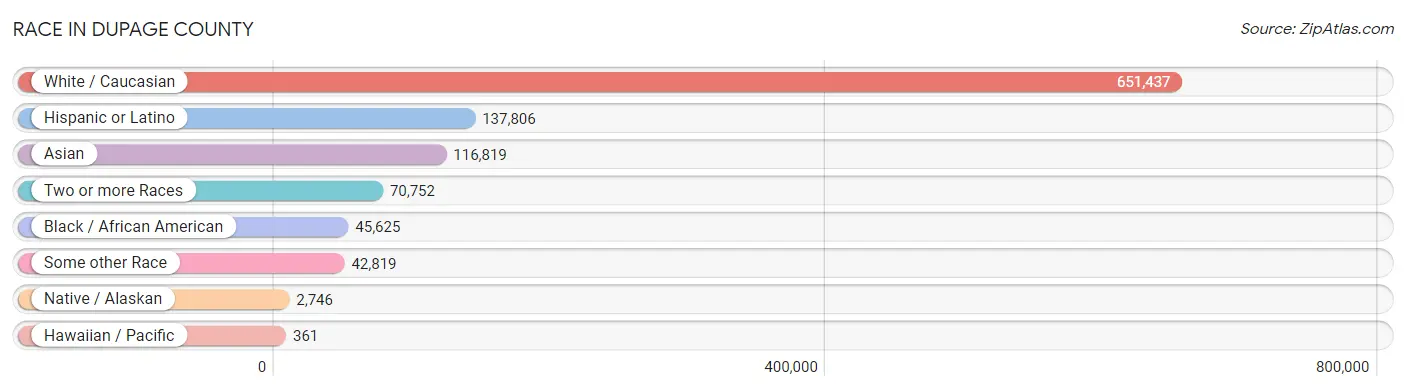
Race in DuPage County
The most populous races in DuPage County are White / Caucasian (651,437 | 70.0%), Hispanic or Latino (137,806 | 14.8%), and Asian (116,819 | 12.6%).
| Race | # Population | % Population |
| Asian | 116,819 | 12.6% |
| Black / African American | 45,625 | 4.9% |
| Hawaiian / Pacific | 361 | 0.0% |
| Hispanic or Latino | 137,806 | 14.8% |
| Native / Alaskan | 2,746 | 0.3% |
| White / Caucasian | 651,437 | 70.0% |
| Two or more Races | 70,752 | 7.6% |
| Some other Race | 42,819 | 4.6% |
| Total | 930,559 | 100.0% |
Ancestry in DuPage County
The most populous ancestries reported in DuPage County are German (156,902 | 16.9%), Irish (127,947 | 13.8%), Mexican (103,194 | 11.1%), Italian (94,817 | 10.2%), and Polish (93,679 | 10.1%), together accounting for 62.0% of all DuPage County residents.

| Ancestry | # Population | % Population |
| Afghan | 181 | 0.0% |
| African | 2,564 | 0.3% |
| Alaskan Athabascan | 83 | 0.0% |
| Albanian | 3,757 | 0.4% |
| Alsatian | 57 | 0.0% |
| American | 23,627 | 2.5% |
| Apache | 69 | 0.0% |
| Arab | 9,897 | 1.1% |
| Argentinean | 897 | 0.1% |
| Armenian | 1,093 | 0.1% |
| Assyrian / Chaldean / Syriac | 516 | 0.1% |
| Australian | 283 | 0.0% |
| Austrian | 3,926 | 0.4% |
| Bangladeshi | 104 | 0.0% |
| Barbadian | 39 | 0.0% |
| Basque | 34 | 0.0% |
| Belgian | 1,369 | 0.2% |
| Belizean | 141 | 0.0% |
| Bhutanese | 2,928 | 0.3% |
| Blackfeet | 197 | 0.0% |
| Bolivian | 362 | 0.0% |
| Brazilian | 446 | 0.1% |
| British | 3,600 | 0.4% |
| Bulgarian | 2,155 | 0.2% |
| Burmese | 5,854 | 0.6% |
| Cajun | 44 | 0.0% |
| Cambodian | 290 | 0.0% |
| Canadian | 1,328 | 0.1% |
| Cape Verdean | 7 | 0.0% |
| Carpatho Rusyn | 47 | 0.0% |
| Celtic | 85 | 0.0% |
| Central American | 7,346 | 0.8% |
| Central American Indian | 812 | 0.1% |
| Cherokee | 1,127 | 0.1% |
| Cheyenne | 32 | 0.0% |
| Chickasaw | 18 | 0.0% |
| Chilean | 347 | 0.0% |
| Chippewa | 95 | 0.0% |
| Choctaw | 171 | 0.0% |
| Colombian | 2,646 | 0.3% |
| Comanche | 35 | 0.0% |
| Costa Rican | 264 | 0.0% |
| Creek | 3 | 0.0% |
| Croatian | 4,345 | 0.5% |
| Crow | 6 | 0.0% |
| Cuban | 3,174 | 0.3% |
| Cypriot | 70 | 0.0% |
| Czech | 15,422 | 1.7% |
| Czechoslovakian | 1,486 | 0.2% |
| Danish | 4,202 | 0.4% |
| Delaware | 28 | 0.0% |
| Dominican | 464 | 0.1% |
| Dutch | 11,858 | 1.3% |
| Dutch West Indian | 25 | 0.0% |
| Eastern European | 3,609 | 0.4% |
| Ecuadorian | 1,201 | 0.1% |
| Egyptian | 2,321 | 0.3% |
| English | 57,471 | 6.2% |
| Estonian | 127 | 0.0% |
| Ethiopian | 458 | 0.1% |
| European | 20,340 | 2.2% |
| Filipino | 1,387 | 0.2% |
| Finnish | 1,402 | 0.2% |
| French | 14,721 | 1.6% |
| French American Indian | 13 | 0.0% |
| French Canadian | 3,005 | 0.3% |
| German | 156,902 | 16.9% |
| Ghanaian | 980 | 0.1% |
| Greek | 11,406 | 1.2% |
| Guamanian / Chamorro | 114 | 0.0% |
| Guatemalan | 5,288 | 0.6% |
| Guyanese | 24 | 0.0% |
| Haitian | 361 | 0.0% |
| Hmong | 15 | 0.0% |
| Honduran | 489 | 0.1% |
| Hopi | 7 | 0.0% |
| Hungarian | 3,730 | 0.4% |
| Icelander | 72 | 0.0% |
| Indian (Asian) | 17,031 | 1.8% |
| Indonesian | 1,910 | 0.2% |
| Inupiat | 34 | 0.0% |
| Iranian | 1,628 | 0.2% |
| Iraqi | 702 | 0.1% |
| Irish | 127,947 | 13.8% |
| Iroquois | 171 | 0.0% |
| Israeli | 408 | 0.0% |
| Italian | 94,817 | 10.2% |
| Jamaican | 872 | 0.1% |
| Japanese | 796 | 0.1% |
| Jordanian | 906 | 0.1% |
| Kenyan | 12 | 0.0% |
| Korean | 20,141 | 2.2% |
| Laotian | 312 | 0.0% |
| Latvian | 523 | 0.1% |
| Lebanese | 1,895 | 0.2% |
| Liberian | 25 | 0.0% |
| Lithuanian | 9,914 | 1.1% |
| Lumbee | 25 | 0.0% |
| Luxembourger | 534 | 0.1% |
| Macedonian | 889 | 0.1% |
| Malaysian | 506 | 0.1% |
| Maltese | 39 | 0.0% |
| Menominee | 6 | 0.0% |
| Mexican | 103,194 | 11.1% |
| Mexican American Indian | 2,096 | 0.2% |
| Mongolian | 71 | 0.0% |
| Moroccan | 429 | 0.1% |
| Native Hawaiian | 443 | 0.1% |
| Navajo | 74 | 0.0% |
| New Zealander | 37 | 0.0% |
| Nicaraguan | 338 | 0.0% |
| Nigerian | 965 | 0.1% |
| Northern European | 1,112 | 0.1% |
| Norwegian | 12,813 | 1.4% |
| Okinawan | 41 | 0.0% |
| Osage | 44 | 0.0% |
| Ottawa | 17 | 0.0% |
| Pakistani | 1,104 | 0.1% |
| Palestinian | 1,532 | 0.2% |
| Panamanian | 337 | 0.0% |
| Paraguayan | 19 | 0.0% |
| Pennsylvania German | 76 | 0.0% |
| Peruvian | 1,049 | 0.1% |
| Pima | 28 | 0.0% |
| Polish | 93,679 | 10.1% |
| Portuguese | 1,115 | 0.1% |
| Potawatomi | 6 | 0.0% |
| Pueblo | 25 | 0.0% |
| Puerto Rican | 10,639 | 1.1% |
| Romanian | 3,584 | 0.4% |
| Russian | 6,508 | 0.7% |
| Salvadoran | 630 | 0.1% |
| Samoan | 105 | 0.0% |
| Scandinavian | 1,920 | 0.2% |
| Scotch-Irish | 4,783 | 0.5% |
| Scottish | 11,560 | 1.2% |
| Senegalese | 73 | 0.0% |
| Serbian | 4,304 | 0.5% |
| Sioux | 86 | 0.0% |
| Slavic | 398 | 0.0% |
| Slovak | 3,934 | 0.4% |
| Slovene | 1,495 | 0.2% |
| Somali | 397 | 0.0% |
| South African | 164 | 0.0% |
| South American | 7,977 | 0.9% |
| South American Indian | 238 | 0.0% |
| Soviet Union | 14 | 0.0% |
| Spaniard | 1,628 | 0.2% |
| Spanish | 1,102 | 0.1% |
| Spanish American | 84 | 0.0% |
| Spanish American Indian | 10 | 0.0% |
| Sri Lankan | 4,319 | 0.5% |
| Subsaharan African | 6,921 | 0.7% |
| Sudanese | 916 | 0.1% |
| Swedish | 20,930 | 2.2% |
| Swiss | 2,320 | 0.3% |
| Syrian | 818 | 0.1% |
| Taiwanese | 254 | 0.0% |
| Thai | 59,305 | 6.4% |
| Trinidadian and Tobagonian | 118 | 0.0% |
| Turkish | 736 | 0.1% |
| Ukrainian | 6,094 | 0.6% |
| Uruguayan | 245 | 0.0% |
| Venezuelan | 1,170 | 0.1% |
| Vietnamese | 478 | 0.1% |
| Welsh | 3,560 | 0.4% |
| West Indian | 147 | 0.0% |
| Yaqui | 35 | 0.0% |
| Yugoslavian | 1,212 | 0.1% |
| Zimbabwean | 88 | 0.0% | View All 170 Rows |
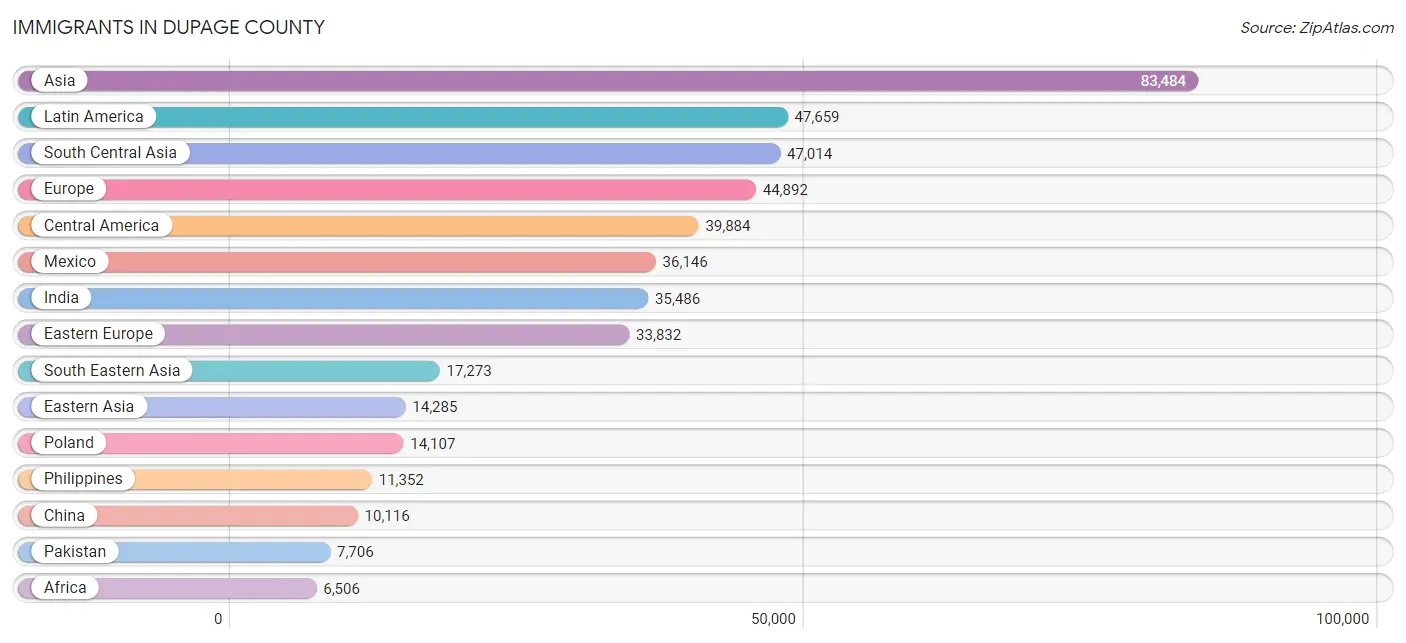
Immigrants in DuPage County
The most numerous immigrant groups reported in DuPage County came from Asia (83,484 | 9.0%), Latin America (47,659 | 5.1%), South Central Asia (47,014 | 5.1%), Europe (44,892 | 4.8%), and Central America (39,884 | 4.3%), together accounting for 28.3% of all DuPage County residents.
| Immigration Origin | # Population | % Population |
| Afghanistan | 272 | 0.0% |
| Africa | 6,506 | 0.7% |
| Albania | 2,470 | 0.3% |
| Argentina | 622 | 0.1% |
| Armenia | 22 | 0.0% |
| Asia | 83,484 | 9.0% |
| Australia | 197 | 0.0% |
| Austria | 265 | 0.0% |
| Bangladesh | 485 | 0.1% |
| Barbados | 57 | 0.0% |
| Belarus | 411 | 0.0% |
| Belgium | 72 | 0.0% |
| Belize | 11 | 0.0% |
| Bolivia | 175 | 0.0% |
| Bosnia and Herzegovina | 902 | 0.1% |
| Brazil | 746 | 0.1% |
| Bulgaria | 1,718 | 0.2% |
| Cambodia | 484 | 0.1% |
| Cameroon | 40 | 0.0% |
| Canada | 1,952 | 0.2% |
| Caribbean | 2,011 | 0.2% |
| Central America | 39,884 | 4.3% |
| Chile | 220 | 0.0% |
| China | 10,116 | 1.1% |
| Colombia | 1,714 | 0.2% |
| Congo | 10 | 0.0% |
| Costa Rica | 62 | 0.0% |
| Croatia | 555 | 0.1% |
| Cuba | 796 | 0.1% |
| Czechoslovakia | 1,150 | 0.1% |
| Denmark | 74 | 0.0% |
| Dominican Republic | 188 | 0.0% |
| Eastern Africa | 1,299 | 0.1% |
| Eastern Asia | 14,285 | 1.5% |
| Eastern Europe | 33,832 | 3.6% |
| Ecuador | 720 | 0.1% |
| Egypt | 1,468 | 0.2% |
| El Salvador | 405 | 0.0% |
| England | 1,034 | 0.1% |
| Eritrea | 28 | 0.0% |
| Ethiopia | 183 | 0.0% |
| Europe | 44,892 | 4.8% |
| France | 425 | 0.1% |
| Germany | 1,893 | 0.2% |
| Ghana | 711 | 0.1% |
| Greece | 1,358 | 0.2% |
| Guatemala | 2,636 | 0.3% |
| Guyana | 110 | 0.0% |
| Haiti | 135 | 0.0% |
| Honduras | 271 | 0.0% |
| Hong Kong | 509 | 0.1% |
| Hungary | 223 | 0.0% |
| India | 35,486 | 3.8% |
| Indonesia | 171 | 0.0% |
| Iran | 1,166 | 0.1% |
| Iraq | 889 | 0.1% |
| Ireland | 693 | 0.1% |
| Israel | 188 | 0.0% |
| Italy | 2,878 | 0.3% |
| Jamaica | 691 | 0.1% |
| Japan | 928 | 0.1% |
| Jordan | 399 | 0.0% |
| Kazakhstan | 331 | 0.0% |
| Kenya | 306 | 0.0% |
| Korea | 3,010 | 0.3% |
| Kuwait | 105 | 0.0% |
| Laos | 246 | 0.0% |
| Latin America | 47,659 | 5.1% |
| Latvia | 289 | 0.0% |
| Lebanon | 551 | 0.1% |
| Liberia | 128 | 0.0% |
| Lithuania | 3,272 | 0.4% |
| Malaysia | 357 | 0.0% |
| Mexico | 36,146 | 3.9% |
| Micronesia | 28 | 0.0% |
| Middle Africa | 227 | 0.0% |
| Moldova | 940 | 0.1% |
| Morocco | 272 | 0.0% |
| Nepal | 538 | 0.1% |
| Netherlands | 131 | 0.0% |
| Nicaragua | 135 | 0.0% |
| Nigeria | 421 | 0.1% |
| North Macedonia | 576 | 0.1% |
| Northern Africa | 2,450 | 0.3% |
| Northern Europe | 3,333 | 0.4% |
| Norway | 66 | 0.0% |
| Oceania | 297 | 0.0% |
| Pakistan | 7,706 | 0.8% |
| Panama | 218 | 0.0% |
| Peru | 621 | 0.1% |
| Philippines | 11,352 | 1.2% |
| Poland | 14,107 | 1.5% |
| Portugal | 24 | 0.0% |
| Romania | 1,217 | 0.1% |
| Russia | 1,455 | 0.2% |
| Saudi Arabia | 737 | 0.1% |
| Scotland | 161 | 0.0% |
| Senegal | 105 | 0.0% |
| Serbia | 1,207 | 0.1% |
| Singapore | 143 | 0.0% |
| Somalia | 90 | 0.0% |
| South Africa | 400 | 0.0% |
| South America | 5,764 | 0.6% |
| South Central Asia | 47,014 | 5.1% |
| South Eastern Asia | 17,273 | 1.9% |
| Southern Europe | 4,507 | 0.5% |
| Spain | 247 | 0.0% |
| Sri Lanka | 321 | 0.0% |
| St. Vincent and the Grenadines | 10 | 0.0% |
| Sudan | 421 | 0.1% |
| Sweden | 113 | 0.0% |
| Switzerland | 85 | 0.0% |
| Syria | 705 | 0.1% |
| Taiwan | 2,125 | 0.2% |
| Thailand | 489 | 0.1% |
| Trinidad and Tobago | 129 | 0.0% |
| Turkey | 291 | 0.0% |
| Uganda | 305 | 0.0% |
| Ukraine | 2,423 | 0.3% |
| Uruguay | 115 | 0.0% |
| Uzbekistan | 243 | 0.0% |
| Venezuela | 711 | 0.1% |
| Vietnam | 2,680 | 0.3% |
| Western Africa | 1,466 | 0.2% |
| Western Asia | 4,274 | 0.5% |
| Western Europe | 2,871 | 0.3% |
| Zaire | 154 | 0.0% |
| Zimbabwe | 85 | 0.0% | View All 128 Rows |
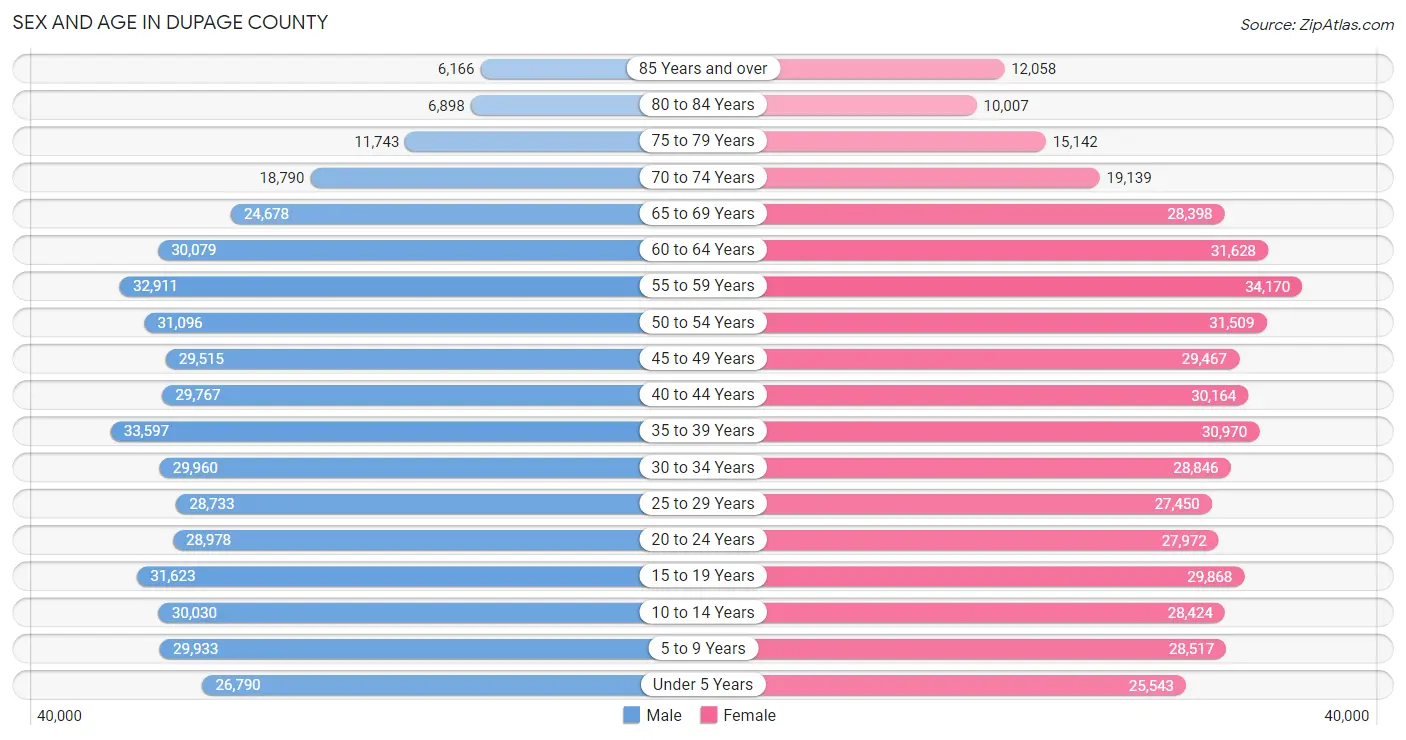
Sex and Age in DuPage County
Sex and Age in DuPage County
The most populous age groups in DuPage County are 35 to 39 Years (33,597 | 7.3%) for men and 55 to 59 Years (34,170 | 7.3%) for women.
| Age Bracket | Male | Female |
| Under 5 Years | 26,790 (5.8%) | 25,543 (5.4%) |
| 5 to 9 Years | 29,933 (6.5%) | 28,517 (6.1%) |
| 10 to 14 Years | 30,030 (6.5%) | 28,424 (6.1%) |
| 15 to 19 Years | 31,623 (6.9%) | 29,868 (6.4%) |
| 20 to 24 Years | 28,978 (6.3%) | 27,972 (6.0%) |
| 25 to 29 Years | 28,733 (6.2%) | 27,450 (5.9%) |
| 30 to 34 Years | 29,960 (6.5%) | 28,846 (6.1%) |
| 35 to 39 Years | 33,597 (7.3%) | 30,970 (6.6%) |
| 40 to 44 Years | 29,767 (6.5%) | 30,164 (6.4%) |
| 45 to 49 Years | 29,515 (6.4%) | 29,467 (6.3%) |
| 50 to 54 Years | 31,096 (6.7%) | 31,509 (6.7%) |
| 55 to 59 Years | 32,911 (7.1%) | 34,170 (7.3%) |
| 60 to 64 Years | 30,079 (6.5%) | 31,628 (6.7%) |
| 65 to 69 Years | 24,678 (5.3%) | 28,398 (6.0%) |
| 70 to 74 Years | 18,790 (4.1%) | 19,139 (4.1%) |
| 75 to 79 Years | 11,743 (2.5%) | 15,142 (3.2%) |
| 80 to 84 Years | 6,898 (1.5%) | 10,007 (2.1%) |
| 85 Years and over | 6,166 (1.3%) | 12,058 (2.6%) |
| Total | 461,287 (100.0%) | 469,272 (100.0%) |
Families and Households in DuPage County
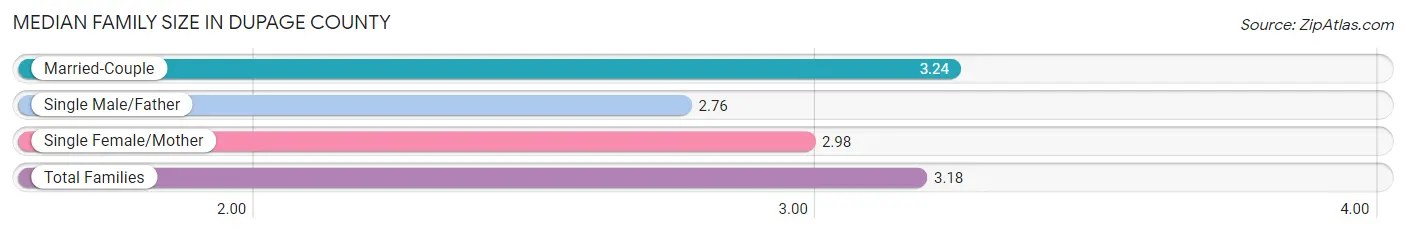
Median Family Size in DuPage County
The median family size in DuPage County is 3.18 persons per family, with married-couple families (198,896 | 81.4%) accounting for the largest median family size of 3.24 persons per family. On the other hand, single male/father families (13,505 | 5.5%) represent the smallest median family size with 2.76 persons per family.
| Family Type | # Families | Family Size |
| Married-Couple | 198,896 (81.4%) | 3.24 |
| Single Male/Father | 13,505 (5.5%) | 2.76 |
| Single Female/Mother | 32,017 (13.1%) | 2.98 |
| Total Families | 244,418 (100.0%) | 3.18 |
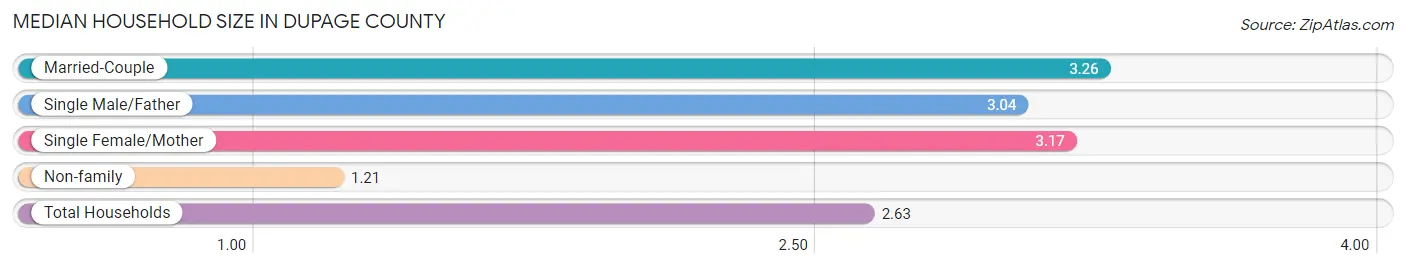
Median Household Size in DuPage County
The median household size in DuPage County is 2.63 persons per household, with married-couple households (198,896 | 57.0%) accounting for the largest median household size of 3.26 persons per household. non-family households (104,452 | 29.9%) represent the smallest median household size with 1.21 persons per household.
| Household Type | # Households | Household Size |
| Married-Couple | 198,896 (57.0%) | 3.26 |
| Single Male/Father | 13,505 (3.9%) | 3.04 |
| Single Female/Mother | 32,017 (9.2%) | 3.17 |
| Non-family | 104,452 (29.9%) | 1.21 |
| Total Households | 348,870 (100.0%) | 2.63 |
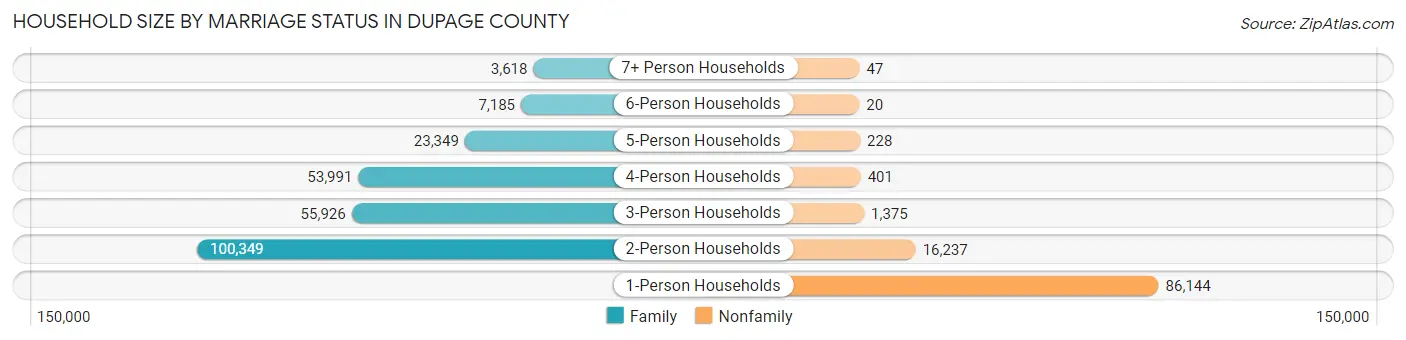
Household Size by Marriage Status in DuPage County
Out of a total of 348,870 households in DuPage County, 244,418 (70.1%) are family households, while 104,452 (29.9%) are nonfamily households. The most numerous type of family households are 2-person households, comprising 100,349, and the most common type of nonfamily households are 1-person households, comprising 86,144.
| Household Size | Family Households | Nonfamily Households |
| 1-Person Households | - | 86,144 (24.7%) |
| 2-Person Households | 100,349 (28.8%) | 16,237 (4.6%) |
| 3-Person Households | 55,926 (16.0%) | 1,375 (0.4%) |
| 4-Person Households | 53,991 (15.5%) | 401 (0.1%) |
| 5-Person Households | 23,349 (6.7%) | 228 (0.1%) |
| 6-Person Households | 7,185 (2.1%) | 20 (0.0%) |
| 7+ Person Households | 3,618 (1.0%) | 47 (0.0%) |
| Total | 244,418 (70.1%) | 104,452 (29.9%) |
Female Fertility in DuPage County
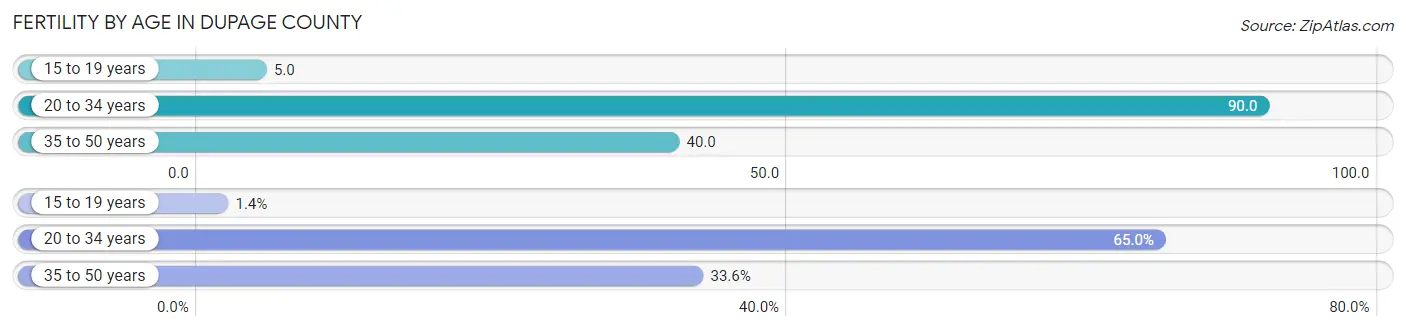
Fertility by Age in DuPage County
Average fertility rate in DuPage County is 55.0 births per 1,000 women. Women in the age bracket of 20 to 34 years have the highest fertility rate with 90.0 births per 1,000 women. Women in the age bracket of 20 to 34 years acount for 65.0% of all women with births.
| Age Bracket | Women with Births | Births / 1,000 Women |
| 15 to 19 years | 161 (1.4%) | 5.0 |
| 20 to 34 years | 7,554 (65.0%) | 90.0 |
| 35 to 50 years | 3,909 (33.6%) | 40.0 |
| Total | 11,624 (100.0%) | 55.0 |
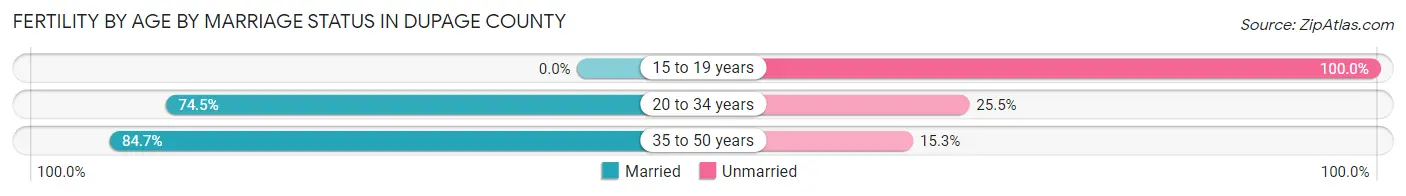
Fertility by Age by Marriage Status in DuPage County
76.9% of women with births (11,624) in DuPage County are married. The highest percentage of unmarried women with births falls into 15 to 19 years age bracket with 100.0% of them unmarried at the time of birth, while the lowest percentage of unmarried women with births belong to 35 to 50 years age bracket with 15.3% of them unmarried.
| Age Bracket | Married | Unmarried |
| 15 to 19 years | 0 (0.0%) | 161 (100.0%) |
| 20 to 34 years | 5,628 (74.5%) | 1,926 (25.5%) |
| 35 to 50 years | 3,311 (84.7%) | 598 (15.3%) |
| Total | 8,939 (76.9%) | 2,685 (23.1%) |
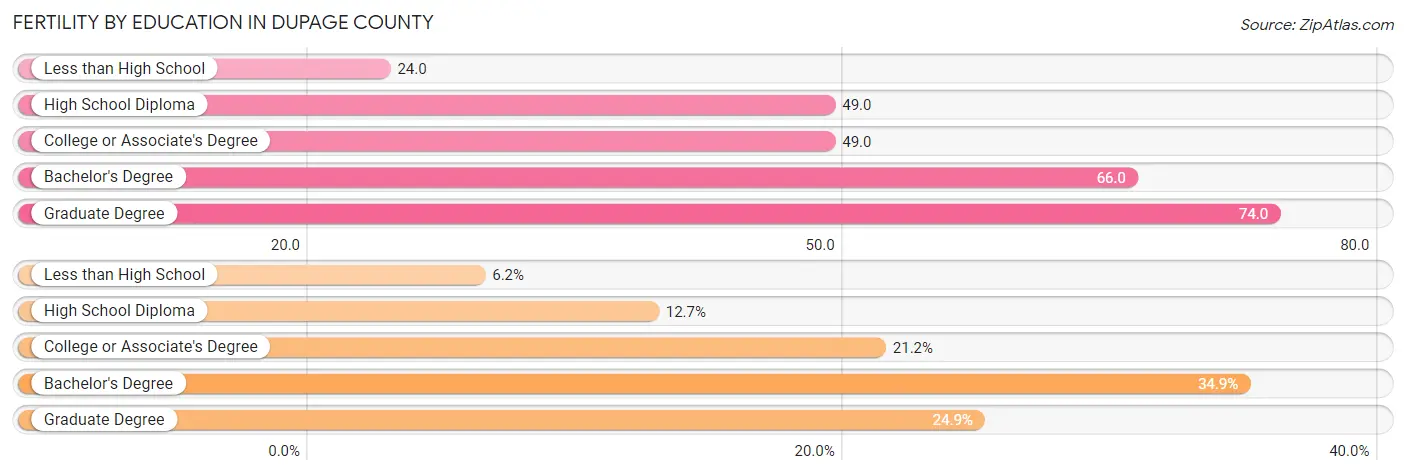
Fertility by Education in DuPage County
Average fertility rate in DuPage County is 55.0 births per 1,000 women. Women with the education attainment of graduate degree have the highest fertility rate of 74.0 births per 1,000 women, while women with the education attainment of less than high school have the lowest fertility at 24.0 births per 1,000 women. Women with the education attainment of bachelor's degree represent 34.9% of all women with births.
| Educational Attainment | Women with Births | Births / 1,000 Women |
| Less than High School | 723 (6.2%) | 24.0 |
| High School Diploma | 1,479 (12.7%) | 49.0 |
| College or Associate's Degree | 2,468 (21.2%) | 49.0 |
| Bachelor's Degree | 4,055 (34.9%) | 66.0 |
| Graduate Degree | 2,899 (24.9%) | 74.0 |
| Total | 11,624 (100.0%) | 55.0 |
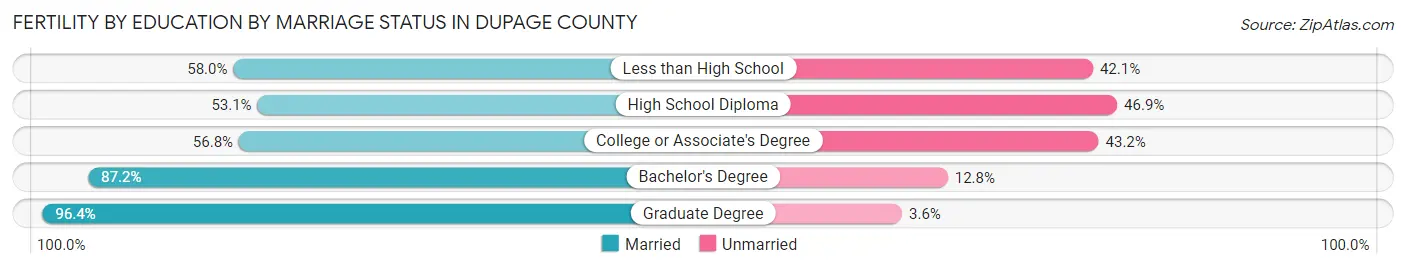
Fertility by Education by Marriage Status in DuPage County
23.1% of women with births in DuPage County are unmarried. Women with the educational attainment of graduate degree are most likely to be married with 96.4% of them married at childbirth, while women with the educational attainment of high school diploma are least likely to be married with 46.9% of them unmarried at childbirth.
| Educational Attainment | Married | Unmarried |
| Less than High School | 419 (58.0%) | 304 (42.0%) |
| High School Diploma | 785 (53.1%) | 694 (46.9%) |
| College or Associate's Degree | 1,402 (56.8%) | 1,066 (43.2%) |
| Bachelor's Degree | 3,536 (87.2%) | 519 (12.8%) |
| Graduate Degree | 2,795 (96.4%) | 104 (3.6%) |
| Total | 8,939 (76.9%) | 2,685 (23.1%) |
Income in DuPage County
Income Overview in DuPage County
Per Capita Income in DuPage County is $55,107, while median incomes of families and households are $131,904 and $107,035 respectively.
| Characteristic | Number | Measure |
| Per Capita Income | 930,559 | $55,107 |
| Median Family Income | 244,418 | $131,904 |
| Mean Family Income | 244,418 | $170,472 |
| Median Household Income | 348,870 | $107,035 |
| Mean Household Income | 348,870 | $144,731 |
| Income Deficit | 244,418 | $10,909 |
| Wage / Income Gap (%) | 930,559 | 36.41% |
| Wage / Income Gap ($) | 930,559 | 63.59¢ per $1 |
| Gini / Inequality Index | 930,559 | 0.46 |
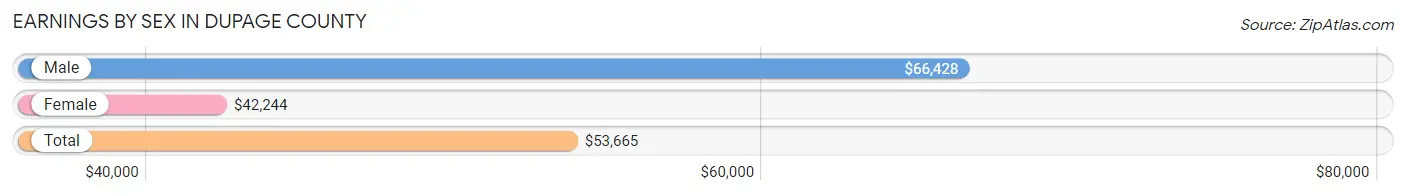
Earnings by Sex in DuPage County
Average Earnings in DuPage County are $53,665, $66,428 for men and $42,244 for women, a difference of 36.4%.
| Sex | Number | Average Earnings |
| Male | 285,982 (53.5%) | $66,428 |
| Female | 248,648 (46.5%) | $42,244 |
| Total | 534,630 (100.0%) | $53,665 |
Earnings by Sex by Income Bracket in DuPage County
The most common earnings brackets in DuPage County are $100,000+ for men (92,506 | 32.4%) and $100,000+ for women (38,894 | 15.6%).
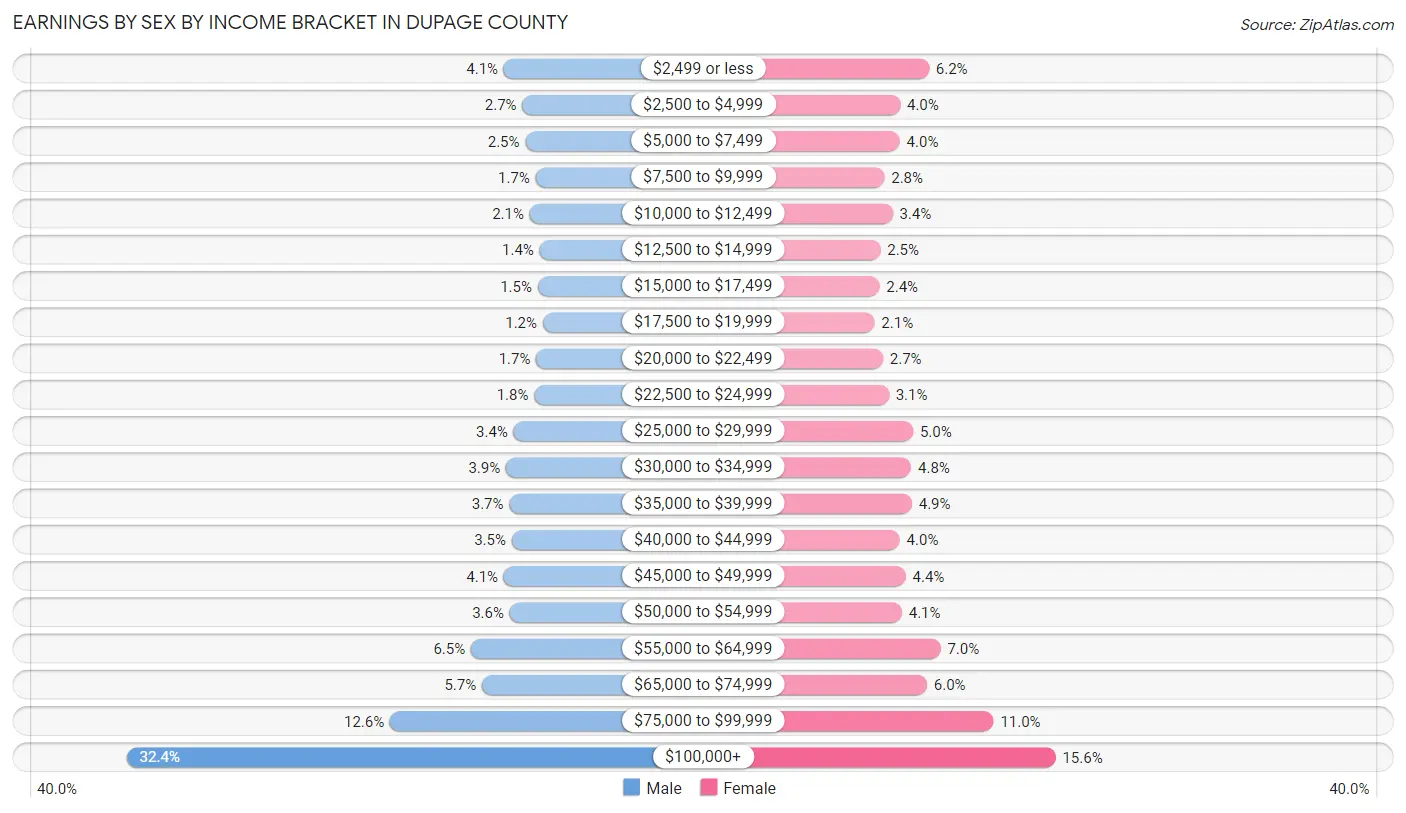
| Income | Male | Female |
| $2,499 or less | 11,657 (4.1%) | 15,282 (6.1%) |
| $2,500 to $4,999 | 7,703 (2.7%) | 9,925 (4.0%) |
| $5,000 to $7,499 | 7,067 (2.5%) | 9,857 (4.0%) |
| $7,500 to $9,999 | 4,857 (1.7%) | 6,988 (2.8%) |
| $10,000 to $12,499 | 6,109 (2.1%) | 8,511 (3.4%) |
| $12,500 to $14,999 | 4,014 (1.4%) | 6,239 (2.5%) |
| $15,000 to $17,499 | 4,402 (1.5%) | 6,072 (2.4%) |
| $17,500 to $19,999 | 3,327 (1.2%) | 5,157 (2.1%) |
| $20,000 to $22,499 | 4,719 (1.7%) | 6,719 (2.7%) |
| $22,500 to $24,999 | 5,155 (1.8%) | 7,810 (3.1%) |
| $25,000 to $29,999 | 9,593 (3.4%) | 12,323 (5.0%) |
| $30,000 to $34,999 | 11,199 (3.9%) | 11,987 (4.8%) |
| $35,000 to $39,999 | 10,501 (3.7%) | 12,099 (4.9%) |
| $40,000 to $44,999 | 9,990 (3.5%) | 9,857 (4.0%) |
| $45,000 to $49,999 | 11,668 (4.1%) | 10,971 (4.4%) |
| $50,000 to $54,999 | 10,407 (3.6%) | 10,248 (4.1%) |
| $55,000 to $64,999 | 18,700 (6.5%) | 17,454 (7.0%) |
| $65,000 to $74,999 | 16,359 (5.7%) | 14,917 (6.0%) |
| $75,000 to $99,999 | 36,049 (12.6%) | 27,338 (11.0%) |
| $100,000+ | 92,506 (32.4%) | 38,894 (15.6%) |
| Total | 285,982 (100.0%) | 248,648 (100.0%) |
Earnings by Sex by Educational Attainment in DuPage County
Average earnings in DuPage County are $77,400 for men and $50,542 for women, a difference of 34.7%. Men with an educational attainment of graduate degree enjoy the highest average annual earnings of $124,957, while those with less than high school education earn the least with $39,853. Women with an educational attainment of graduate degree earn the most with the average annual earnings of $80,754, while those with less than high school education have the smallest earnings of $24,814.
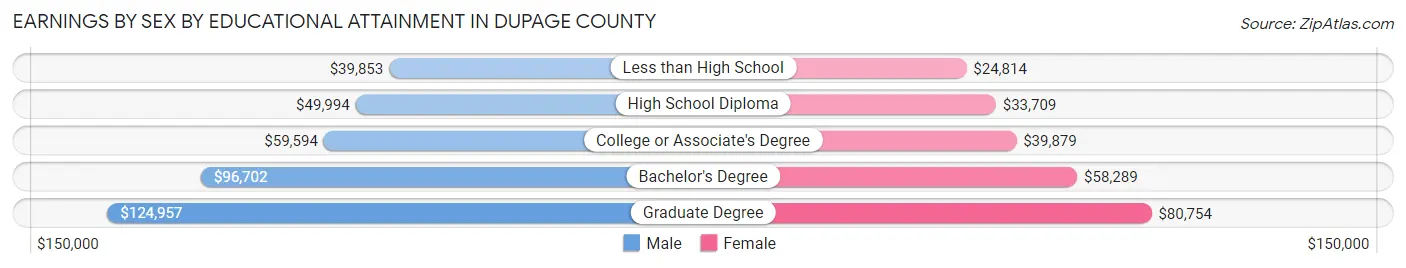
| Educational Attainment | Male Income | Female Income |
| Less than High School | $39,853 | $24,814 |
| High School Diploma | $49,994 | $33,709 |
| College or Associate's Degree | $59,594 | $39,879 |
| Bachelor's Degree | $96,702 | $58,289 |
| Graduate Degree | $124,957 | $80,754 |
| Total | $77,400 | $50,542 |
Family Income in DuPage County
Family Income Brackets in DuPage County
According to the DuPage County family income data, there are 65,015 families falling into the $200,000+ income range, which is the most common income bracket and makes up 26.6% of all families. Conversely, the $10,000 to $14,999 income bracket is the least frequent group with only 2,200 families (0.9%) belonging to this category.
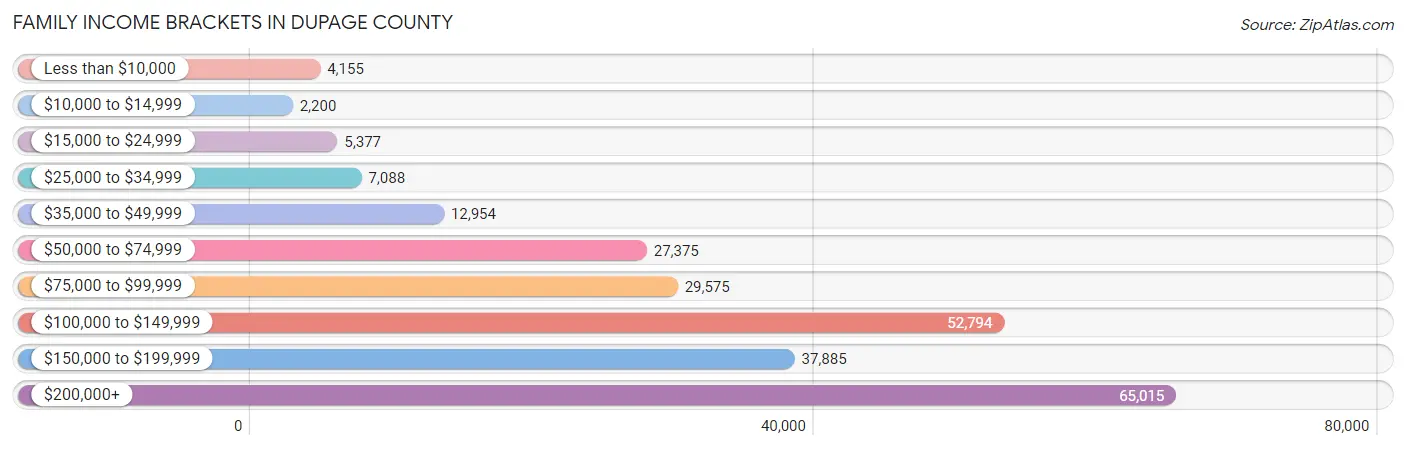
| Income Bracket | # Families | % Families |
| Less than $10,000 | 4,155 | 1.7% |
| $10,000 to $14,999 | 2,200 | 0.9% |
| $15,000 to $24,999 | 5,377 | 2.2% |
| $25,000 to $34,999 | 7,088 | 2.9% |
| $35,000 to $49,999 | 12,954 | 5.3% |
| $50,000 to $74,999 | 27,375 | 11.2% |
| $75,000 to $99,999 | 29,575 | 12.1% |
| $100,000 to $149,999 | 52,794 | 21.6% |
| $150,000 to $199,999 | 37,885 | 15.5% |
| $200,000+ | 65,015 | 26.6% |
Family Income by Famaliy Size in DuPage County
4-person families (52,226 | 21.4%) account for the highest median family income in DuPage County with $160,723 per family, while 2-person families (104,723 | 42.8%) have the highest median income of $55,733 per family member.

| Income Bracket | # Families | Median Income |
| 2-Person Families | 104,723 (42.8%) | $111,466 |
| 3-Person Families | 55,398 (22.7%) | $134,839 |
| 4-Person Families | 52,226 (21.4%) | $160,723 |
| 5-Person Families | 22,289 (9.1%) | $157,505 |
| 6-Person Families | 6,553 (2.7%) | $153,491 |
| 7+ Person Families | 3,229 (1.3%) | $140,580 |
| Total | 244,418 (100.0%) | $131,904 |
Family Income by Number of Earners in DuPage County
The median family income in DuPage County is $131,904, with families comprising 3+ earners (37,493) having the highest median family income of $171,109, while families with no earners (26,911) have the lowest median family income of $69,030, accounting for 15.3% and 11.0% of families, respectively.
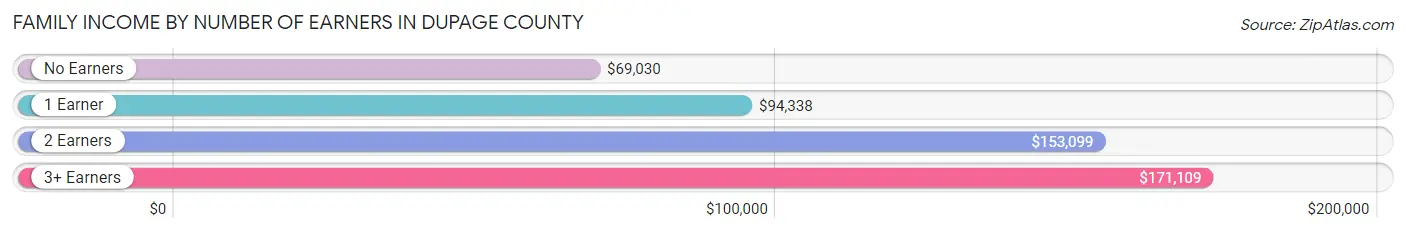
| Number of Earners | # Families | Median Income |
| No Earners | 26,911 (11.0%) | $69,030 |
| 1 Earner | 66,409 (27.2%) | $94,338 |
| 2 Earners | 113,605 (46.5%) | $153,099 |
| 3+ Earners | 37,493 (15.3%) | $171,109 |
| Total | 244,418 (100.0%) | $131,904 |
Household Income in DuPage County
Household Income Brackets in DuPage County
With 71,169 households falling in the category, the $200,000+ income range is the most frequent in DuPage County, accounting for 20.4% of all households. In contrast, only 5,582 households (1.6%) fall into the $10,000 to $14,999 income bracket, making it the least populous group.
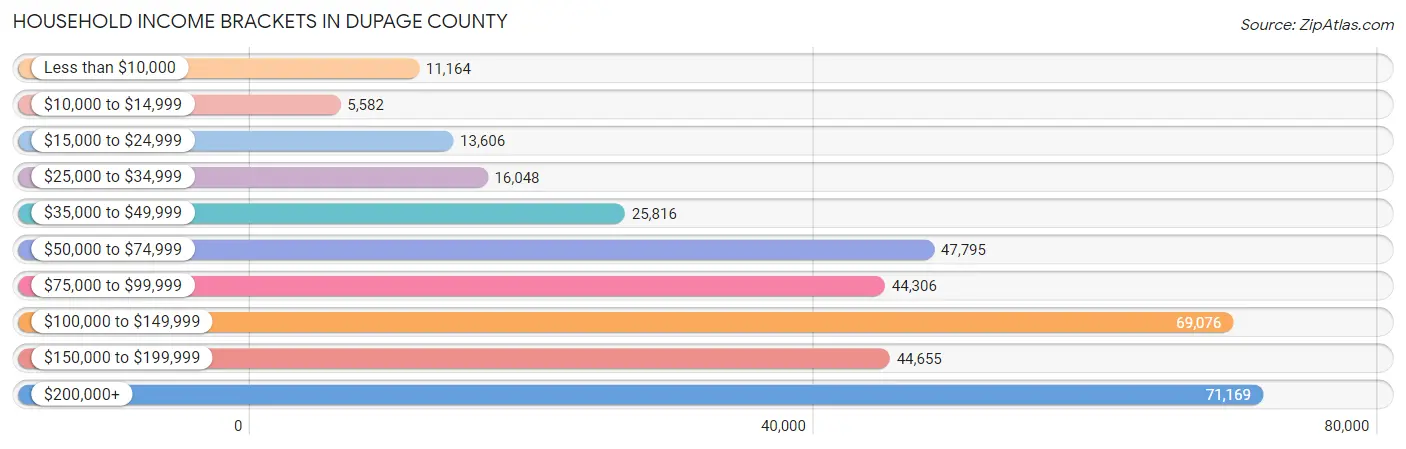
| Income Bracket | # Households | % Households |
| Less than $10,000 | 11,164 | 3.2% |
| $10,000 to $14,999 | 5,582 | 1.6% |
| $15,000 to $24,999 | 13,606 | 3.9% |
| $25,000 to $34,999 | 16,048 | 4.6% |
| $35,000 to $49,999 | 25,816 | 7.4% |
| $50,000 to $74,999 | 47,795 | 13.7% |
| $75,000 to $99,999 | 44,306 | 12.7% |
| $100,000 to $149,999 | 69,076 | 19.8% |
| $150,000 to $199,999 | 44,655 | 12.8% |
| $200,000+ | 71,169 | 20.4% |
Household Income by Householder Age in DuPage County
The median household income in DuPage County is $107,035, with the highest median household income of $131,731 found in the 45 to 64 years age bracket for the primary householder. A total of 137,633 households (39.5%) fall into this category. Meanwhile, the 15 to 24 years age bracket for the primary householder has the lowest median household income of $53,841, with 7,879 households (2.3%) in this group.
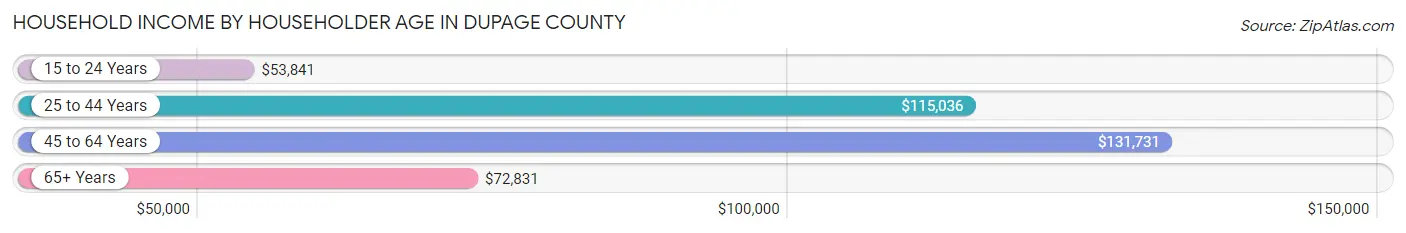
| Income Bracket | # Households | Median Income |
| 15 to 24 Years | 7,879 (2.3%) | $53,841 |
| 25 to 44 Years | 111,405 (31.9%) | $115,036 |
| 45 to 64 Years | 137,633 (39.5%) | $131,731 |
| 65+ Years | 91,953 (26.4%) | $72,831 |
| Total | 348,870 (100.0%) | $107,035 |
Poverty in DuPage County
Income Below Poverty by Sex and Age in DuPage County
With 5.6% poverty level for males and 6.9% for females among the residents of DuPage County, 15 year old males and 15 year old females are the most vulnerable to poverty, with 575 males (8.7%) and 616 females (10.7%) in their respective age groups living below the poverty level.
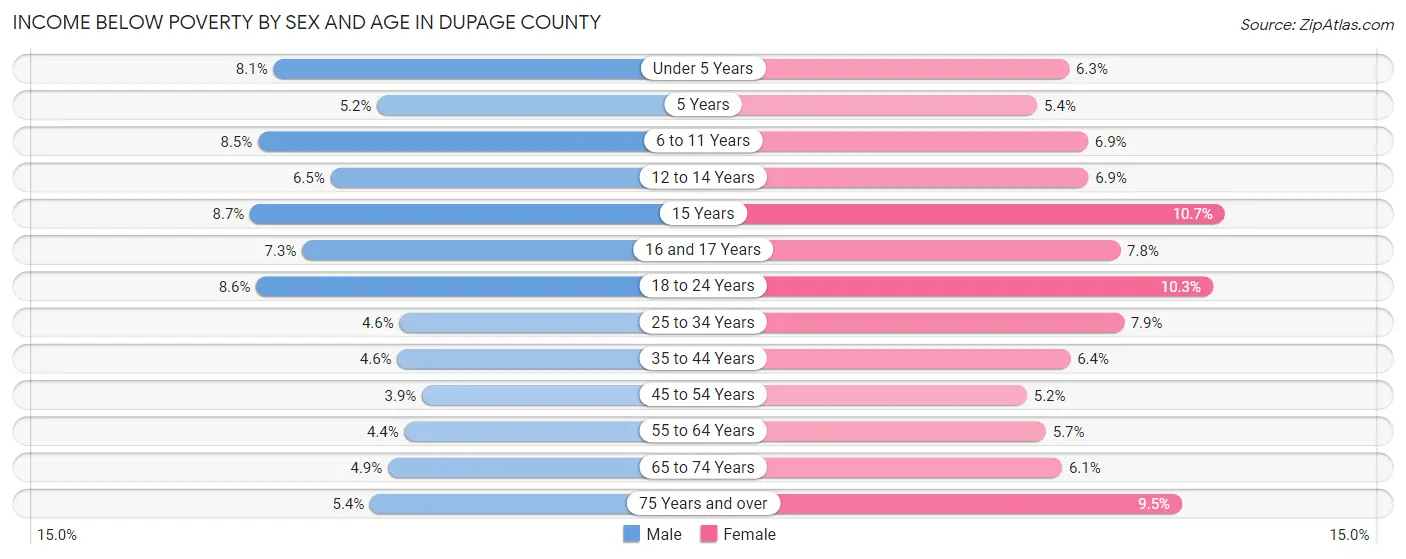
| Age Bracket | Male | Female |
| Under 5 Years | 2,150 (8.1%) | 1,599 (6.3%) |
| 5 Years | 289 (5.2%) | 306 (5.4%) |
| 6 to 11 Years | 3,110 (8.5%) | 2,275 (6.9%) |
| 12 to 14 Years | 1,123 (6.5%) | 1,212 (6.9%) |
| 15 Years | 575 (8.7%) | 616 (10.7%) |
| 16 and 17 Years | 946 (7.3%) | 986 (7.7%) |
| 18 to 24 Years | 3,253 (8.6%) | 3,830 (10.3%) |
| 25 to 34 Years | 2,660 (4.6%) | 4,411 (7.9%) |
| 35 to 44 Years | 2,920 (4.6%) | 3,882 (6.4%) |
| 45 to 54 Years | 2,377 (3.9%) | 3,133 (5.1%) |
| 55 to 64 Years | 2,768 (4.4%) | 3,725 (5.7%) |
| 65 to 74 Years | 2,106 (4.9%) | 2,894 (6.1%) |
| 75 Years and over | 1,283 (5.4%) | 3,245 (9.5%) |
| Total | 25,560 (5.6%) | 32,114 (6.9%) |
Income Above Poverty by Sex and Age in DuPage County
According to the poverty statistics in DuPage County, males aged 45 to 54 years and females aged 45 to 54 years are the age groups that are most secure financially, with 96.1% of males and 94.9% of females in these age groups living above the poverty line.
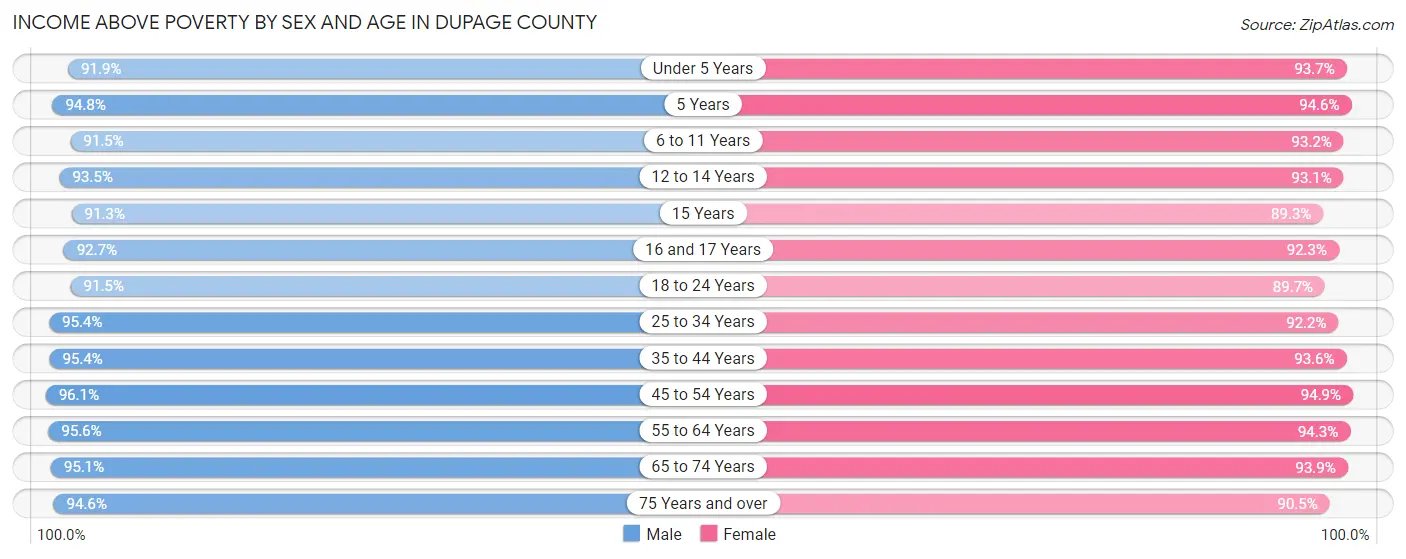
| Age Bracket | Male | Female |
| Under 5 Years | 24,495 (91.9%) | 23,678 (93.7%) |
| 5 Years | 5,288 (94.8%) | 5,321 (94.6%) |
| 6 to 11 Years | 33,492 (91.5%) | 30,915 (93.1%) |
| 12 to 14 Years | 16,214 (93.5%) | 16,464 (93.1%) |
| 15 Years | 6,018 (91.3%) | 5,162 (89.3%) |
| 16 and 17 Years | 12,060 (92.7%) | 11,742 (92.2%) |
| 18 to 24 Years | 34,810 (91.4%) | 33,229 (89.7%) |
| 25 to 34 Years | 55,659 (95.4%) | 51,763 (92.1%) |
| 35 to 44 Years | 60,341 (95.4%) | 57,144 (93.6%) |
| 45 to 54 Years | 58,081 (96.1%) | 57,758 (94.9%) |
| 55 to 64 Years | 59,856 (95.6%) | 61,833 (94.3%) |
| 65 to 74 Years | 41,045 (95.1%) | 44,333 (93.9%) |
| 75 Years and over | 22,555 (94.6%) | 31,024 (90.5%) |
| Total | 429,914 (94.4%) | 430,366 (93.1%) |
Income Below Poverty Among Married-Couple Families in DuPage County
The poverty statistics for married-couple families in DuPage County show that 2.7% or 5,439 of the total 198,896 families live below the poverty line. Families with 3 or 4 children have the highest poverty rate of 6.7%, comprising of 1,104 families. On the other hand, families with 1 or 2 children have the lowest poverty rate of 2.3%, which includes 1,626 families.
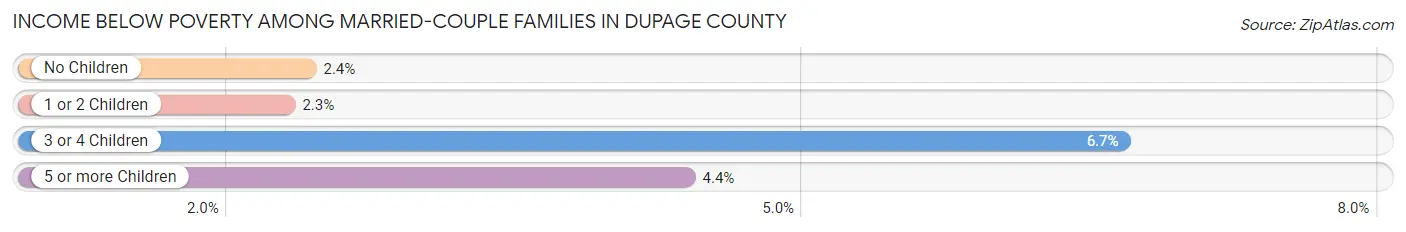
| Children | Above Poverty | Below Poverty |
| No Children | 108,341 (97.6%) | 2,680 (2.4%) |
| 1 or 2 Children | 69,017 (97.7%) | 1,626 (2.3%) |
| 3 or 4 Children | 15,467 (93.3%) | 1,104 (6.7%) |
| 5 or more Children | 632 (95.6%) | 29 (4.4%) |
| Total | 193,457 (97.3%) | 5,439 (2.7%) |
Income Below Poverty Among Single-Parent Households in DuPage County
According to the poverty data in DuPage County, 6.7% or 898 single-father households and 14.3% or 4,589 single-mother households are living below the poverty line. Among single-father households, those with 3 or 4 children have the highest poverty rate, with 83 households (12.4%) experiencing poverty. Likewise, among single-mother households, those with 5 or more children have the highest poverty rate, with 68 households (78.2%) falling below the poverty line.
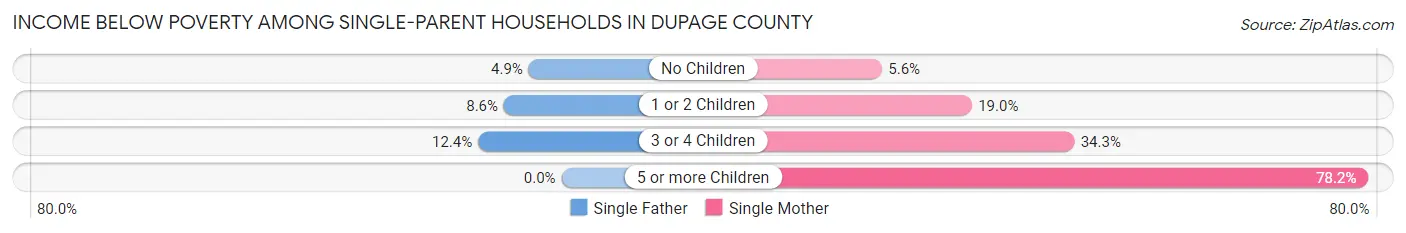
| Children | Single Father | Single Mother |
| No Children | 379 (4.9%) | 813 (5.6%) |
| 1 or 2 Children | 436 (8.6%) | 2,824 (19.0%) |
| 3 or 4 Children | 83 (12.4%) | 884 (34.3%) |
| 5 or more Children | 0 (0.0%) | 68 (78.2%) |
| Total | 898 (6.7%) | 4,589 (14.3%) |
Income Below Poverty Among Married-Couple vs Single-Parent Households in DuPage County
The poverty data for DuPage County shows that 5,439 of the married-couple family households (2.7%) and 5,487 of the single-parent households (12.0%) are living below the poverty level. Within the married-couple family households, those with 3 or 4 children have the highest poverty rate, with 1,104 households (6.7%) falling below the poverty line. Among the single-parent households, those with 5 or more children have the highest poverty rate, with 68 household (78.2%) living below poverty.
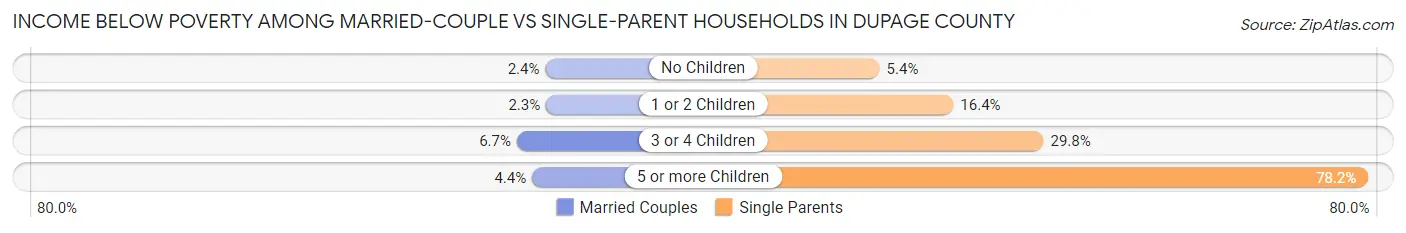
| Children | Married-Couple Families | Single-Parent Households |
| No Children | 2,680 (2.4%) | 1,192 (5.4%) |
| 1 or 2 Children | 1,626 (2.3%) | 3,260 (16.4%) |
| 3 or 4 Children | 1,104 (6.7%) | 967 (29.8%) |
| 5 or more Children | 29 (4.4%) | 68 (78.2%) |
| Total | 5,439 (2.7%) | 5,487 (12.0%) |
Employment Characteristics in DuPage County
Employment by Class of Employer in DuPage County
Among the 480,623 employed individuals in DuPage County, private company employees (349,896 | 72.8%), not-for-profit organizations (38,719 | 8.1%), and local government employees (32,043 | 6.7%) make up the most common classes of employment.
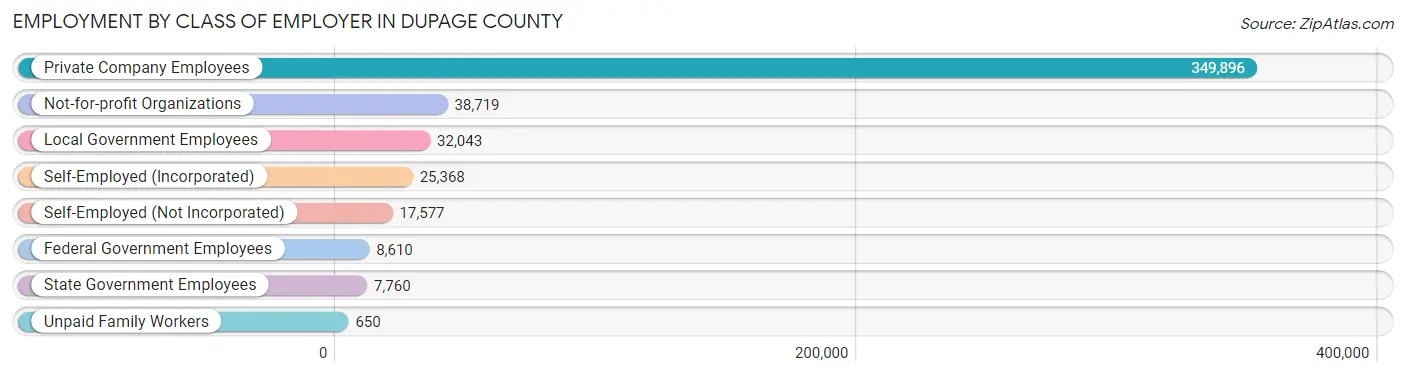
| Employer Class | # Employees | % Employees |
| Private Company Employees | 349,896 | 72.8% |
| Self-Employed (Incorporated) | 25,368 | 5.3% |
| Self-Employed (Not Incorporated) | 17,577 | 3.7% |
| Not-for-profit Organizations | 38,719 | 8.1% |
| Local Government Employees | 32,043 | 6.7% |
| State Government Employees | 7,760 | 1.6% |
| Federal Government Employees | 8,610 | 1.8% |
| Unpaid Family Workers | 650 | 0.1% |
| Total | 480,623 | 100.0% |
Employment Status by Age in DuPage County
According to the labor force statistics for DuPage County, out of the total population over 16 years of age (748,929), 68.7% or 514,514 individuals are in the labor force, with 4.7% or 24,182 of them unemployed. The age group with the highest labor force participation rate is 45 to 54 years, with 88.0% or 106,997 individuals in the labor force. Within the labor force, the 16 to 19 years age range has the highest percentage of unemployed individuals, with 12.5% or 2,627 of them being unemployed.
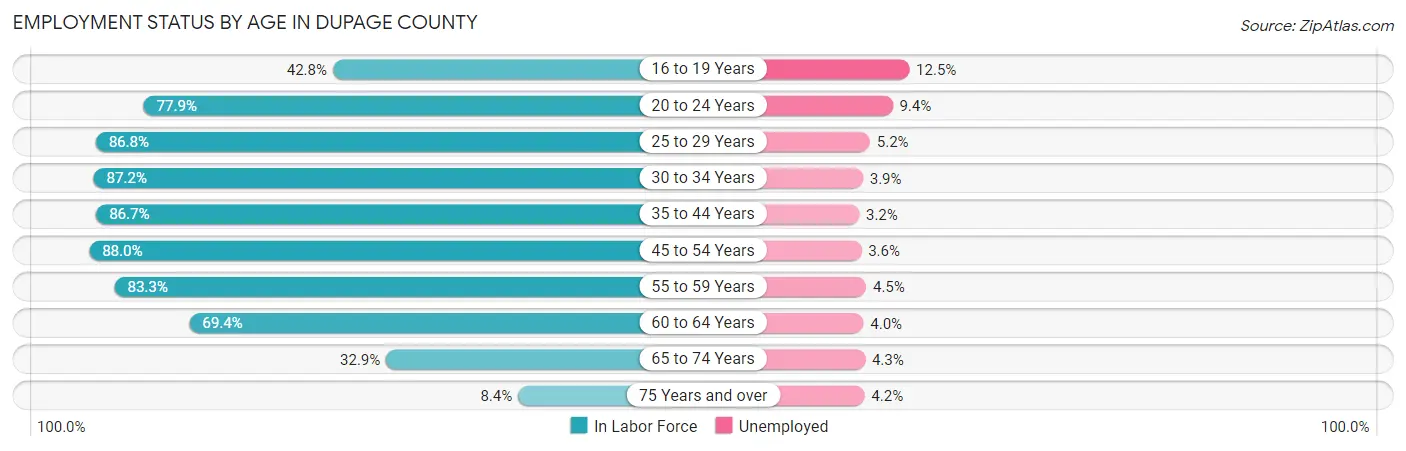
| Age Bracket | In Labor Force | Unemployed |
| 16 to 19 Years | 21,014 (42.8%) | 2,627 (12.5%) |
| 20 to 24 Years | 44,364 (77.9%) | 4,170 (9.4%) |
| 25 to 29 Years | 48,767 (86.8%) | 2,536 (5.2%) |
| 30 to 34 Years | 51,279 (87.2%) | 2,000 (3.9%) |
| 35 to 44 Years | 107,940 (86.7%) | 3,454 (3.2%) |
| 45 to 54 Years | 106,997 (88.0%) | 3,852 (3.6%) |
| 55 to 59 Years | 55,878 (83.3%) | 2,515 (4.5%) |
| 60 to 64 Years | 42,825 (69.4%) | 1,713 (4.0%) |
| 65 to 74 Years | 29,941 (32.9%) | 1,287 (4.3%) |
| 75 Years and over | 5,209 (8.4%) | 219 (4.2%) |
| Total | 514,514 (68.7%) | 24,182 (4.7%) |
Employment Status by Educational Attainment in DuPage County
According to labor force statistics for DuPage County, 84.5% of individuals (413,933) out of the total population between 25 and 64 years of age (489,862) are in the labor force, with 3.9% or 16,143 of them being unemployed. The group with the highest labor force participation rate are those with the educational attainment of bachelor's degree or higher, with 87.3% or 230,822 individuals in the labor force. Within the labor force, individuals with less than high school education have the highest percentage of unemployment, with 5.9% or 1,240 of them being unemployed.

| Educational Attainment | In Labor Force | Unemployed |
| Less than High School | 21,017 (73.0%) | 1,699 (5.9%) |
| High School Diploma | 63,445 (79.4%) | 4,075 (5.1%) |
| College / Associate Degree | 98,434 (84.3%) | 5,605 (4.8%) |
| Bachelor's Degree or higher | 230,822 (87.3%) | 7,932 (3.0%) |
| Total | 413,933 (84.5%) | 19,105 (3.9%) |
Employment Occupations by Sex in DuPage County
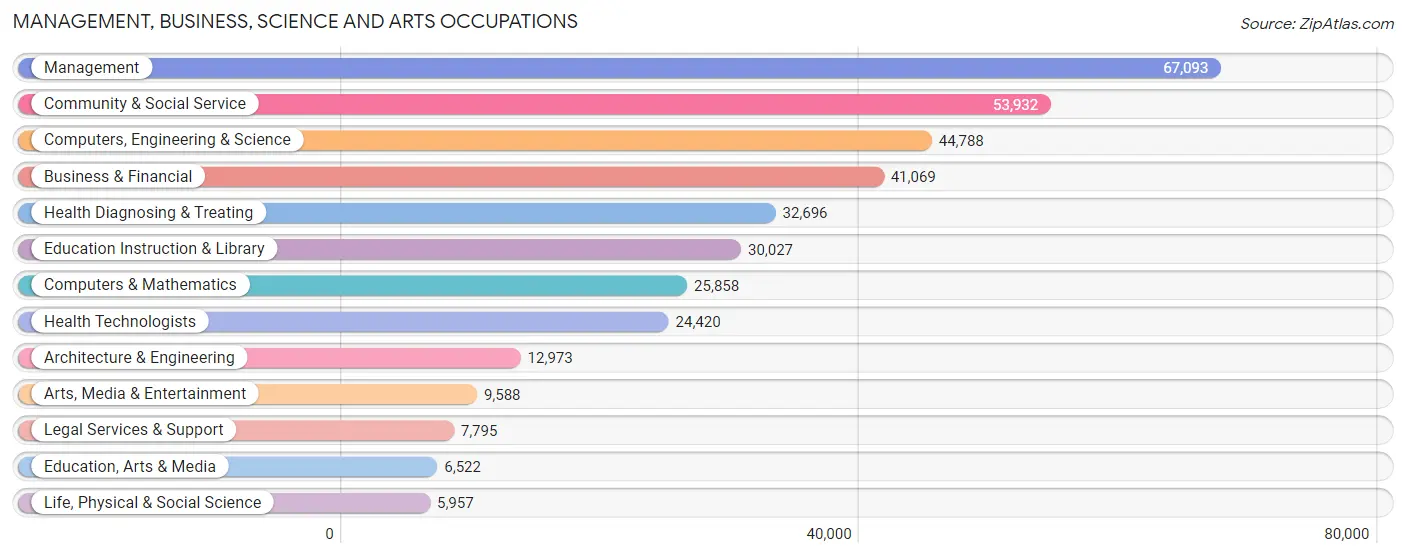
Management, Business, Science and Arts Occupations
The most common Management, Business, Science and Arts occupations in DuPage County are Management (67,093 | 13.7%), Community & Social Service (53,932 | 11.0%), Computers, Engineering & Science (44,788 | 9.1%), Business & Financial (41,069 | 8.4%), and Health Diagnosing & Treating (32,696 | 6.7%).
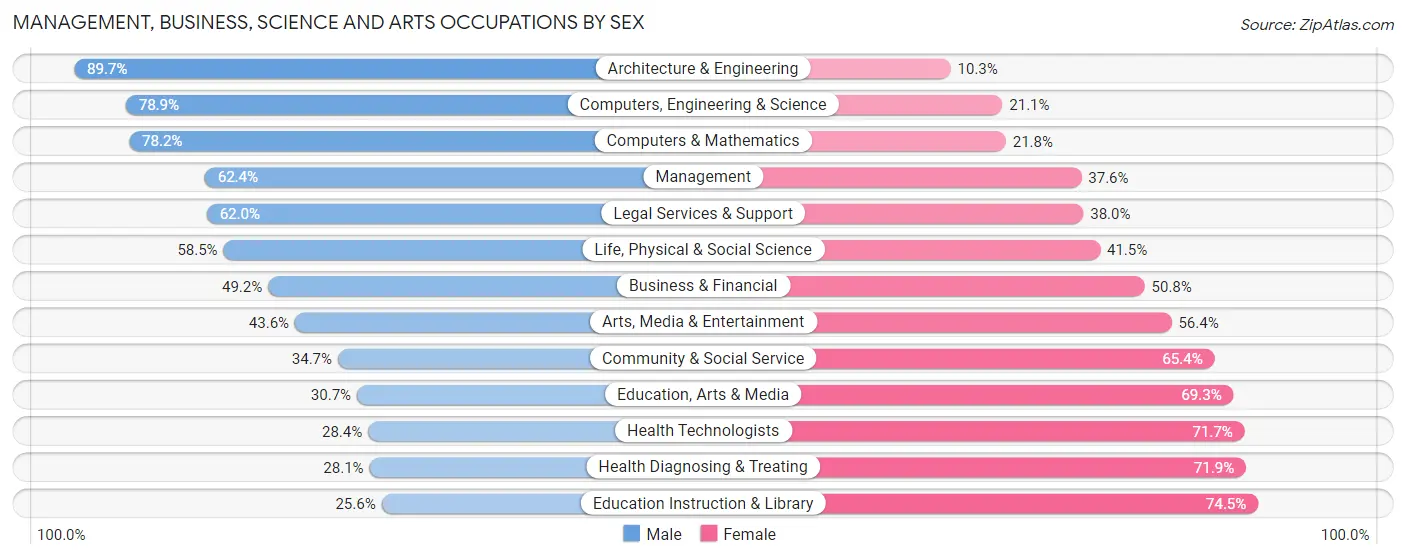
Management, Business, Science and Arts Occupations by Sex
Within the Management, Business, Science and Arts occupations in DuPage County, the most male-oriented occupations are Architecture & Engineering (89.7%), Computers, Engineering & Science (78.9%), and Computers & Mathematics (78.2%), while the most female-oriented occupations are Education Instruction & Library (74.5%), Health Diagnosing & Treating (71.9%), and Health Technologists (71.7%).
| Occupation | Male | Female |
| Management | 41,876 (62.4%) | 25,217 (37.6%) |
| Business & Financial | 20,215 (49.2%) | 20,854 (50.8%) |
| Computers, Engineering & Science | 35,335 (78.9%) | 9,453 (21.1%) |
| Computers & Mathematics | 20,215 (78.2%) | 5,643 (21.8%) |
| Architecture & Engineering | 11,634 (89.7%) | 1,339 (10.3%) |
| Life, Physical & Social Science | 3,486 (58.5%) | 2,471 (41.5%) |
| Community & Social Service | 18,689 (34.6%) | 35,243 (65.3%) |
| Education, Arts & Media | 2,001 (30.7%) | 4,521 (69.3%) |
| Legal Services & Support | 4,834 (62.0%) | 2,961 (38.0%) |
| Education Instruction & Library | 7,673 (25.6%) | 22,354 (74.5%) |
| Arts, Media & Entertainment | 4,181 (43.6%) | 5,407 (56.4%) |
| Health Diagnosing & Treating | 9,179 (28.1%) | 23,517 (71.9%) |
| Health Technologists | 6,922 (28.3%) | 17,498 (71.7%) |
| Total (Category) | 125,294 (52.3%) | 114,284 (47.7%) |
| Total (Overall) | 263,578 (53.9%) | 225,822 (46.1%) |
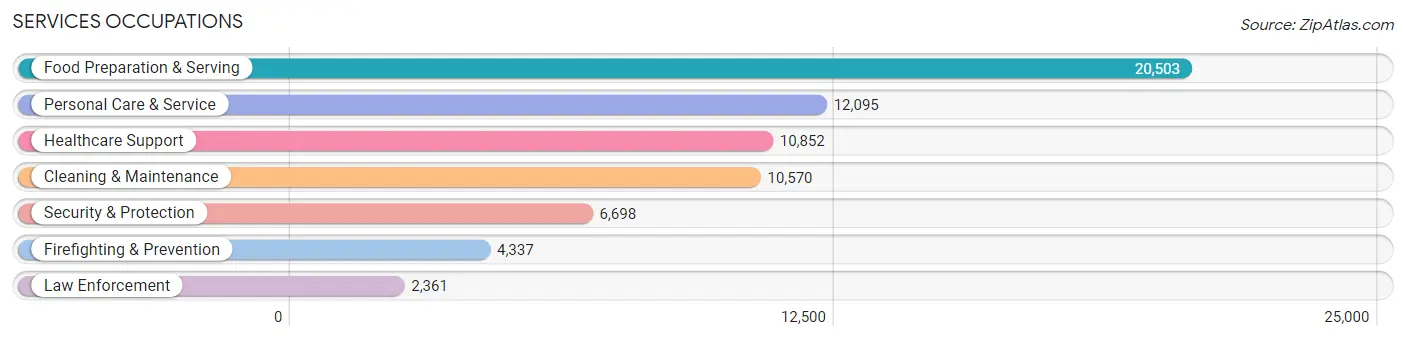
Services Occupations
The most common Services occupations in DuPage County are Food Preparation & Serving (20,503 | 4.2%), Personal Care & Service (12,095 | 2.5%), Healthcare Support (10,852 | 2.2%), Cleaning & Maintenance (10,570 | 2.2%), and Security & Protection (6,698 | 1.4%).
Services Occupations by Sex
Within the Services occupations in DuPage County, the most male-oriented occupations are Law Enforcement (82.5%), Security & Protection (74.2%), and Firefighting & Prevention (69.7%), while the most female-oriented occupations are Healthcare Support (87.2%), Personal Care & Service (77.1%), and Food Preparation & Serving (52.2%).
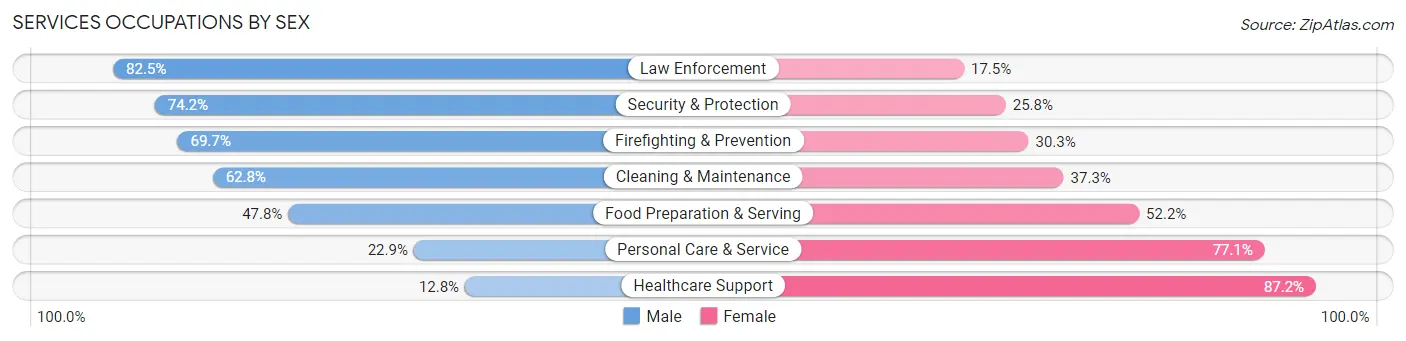
| Occupation | Male | Female |
| Healthcare Support | 1,389 (12.8%) | 9,463 (87.2%) |
| Security & Protection | 4,970 (74.2%) | 1,728 (25.8%) |
| Firefighting & Prevention | 3,023 (69.7%) | 1,314 (30.3%) |
| Law Enforcement | 1,947 (82.5%) | 414 (17.5%) |
| Food Preparation & Serving | 9,800 (47.8%) | 10,703 (52.2%) |
| Cleaning & Maintenance | 6,633 (62.7%) | 3,937 (37.2%) |
| Personal Care & Service | 2,775 (22.9%) | 9,320 (77.1%) |
| Total (Category) | 25,567 (42.1%) | 35,151 (57.9%) |
| Total (Overall) | 263,578 (53.9%) | 225,822 (46.1%) |
Sales and Office Occupations
The most common Sales and Office occupations in DuPage County are Sales & Related (53,838 | 11.0%), and Office & Administration (52,727 | 10.8%).

Sales and Office Occupations by Sex

| Occupation | Male | Female |
| Sales & Related | 30,617 (56.9%) | 23,221 (43.1%) |
| Office & Administration | 14,352 (27.2%) | 38,375 (72.8%) |
| Total (Category) | 44,969 (42.2%) | 61,596 (57.8%) |
| Total (Overall) | 263,578 (53.9%) | 225,822 (46.1%) |
Natural Resources, Construction and Maintenance Occupations
The most common Natural Resources, Construction and Maintenance occupations in DuPage County are Construction & Extraction (15,109 | 3.1%), Installation, Maintenance & Repair (10,440 | 2.1%), and Farming, Fishing & Forestry (654 | 0.1%).

Natural Resources, Construction and Maintenance Occupations by Sex

| Occupation | Male | Female |
| Farming, Fishing & Forestry | 465 (71.1%) | 189 (28.9%) |
| Construction & Extraction | 14,868 (98.4%) | 241 (1.6%) |
| Installation, Maintenance & Repair | 10,158 (97.3%) | 282 (2.7%) |
| Total (Category) | 25,491 (97.3%) | 712 (2.7%) |
| Total (Overall) | 263,578 (53.9%) | 225,822 (46.1%) |
Production, Transportation and Moving Occupations
The most common Production, Transportation and Moving occupations in DuPage County are Production (21,872 | 4.5%), Transportation (17,253 | 3.5%), and Material Moving (17,211 | 3.5%).
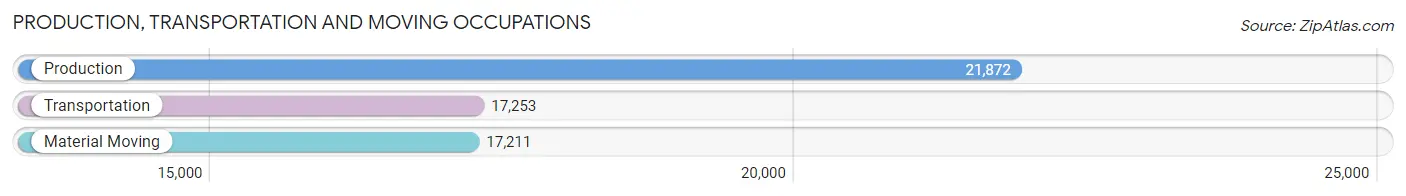
Production, Transportation and Moving Occupations by Sex

| Occupation | Male | Female |
| Production | 14,995 (68.6%) | 6,877 (31.4%) |
| Transportation | 15,058 (87.3%) | 2,195 (12.7%) |
| Material Moving | 12,204 (70.9%) | 5,007 (29.1%) |
| Total (Category) | 42,257 (75.0%) | 14,079 (25.0%) |
| Total (Overall) | 263,578 (53.9%) | 225,822 (46.1%) |
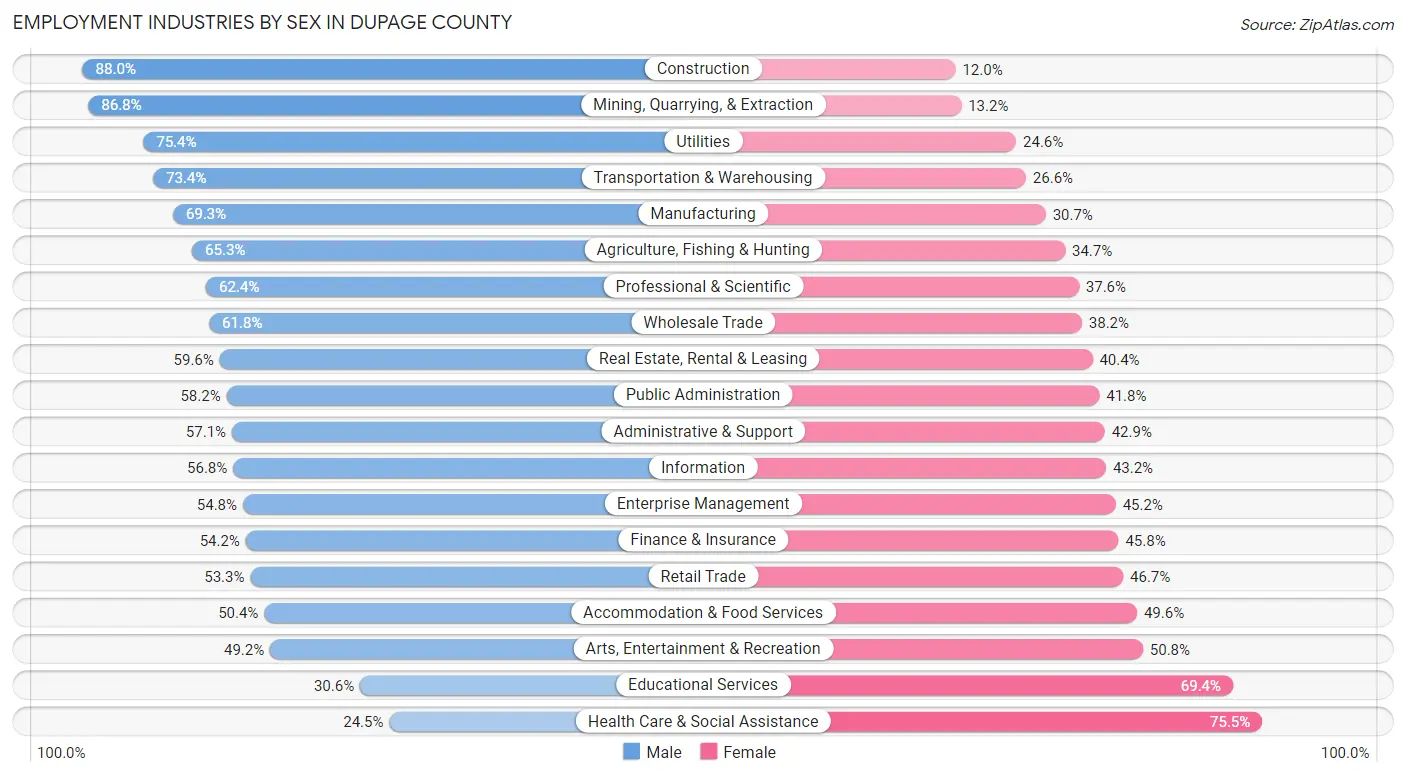
Employment Industries by Sex in DuPage County
Employment Industries in DuPage County
The major employment industries in DuPage County include Health Care & Social Assistance (61,482 | 12.6%), Manufacturing (59,848 | 12.2%), Professional & Scientific (56,676 | 11.6%), Retail Trade (48,718 | 10.0%), and Educational Services (43,614 | 8.9%).

Employment Industries by Sex in DuPage County
The DuPage County industries that see more men than women are Construction (88.0%), Mining, Quarrying, & Extraction (86.8%), and Utilities (75.4%), whereas the industries that tend to have a higher number of women are Health Care & Social Assistance (75.5%), Educational Services (69.4%), and Arts, Entertainment & Recreation (50.8%).
| Industry | Male | Female |
| Agriculture, Fishing & Hunting | 738 (65.3%) | 392 (34.7%) |
| Mining, Quarrying, & Extraction | 322 (86.8%) | 49 (13.2%) |
| Construction | 21,589 (88.0%) | 2,950 (12.0%) |
| Manufacturing | 41,483 (69.3%) | 18,365 (30.7%) |
| Wholesale Trade | 11,181 (61.8%) | 6,904 (38.2%) |
| Retail Trade | 25,956 (53.3%) | 22,762 (46.7%) |
| Transportation & Warehousing | 20,983 (73.4%) | 7,606 (26.6%) |
| Utilities | 1,738 (75.4%) | 566 (24.6%) |
| Information | 5,756 (56.8%) | 4,371 (43.2%) |
| Finance & Insurance | 18,518 (54.2%) | 15,624 (45.8%) |
| Real Estate, Rental & Leasing | 5,647 (59.6%) | 3,823 (40.4%) |
| Professional & Scientific | 35,391 (62.4%) | 21,285 (37.6%) |
| Enterprise Management | 808 (54.8%) | 666 (45.2%) |
| Administrative & Support | 10,470 (57.1%) | 7,868 (42.9%) |
| Educational Services | 13,338 (30.6%) | 30,276 (69.4%) |
| Health Care & Social Assistance | 15,076 (24.5%) | 46,406 (75.5%) |
| Arts, Entertainment & Recreation | 5,560 (49.2%) | 5,740 (50.8%) |
| Accommodation & Food Services | 13,913 (50.4%) | 13,685 (49.6%) |
| Public Administration | 6,407 (58.2%) | 4,599 (41.8%) |
| Total | 263,578 (53.9%) | 225,822 (46.1%) |
Education in DuPage County
School Enrollment in DuPage County
The most common levels of schooling among the 234,170 students in DuPage County are high school (50,994 | 21.8%), college / undergraduate (47,919 | 20.5%), and middle school (45,993 | 19.6%).
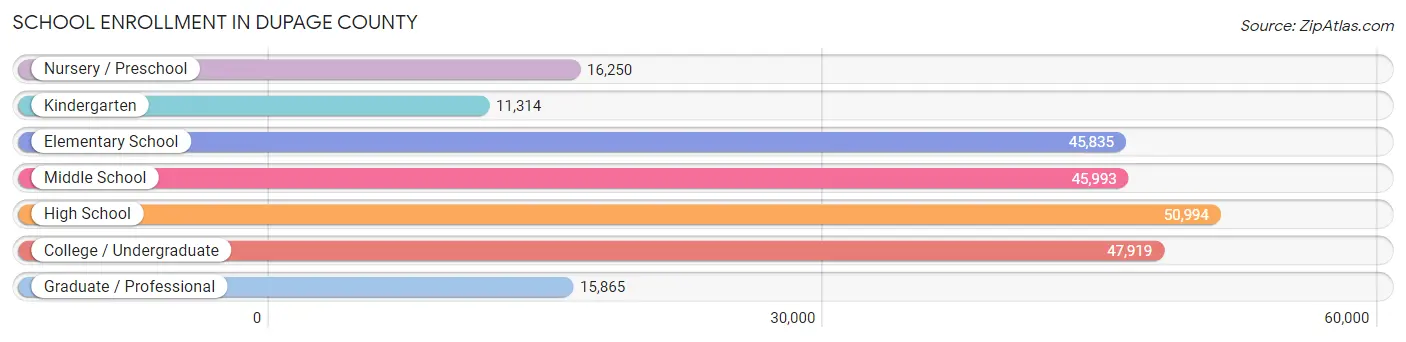
| School Level | # Students | % Students |
| Nursery / Preschool | 16,250 | 6.9% |
| Kindergarten | 11,314 | 4.8% |
| Elementary School | 45,835 | 19.6% |
| Middle School | 45,993 | 19.6% |
| High School | 50,994 | 21.8% |
| College / Undergraduate | 47,919 | 20.5% |
| Graduate / Professional | 15,865 | 6.8% |
| Total | 234,170 | 100.0% |
School Enrollment by Age by Funding Source in DuPage County
Out of a total of 234,170 students who are enrolled in schools in DuPage County, 51,752 (22.1%) attend a private institution, while the remaining 182,418 (77.9%) are enrolled in public schools. The age group of 3 to 4 year olds has the highest likelihood of being enrolled in private schools, with 6,716 (55.6% in the age bracket) enrolled. Conversely, the age group of 15 to 17 year olds has the lowest likelihood of being enrolled in a private school, with 34,204 (91.1% in the age bracket) attending a public institution.
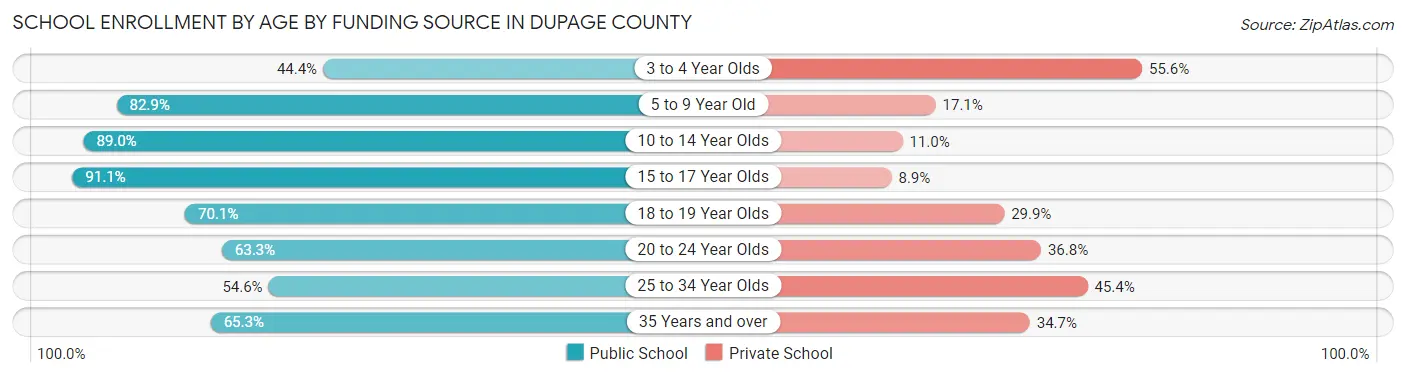
| Age Bracket | Public School | Private School |
| 3 to 4 Year Olds | 5,370 (44.4%) | 6,716 (55.6%) |
| 5 to 9 Year Old | 46,314 (82.9%) | 9,572 (17.1%) |
| 10 to 14 Year Olds | 51,335 (89.0%) | 6,328 (11.0%) |
| 15 to 17 Year Olds | 34,204 (91.1%) | 3,344 (8.9%) |
| 18 to 19 Year Olds | 13,397 (70.1%) | 5,713 (29.9%) |
| 20 to 24 Year Olds | 17,451 (63.2%) | 10,140 (36.7%) |
| 25 to 34 Year Olds | 7,205 (54.6%) | 5,997 (45.4%) |
| 35 Years and over | 7,241 (65.3%) | 3,843 (34.7%) |
| Total | 182,418 (77.9%) | 51,752 (22.1%) |
Educational Attainment by Field of Study in DuPage County
Business (83,588 | 23.7%), education (35,132 | 10.0%), engineering (33,255 | 9.4%), science & technology (32,532 | 9.2%), and social sciences (24,750 | 7.0%) are the most common fields of study among 353,159 individuals in DuPage County who have obtained a bachelor's degree or higher.
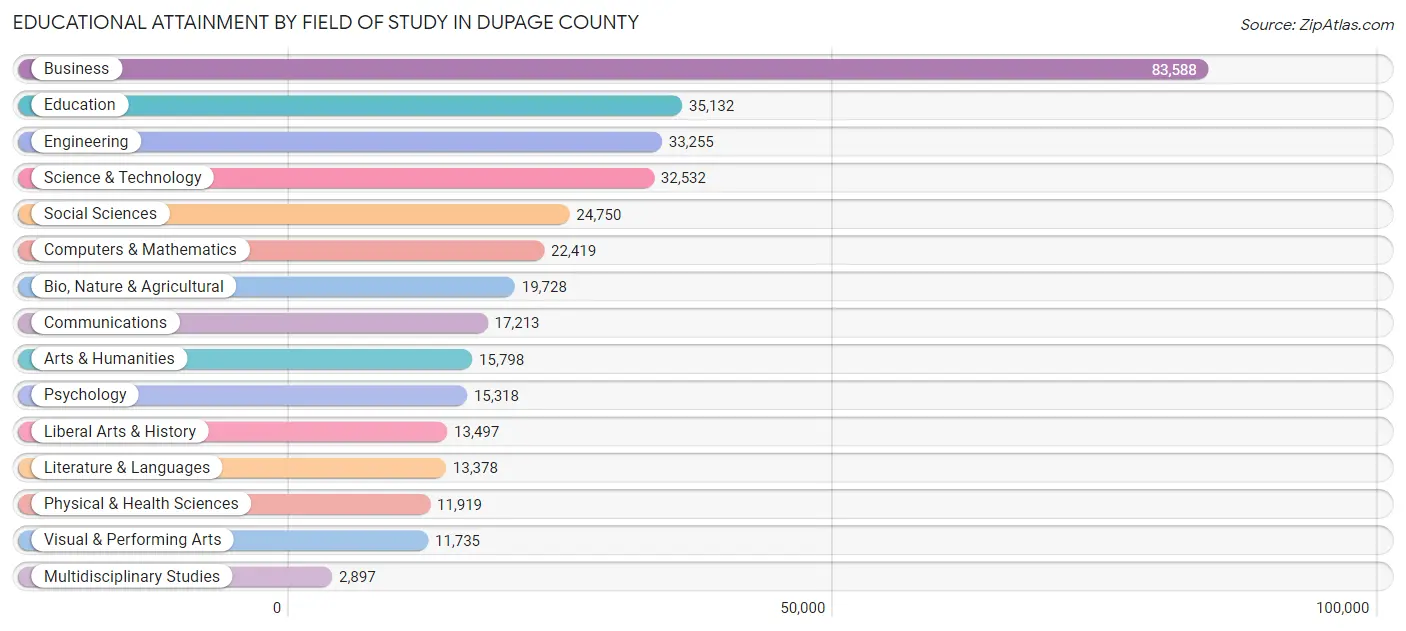
| Field of Study | # Graduates | % Graduates |
| Computers & Mathematics | 22,419 | 6.4% |
| Bio, Nature & Agricultural | 19,728 | 5.6% |
| Physical & Health Sciences | 11,919 | 3.4% |
| Psychology | 15,318 | 4.3% |
| Social Sciences | 24,750 | 7.0% |
| Engineering | 33,255 | 9.4% |
| Multidisciplinary Studies | 2,897 | 0.8% |
| Science & Technology | 32,532 | 9.2% |
| Business | 83,588 | 23.7% |
| Education | 35,132 | 10.0% |
| Literature & Languages | 13,378 | 3.8% |
| Liberal Arts & History | 13,497 | 3.8% |
| Visual & Performing Arts | 11,735 | 3.3% |
| Communications | 17,213 | 4.9% |
| Arts & Humanities | 15,798 | 4.5% |
| Total | 353,159 | 100.0% |
Transportation & Commute in DuPage County
Vehicle Availability by Sex in DuPage County
The most prevalent vehicle ownership categories in DuPage County are males with 2 vehicles (122,989, accounting for 47.6%) and females with 2 vehicles (101,295, making up 55.9%).
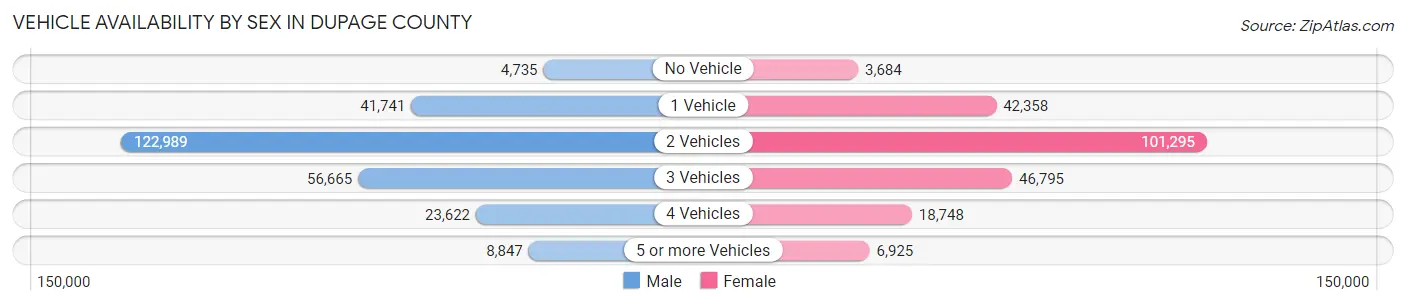
| Vehicles Available | Male | Female |
| No Vehicle | 4,735 (1.8%) | 3,684 (1.7%) |
| 1 Vehicle | 41,741 (16.1%) | 42,358 (19.3%) |
| 2 Vehicles | 122,989 (47.6%) | 101,295 (46.1%) |
| 3 Vehicles | 56,665 (21.9%) | 46,795 (21.3%) |
| 4 Vehicles | 23,622 (9.1%) | 18,748 (8.5%) |
| 5 or more Vehicles | 8,847 (3.4%) | 6,925 (3.2%) |
| Total | 258,599 (100.0%) | 219,805 (100.0%) |
Commute Time in DuPage County
The most frequently occuring commute durations in DuPage County are 15 to 19 minutes (56,622 commuters, 14.2%), 30 to 34 minutes (55,881 commuters, 14.0%), and 20 to 24 minutes (51,981 commuters, 13.0%).
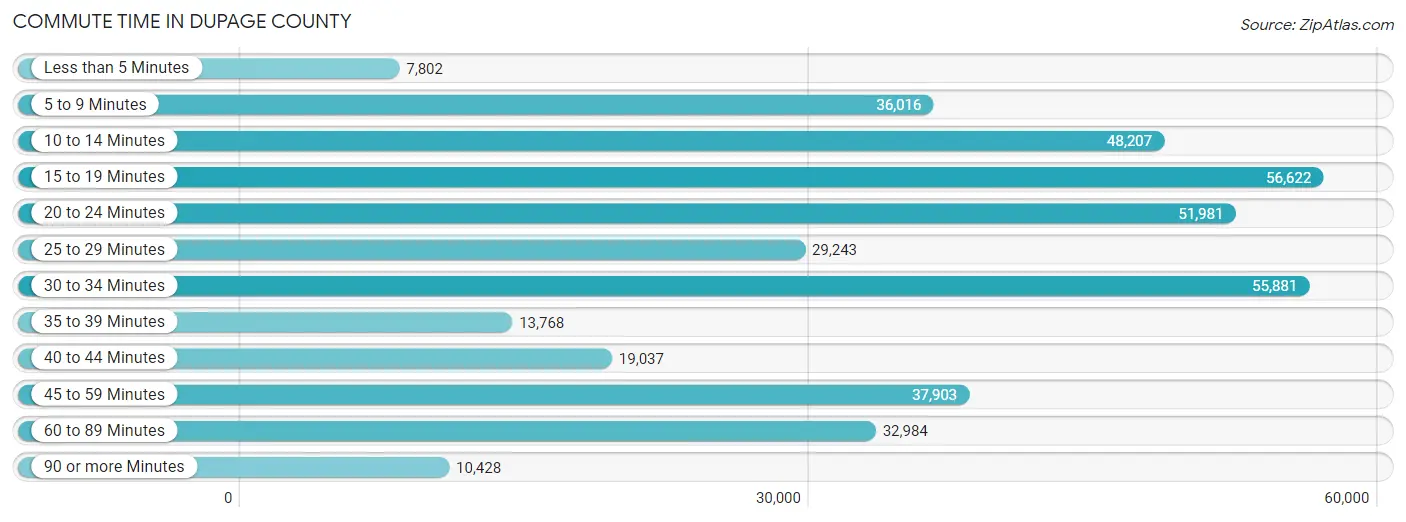
| Commute Time | # Commuters | % Commuters |
| Less than 5 Minutes | 7,802 | 1.9% |
| 5 to 9 Minutes | 36,016 | 9.0% |
| 10 to 14 Minutes | 48,207 | 12.1% |
| 15 to 19 Minutes | 56,622 | 14.2% |
| 20 to 24 Minutes | 51,981 | 13.0% |
| 25 to 29 Minutes | 29,243 | 7.3% |
| 30 to 34 Minutes | 55,881 | 14.0% |
| 35 to 39 Minutes | 13,768 | 3.4% |
| 40 to 44 Minutes | 19,037 | 4.8% |
| 45 to 59 Minutes | 37,903 | 9.5% |
| 60 to 89 Minutes | 32,984 | 8.3% |
| 90 or more Minutes | 10,428 | 2.6% |
Commute Time by Sex in DuPage County
The most common commute times in DuPage County are 30 to 34 minutes (31,310 commuters, 14.4%) for males and 15 to 19 minutes (27,700 commuters, 15.2%) for females.
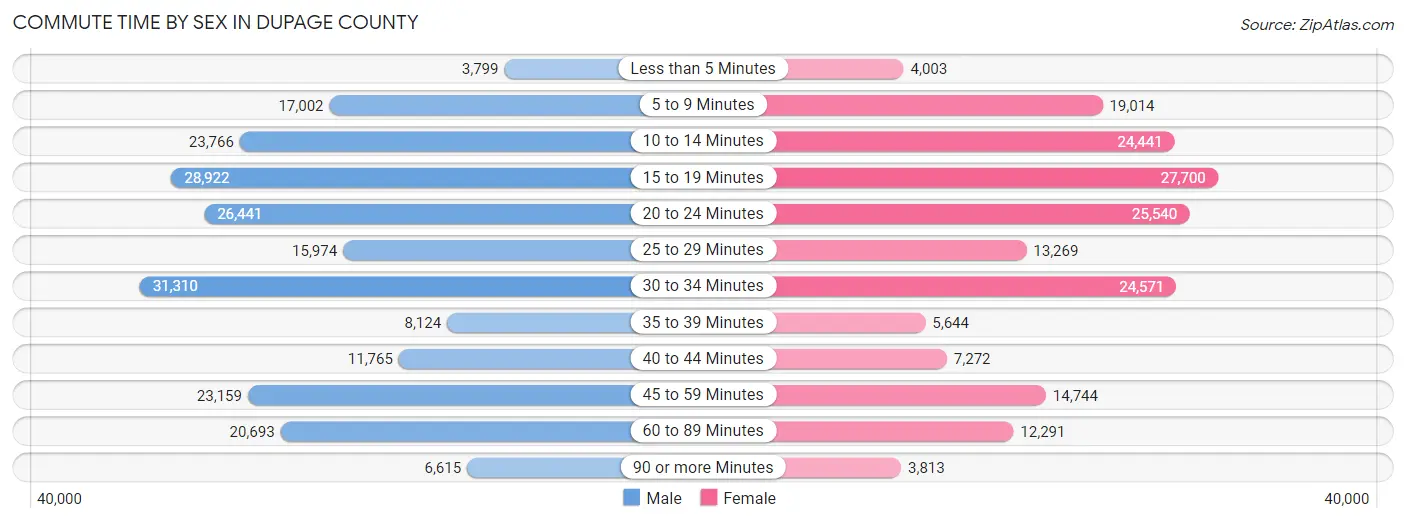
| Commute Time | Male | Female |
| Less than 5 Minutes | 3,799 (1.8%) | 4,003 (2.2%) |
| 5 to 9 Minutes | 17,002 (7.8%) | 19,014 (10.4%) |
| 10 to 14 Minutes | 23,766 (10.9%) | 24,441 (13.4%) |
| 15 to 19 Minutes | 28,922 (13.3%) | 27,700 (15.2%) |
| 20 to 24 Minutes | 26,441 (12.1%) | 25,540 (14.0%) |
| 25 to 29 Minutes | 15,974 (7.3%) | 13,269 (7.3%) |
| 30 to 34 Minutes | 31,310 (14.4%) | 24,571 (13.5%) |
| 35 to 39 Minutes | 8,124 (3.7%) | 5,644 (3.1%) |
| 40 to 44 Minutes | 11,765 (5.4%) | 7,272 (4.0%) |
| 45 to 59 Minutes | 23,159 (10.6%) | 14,744 (8.1%) |
| 60 to 89 Minutes | 20,693 (9.5%) | 12,291 (6.7%) |
| 90 or more Minutes | 6,615 (3.0%) | 3,813 (2.1%) |
Time of Departure to Work by Sex in DuPage County
The most frequent times of departure to work in DuPage County are 7:00 AM to 7:29 AM (32,501, 14.9%) for males and 7:00 AM to 7:29 AM (28,611, 15.7%) for females.

| Time of Departure | Male | Female |
| 12:00 AM to 4:59 AM | 11,516 (5.3%) | 5,127 (2.8%) |
| 5:00 AM to 5:29 AM | 10,254 (4.7%) | 3,191 (1.8%) |
| 5:30 AM to 5:59 AM | 11,868 (5.4%) | 6,350 (3.5%) |
| 6:00 AM to 6:29 AM | 20,898 (9.6%) | 11,534 (6.3%) |
| 6:30 AM to 6:59 AM | 23,122 (10.6%) | 17,934 (9.8%) |
| 7:00 AM to 7:29 AM | 32,501 (14.9%) | 28,611 (15.7%) |
| 7:30 AM to 7:59 AM | 24,202 (11.1%) | 26,110 (14.3%) |
| 8:00 AM to 8:29 AM | 24,634 (11.3%) | 25,118 (13.8%) |
| 8:30 AM to 8:59 AM | 10,645 (4.9%) | 11,527 (6.3%) |
| 9:00 AM to 9:59 AM | 13,111 (6.0%) | 13,733 (7.5%) |
| 10:00 AM to 10:59 AM | 4,741 (2.2%) | 6,392 (3.5%) |
| 11:00 AM to 11:59 AM | 2,873 (1.3%) | 3,313 (1.8%) |
| 12:00 PM to 3:59 PM | 15,961 (7.3%) | 13,011 (7.1%) |
| 4:00 PM to 11:59 PM | 11,244 (5.2%) | 10,351 (5.7%) |
| Total | 217,570 (100.0%) | 182,302 (100.0%) |
Housing Occupancy in DuPage County
Occupancy by Ownership in DuPage County
Of the total 348,870 dwellings in DuPage County, owner-occupied units account for 255,186 (73.2%), while renter-occupied units make up 93,684 (26.9%).
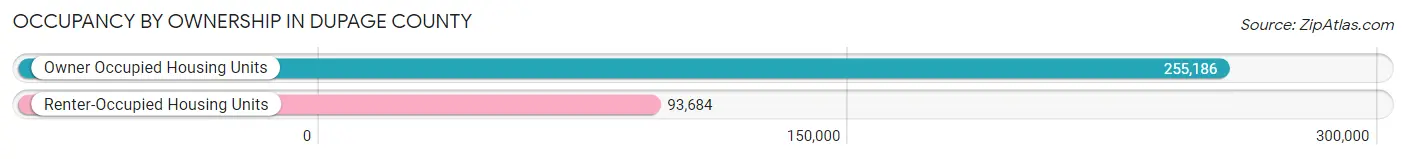
| Occupancy | # Housing Units | % Housing Units |
| Owner Occupied Housing Units | 255,186 | 73.2% |
| Renter-Occupied Housing Units | 93,684 | 26.9% |
| Total Occupied Housing Units | 348,870 | 100.0% |
Occupancy by Household Size in DuPage County
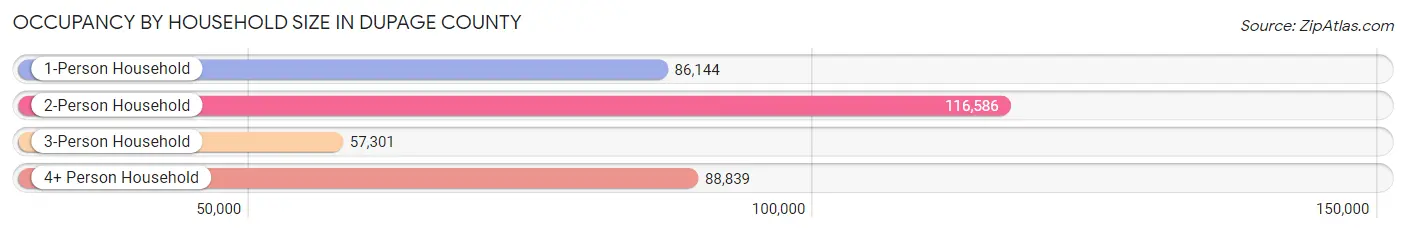
| Household Size | # Housing Units | % Housing Units |
| 1-Person Household | 86,144 | 24.7% |
| 2-Person Household | 116,586 | 33.4% |
| 3-Person Household | 57,301 | 16.4% |
| 4+ Person Household | 88,839 | 25.5% |
| Total Housing Units | 348,870 | 100.0% |
Occupancy by Ownership by Household Size in DuPage County
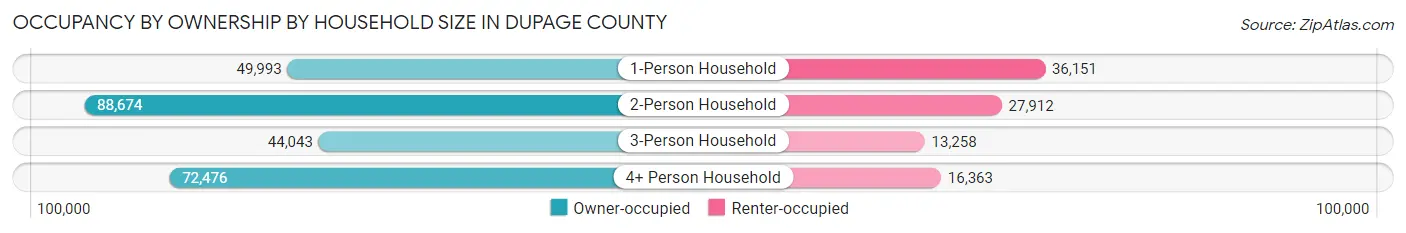
| Household Size | Owner-occupied | Renter-occupied |
| 1-Person Household | 49,993 (58.0%) | 36,151 (42.0%) |
| 2-Person Household | 88,674 (76.1%) | 27,912 (23.9%) |
| 3-Person Household | 44,043 (76.9%) | 13,258 (23.1%) |
| 4+ Person Household | 72,476 (81.6%) | 16,363 (18.4%) |
| Total Housing Units | 255,186 (73.2%) | 93,684 (26.9%) |
Occupancy by Educational Attainment in DuPage County
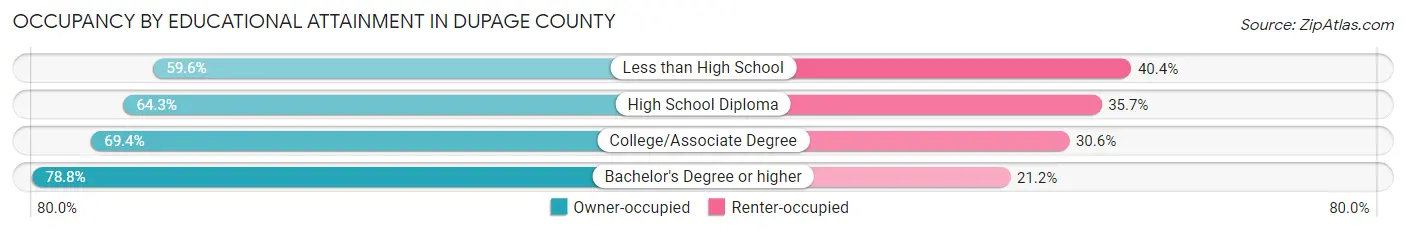
| Household Size | Owner-occupied | Renter-occupied |
| Less than High School | 10,493 (59.6%) | 7,119 (40.4%) |
| High School Diploma | 35,851 (64.3%) | 19,896 (35.7%) |
| College/Associate Degree | 60,740 (69.4%) | 26,759 (30.6%) |
| Bachelor's Degree or higher | 148,102 (78.8%) | 39,910 (21.2%) |
Occupancy by Age of Householder in DuPage County
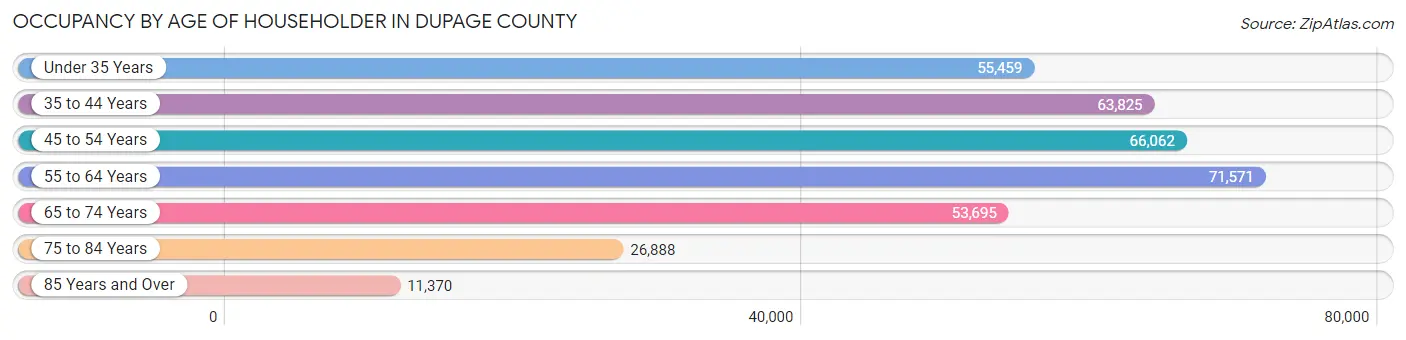
| Age Bracket | # Households | % Households |
| Under 35 Years | 55,459 | 15.9% |
| 35 to 44 Years | 63,825 | 18.3% |
| 45 to 54 Years | 66,062 | 18.9% |
| 55 to 64 Years | 71,571 | 20.5% |
| 65 to 74 Years | 53,695 | 15.4% |
| 75 to 84 Years | 26,888 | 7.7% |
| 85 Years and Over | 11,370 | 3.3% |
| Total | 348,870 | 100.0% |
Housing Finances in DuPage County
Median Income by Occupancy in DuPage County
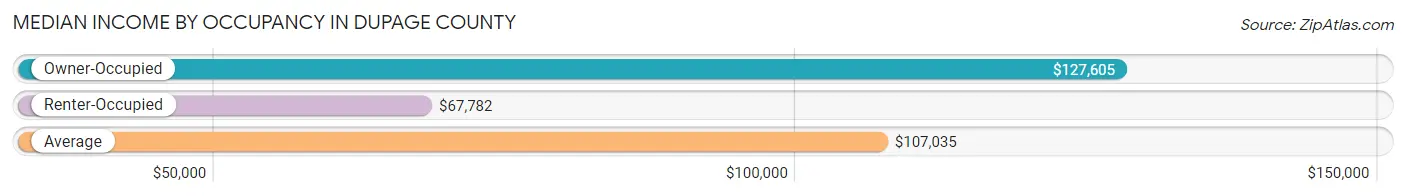
| Occupancy Type | # Households | Median Income |
| Owner-Occupied | 255,186 (73.2%) | $127,605 |
| Renter-Occupied | 93,684 (26.9%) | $67,782 |
| Average | 348,870 (100.0%) | $107,035 |
Occupancy by Householder Income Bracket in DuPage County
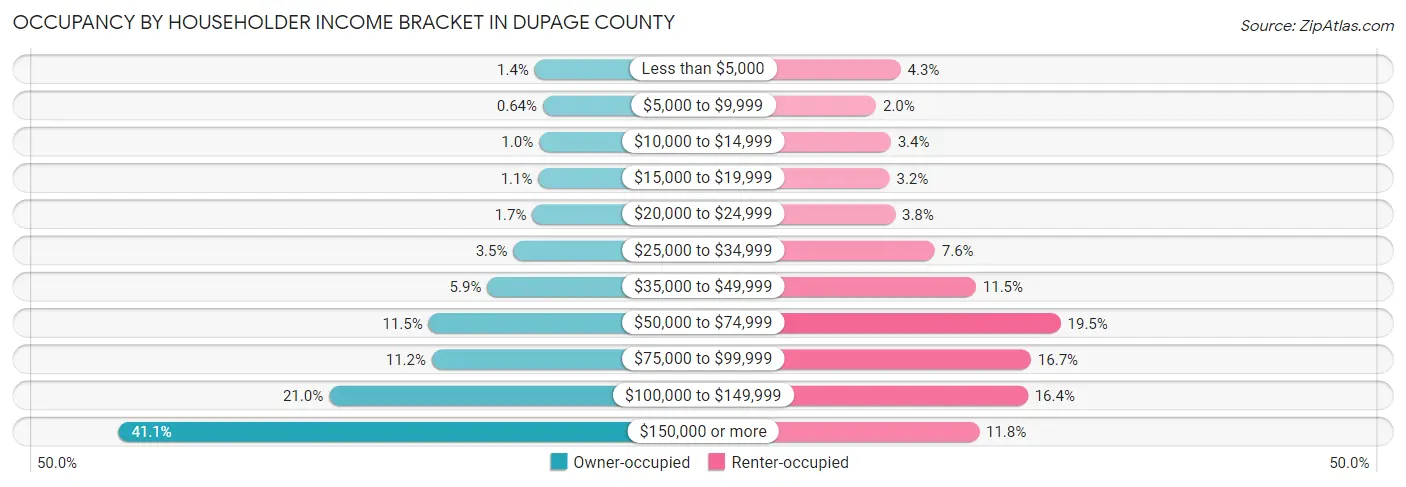
| Income Bracket | Owner-occupied | Renter-occupied |
| Less than $5,000 | 3,624 (1.4%) | 4,021 (4.3%) |
| $5,000 to $9,999 | 1,626 (0.6%) | 1,825 (1.9%) |
| $10,000 to $14,999 | 2,578 (1.0%) | 3,139 (3.4%) |
| $15,000 to $19,999 | 2,758 (1.1%) | 3,039 (3.2%) |
| $20,000 to $24,999 | 4,199 (1.7%) | 3,522 (3.8%) |
| $25,000 to $34,999 | 8,819 (3.5%) | 7,075 (7.5%) |
| $35,000 to $49,999 | 15,165 (5.9%) | 10,733 (11.5%) |
| $50,000 to $74,999 | 29,416 (11.5%) | 18,301 (19.5%) |
| $75,000 to $99,999 | 28,624 (11.2%) | 15,647 (16.7%) |
| $100,000 to $149,999 | 53,605 (21.0%) | 15,367 (16.4%) |
| $150,000 or more | 104,772 (41.1%) | 11,015 (11.8%) |
| Total | 255,186 (100.0%) | 93,684 (100.0%) |
Monthly Housing Cost Tiers in DuPage County
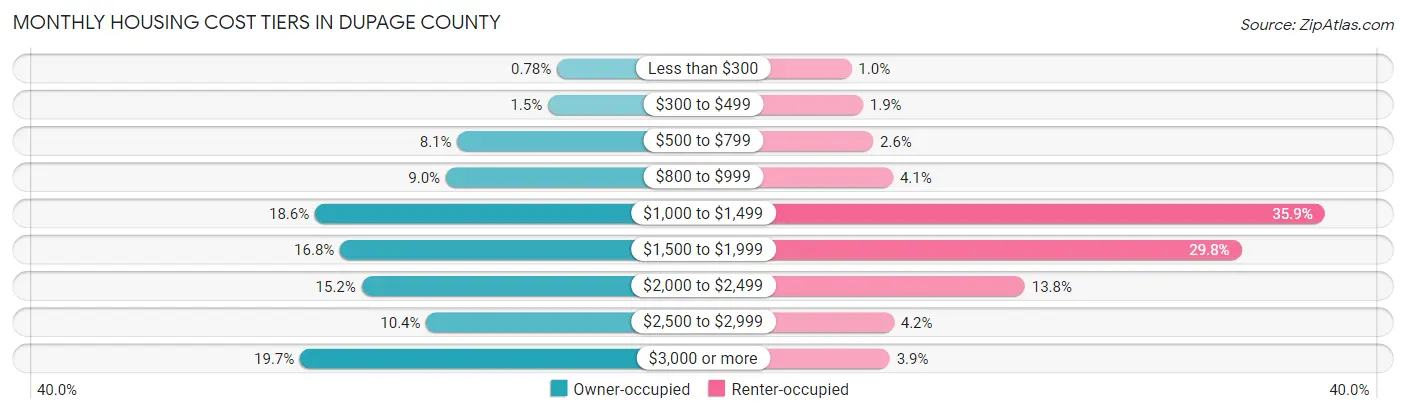
| Monthly Cost | Owner-occupied | Renter-occupied |
| Less than $300 | 1,995 (0.8%) | 962 (1.0%) |
| $300 to $499 | 3,704 (1.5%) | 1,750 (1.9%) |
| $500 to $799 | 20,741 (8.1%) | 2,466 (2.6%) |
| $800 to $999 | 22,895 (9.0%) | 3,827 (4.1%) |
| $1,000 to $1,499 | 47,501 (18.6%) | 33,600 (35.9%) |
| $1,500 to $1,999 | 42,759 (16.8%) | 27,872 (29.7%) |
| $2,000 to $2,499 | 38,745 (15.2%) | 12,932 (13.8%) |
| $2,500 to $2,999 | 26,560 (10.4%) | 3,884 (4.2%) |
| $3,000 or more | 50,286 (19.7%) | 3,608 (3.8%) |
| Total | 255,186 (100.0%) | 93,684 (100.0%) |
Physical Housing Characteristics in DuPage County
Housing Structures in DuPage County
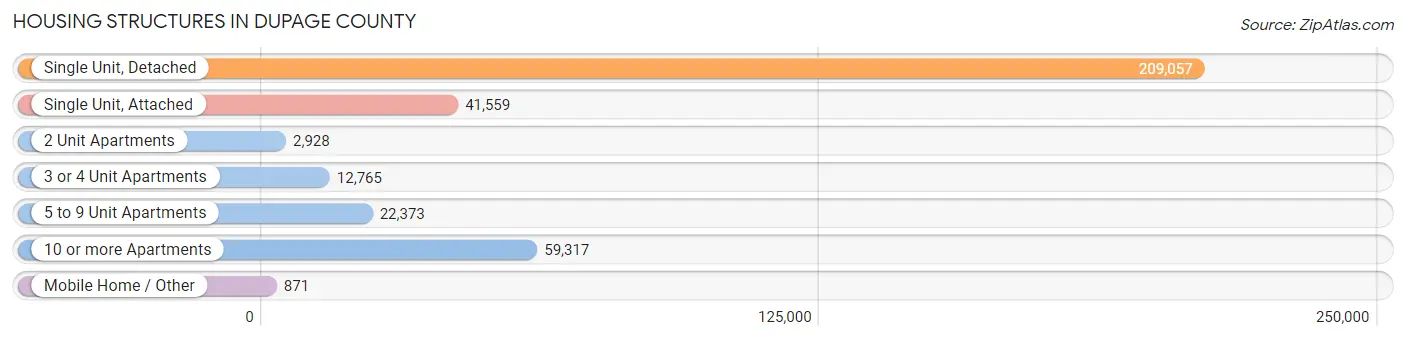
| Structure Type | # Housing Units | % Housing Units |
| Single Unit, Detached | 209,057 | 59.9% |
| Single Unit, Attached | 41,559 | 11.9% |
| 2 Unit Apartments | 2,928 | 0.8% |
| 3 or 4 Unit Apartments | 12,765 | 3.7% |
| 5 to 9 Unit Apartments | 22,373 | 6.4% |
| 10 or more Apartments | 59,317 | 17.0% |
| Mobile Home / Other | 871 | 0.3% |
| Total | 348,870 | 100.0% |
Housing Structures by Occupancy in DuPage County
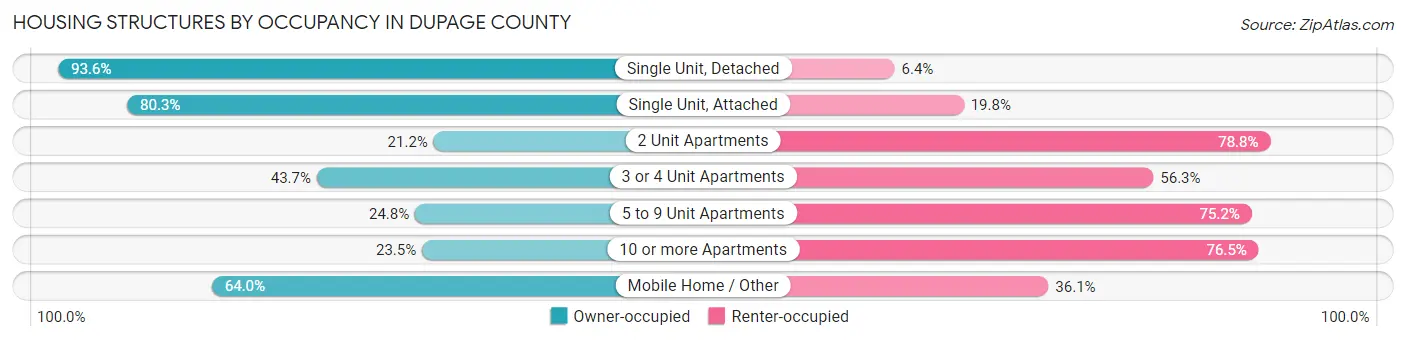
| Structure Type | Owner-occupied | Renter-occupied |
| Single Unit, Detached | 195,600 (93.6%) | 13,457 (6.4%) |
| Single Unit, Attached | 33,352 (80.2%) | 8,207 (19.8%) |
| 2 Unit Apartments | 622 (21.2%) | 2,306 (78.8%) |
| 3 or 4 Unit Apartments | 5,583 (43.7%) | 7,182 (56.3%) |
| 5 to 9 Unit Apartments | 5,553 (24.8%) | 16,820 (75.2%) |
| 10 or more Apartments | 13,919 (23.5%) | 45,398 (76.5%) |
| Mobile Home / Other | 557 (63.9%) | 314 (36.0%) |
| Total | 255,186 (73.2%) | 93,684 (26.9%) |
Housing Structures by Number of Rooms in DuPage County
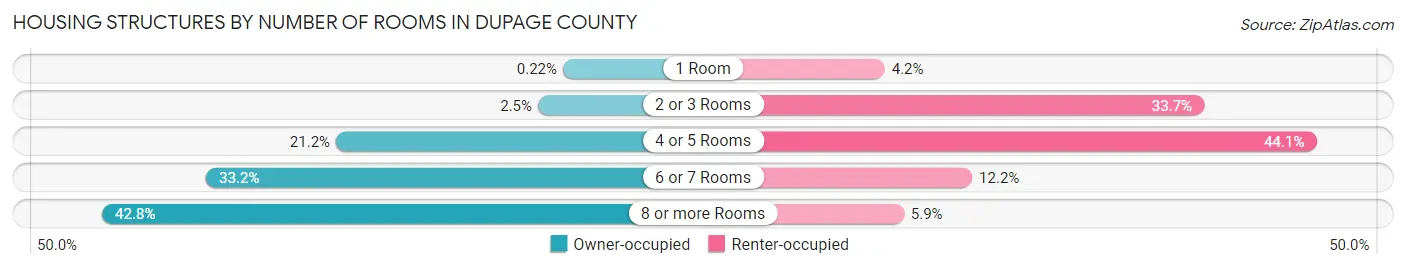
| Number of Rooms | Owner-occupied | Renter-occupied |
| 1 Room | 559 (0.2%) | 3,885 (4.2%) |
| 2 or 3 Rooms | 6,463 (2.5%) | 31,534 (33.7%) |
| 4 or 5 Rooms | 54,121 (21.2%) | 41,264 (44.1%) |
| 6 or 7 Rooms | 84,741 (33.2%) | 11,460 (12.2%) |
| 8 or more Rooms | 109,302 (42.8%) | 5,541 (5.9%) |
| Total | 255,186 (100.0%) | 93,684 (100.0%) |
Housing Structure by Heating Type in DuPage County
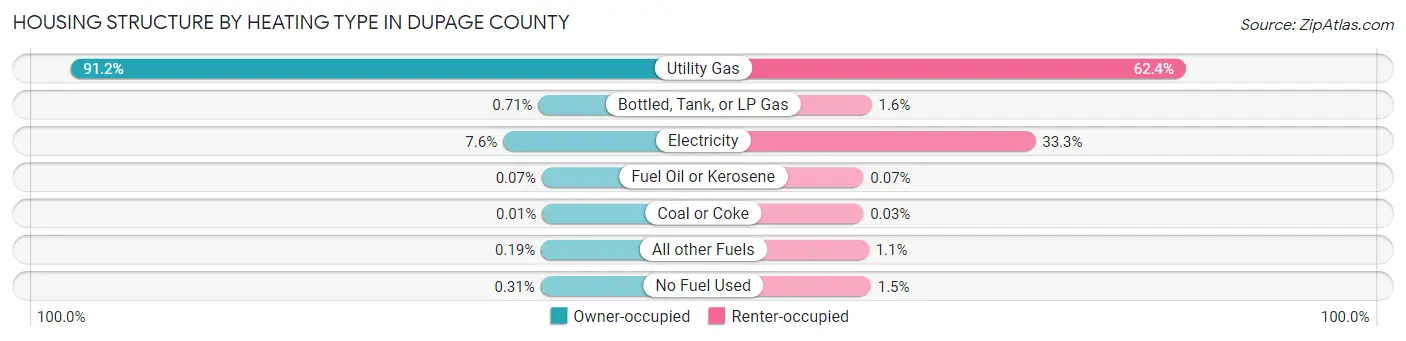
| Heating Type | Owner-occupied | Renter-occupied |
| Utility Gas | 232,617 (91.2%) | 58,434 (62.4%) |
| Bottled, Tank, or LP Gas | 1,808 (0.7%) | 1,536 (1.6%) |
| Electricity | 19,280 (7.6%) | 31,183 (33.3%) |
| Fuel Oil or Kerosene | 171 (0.1%) | 67 (0.1%) |
| Coal or Coke | 34 (0.0%) | 28 (0.0%) |
| All other Fuels | 478 (0.2%) | 1,029 (1.1%) |
| No Fuel Used | 798 (0.3%) | 1,407 (1.5%) |
| Total | 255,186 (100.0%) | 93,684 (100.0%) |
Household Vehicle Usage in DuPage County
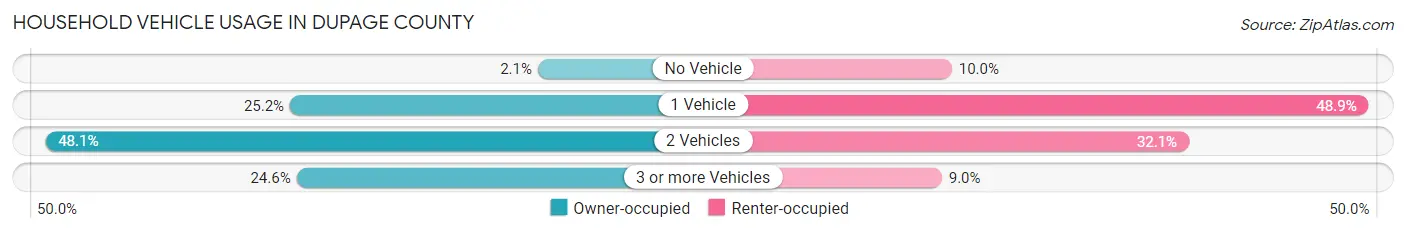
| Vehicles per Household | Owner-occupied | Renter-occupied |
| No Vehicle | 5,322 (2.1%) | 9,348 (10.0%) |
| 1 Vehicle | 64,371 (25.2%) | 45,785 (48.9%) |
| 2 Vehicles | 122,667 (48.1%) | 30,082 (32.1%) |
| 3 or more Vehicles | 62,826 (24.6%) | 8,469 (9.0%) |
| Total | 255,186 (100.0%) | 93,684 (100.0%) |
Real Estate & Mortgages in DuPage County
Real Estate and Mortgage Overview in DuPage County
| Characteristic | Without Mortgage | With Mortgage |
| Housing Units | 87,089 | 168,097 |
| Median Property Value | $351,500 | $367,000 |
| Median Household Income | $98,169 | $77,880 |
| Monthly Housing Costs | $991 | $49,103 |
| Real Estate Taxes | $7,339 | $1,524 |
Property Value by Mortgage Status in DuPage County
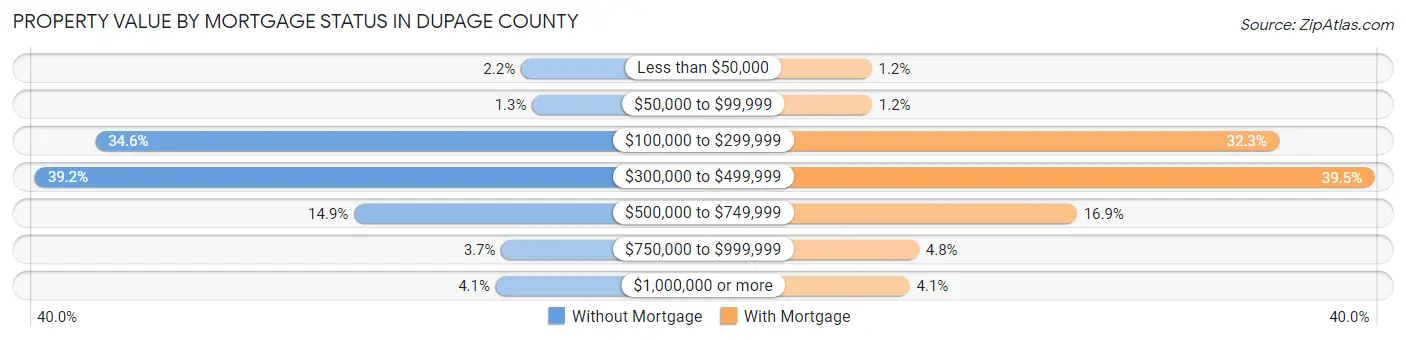
| Property Value | Without Mortgage | With Mortgage |
| Less than $50,000 | 1,896 (2.2%) | 2,048 (1.2%) |
| $50,000 to $99,999 | 1,146 (1.3%) | 2,077 (1.2%) |
| $100,000 to $299,999 | 30,146 (34.6%) | 54,213 (32.3%) |
| $300,000 to $499,999 | 34,160 (39.2%) | 66,401 (39.5%) |
| $500,000 to $749,999 | 12,968 (14.9%) | 28,326 (16.9%) |
| $750,000 to $999,999 | 3,202 (3.7%) | 8,107 (4.8%) |
| $1,000,000 or more | 3,571 (4.1%) | 6,925 (4.1%) |
| Total | 87,089 (100.0%) | 168,097 (100.0%) |
Household Income by Mortgage Status in DuPage County
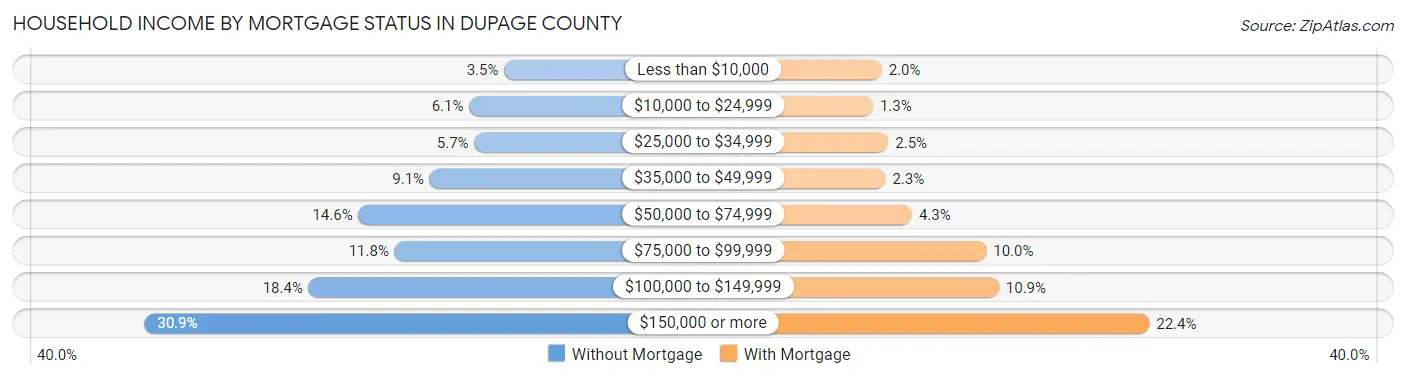
| Household Income | Without Mortgage | With Mortgage |
| Less than $10,000 | 3,008 (3.5%) | 3,359 (2.0%) |
| $10,000 to $24,999 | 5,330 (6.1%) | 2,242 (1.3%) |
| $25,000 to $34,999 | 4,987 (5.7%) | 4,205 (2.5%) |
| $35,000 to $49,999 | 7,940 (9.1%) | 3,832 (2.3%) |
| $50,000 to $74,999 | 12,676 (14.6%) | 7,225 (4.3%) |
| $75,000 to $99,999 | 10,276 (11.8%) | 16,740 (10.0%) |
| $100,000 to $149,999 | 15,980 (18.3%) | 18,348 (10.9%) |
| $150,000 or more | 26,892 (30.9%) | 37,625 (22.4%) |
| Total | 87,089 (100.0%) | 168,097 (100.0%) |
Property Value to Household Income Ratio in DuPage County
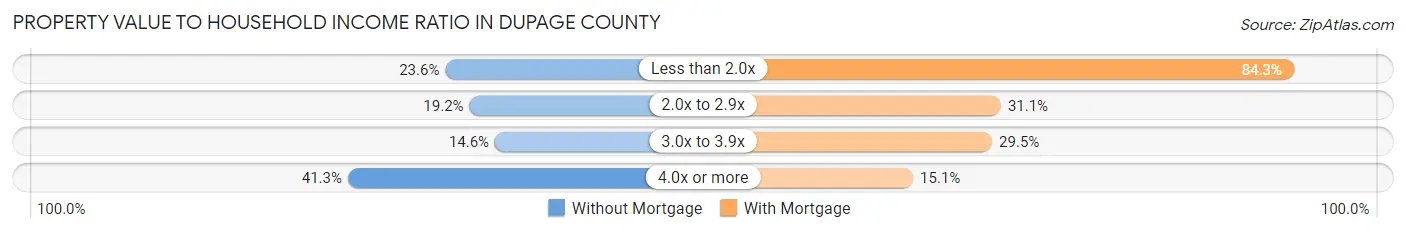
| Value-to-Income Ratio | Without Mortgage | With Mortgage |
| Less than 2.0x | 20,564 (23.6%) | 141,629 (84.3%) |
| 2.0x to 2.9x | 16,738 (19.2%) | 52,209 (31.1%) |
| 3.0x to 3.9x | 12,701 (14.6%) | 49,522 (29.5%) |
| 4.0x or more | 35,970 (41.3%) | 25,412 (15.1%) |
| Total | 87,089 (100.0%) | 168,097 (100.0%) |
Real Estate Taxes by Mortgage Status in DuPage County

| Property Taxes | Without Mortgage | With Mortgage |
| Less than $800 | 1,598 (1.8%) | 560 (0.3%) |
| $800 to $1,499 | 1,949 (2.2%) | 1,766 (1.1%) |
| $800 to $1,499 | 82,107 (94.3%) | 2,466 (1.5%) |
| Total | 87,089 (100.0%) | 168,097 (100.0%) |
Health & Disability in DuPage County
Health Insurance Coverage by Age in DuPage County
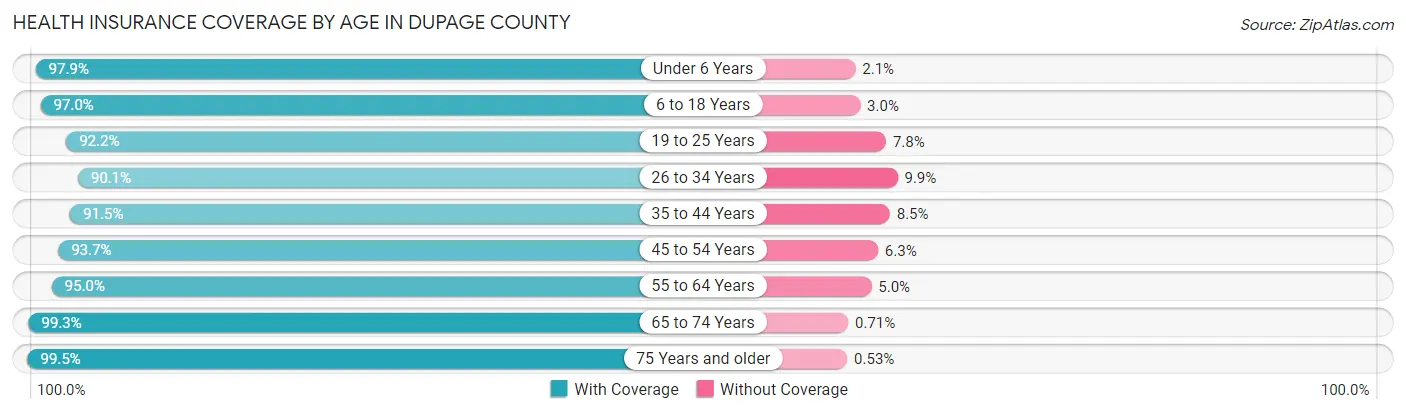
| Age Bracket | With Coverage | Without Coverage |
| Under 6 Years | 62,266 (97.9%) | 1,311 (2.1%) |
| 6 to 18 Years | 152,225 (97.0%) | 4,636 (3.0%) |
| 19 to 25 Years | 71,853 (92.2%) | 6,057 (7.8%) |
| 26 to 34 Years | 93,351 (90.1%) | 10,288 (9.9%) |
| 35 to 44 Years | 113,617 (91.5%) | 10,523 (8.5%) |
| 45 to 54 Years | 113,679 (93.7%) | 7,603 (6.3%) |
| 55 to 64 Years | 121,716 (95.0%) | 6,466 (5.0%) |
| 65 to 74 Years | 89,740 (99.3%) | 638 (0.7%) |
| 75 Years and older | 57,797 (99.5%) | 310 (0.5%) |
| Total | 876,244 (94.8%) | 47,832 (5.2%) |
Health Insurance Coverage by Citizenship Status in DuPage County

| Citizenship Status | With Coverage | Without Coverage |
| Native Born | 62,266 (97.9%) | 1,311 (2.1%) |
| Foreign Born, Citizen | 152,225 (97.0%) | 4,636 (3.0%) |
| Foreign Born, not a Citizen | 71,853 (92.2%) | 6,057 (7.8%) |
Health Insurance Coverage by Household Income in DuPage County

| Household Income | With Coverage | Without Coverage |
| Under $25,000 | 46,411 (91.0%) | 4,577 (9.0%) |
| $25,000 to $49,999 | 73,966 (89.5%) | 8,639 (10.5%) |
| $50,000 to $74,999 | 94,319 (90.8%) | 9,512 (9.2%) |
| $75,000 to $99,999 | 102,809 (93.1%) | 7,668 (6.9%) |
| $100,000 and over | 552,285 (97.0%) | 17,078 (3.0%) |
Public vs Private Health Insurance Coverage by Age in DuPage County
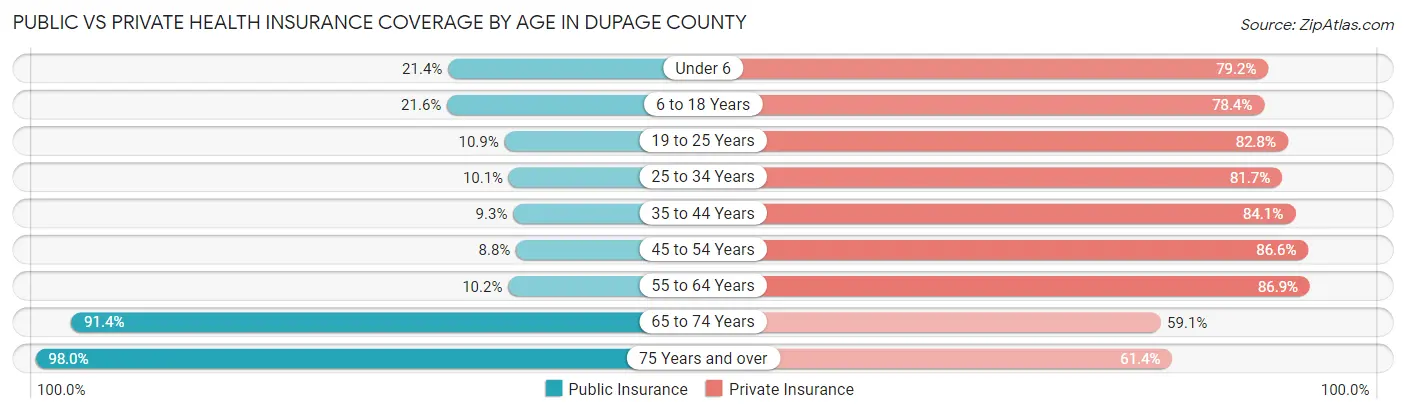
| Age Bracket | Public Insurance | Private Insurance |
| Under 6 | 13,591 (21.4%) | 50,322 (79.1%) |
| 6 to 18 Years | 33,831 (21.6%) | 122,977 (78.4%) |
| 19 to 25 Years | 8,497 (10.9%) | 64,488 (82.8%) |
| 25 to 34 Years | 10,471 (10.1%) | 84,678 (81.7%) |
| 35 to 44 Years | 11,549 (9.3%) | 104,439 (84.1%) |
| 45 to 54 Years | 10,618 (8.7%) | 105,014 (86.6%) |
| 55 to 64 Years | 13,110 (10.2%) | 111,380 (86.9%) |
| 65 to 74 Years | 82,563 (91.3%) | 53,408 (59.1%) |
| 75 Years and over | 56,948 (98.0%) | 35,653 (61.4%) |
| Total | 241,178 (26.1%) | 732,359 (79.2%) |
Disability Status by Sex by Age in DuPage County
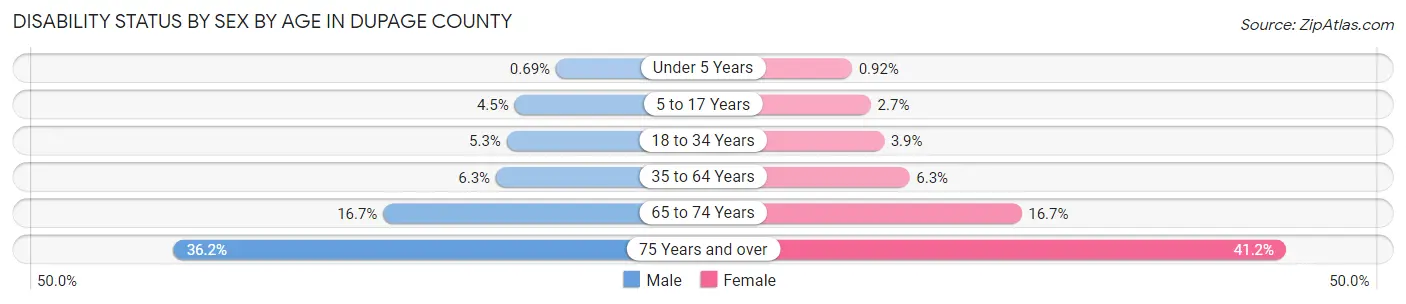
| Age Bracket | Male | Female |
| Under 5 Years | 186 (0.7%) | 234 (0.9%) |
| 5 to 17 Years | 3,600 (4.5%) | 2,019 (2.7%) |
| 18 to 34 Years | 5,212 (5.3%) | 3,717 (3.9%) |
| 35 to 64 Years | 11,653 (6.3%) | 11,750 (6.3%) |
| 65 to 74 Years | 7,214 (16.7%) | 7,870 (16.7%) |
| 75 Years and over | 8,619 (36.2%) | 14,121 (41.2%) |
Disability Class by Sex by Age in DuPage County
Disability Class: Hearing Difficulty
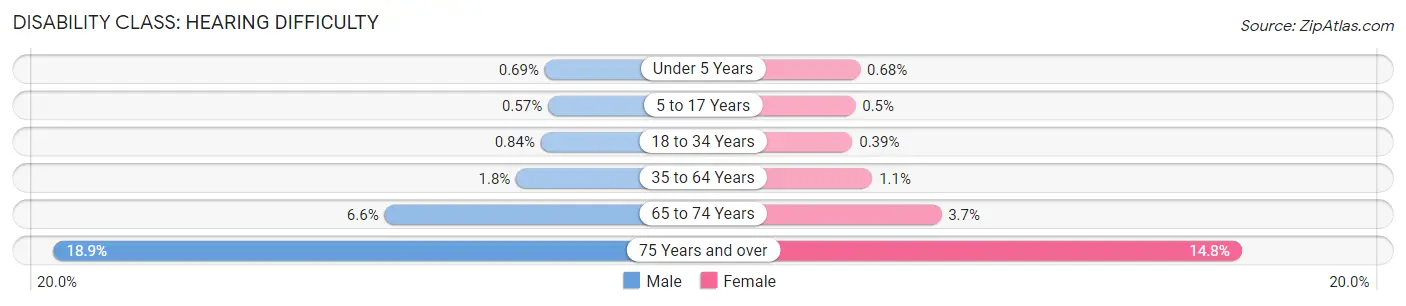
| Age Bracket | Male | Female |
| Under 5 Years | 186 (0.7%) | 173 (0.7%) |
| 5 to 17 Years | 454 (0.6%) | 380 (0.5%) |
| 18 to 34 Years | 834 (0.8%) | 369 (0.4%) |
| 35 to 64 Years | 3,257 (1.8%) | 2,126 (1.1%) |
| 65 to 74 Years | 2,864 (6.6%) | 1,742 (3.7%) |
| 75 Years and over | 4,511 (18.9%) | 5,085 (14.8%) |
Disability Class: Vision Difficulty
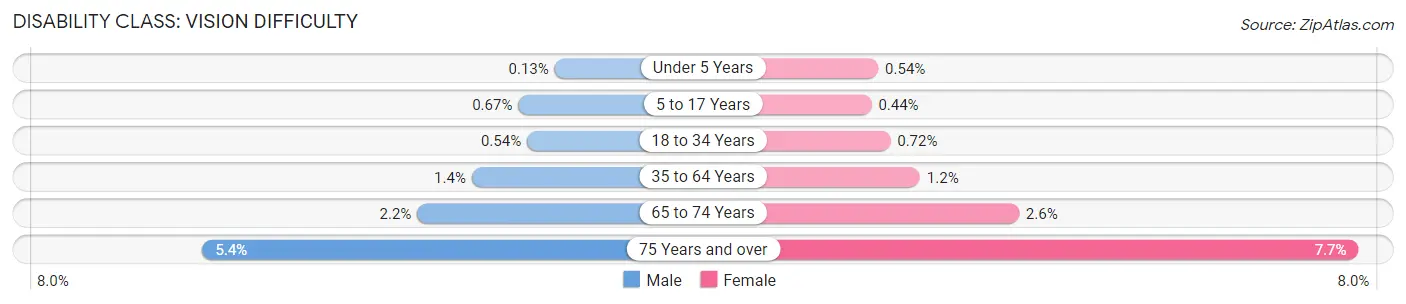
| Age Bracket | Male | Female |
| Under 5 Years | 34 (0.1%) | 138 (0.5%) |
| 5 to 17 Years | 533 (0.7%) | 332 (0.4%) |
| 18 to 34 Years | 531 (0.5%) | 687 (0.7%) |
| 35 to 64 Years | 2,539 (1.4%) | 2,168 (1.2%) |
| 65 to 74 Years | 936 (2.2%) | 1,242 (2.6%) |
| 75 Years and over | 1,278 (5.4%) | 2,629 (7.7%) |
Disability Class: Cognitive Difficulty
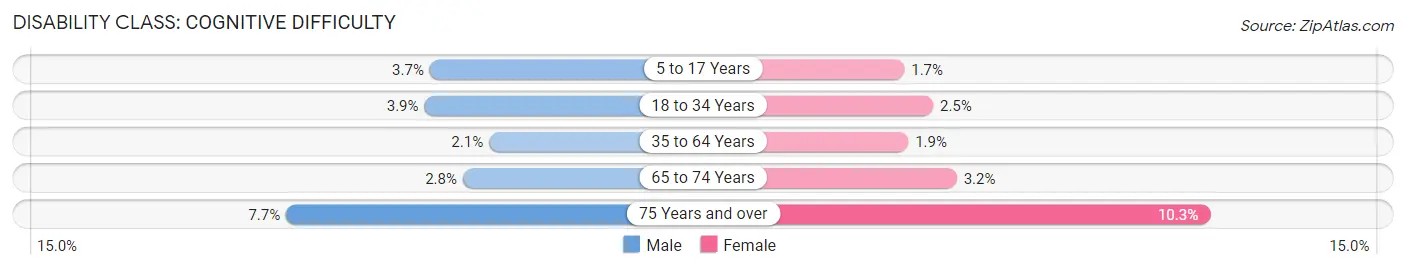
| Age Bracket | Male | Female |
| 5 to 17 Years | 2,961 (3.7%) | 1,312 (1.7%) |
| 18 to 34 Years | 3,833 (3.9%) | 2,422 (2.5%) |
| 35 to 64 Years | 3,858 (2.1%) | 3,471 (1.8%) |
| 65 to 74 Years | 1,209 (2.8%) | 1,509 (3.2%) |
| 75 Years and over | 1,841 (7.7%) | 3,513 (10.2%) |
Disability Class: Ambulatory Difficulty
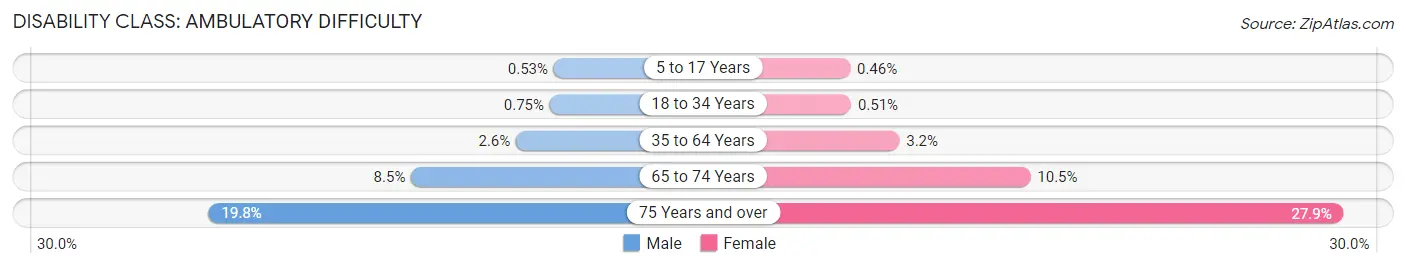
| Age Bracket | Male | Female |
| 5 to 17 Years | 425 (0.5%) | 350 (0.5%) |
| 18 to 34 Years | 744 (0.7%) | 488 (0.5%) |
| 35 to 64 Years | 4,893 (2.6%) | 5,998 (3.2%) |
| 65 to 74 Years | 3,657 (8.5%) | 4,957 (10.5%) |
| 75 Years and over | 4,711 (19.8%) | 9,575 (27.9%) |
Disability Class: Self-Care Difficulty
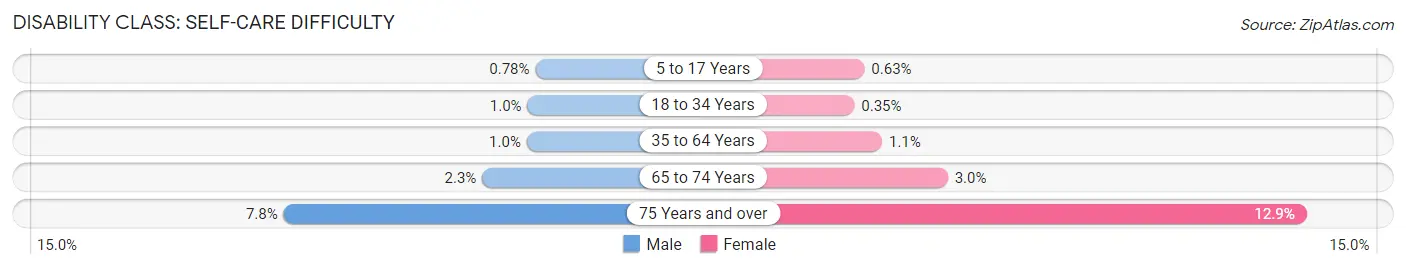
| Age Bracket | Male | Female |
| 5 to 17 Years | 619 (0.8%) | 479 (0.6%) |
| 18 to 34 Years | 996 (1.0%) | 332 (0.4%) |
| 35 to 64 Years | 1,902 (1.0%) | 2,108 (1.1%) |
| 65 to 74 Years | 976 (2.3%) | 1,395 (2.9%) |
| 75 Years and over | 1,858 (7.8%) | 4,435 (12.9%) |
Technology Access in DuPage County
Computing Device Access in DuPage County
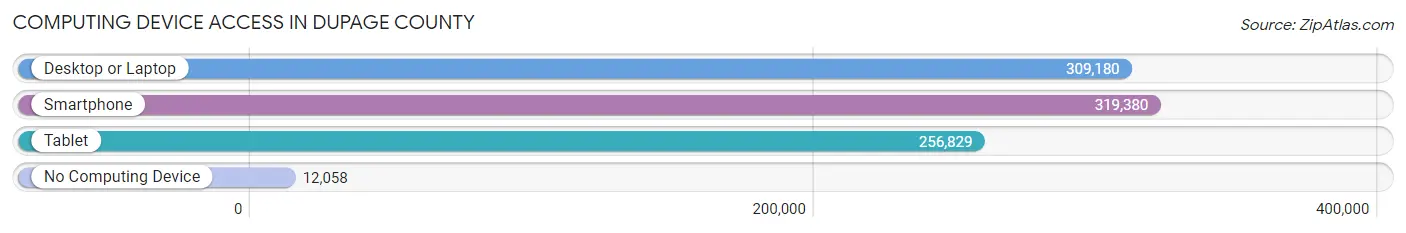
| Device Type | # Households | % Households |
| Desktop or Laptop | 309,180 | 88.6% |
| Smartphone | 319,380 | 91.5% |
| Tablet | 256,829 | 73.6% |
| No Computing Device | 12,058 | 3.5% |
| Total | 348,870 | 100.0% |
Internet Access in DuPage County
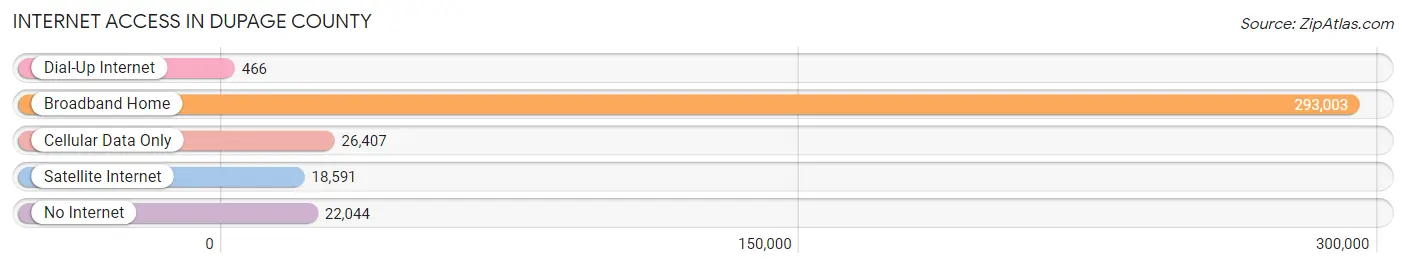
| Internet Type | # Households | % Households |
| Dial-Up Internet | 466 | 0.1% |
| Broadband Home | 293,003 | 84.0% |
| Cellular Data Only | 26,407 | 7.6% |
| Satellite Internet | 18,591 | 5.3% |
| No Internet | 22,044 | 6.3% |
| Total | 348,870 | 100.0% |
DuPage County Summary
Dupage County, Illinois is located in the northeastern part of the state, just west of Chicago. It is the second most populous county in Illinois, with a population of 916,924 as of the 2019 census. The county seat is Wheaton.
Dupage County was formed in 1839 from Cook County. It was named after the DuPage River, which runs through the county. The county is divided into nine townships, which are Addison, Bloomingdale, Downers Grove, Lisle, Milton, Naperville, Winfield, York, and Wheaton.
Geography
Dupage County covers an area of 336 square miles, making it the second smallest county in Illinois. The county is located in the Northeastern part of the state, just west of Chicago. The county is bordered by Cook County to the east, Will County to the south, Kane County to the west, and Lake County to the north. The DuPage River runs through the county, and there are several other smaller rivers and streams. The county is mostly flat, with some rolling hills in the western part.
Economy
Dupage County has a strong and diverse economy. The county is home to several large corporations, including McDonald's, Ace Hardware, and Kraft Heinz. The county is also home to several major universities, including the University of Illinois at Chicago, Northwestern University, and the University of Chicago. The county is also home to several major hospitals, including Advocate Good Samaritan Hospital, Edward Hospital, and Northwestern Medicine Central DuPage Hospital.
The county has a strong manufacturing sector, with several major companies located in the area. These include Caterpillar, John Deere, and Molex. The county also has a strong technology sector, with several major companies located in the area, including Microsoft, Oracle, and Motorola Solutions.
Demographics
As of the 2019 census, Dupage County had a population of 916,924. The population is made up of a diverse mix of ethnicities, with the largest groups being White (77.2%), Hispanic or Latino (14.2%), Asian (4.7%), and African American (2.7%). The median household income in the county is $90,845, and the median home value is $323,400.
The county is home to several major cities, including Wheaton, Naperville, and Downers Grove. The county also has several smaller towns and villages, including Addison, Bloomingdale, Lisle, Milton, Winfield, and York.
Conclusion
Dupage County, Illinois is a vibrant and diverse county located in the northeastern part of the state, just west of Chicago. The county has a strong and diverse economy, with several major corporations, universities, and hospitals located in the area. The county is also home to a diverse population, with the largest groups being White, Hispanic or Latino, Asian, and African American. The county is home to several major cities, as well as several smaller towns and villages.
Common Questions
What is the Total Population of DuPage County?
Total Population of DuPage County is 930,559.
What is the Total Male Population of DuPage County?
Total Male Population of DuPage County is 461,287.
What is the Total Female Population of DuPage County?
Total Female Population of DuPage County is 469,272.
What is the Ratio of Males per 100 Females in DuPage County?
There are 98.30 Males per 100 Females in DuPage County.
What is the Ratio of Females per 100 Males in DuPage County?
There are 101.73 Females per 100 Males in DuPage County.
What is the Median Population Age in DuPage County?
Median Population Age in DuPage County is 39.9 Years.
What is the Average Family Size in DuPage County
Average Family Size in DuPage County is 3.2 People.
What is the Average Household Size in DuPage County
Average Household Size in DuPage County is 2.6 People.
What is Per Capita Income in DuPage County?
Per Capita income in DuPage County is $55,107.
What is the Median Family Income in DuPage County?
Median Family Income in DuPage County is $131,904.
What is the Median Household income in DuPage County?
Median Household Income in DuPage County is $107,035.
What is Income or Wage Gap in DuPage County?
Income or Wage Gap in DuPage County is 36.4%.
Women in DuPage County earn 63.6 cents for every dollar earned by a man.
What is Family Income Deficit in DuPage County?
Family Income Deficit in DuPage County is $10,909.
Families that are below poverty line in DuPage County earn $10,909 less on average than the poverty threshold level.
What is Inequality or Gini Index in DuPage County?
Inequality or Gini Index in DuPage County is 0.46.
How Large is the Labor Force in DuPage County?
There are 514,514 People in the Labor Forcein in DuPage County.
What is the Percentage of People in the Labor Force in DuPage County?
68.7% of People are in the Labor Force in DuPage County.
What is the Unemployment Rate in DuPage County?
Unemployment Rate in DuPage County is 4.7%.