Immigrants from Western Europe vs Immigrants from Pakistan 1 or more Vehicles in Household

COMPARE

Immigrants from Western Europe
Race
Ancestry
AfghanAfricanAlaska NativeAlaskan AthabascanAlbanianAleutAlsatianAmericanApacheArabArapahoArgentineanArmenianAssyrian/Chaldean/SyriacAustralianAustrianBahamianBangladeshiBarbadianBasqueBelgianBelizeanBermudanBhutaneseBlackfeetBolivianBrazilianBritishBritish West IndianBulgarianBurmeseCajunCambodianCanadianCape VerdeanCarpatho RusynCelticCentral AmericanCentral American IndianCherokeeCheyenneChickasawChileanChineseChippewaChoctawColombianColvilleComancheCosta RicanCreeCreekCroatianCrowCubanCypriotCzechCzechoslovakianDanishDelawareDominicanDutchDutch West IndianEastern EuropeanEcuadorianEgyptianEnglishEstonianEthiopianEuropeanFijianFilipinoFinnishFrenchFrench American IndianFrench CanadianGermanGerman RussianGhanaianGreekGuamanian/ChamorroGuatemalanGuyaneseHaitianHmongHonduranHopiHoumaHungarianIcelanderIndian (Asian)IndonesianInupiatIranianIraqiIrishIroquoisIsraeliItalianJamaicanJapaneseJordanianKenyanKiowaKoreanLaotianLatvianLebaneseLiberianLithuanianLumbeeLuxembourgerMacedonianMalaysianMalteseMarshalleseMenomineeMexicanMexican American IndianMongolianMoroccanNative HawaiianNavajoNepaleseNew ZealanderNicaraguanNigerianNorthern EuropeanNorwegianOkinawanOsageOttawaPaiutePakistaniPalestinianPanamanianParaguayanPennsylvania GermanPeruvianPimaPolishPortuguesePotawatomiPuebloPuerto RicanPuget Sound SalishRomanianRussianSalvadoranSamoanScandinavianScotch-IrishScottishSeminoleSenegaleseSerbianShoshoneSierra LeoneanSiouxSlavicSlovakSloveneSomaliSouth AfricanSouth AmericanSouth American IndianSoviet UnionSpaniardSpanishSpanish AmericanSpanish American IndianSri LankanSubsaharan AfricanSudaneseSwedishSwissSyrianTaiwaneseThaiTlingit-HaidaTohono O'OdhamTonganTrinidadian and TobagonianTsimshianTurkishU.S. Virgin IslanderUgandanUkrainianUruguayanUteVenezuelanVietnameseWelshWest IndianYakamaYaquiYugoslavianYumanYup'ikZimbabwean
Immigration
NonimmigrantsImmigrantsAfghanistanAfricaAlbaniaArgentinaArmeniaAsiaAustraliaAustriaBahamasBangladeshBarbadosBelarusBelgiumBelizeBoliviaBosnia and HerzegovinaBrazilBulgariaBurma/MyanmarCabo VerdeCambodiaCameroonCanadaCaribbeanCentral AmericaChileChinaColombiaCongoCosta RicaCroatiaCubaCzechoslovakiaDenmarkDominicaDominican RepublicEastern AfricaEastern AsiaEastern EuropeEcuadorEgyptEl SalvadorEnglandEritreaEthiopiaEuropeFijiFranceGermanyGhanaGreeceGrenadaGuatemalaGuyanaHaitiHondurasHong KongHungaryIndiaIndonesiaIranIraqIrelandIsraelItalyJamaicaJapanJordanKazakhstanKenyaKoreaKuwaitLaosLatin AmericaLatviaLebanonLiberiaLithuaniaMalaysiaMexicoMicronesiaMiddle AfricaMoldovaMoroccoNepalNetherlandsNicaraguaNigeriaNorth AmericaNorth MacedoniaNorthern AfricaNorthern EuropeNorwayOceaniaPanamaPeruPhilippinesPolandPortugalRomaniaRussiaSaudi ArabiaScotlandSenegalSerbiaSierra LeoneSingaporeSomaliaSouth AfricaSouth AmericaSouth Central AsiaSouth Eastern AsiaSouthern EuropeSpainSri LankaSt. Vincent and the GrenadinesSudanSwedenSwitzerlandSyriaTaiwanThailandTrinidad and TobagoTurkeyUgandaUkraineUruguayUzbekistanVenezuelaVietnamWest IndiesWestern AfricaWestern AsiaWestern EuropeYemenZaireZimbabweAzores
Immigrants from Pakistan
Race
Ancestry
AfghanAfricanAlaska NativeAlaskan AthabascanAlbanianAleutAlsatianAmericanApacheArabArapahoArgentineanArmenianAssyrian/Chaldean/SyriacAustralianAustrianBahamianBangladeshiBarbadianBasqueBelgianBelizeanBermudanBhutaneseBlackfeetBolivianBrazilianBritishBritish West IndianBulgarianBurmeseCajunCambodianCanadianCape VerdeanCarpatho RusynCelticCentral AmericanCentral American IndianCherokeeCheyenneChickasawChileanChineseChippewaChoctawColombianColvilleComancheCosta RicanCreeCreekCroatianCrowCubanCypriotCzechCzechoslovakianDanishDelawareDominicanDutchDutch West IndianEastern EuropeanEcuadorianEgyptianEnglishEstonianEthiopianEuropeanFijianFilipinoFinnishFrenchFrench American IndianFrench CanadianGermanGerman RussianGhanaianGreekGuamanian/ChamorroGuatemalanGuyaneseHaitianHmongHonduranHopiHoumaHungarianIcelanderIndian (Asian)IndonesianInupiatIranianIraqiIrishIroquoisIsraeliItalianJamaicanJapaneseJordanianKenyanKiowaKoreanLaotianLatvianLebaneseLiberianLithuanianLumbeeLuxembourgerMacedonianMalaysianMalteseMarshalleseMenomineeMexicanMexican American IndianMongolianMoroccanNative HawaiianNavajoNepaleseNew ZealanderNicaraguanNigerianNorthern EuropeanNorwegianOkinawanOsageOttawaPaiutePakistaniPalestinianPanamanianParaguayanPennsylvania GermanPeruvianPimaPolishPortuguesePotawatomiPuebloPuerto RicanPuget Sound SalishRomanianRussianSalvadoranSamoanScandinavianScotch-IrishScottishSeminoleSenegaleseSerbianShoshoneSierra LeoneanSiouxSlavicSlovakSloveneSomaliSouth AfricanSouth AmericanSouth American IndianSoviet UnionSpaniardSpanishSpanish AmericanSpanish American IndianSri LankanSubsaharan AfricanSudaneseSwedishSwissSyrianTaiwaneseThaiTlingit-HaidaTohono O'OdhamTonganTrinidadian and TobagonianTsimshianTurkishU.S. Virgin IslanderUgandanUkrainianUruguayanUteVenezuelanVietnameseWelshWest IndianYakamaYaquiYugoslavianYumanYup'ikZimbabwean
Immigration
NonimmigrantsImmigrantsAfghanistanAfricaAlbaniaArgentinaArmeniaAsiaAustraliaAustriaBahamasBangladeshBarbadosBelarusBelgiumBelizeBoliviaBosnia and HerzegovinaBrazilBulgariaBurma/MyanmarCabo VerdeCambodiaCameroonCanadaCaribbeanCentral AmericaChileChinaColombiaCongoCosta RicaCroatiaCubaCzechoslovakiaDenmarkDominicaDominican RepublicEastern AfricaEastern AsiaEastern EuropeEcuadorEgyptEl SalvadorEnglandEritreaEthiopiaEuropeFijiFranceGermanyGhanaGreeceGrenadaGuatemalaGuyanaHaitiHondurasHong KongHungaryIndiaIndonesiaIranIraqIrelandIsraelItalyJamaicaJapanJordanKazakhstanKenyaKoreaKuwaitLaosLatin AmericaLatviaLebanonLiberiaLithuaniaMalaysiaMexicoMicronesiaMiddle AfricaMoldovaMoroccoNepalNetherlandsNicaraguaNigeriaNorth AmericaNorth MacedoniaNorthern AfricaNorthern EuropeNorwayOceaniaPakistanPanamaPeruPhilippinesPolandPortugalRomaniaRussiaSaudi ArabiaScotlandSenegalSerbiaSierra LeoneSingaporeSomaliaSouth AfricaSouth AmericaSouth Central AsiaSouth Eastern AsiaSouthern EuropeSpainSri LankaSt. Vincent and the GrenadinesSudanSwedenSwitzerlandSyriaTaiwanThailandTrinidad and TobagoTurkeyUgandaUkraineUruguayUzbekistanVenezuelaVietnamWest IndiesWestern AfricaWestern AsiaYemenZaireZimbabweAzores
1 or more Vehicles in Household
Income
Poverty
Unemployment
Labor Participation
Family Structure
Vehicle Availability
Education Level
Disability

1 or more Vehicles in Household Comparison

Immigrants from Western Europe

Immigrants from Pakistan

Fair
Tragic
89.2%
1 OR MORE VEHICLES IN HOUSEHOLD
20.5/ 100
METRIC RATING
201st/ 347
METRIC RANK
88.6%
1 OR MORE VEHICLES IN HOUSEHOLD
4.5/ 100
METRIC RATING
236th/ 347
METRIC RANK

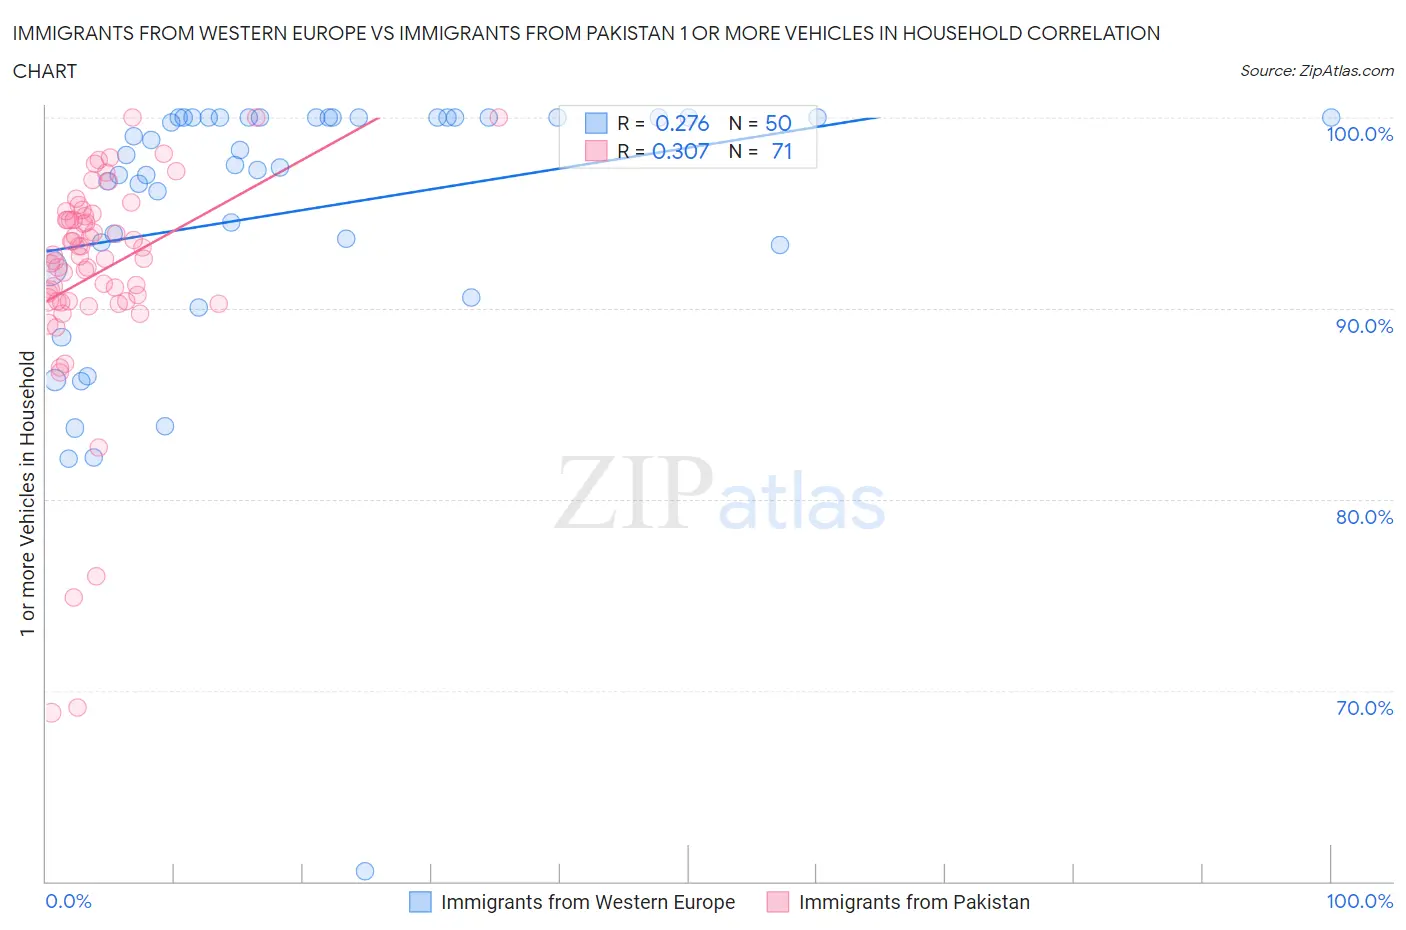
Immigrants from Western Europe vs Immigrants from Pakistan 1 or more Vehicles in Household Correlation Chart

The statistical analysis conducted on geographies consisting of 493,868,131 people shows a weak positive correlation between the proportion of Immigrants from Western Europe and percentage of households with 1 or more vehicles available in the United States with a correlation coefficient (R) of 0.276 and weighted average of 89.2%. Similarly, the statistical analysis conducted on geographies consisting of 283,704,699 people shows a mild positive correlation between the proportion of Immigrants from Pakistan and percentage of households with 1 or more vehicles available in the United States with a correlation coefficient (R) of 0.307 and weighted average of 88.6%, a difference of 0.67%.
Immigrants from Western Europe vs Immigrants from Pakistan 1 or more Vehicles in Household

1 or more Vehicles in Household Correlation Summary

MeasurementImmigrants from Western EuropeImmigrants from Pakistan
Minimum60.5%68.8%
Maximum100.0%100.0%
Range39.5%31.2%
Mean95.0%91.9%
Median97.8%92.7%
Interquartile 25% (IQ1)93.3%90.4%
Interquartile 75% (IQ3)100.0%94.8%
Interquartile Range (IQR)6.7%4.4%
Standard Deviation (Sample)7.4%5.9%
Standard Deviation (Population)7.4%5.8%

Similar Demographics by 1 or more Vehicles in Household

Demographics Similar to Immigrants from Western Europe by 1 or more Vehicles in Household

In terms of 1 or more vehicles in household, the demographic groups most similar to Immigrants from Western Europe are Central American (89.2%, a difference of 0.020%), Iroquois (89.2%, a difference of 0.020%), Cambodian (89.2%, a difference of 0.040%), Immigrants from Asia (89.3%, a difference of 0.050%), and Pennsylvania German (89.3%, a difference of 0.060%).
DemographicsRating | Rank1 or more Vehicles in Household
Immigrants | Eritrea
33.2
/100
|
#194
Fair
89.4%
Immigrants | Armenia
31.8
/100
|
#195
Fair
89.4%
Crow
24.3
/100
|
#196
Fair
89.3%
Immigrants | Sweden
23.6
/100
|
#197
Fair
89.3%
Pennsylvania Germans
22.9
/100
|
#198
Fair
89.3%
Immigrants | Asia
22.8
/100
|
#199
Fair
89.3%
Central Americans
21.4
/100
|
#200
Fair
89.2%
Immigrants | Western Europe
20.5
/100
|
#201
Fair
89.2%
Iroquois
19.8
/100
|
#202
Poor
89.2%
Cambodians
18.9
/100
|
#203
Poor
89.2%
Romanians
18.2
/100
|
#204
Poor
89.2%
Guatemalans
17.8
/100
|
#205
Poor
89.2%
Apache
16.2
/100
|
#206
Poor
89.1%
Immigrants | Denmark
14.8
/100
|
#207
Poor
89.1%
Immigrants | Chile
14.4
/100
|
#208
Poor
89.1%

Demographics Similar to Immigrants from Pakistan by 1 or more Vehicles in Household

In terms of 1 or more vehicles in household, the demographic groups most similar to Immigrants from Pakistan are Paiute (88.6%, a difference of 0.010%), Immigrants from Turkey (88.6%, a difference of 0.010%), Immigrants from Peru (88.6%, a difference of 0.020%), Houma (88.6%, a difference of 0.030%), and Immigrants from Somalia (88.6%, a difference of 0.030%).
DemographicsRating | Rank1 or more Vehicles in Household
Immigrants | Romania
5.4
/100
|
#229
Tragic
88.7%
Immigrants | Sierra Leone
5.2
/100
|
#230
Tragic
88.7%
Russians
5.0
/100
|
#231
Tragic
88.7%
Immigrants | Japan
4.9
/100
|
#232
Tragic
88.7%
Houma
4.8
/100
|
#233
Tragic
88.6%
Immigrants | Peru
4.7
/100
|
#234
Tragic
88.6%
Paiute
4.6
/100
|
#235
Tragic
88.6%
Immigrants | Pakistan
4.5
/100
|
#236
Tragic
88.6%
Immigrants | Turkey
4.4
/100
|
#237
Tragic
88.6%
Immigrants | Somalia
4.2
/100
|
#238
Tragic
88.6%
Kiowa
3.8
/100
|
#239
Tragic
88.6%
Eastern Europeans
3.0
/100
|
#240
Tragic
88.5%
Taiwanese
2.6
/100
|
#241
Tragic
88.4%
Turks
2.5
/100
|
#242
Tragic
88.4%
Immigrants | Belgium
2.1
/100
|
#243
Tragic
88.4%