Cedar Point, TX
Cedar Point Map
Cedar Point Overview
301
TOTAL POPULATION
147
MALE POPULATION
154
FEMALE POPULATION
95.45
MALES / 100 FEMALES
104.76
FEMALES / 100 MALES
65.8
MEDIAN AGE
3.0
AVG FAMILY SIZE
1.8
AVG HOUSEHOLD SIZE
$44,522
PER CAPITA INCOME
$95,536
AVG FAMILY INCOME
0.41
INEQUALITY / GINI INDEX
55
LABOR FORCE [ PEOPLE ]
18.3%
PERCENT IN LABOR FORCE
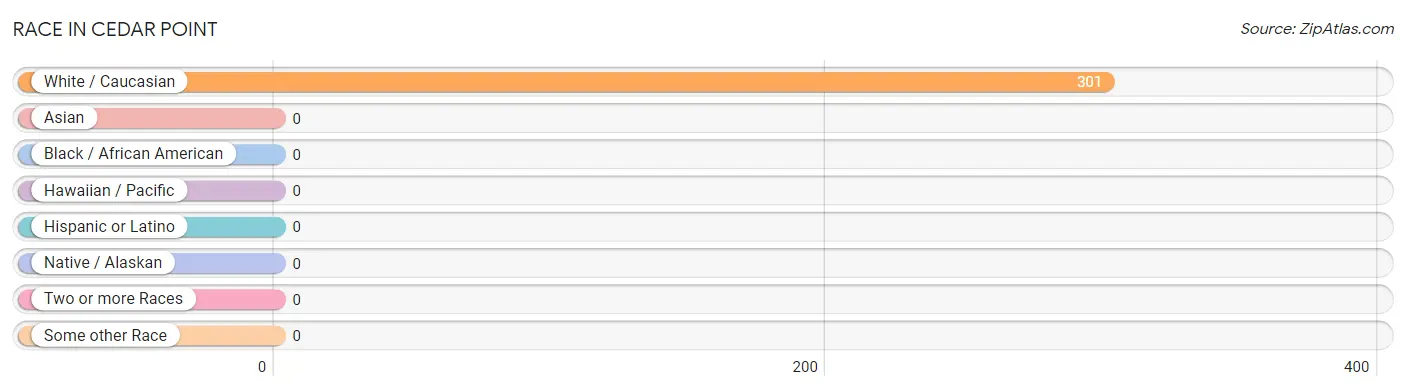
Race in Cedar Point
The most populous races in Cedar Point are , and White / Caucasian (301 | 100.0%).
| Race | # Population | % Population |
| Asian | 0 | 0.0% |
| Black / African American | 0 | 0.0% |
| Hawaiian / Pacific | 0 | 0.0% |
| Hispanic or Latino | 0 | 0.0% |
| Native / Alaskan | 0 | 0.0% |
| White / Caucasian | 301 | 100.0% |
| Two or more Races | 0 | 0.0% |
| Some other Race | 0 | 0.0% |
| Total | 301 | 100.0% |
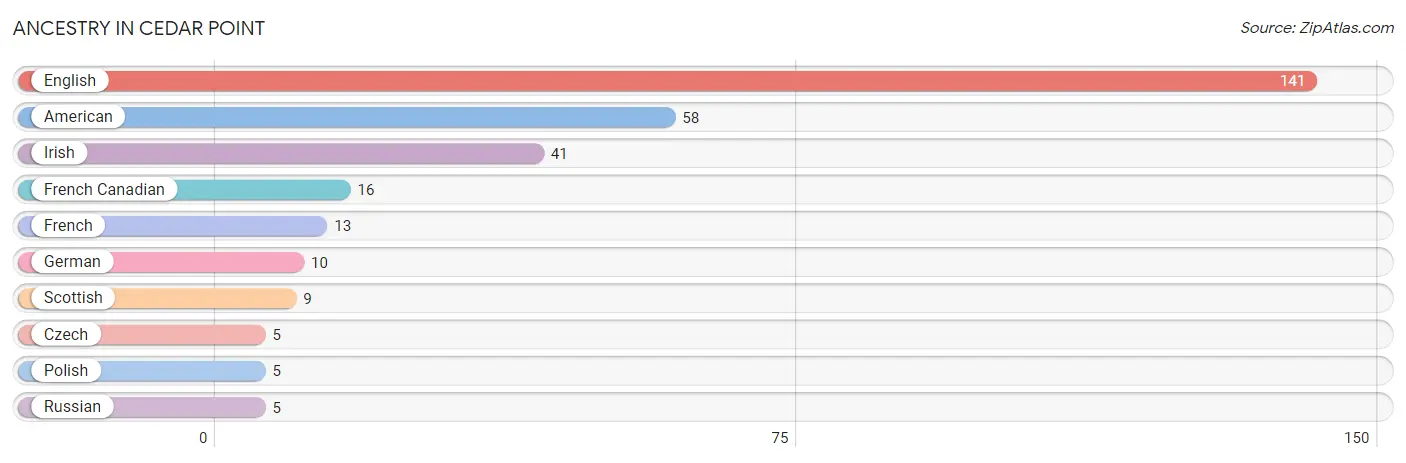
Ancestry in Cedar Point
The most populous ancestries reported in Cedar Point are English (141 | 46.8%), American (58 | 19.3%), Irish (41 | 13.6%), French Canadian (16 | 5.3%), and French (13 | 4.3%), together accounting for 89.4% of all Cedar Point residents.
| Ancestry | # Population | % Population |
| American | 58 | 19.3% |
| Czech | 5 | 1.7% |
| English | 141 | 46.8% |
| French | 13 | 4.3% |
| French Canadian | 16 | 5.3% |
| German | 10 | 3.3% |
| Irish | 41 | 13.6% |
| Polish | 5 | 1.7% |
| Russian | 5 | 1.7% |
| Scottish | 9 | 3.0% | View All 10 Rows |
Immigrants in Cedar Point

| Immigration Origin | # Population | % Population | View All 0 Rows |
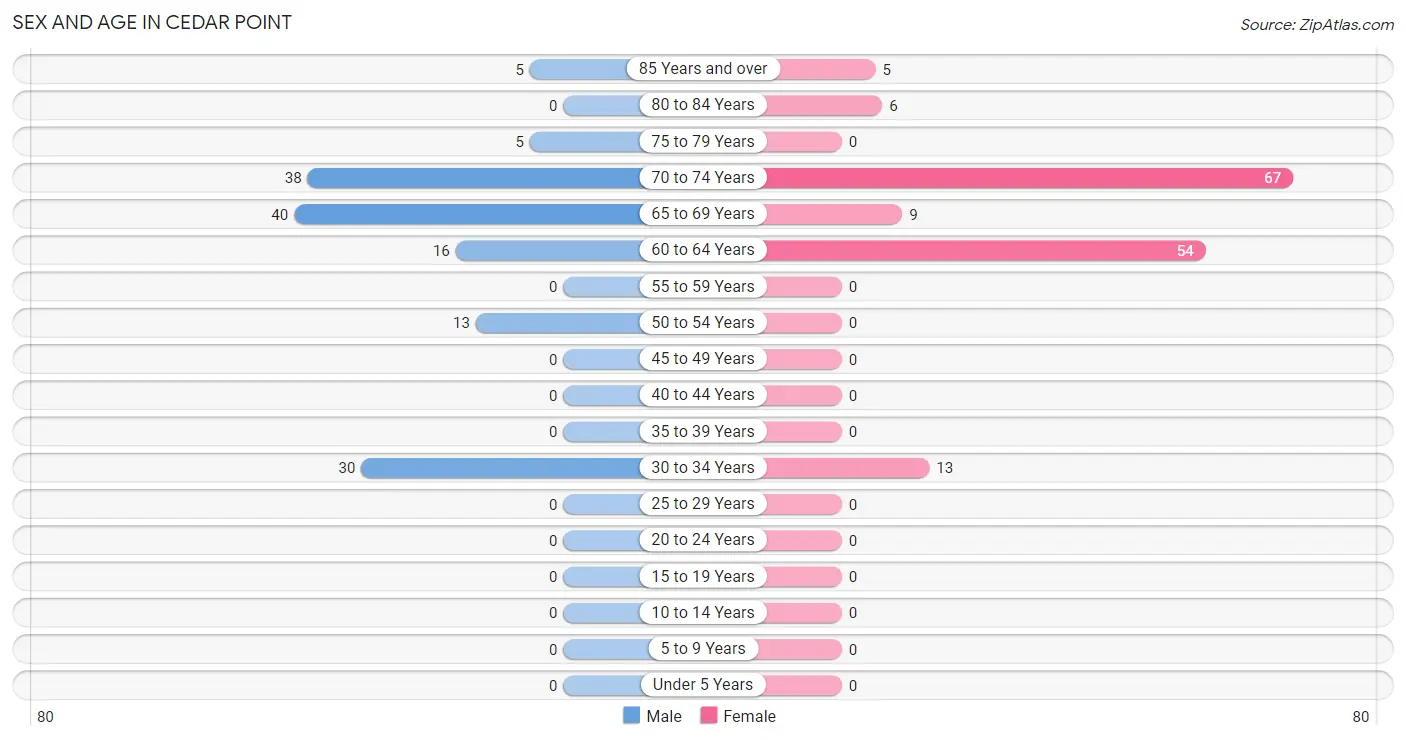
Sex and Age in Cedar Point
Sex and Age in Cedar Point
The most populous age groups in Cedar Point are 65 to 69 Years (40 | 27.2%) for men and 70 to 74 Years (67 | 43.5%) for women.
| Age Bracket | Male | Female |
| Under 5 Years | 0 (0.0%) | 0 (0.0%) |
| 5 to 9 Years | 0 (0.0%) | 0 (0.0%) |
| 10 to 14 Years | 0 (0.0%) | 0 (0.0%) |
| 15 to 19 Years | 0 (0.0%) | 0 (0.0%) |
| 20 to 24 Years | 0 (0.0%) | 0 (0.0%) |
| 25 to 29 Years | 0 (0.0%) | 0 (0.0%) |
| 30 to 34 Years | 30 (20.4%) | 13 (8.4%) |
| 35 to 39 Years | 0 (0.0%) | 0 (0.0%) |
| 40 to 44 Years | 0 (0.0%) | 0 (0.0%) |
| 45 to 49 Years | 0 (0.0%) | 0 (0.0%) |
| 50 to 54 Years | 13 (8.8%) | 0 (0.0%) |
| 55 to 59 Years | 0 (0.0%) | 0 (0.0%) |
| 60 to 64 Years | 16 (10.9%) | 54 (35.1%) |
| 65 to 69 Years | 40 (27.2%) | 9 (5.8%) |
| 70 to 74 Years | 38 (25.9%) | 67 (43.5%) |
| 75 to 79 Years | 5 (3.4%) | 0 (0.0%) |
| 80 to 84 Years | 0 (0.0%) | 6 (3.9%) |
| 85 Years and over | 5 (3.4%) | 5 (3.3%) |
| Total | 147 (100.0%) | 154 (100.0%) |
Families and Households in Cedar Point
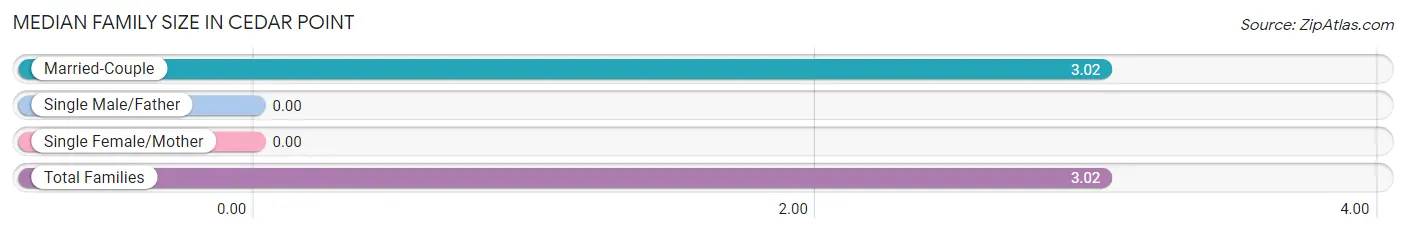
Median Family Size in Cedar Point
| Family Type | # Families | Family Size |
| Married-Couple | 48 (100.0%) | 3.02 |
| Single Male/Father | 0 (0.0%) | - |
| Single Female/Mother | 0 (0.0%) | - |
| Total Families | 48 (100.0%) | 3.02 |
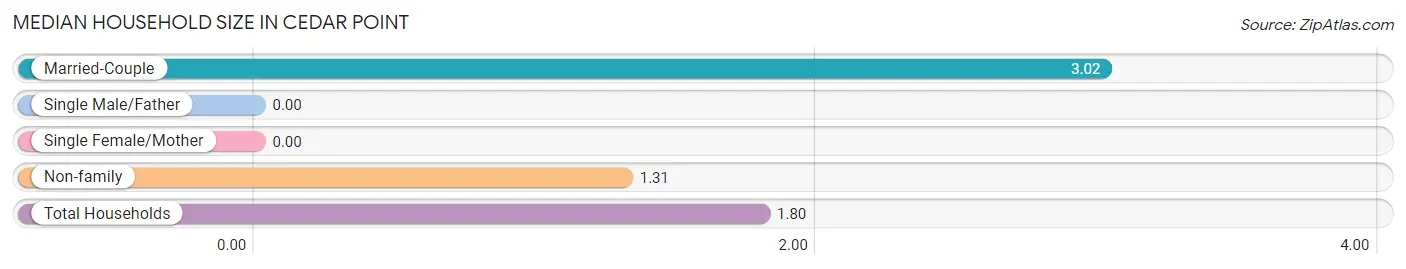
Median Household Size in Cedar Point
| Household Type | # Households | Household Size |
| Married-Couple | 48 (28.7%) | 3.02 |
| Single Male/Father | 0 (0.0%) | - |
| Single Female/Mother | 0 (0.0%) | - |
| Non-family | 119 (71.3%) | 1.31 |
| Total Households | 167 (100.0%) | 1.80 |
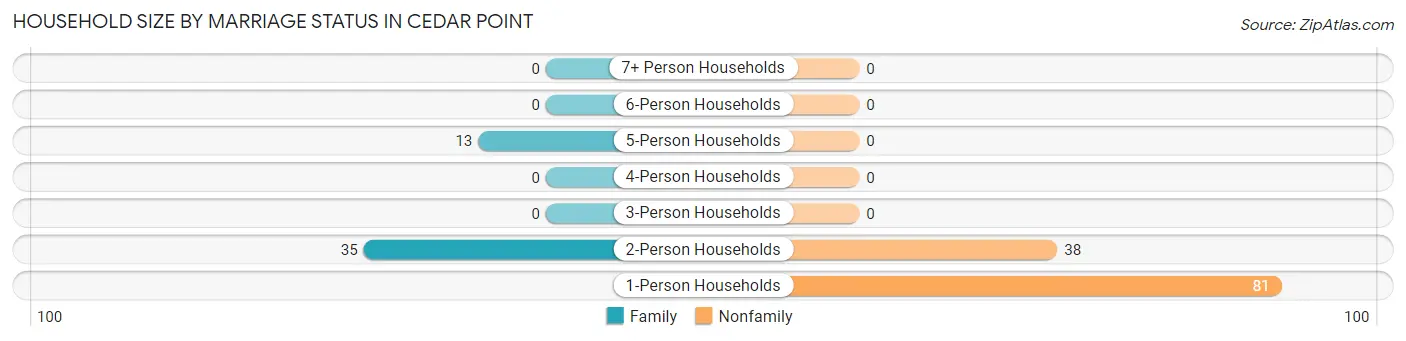
Household Size by Marriage Status in Cedar Point
Out of a total of 167 households in Cedar Point, 48 (28.7%) are family households, while 119 (71.3%) are nonfamily households. The most numerous type of family households are 2-person households, comprising 35, and the most common type of nonfamily households are 1-person households, comprising 81.
| Household Size | Family Households | Nonfamily Households |
| 1-Person Households | - | 81 (48.5%) |
| 2-Person Households | 35 (21.0%) | 38 (22.8%) |
| 3-Person Households | 0 (0.0%) | 0 (0.0%) |
| 4-Person Households | 0 (0.0%) | 0 (0.0%) |
| 5-Person Households | 13 (7.8%) | 0 (0.0%) |
| 6-Person Households | 0 (0.0%) | 0 (0.0%) |
| 7+ Person Households | 0 (0.0%) | 0 (0.0%) |
| Total | 48 (28.7%) | 119 (71.3%) |
Female Fertility in Cedar Point
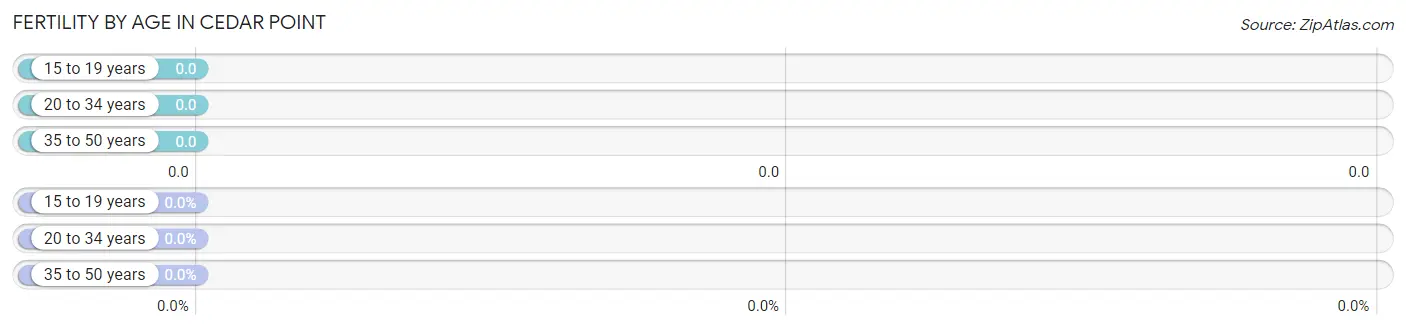
Fertility by Age in Cedar Point
| Age Bracket | Women with Births | Births / 1,000 Women |
| 15 to 19 years | 0 (0.0%) | 0.0 |
| 20 to 34 years | 0 (0.0%) | 0.0 |
| 35 to 50 years | 0 (0.0%) | 0.0 |
| Total | 0 (0.0%) | 0.0 |
Fertility by Age by Marriage Status in Cedar Point
| Age Bracket | Married | Unmarried |
| 15 to 19 years | 0 (0.0%) | 0 (0.0%) |
| 20 to 34 years | 0 (0.0%) | 0 (0.0%) |
| 35 to 50 years | 0 (0.0%) | 0 (0.0%) |
| Total | 0 (0.0%) | 0 (0.0%) |
Fertility by Education in Cedar Point
| Educational Attainment | Women with Births | Births / 1,000 Women |
| Less than High School | 0 (0.0%) | 0.0 |
| High School Diploma | 0 (0.0%) | 0.0 |
| College or Associate's Degree | 0 (0.0%) | 0.0 |
| Bachelor's Degree | 0 (0.0%) | 0.0 |
| Graduate Degree | 0 (0.0%) | 0.0 |
| Total | 0 (0.0%) | 0.0 |
Fertility by Education by Marriage Status in Cedar Point
| Educational Attainment | Married | Unmarried |
| Less than High School | 0 (0.0%) | 0 (0.0%) |
| High School Diploma | 0 (0.0%) | 0 (0.0%) |
| College or Associate's Degree | 0 (0.0%) | 0 (0.0%) |
| Bachelor's Degree | 0 (0.0%) | 0 (0.0%) |
| Graduate Degree | 0 (0.0%) | 0 (0.0%) |
| Total | 0 (0.0%) | 0 (0.0%) |
Income in Cedar Point
Income Overview in Cedar Point
| Characteristic | Number | Measure |
| Per Capita Income | 301 | $44,522 |
| Median Family Income | 48 | $95,536 |
| Mean Family Income | 48 | $99,583 |
| Median Household Income | 167 | $0 |
| Mean Household Income | 167 | $78,781 |
| Income Deficit | 48 | $0 |
| Wage / Income Gap (%) | 301 | 0.00% |
| Wage / Income Gap ($) | 301 | 100.00¢ per $1 |
| Gini / Inequality Index | 301 | 0.41 |
Earnings by Sex in Cedar Point
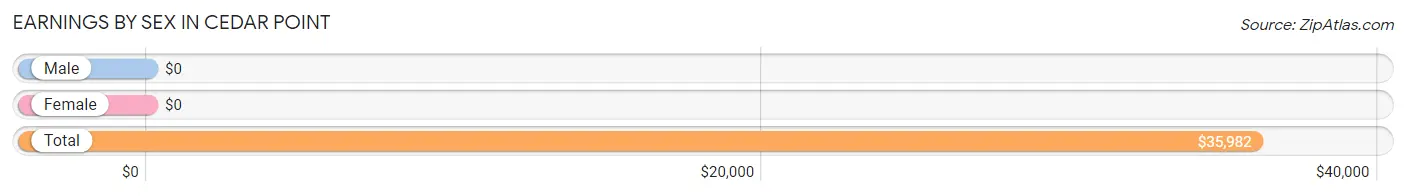
| Sex | Number | Average Earnings |
| Male | 60 (68.2%) | $0 |
| Female | 28 (31.8%) | $0 |
| Total | 88 (100.0%) | $35,982 |
Earnings by Sex by Income Bracket in Cedar Point
The most common earnings brackets in Cedar Point are $10,000 to $12,499 for men (16 | 26.7%) and $35,000 to $39,999 for women (28 | 100.0%).
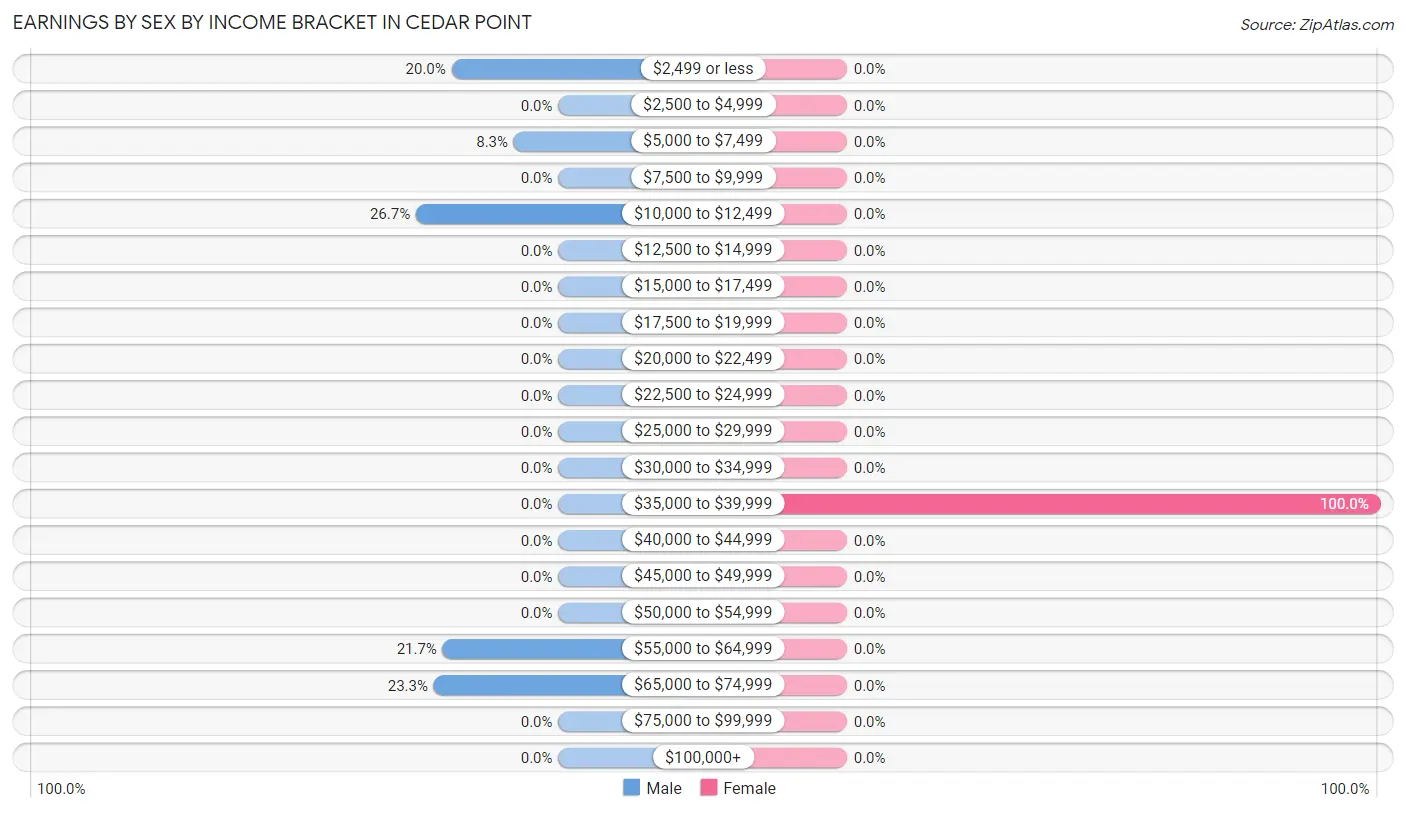
| Income | Male | Female |
| $2,499 or less | 12 (20.0%) | 0 (0.0%) |
| $2,500 to $4,999 | 0 (0.0%) | 0 (0.0%) |
| $5,000 to $7,499 | 5 (8.3%) | 0 (0.0%) |
| $7,500 to $9,999 | 0 (0.0%) | 0 (0.0%) |
| $10,000 to $12,499 | 16 (26.7%) | 0 (0.0%) |
| $12,500 to $14,999 | 0 (0.0%) | 0 (0.0%) |
| $15,000 to $17,499 | 0 (0.0%) | 0 (0.0%) |
| $17,500 to $19,999 | 0 (0.0%) | 0 (0.0%) |
| $20,000 to $22,499 | 0 (0.0%) | 0 (0.0%) |
| $22,500 to $24,999 | 0 (0.0%) | 0 (0.0%) |
| $25,000 to $29,999 | 0 (0.0%) | 0 (0.0%) |
| $30,000 to $34,999 | 0 (0.0%) | 0 (0.0%) |
| $35,000 to $39,999 | 0 (0.0%) | 28 (100.0%) |
| $40,000 to $44,999 | 0 (0.0%) | 0 (0.0%) |
| $45,000 to $49,999 | 0 (0.0%) | 0 (0.0%) |
| $50,000 to $54,999 | 0 (0.0%) | 0 (0.0%) |
| $55,000 to $64,999 | 13 (21.7%) | 0 (0.0%) |
| $65,000 to $74,999 | 14 (23.3%) | 0 (0.0%) |
| $75,000 to $99,999 | 0 (0.0%) | 0 (0.0%) |
| $100,000+ | 0 (0.0%) | 0 (0.0%) |
| Total | 60 (100.0%) | 28 (100.0%) |
Earnings by Sex by Educational Attainment in Cedar Point
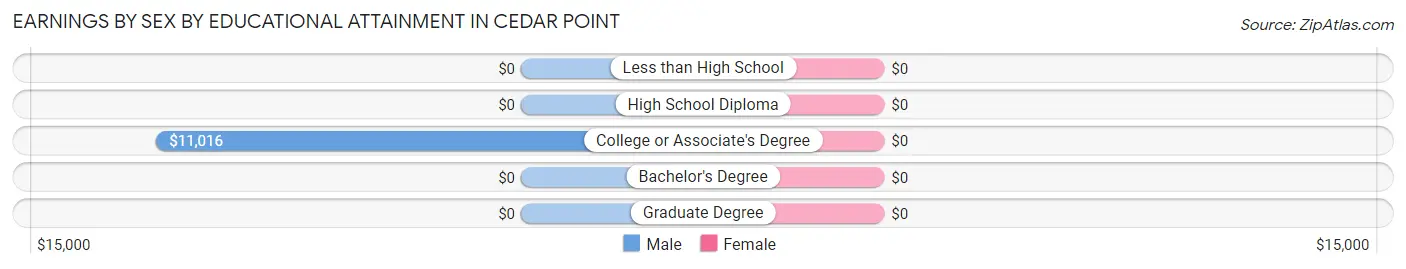
| Educational Attainment | Male Income | Female Income |
| Less than High School | - | - |
| High School Diploma | - | - |
| College or Associate's Degree | $11,016 | $0 |
| Bachelor's Degree | - | - |
| Graduate Degree | - | - |
| Total | - | - |
Family Income in Cedar Point
Family Income Brackets in Cedar Point
According to the Cedar Point family income data, there are 16 families falling into the $50,000 to $74,999 income range, which is the most common income bracket and makes up 33.3% of all families.
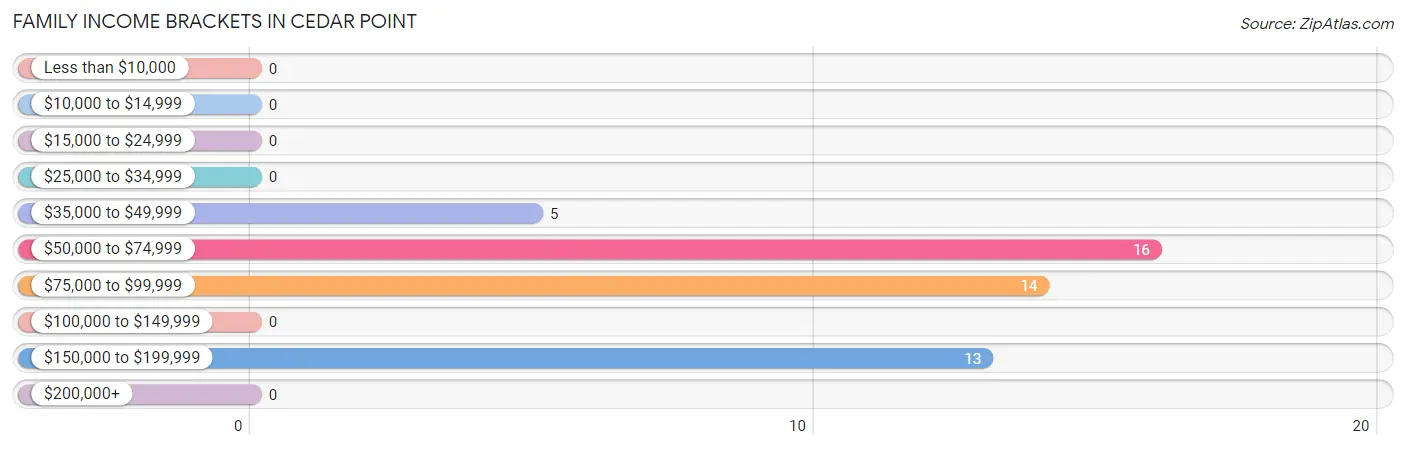
| Income Bracket | # Families | % Families |
| Less than $10,000 | 0 | 0.0% |
| $10,000 to $14,999 | 0 | 0.0% |
| $15,000 to $24,999 | 0 | 0.0% |
| $25,000 to $34,999 | 0 | 0.0% |
| $35,000 to $49,999 | 5 | 10.4% |
| $50,000 to $74,999 | 16 | 33.3% |
| $75,000 to $99,999 | 14 | 29.2% |
| $100,000 to $149,999 | 0 | 0.0% |
| $150,000 to $199,999 | 13 | 27.1% |
| $200,000+ | 0 | 0.0% |
Family Income by Famaliy Size in Cedar Point
2-person families (35 | 72.9%) account for the highest median family income in Cedar Point with $66,705 per family, while 2-person families (35 | 72.9%) have the highest median income of $33,352 per family member.
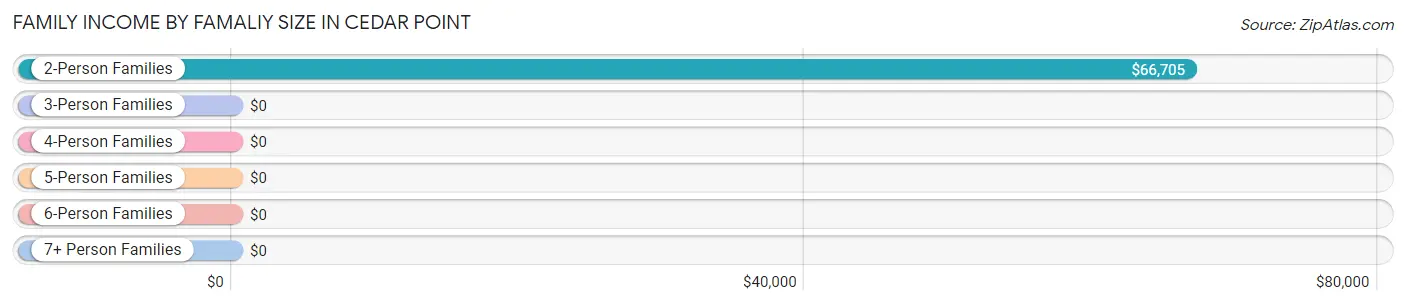
| Income Bracket | # Families | Median Income |
| 2-Person Families | 35 (72.9%) | $66,705 |
| 3-Person Families | 0 (0.0%) | $0 |
| 4-Person Families | 0 (0.0%) | $0 |
| 5-Person Families | 13 (27.1%) | $0 |
| 6-Person Families | 0 (0.0%) | $0 |
| 7+ Person Families | 0 (0.0%) | $0 |
| Total | 48 (100.0%) | $95,536 |
Family Income by Number of Earners in Cedar Point
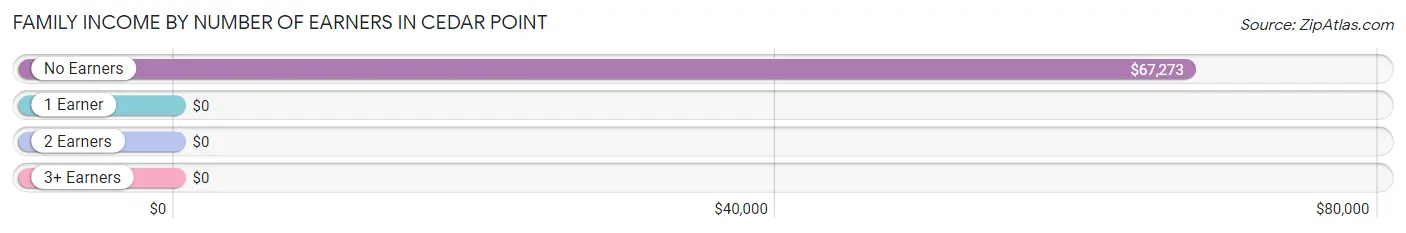
| Number of Earners | # Families | Median Income |
| No Earners | 30 (62.5%) | $67,273 |
| 1 Earner | 5 (10.4%) | $0 |
| 2 Earners | 0 (0.0%) | $0 |
| 3+ Earners | 13 (27.1%) | $0 |
| Total | 48 (100.0%) | $95,536 |
Household Income in Cedar Point
Household Income Brackets in Cedar Point
With 47 households falling in the category, the $15,000 to $24,999 income range is the most frequent in Cedar Point, accounting for 28.1% of all households.
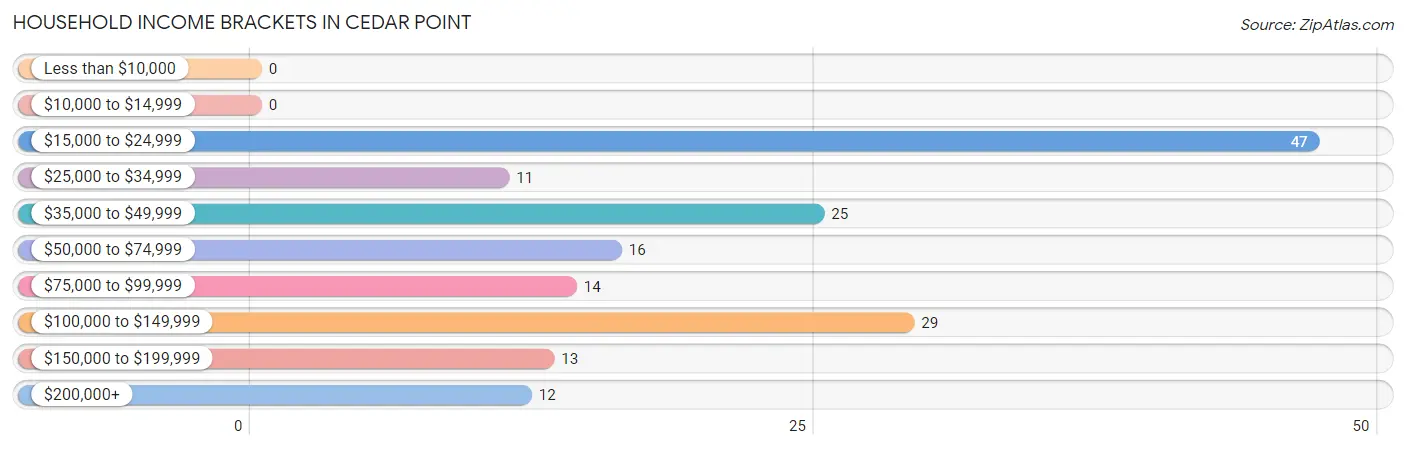
| Income Bracket | # Households | % Households |
| Less than $10,000 | 0 | 0.0% |
| $10,000 to $14,999 | 0 | 0.0% |
| $15,000 to $24,999 | 47 | 28.1% |
| $25,000 to $34,999 | 11 | 6.6% |
| $35,000 to $49,999 | 25 | 15.0% |
| $50,000 to $74,999 | 16 | 9.6% |
| $75,000 to $99,999 | 14 | 8.4% |
| $100,000 to $149,999 | 29 | 17.4% |
| $150,000 to $199,999 | 13 | 7.8% |
| $200,000+ | 12 | 7.2% |
Household Income by Householder Age in Cedar Point
The median household income in Cedar Point is $0, with the highest median household income of $45,556 found in the 65+ years age bracket for the primary householder. A total of 140 households (83.8%) fall into this category.
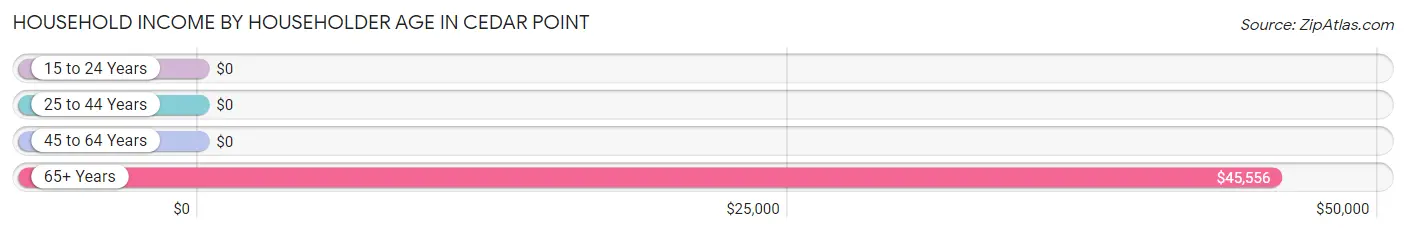
| Income Bracket | # Households | Median Income |
| 15 to 24 Years | 0 (0.0%) | $0 |
| 25 to 44 Years | 13 (7.8%) | $0 |
| 45 to 64 Years | 14 (8.4%) | $0 |
| 65+ Years | 140 (83.8%) | $45,556 |
| Total | 167 (100.0%) | $0 |
Poverty in Cedar Point
Income Below Poverty by Sex and Age in Cedar Point
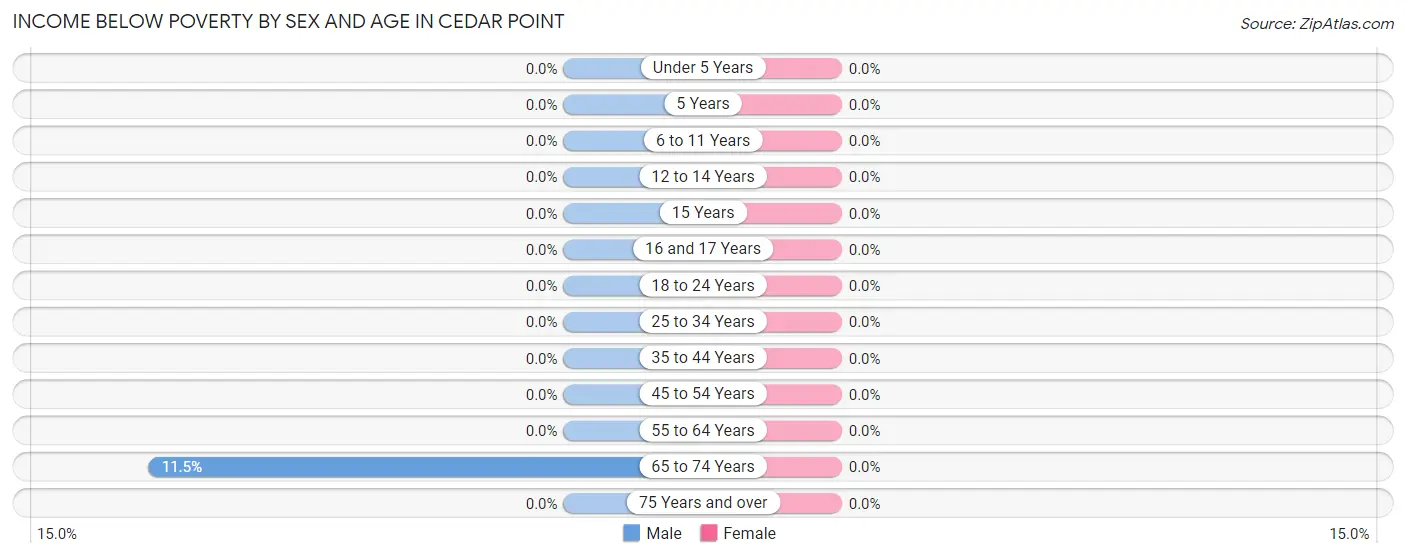
| Age Bracket | Male | Female |
| Under 5 Years | 0 (0.0%) | 0 (0.0%) |
| 5 Years | 0 (0.0%) | 0 (0.0%) |
| 6 to 11 Years | 0 (0.0%) | 0 (0.0%) |
| 12 to 14 Years | 0 (0.0%) | 0 (0.0%) |
| 15 Years | 0 (0.0%) | 0 (0.0%) |
| 16 and 17 Years | 0 (0.0%) | 0 (0.0%) |
| 18 to 24 Years | 0 (0.0%) | 0 (0.0%) |
| 25 to 34 Years | 0 (0.0%) | 0 (0.0%) |
| 35 to 44 Years | 0 (0.0%) | 0 (0.0%) |
| 45 to 54 Years | 0 (0.0%) | 0 (0.0%) |
| 55 to 64 Years | 0 (0.0%) | 0 (0.0%) |
| 65 to 74 Years | 9 (11.5%) | 0 (0.0%) |
| 75 Years and over | 0 (0.0%) | 0 (0.0%) |
| Total | 9 (6.1%) | 0 (0.0%) |
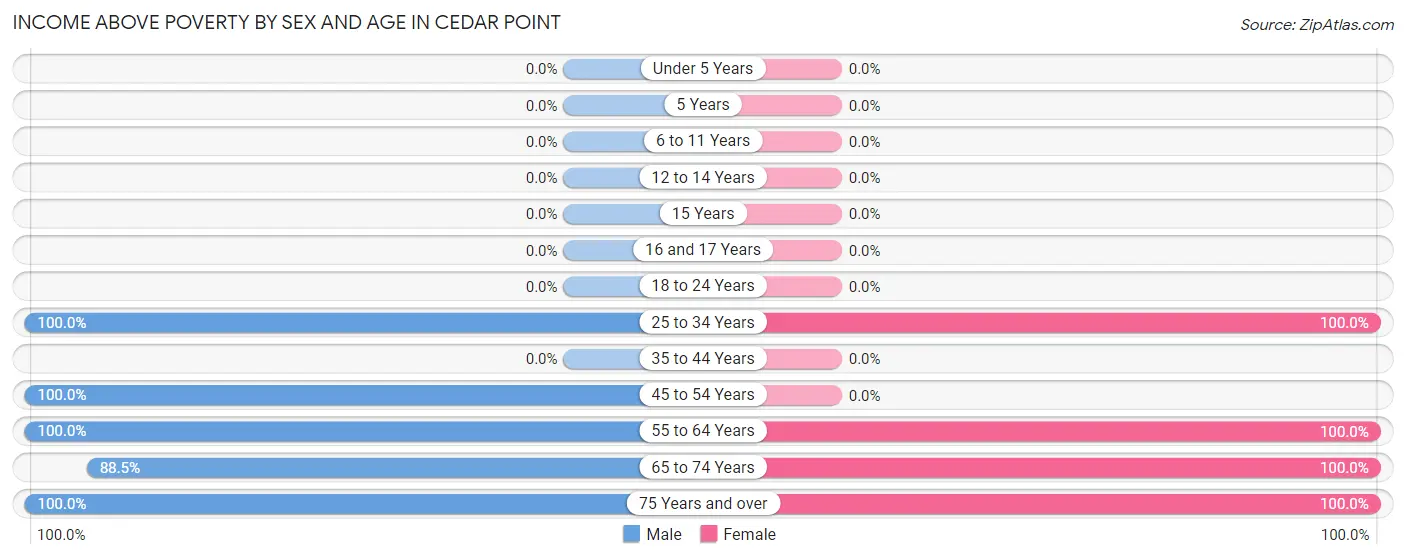
Income Above Poverty by Sex and Age in Cedar Point
According to the poverty statistics in Cedar Point, males aged 25 to 34 years and females aged 25 to 34 years are the age groups that are most secure financially, with 100.0% of males and 100.0% of females in these age groups living above the poverty line.
| Age Bracket | Male | Female |
| Under 5 Years | 0 (0.0%) | 0 (0.0%) |
| 5 Years | 0 (0.0%) | 0 (0.0%) |
| 6 to 11 Years | 0 (0.0%) | 0 (0.0%) |
| 12 to 14 Years | 0 (0.0%) | 0 (0.0%) |
| 15 Years | 0 (0.0%) | 0 (0.0%) |
| 16 and 17 Years | 0 (0.0%) | 0 (0.0%) |
| 18 to 24 Years | 0 (0.0%) | 0 (0.0%) |
| 25 to 34 Years | 30 (100.0%) | 13 (100.0%) |
| 35 to 44 Years | 0 (0.0%) | 0 (0.0%) |
| 45 to 54 Years | 13 (100.0%) | 0 (0.0%) |
| 55 to 64 Years | 16 (100.0%) | 54 (100.0%) |
| 65 to 74 Years | 69 (88.5%) | 76 (100.0%) |
| 75 Years and over | 10 (100.0%) | 11 (100.0%) |
| Total | 138 (93.9%) | 154 (100.0%) |
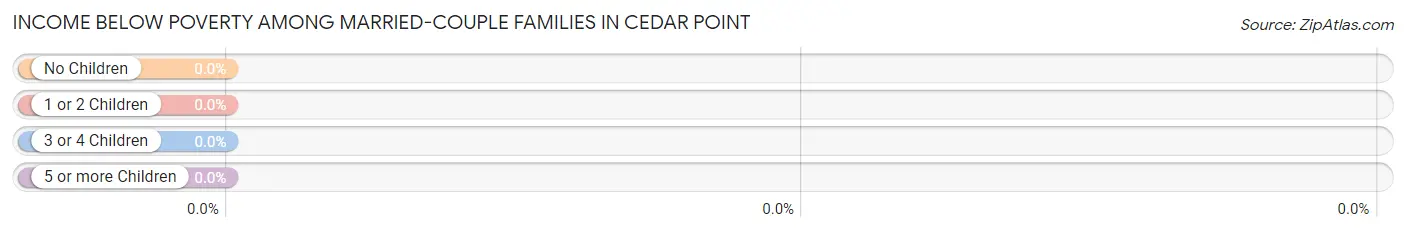
Income Below Poverty Among Married-Couple Families in Cedar Point
| Children | Above Poverty | Below Poverty |
| No Children | 48 (100.0%) | 0 (0.0%) |
| 1 or 2 Children | 0 (0.0%) | 0 (0.0%) |
| 3 or 4 Children | 0 (0.0%) | 0 (0.0%) |
| 5 or more Children | 0 (0.0%) | 0 (0.0%) |
| Total | 48 (100.0%) | 0 (0.0%) |
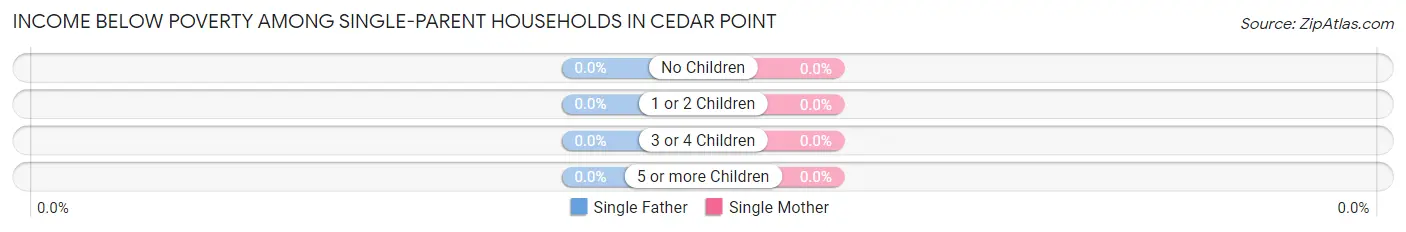
Income Below Poverty Among Single-Parent Households in Cedar Point
| Children | Single Father | Single Mother |
| No Children | 0 (0.0%) | 0 (0.0%) |
| 1 or 2 Children | 0 (0.0%) | 0 (0.0%) |
| 3 or 4 Children | 0 (0.0%) | 0 (0.0%) |
| 5 or more Children | 0 (0.0%) | 0 (0.0%) |
| Total | 0 (0.0%) | 0 (0.0%) |
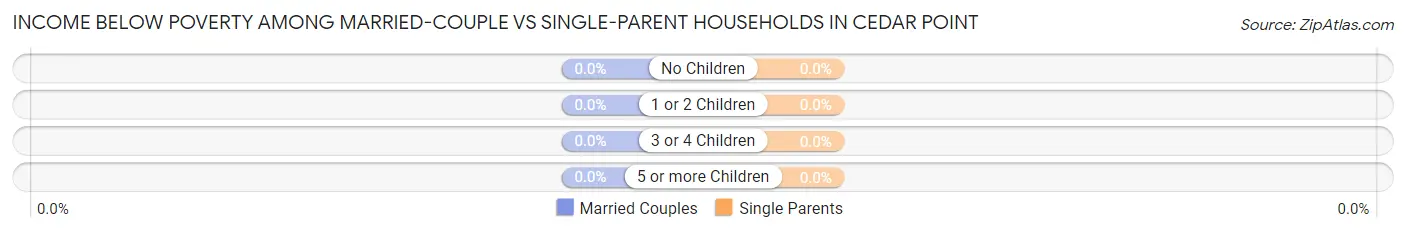
Income Below Poverty Among Married-Couple vs Single-Parent Households in Cedar Point
| Children | Married-Couple Families | Single-Parent Households |
| No Children | 0 (0.0%) | 0 (0.0%) |
| 1 or 2 Children | 0 (0.0%) | 0 (0.0%) |
| 3 or 4 Children | 0 (0.0%) | 0 (0.0%) |
| 5 or more Children | 0 (0.0%) | 0 (0.0%) |
| Total | 0 (0.0%) | 0 (0.0%) |
Employment Characteristics in Cedar Point
Employment by Class of Employer in Cedar Point
Among the 55 employed individuals in Cedar Point, private company employees (41 | 74.6%), and state government employees (14 | 25.5%) make up the most common classes of employment.
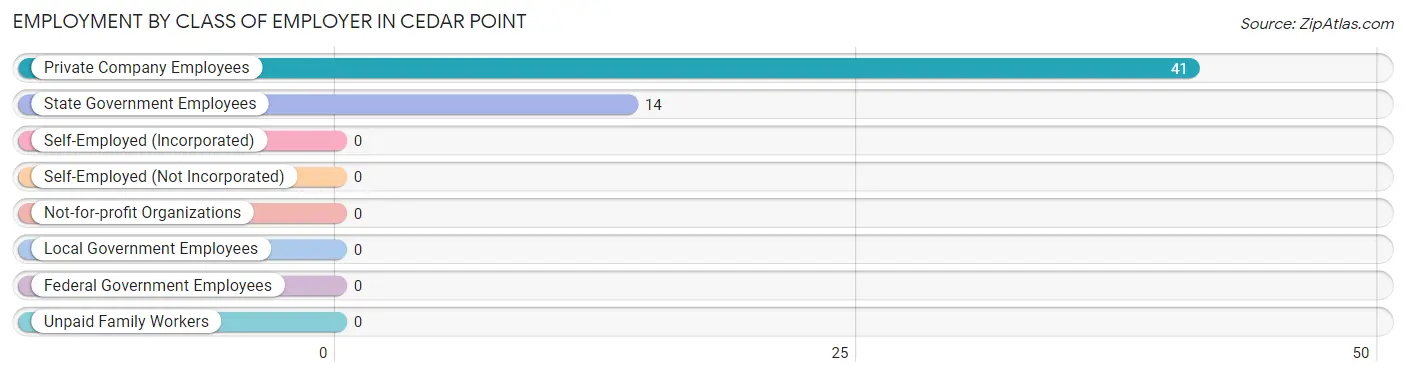
| Employer Class | # Employees | % Employees |
| Private Company Employees | 41 | 74.6% |
| Self-Employed (Incorporated) | 0 | 0.0% |
| Self-Employed (Not Incorporated) | 0 | 0.0% |
| Not-for-profit Organizations | 0 | 0.0% |
| Local Government Employees | 0 | 0.0% |
| State Government Employees | 14 | 25.5% |
| Federal Government Employees | 0 | 0.0% |
| Unpaid Family Workers | 0 | 0.0% |
| Total | 55 | 100.0% |
Employment Status by Age in Cedar Point
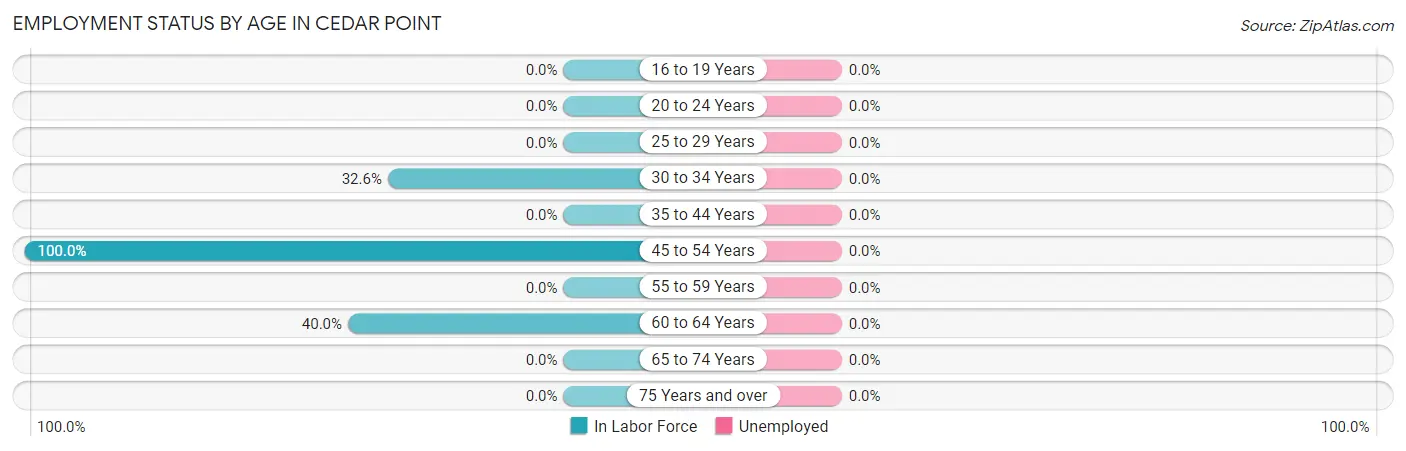
| Age Bracket | In Labor Force | Unemployed |
| 16 to 19 Years | 0 (0.0%) | 0 (0.0%) |
| 20 to 24 Years | 0 (0.0%) | 0 (0.0%) |
| 25 to 29 Years | 0 (0.0%) | 0 (0.0%) |
| 30 to 34 Years | 14 (32.6%) | 0 (0.0%) |
| 35 to 44 Years | 0 (0.0%) | 0 (0.0%) |
| 45 to 54 Years | 13 (100.0%) | 0 (0.0%) |
| 55 to 59 Years | 0 (0.0%) | 0 (0.0%) |
| 60 to 64 Years | 28 (40.0%) | 0 (0.0%) |
| 65 to 74 Years | 0 (0.0%) | 0 (0.0%) |
| 75 Years and over | 0 (0.0%) | 0 (0.0%) |
| Total | 55 (18.3%) | 0 (0.0%) |
Employment Status by Educational Attainment in Cedar Point
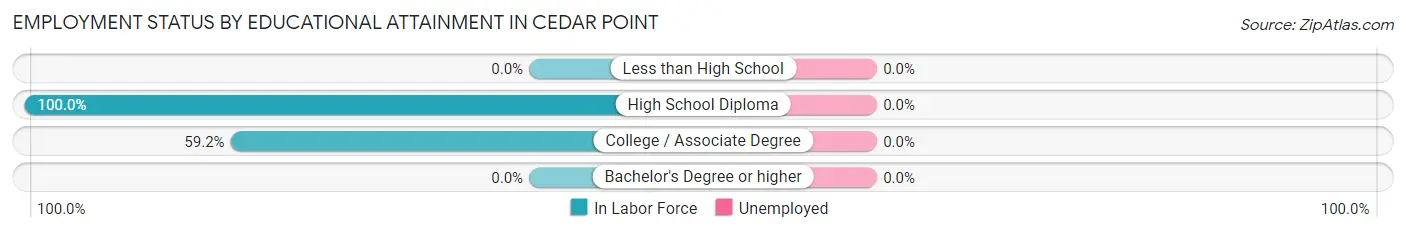
| Educational Attainment | In Labor Force | Unemployed |
| Less than High School | 0 (0.0%) | 0 (0.0%) |
| High School Diploma | 13 (100.0%) | 0 (0.0%) |
| College / Associate Degree | 42 (59.2%) | 0 (0.0%) |
| Bachelor's Degree or higher | 0 (0.0%) | 0 (0.0%) |
| Total | 55 (43.7%) | 0 (0.0%) |
Employment Occupations by Sex in Cedar Point
Management, Business, Science and Arts Occupations
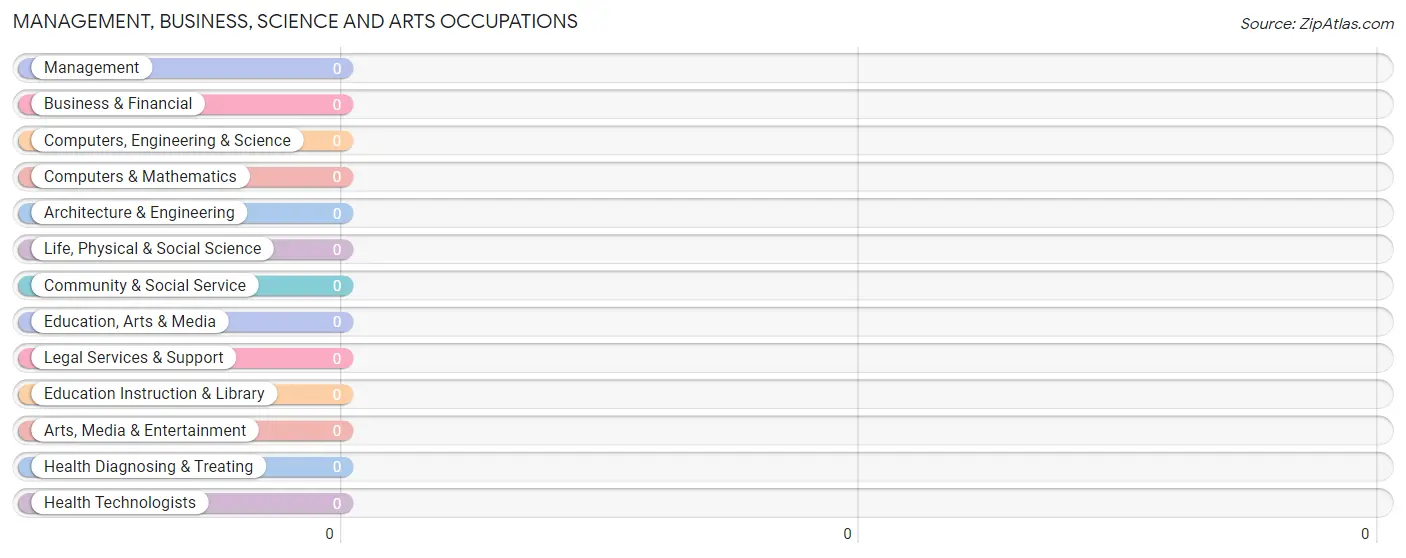
Management, Business, Science and Arts Occupations by Sex
| Occupation | Male | Female |
| Management | 0 (0.0%) | 0 (0.0%) |
| Business & Financial | 0 (0.0%) | 0 (0.0%) |
| Computers, Engineering & Science | 0 (0.0%) | 0 (0.0%) |
| Computers & Mathematics | 0 (0.0%) | 0 (0.0%) |
| Architecture & Engineering | 0 (0.0%) | 0 (0.0%) |
| Life, Physical & Social Science | 0 (0.0%) | 0 (0.0%) |
| Community & Social Service | 0 (0.0%) | 0 (0.0%) |
| Education, Arts & Media | 0 (0.0%) | 0 (0.0%) |
| Legal Services & Support | 0 (0.0%) | 0 (0.0%) |
| Education Instruction & Library | 0 (0.0%) | 0 (0.0%) |
| Arts, Media & Entertainment | 0 (0.0%) | 0 (0.0%) |
| Health Diagnosing & Treating | 0 (0.0%) | 0 (0.0%) |
| Health Technologists | 0 (0.0%) | 0 (0.0%) |
| Total (Category) | 0 (0.0%) | 0 (0.0%) |
| Total (Overall) | 27 (49.1%) | 28 (50.9%) |
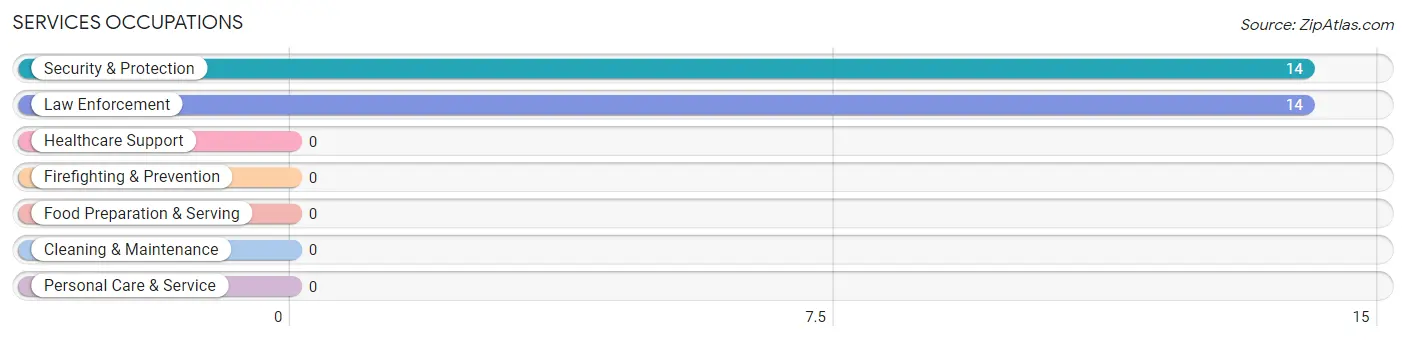
Services Occupations
The most common Services occupations in Cedar Point are Security & Protection (14 | 25.5%), and Law Enforcement (14 | 25.5%).
Services Occupations by Sex
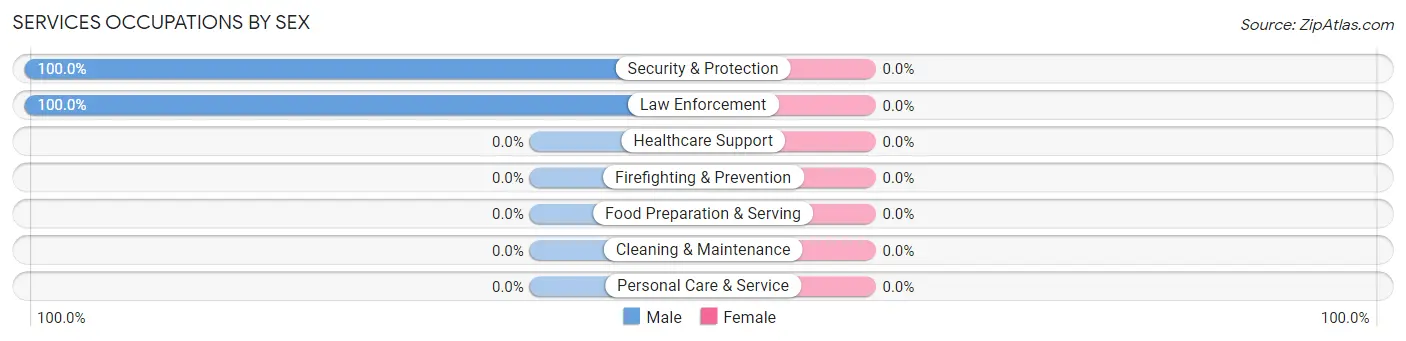
| Occupation | Male | Female |
| Healthcare Support | 0 (0.0%) | 0 (0.0%) |
| Security & Protection | 14 (100.0%) | 0 (0.0%) |
| Firefighting & Prevention | 0 (0.0%) | 0 (0.0%) |
| Law Enforcement | 14 (100.0%) | 0 (0.0%) |
| Food Preparation & Serving | 0 (0.0%) | 0 (0.0%) |
| Cleaning & Maintenance | 0 (0.0%) | 0 (0.0%) |
| Personal Care & Service | 0 (0.0%) | 0 (0.0%) |
| Total (Category) | 14 (100.0%) | 0 (0.0%) |
| Total (Overall) | 27 (49.1%) | 28 (50.9%) |
Sales and Office Occupations
The most common Sales and Office occupations in Cedar Point are , and Office & Administration (28 | 50.9%).
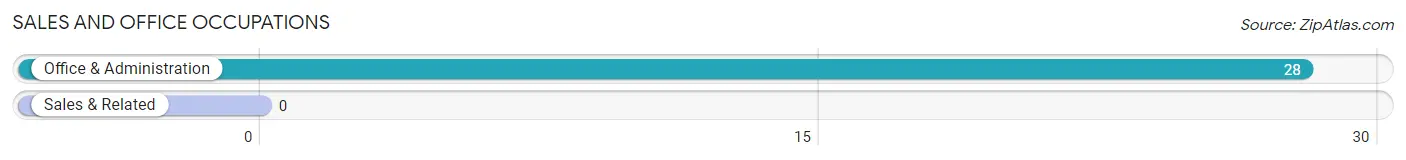
Sales and Office Occupations by Sex
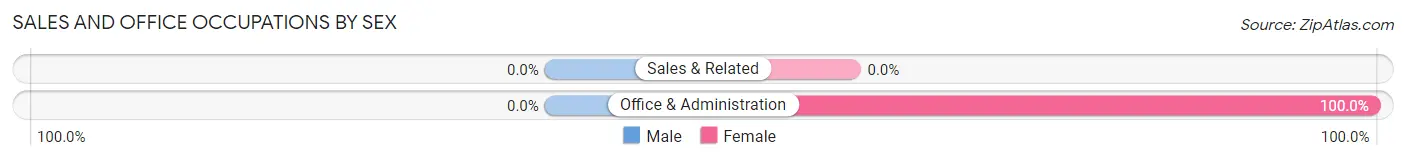
| Occupation | Male | Female |
| Sales & Related | 0 (0.0%) | 0 (0.0%) |
| Office & Administration | 0 (0.0%) | 28 (100.0%) |
| Total (Category) | 0 (0.0%) | 28 (100.0%) |
| Total (Overall) | 27 (49.1%) | 28 (50.9%) |
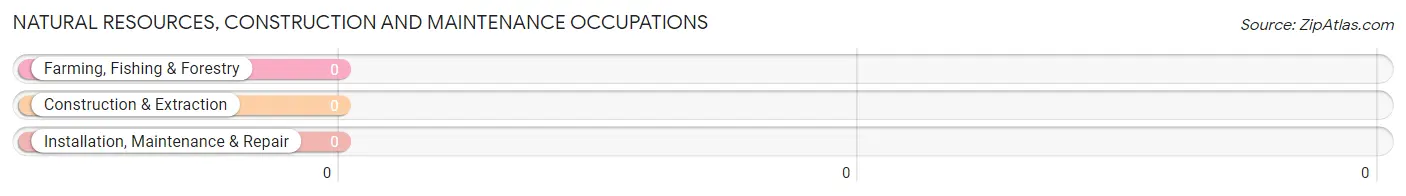
Natural Resources, Construction and Maintenance Occupations
Natural Resources, Construction and Maintenance Occupations by Sex
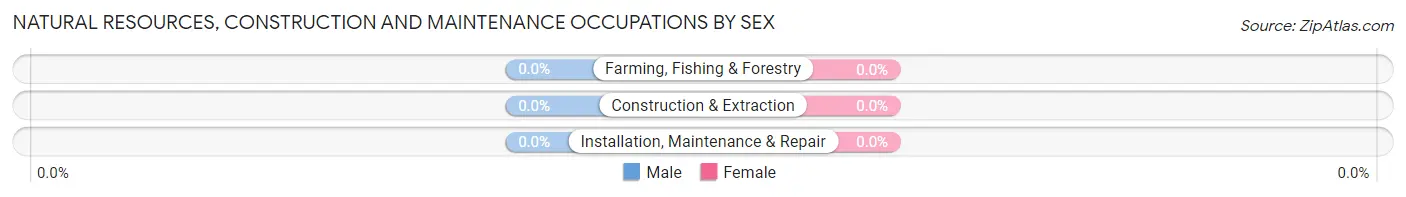
| Occupation | Male | Female |
| Farming, Fishing & Forestry | 0 (0.0%) | 0 (0.0%) |
| Construction & Extraction | 0 (0.0%) | 0 (0.0%) |
| Installation, Maintenance & Repair | 0 (0.0%) | 0 (0.0%) |
| Total (Category) | 0 (0.0%) | 0 (0.0%) |
| Total (Overall) | 27 (49.1%) | 28 (50.9%) |
Production, Transportation and Moving Occupations
The most common Production, Transportation and Moving occupations in Cedar Point are , and Material Moving (13 | 23.6%).
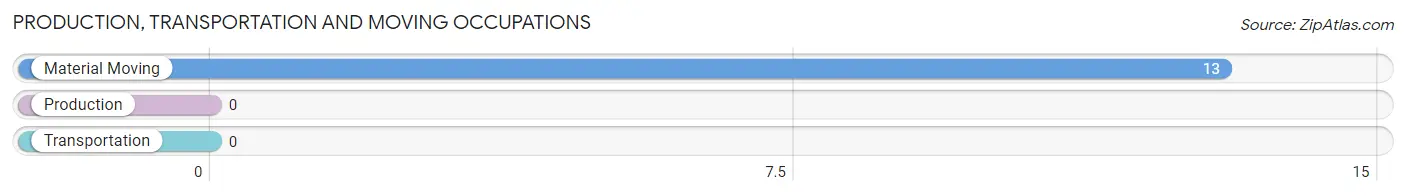
Production, Transportation and Moving Occupations by Sex
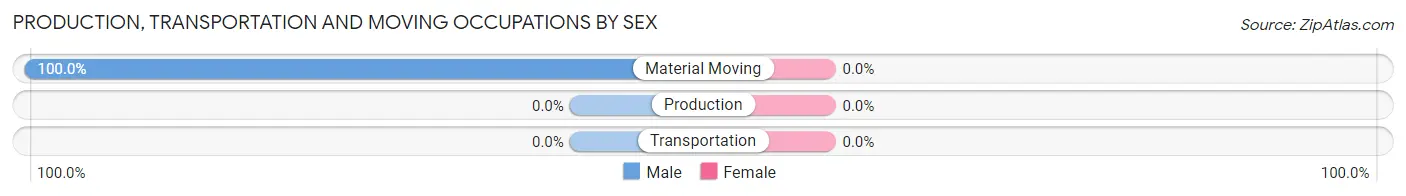
| Occupation | Male | Female |
| Production | 0 (0.0%) | 0 (0.0%) |
| Transportation | 0 (0.0%) | 0 (0.0%) |
| Material Moving | 13 (100.0%) | 0 (0.0%) |
| Total (Category) | 13 (100.0%) | 0 (0.0%) |
| Total (Overall) | 27 (49.1%) | 28 (50.9%) |
Employment Industries by Sex in Cedar Point
Employment Industries in Cedar Point
The major employment industries in Cedar Point include Administrative & Support (28 | 50.9%), Public Administration (14 | 25.5%), and Retail Trade (13 | 23.6%).
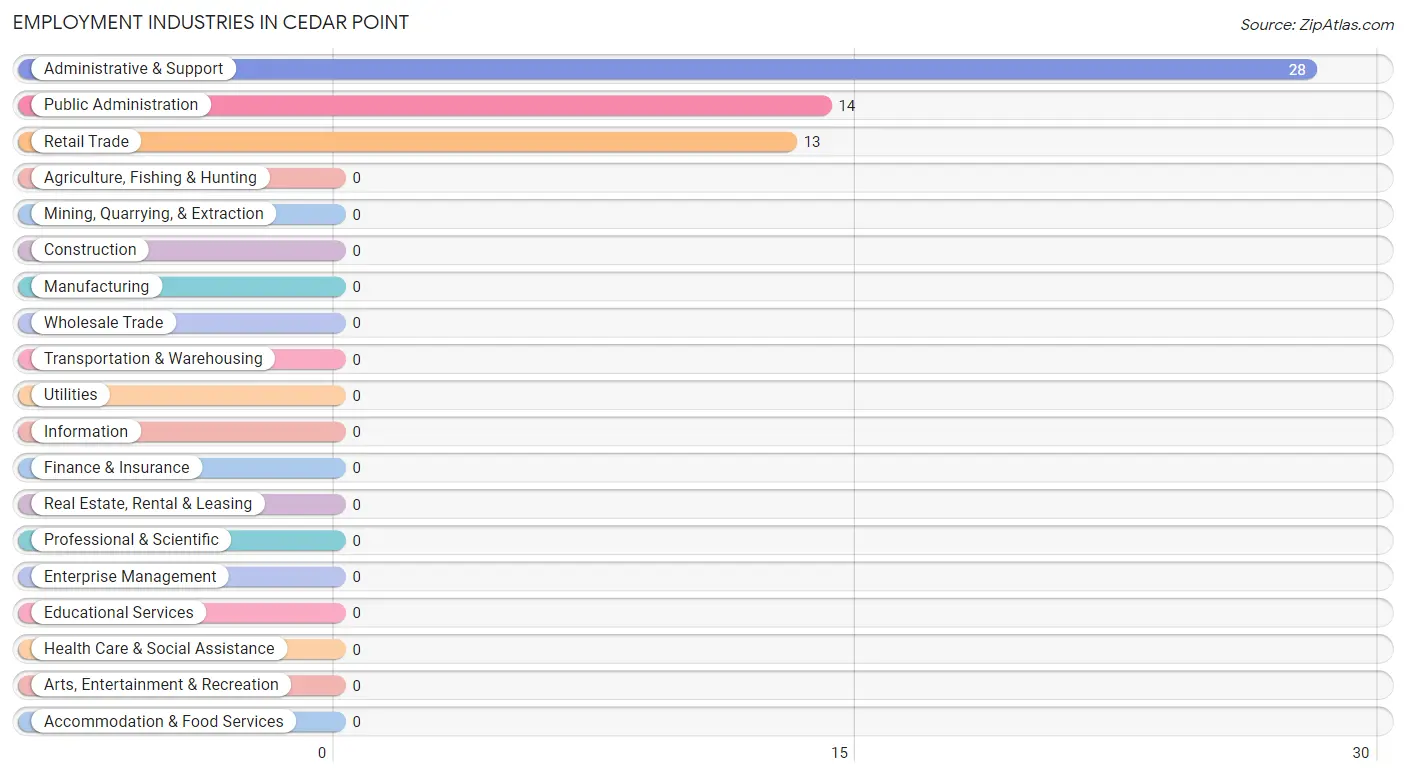
Employment Industries by Sex in Cedar Point
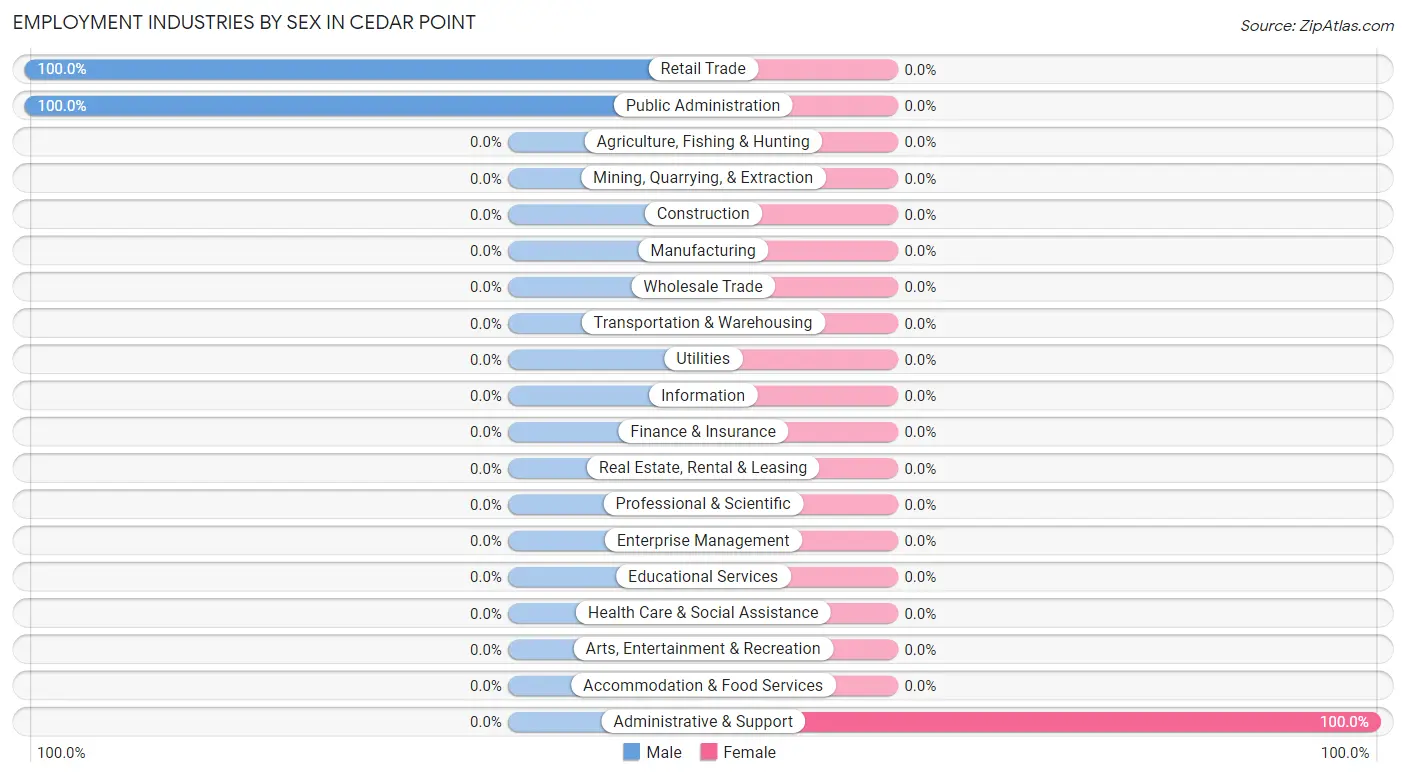
| Industry | Male | Female |
| Agriculture, Fishing & Hunting | 0 (0.0%) | 0 (0.0%) |
| Mining, Quarrying, & Extraction | 0 (0.0%) | 0 (0.0%) |
| Construction | 0 (0.0%) | 0 (0.0%) |
| Manufacturing | 0 (0.0%) | 0 (0.0%) |
| Wholesale Trade | 0 (0.0%) | 0 (0.0%) |
| Retail Trade | 13 (100.0%) | 0 (0.0%) |
| Transportation & Warehousing | 0 (0.0%) | 0 (0.0%) |
| Utilities | 0 (0.0%) | 0 (0.0%) |
| Information | 0 (0.0%) | 0 (0.0%) |
| Finance & Insurance | 0 (0.0%) | 0 (0.0%) |
| Real Estate, Rental & Leasing | 0 (0.0%) | 0 (0.0%) |
| Professional & Scientific | 0 (0.0%) | 0 (0.0%) |
| Enterprise Management | 0 (0.0%) | 0 (0.0%) |
| Administrative & Support | 0 (0.0%) | 28 (100.0%) |
| Educational Services | 0 (0.0%) | 0 (0.0%) |
| Health Care & Social Assistance | 0 (0.0%) | 0 (0.0%) |
| Arts, Entertainment & Recreation | 0 (0.0%) | 0 (0.0%) |
| Accommodation & Food Services | 0 (0.0%) | 0 (0.0%) |
| Public Administration | 14 (100.0%) | 0 (0.0%) |
| Total | 27 (49.1%) | 28 (50.9%) |
Education in Cedar Point
School Enrollment in Cedar Point
| School Level | # Students | % Students |
| Nursery / Preschool | 0 | 0.0% |
| Kindergarten | 0 | 0.0% |
| Elementary School | 0 | 0.0% |
| Middle School | 0 | 0.0% |
| High School | 0 | 0.0% |
| College / Undergraduate | 0 | 0.0% |
| Graduate / Professional | 0 | 0.0% |
| Total | 0 | 0.0% |
School Enrollment by Age by Funding Source in Cedar Point
| Age Bracket | Public School | Private School |
| 3 to 4 Year Olds | 0 (0.0%) | 0 (0.0%) |
| 5 to 9 Year Old | 0 (0.0%) | 0 (0.0%) |
| 10 to 14 Year Olds | 0 (0.0%) | 0 (0.0%) |
| 15 to 17 Year Olds | 0 (0.0%) | 0 (0.0%) |
| 18 to 19 Year Olds | 0 (0.0%) | 0 (0.0%) |
| 20 to 24 Year Olds | 0 (0.0%) | 0 (0.0%) |
| 25 to 34 Year Olds | 0 (0.0%) | 0 (0.0%) |
| 35 Years and over | 0 (0.0%) | 0 (0.0%) |
| Total | 0 (0.0%) | 0 (0.0%) |
Educational Attainment by Field of Study in Cedar Point
Education (23 | 26.4%), bio, nature & agricultural (16 | 18.4%), engineering (16 | 18.4%), science & technology (12 | 13.8%), and arts & humanities (11 | 12.6%) are the most common fields of study among 87 individuals in Cedar Point who have obtained a bachelor's degree or higher.
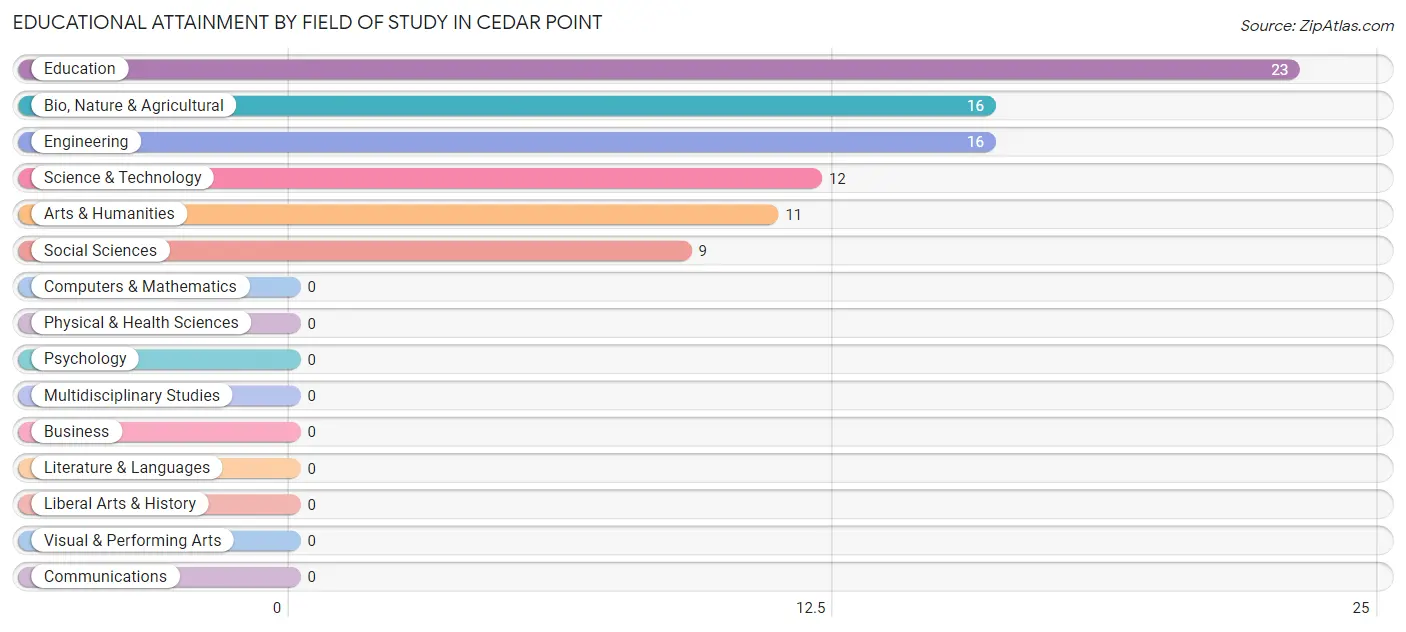
| Field of Study | # Graduates | % Graduates |
| Computers & Mathematics | 0 | 0.0% |
| Bio, Nature & Agricultural | 16 | 18.4% |
| Physical & Health Sciences | 0 | 0.0% |
| Psychology | 0 | 0.0% |
| Social Sciences | 9 | 10.3% |
| Engineering | 16 | 18.4% |
| Multidisciplinary Studies | 0 | 0.0% |
| Science & Technology | 12 | 13.8% |
| Business | 0 | 0.0% |
| Education | 23 | 26.4% |
| Literature & Languages | 0 | 0.0% |
| Liberal Arts & History | 0 | 0.0% |
| Visual & Performing Arts | 0 | 0.0% |
| Communications | 0 | 0.0% |
| Arts & Humanities | 11 | 12.6% |
| Total | 87 | 100.0% |
Transportation & Commute in Cedar Point
Vehicle Availability by Sex in Cedar Point
The most prevalent vehicle ownership categories in Cedar Point are males with 5 or more vehicles (27, accounting for 100.0%) and females with 5 or more vehicles (0, making up 96.4%).
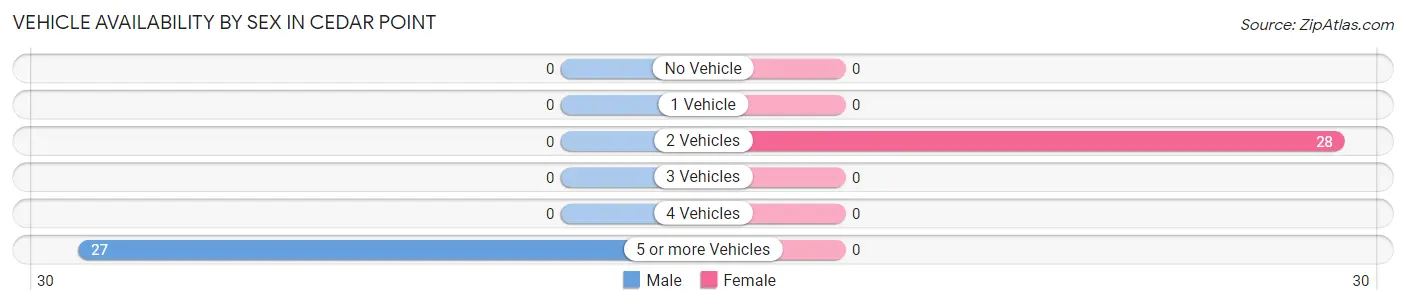
| Vehicles Available | Male | Female |
| No Vehicle | 0 (0.0%) | 0 (0.0%) |
| 1 Vehicle | 0 (0.0%) | 0 (0.0%) |
| 2 Vehicles | 0 (0.0%) | 28 (100.0%) |
| 3 Vehicles | 0 (0.0%) | 0 (0.0%) |
| 4 Vehicles | 0 (0.0%) | 0 (0.0%) |
| 5 or more Vehicles | 27 (100.0%) | 0 (0.0%) |
| Total | 27 (100.0%) | 28 (100.0%) |
Commute Time in Cedar Point
The most frequently occuring commute durations in Cedar Point are 35 to 39 minutes (28 commuters, 50.9%), 15 to 19 minutes (14 commuters, 25.5%), and 10 to 14 minutes (13 commuters, 23.6%).
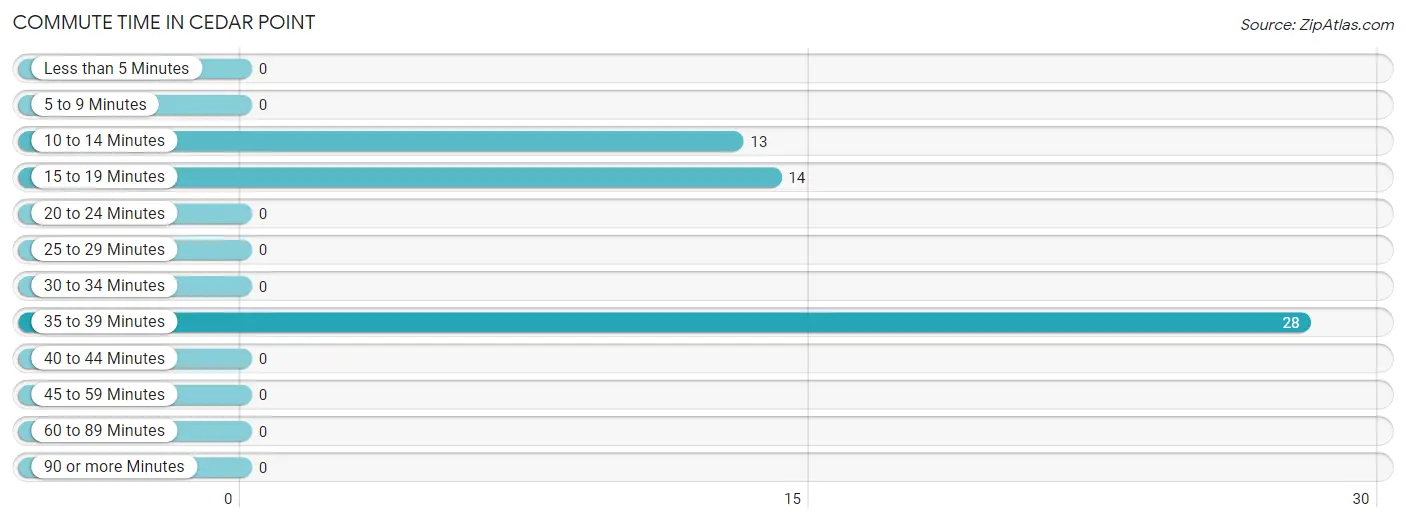
| Commute Time | # Commuters | % Commuters |
| Less than 5 Minutes | 0 | 0.0% |
| 5 to 9 Minutes | 0 | 0.0% |
| 10 to 14 Minutes | 13 | 23.6% |
| 15 to 19 Minutes | 14 | 25.5% |
| 20 to 24 Minutes | 0 | 0.0% |
| 25 to 29 Minutes | 0 | 0.0% |
| 30 to 34 Minutes | 0 | 0.0% |
| 35 to 39 Minutes | 28 | 50.9% |
| 40 to 44 Minutes | 0 | 0.0% |
| 45 to 59 Minutes | 0 | 0.0% |
| 60 to 89 Minutes | 0 | 0.0% |
| 90 or more Minutes | 0 | 0.0% |
Commute Time by Sex in Cedar Point
The most common commute times in Cedar Point are 15 to 19 minutes (14 commuters, 51.8%) for males and 35 to 39 minutes (28 commuters, 100.0%) for females.
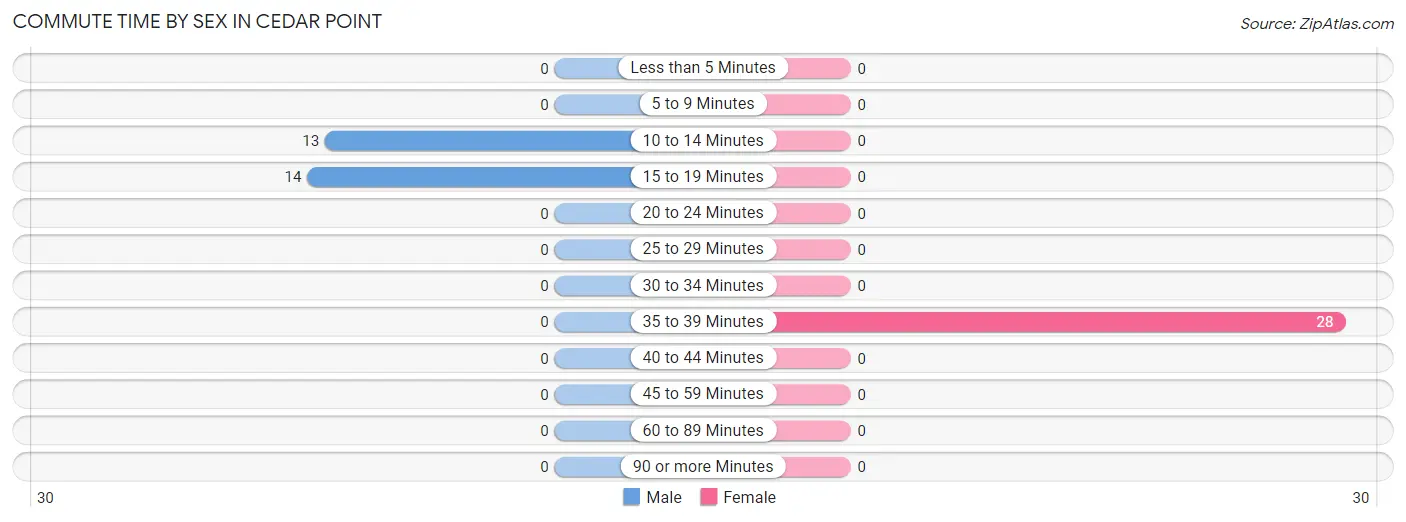
| Commute Time | Male | Female |
| Less than 5 Minutes | 0 (0.0%) | 0 (0.0%) |
| 5 to 9 Minutes | 0 (0.0%) | 0 (0.0%) |
| 10 to 14 Minutes | 13 (48.1%) | 0 (0.0%) |
| 15 to 19 Minutes | 14 (51.8%) | 0 (0.0%) |
| 20 to 24 Minutes | 0 (0.0%) | 0 (0.0%) |
| 25 to 29 Minutes | 0 (0.0%) | 0 (0.0%) |
| 30 to 34 Minutes | 0 (0.0%) | 0 (0.0%) |
| 35 to 39 Minutes | 0 (0.0%) | 28 (100.0%) |
| 40 to 44 Minutes | 0 (0.0%) | 0 (0.0%) |
| 45 to 59 Minutes | 0 (0.0%) | 0 (0.0%) |
| 60 to 89 Minutes | 0 (0.0%) | 0 (0.0%) |
| 90 or more Minutes | 0 (0.0%) | 0 (0.0%) |
Time of Departure to Work by Sex in Cedar Point
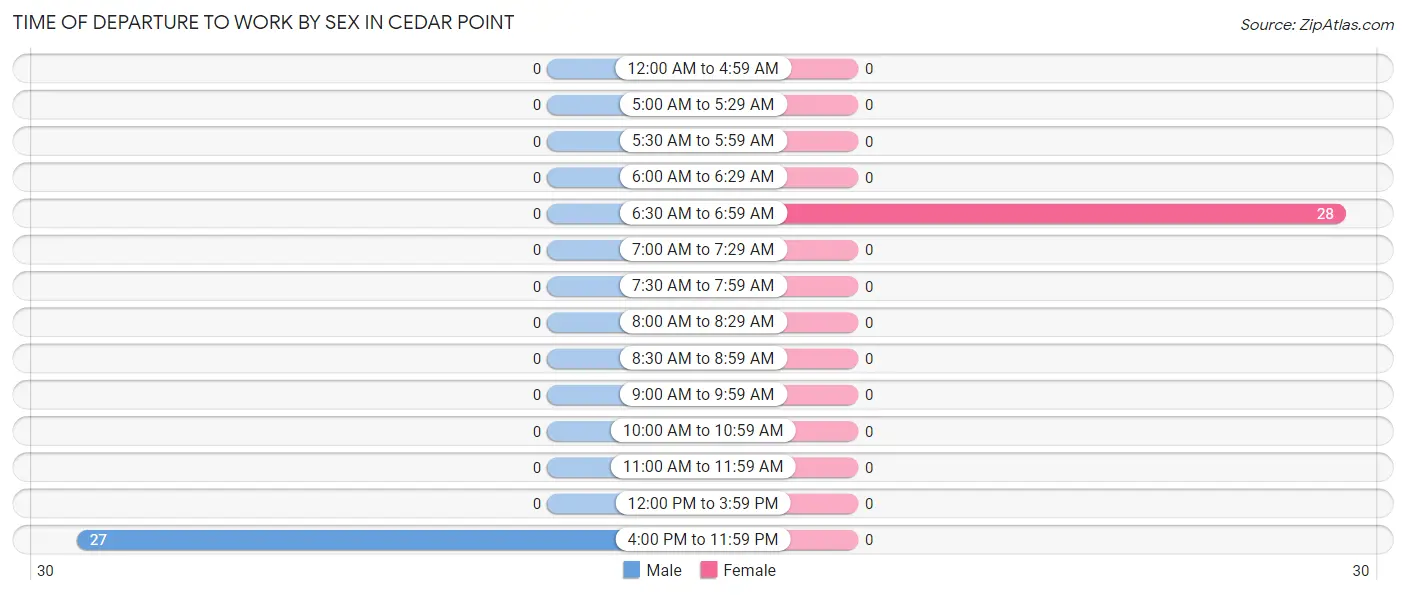
The most frequent times of departure to work in Cedar Point are 4:00 PM to 11:59 PM (27, 100.0%) for males and 6:30 AM to 6:59 AM (28, 100.0%) for females.
| Time of Departure | Male | Female |
| 12:00 AM to 4:59 AM | 0 (0.0%) | 0 (0.0%) |
| 5:00 AM to 5:29 AM | 0 (0.0%) | 0 (0.0%) |
| 5:30 AM to 5:59 AM | 0 (0.0%) | 0 (0.0%) |
| 6:00 AM to 6:29 AM | 0 (0.0%) | 0 (0.0%) |
| 6:30 AM to 6:59 AM | 0 (0.0%) | 28 (100.0%) |
| 7:00 AM to 7:29 AM | 0 (0.0%) | 0 (0.0%) |
| 7:30 AM to 7:59 AM | 0 (0.0%) | 0 (0.0%) |
| 8:00 AM to 8:29 AM | 0 (0.0%) | 0 (0.0%) |
| 8:30 AM to 8:59 AM | 0 (0.0%) | 0 (0.0%) |
| 9:00 AM to 9:59 AM | 0 (0.0%) | 0 (0.0%) |
| 10:00 AM to 10:59 AM | 0 (0.0%) | 0 (0.0%) |
| 11:00 AM to 11:59 AM | 0 (0.0%) | 0 (0.0%) |
| 12:00 PM to 3:59 PM | 0 (0.0%) | 0 (0.0%) |
| 4:00 PM to 11:59 PM | 27 (100.0%) | 0 (0.0%) |
| Total | 27 (100.0%) | 28 (100.0%) |
Housing Occupancy in Cedar Point
Occupancy by Ownership in Cedar Point
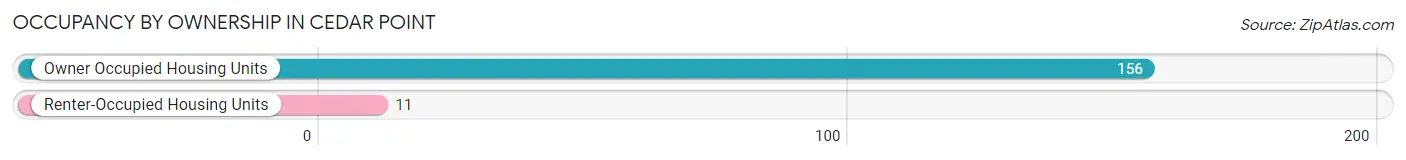
Of the total 167 dwellings in Cedar Point, owner-occupied units account for 156 (93.4%), while renter-occupied units make up 11 (6.6%).
| Occupancy | # Housing Units | % Housing Units |
| Owner Occupied Housing Units | 156 | 93.4% |
| Renter-Occupied Housing Units | 11 | 6.6% |
| Total Occupied Housing Units | 167 | 100.0% |
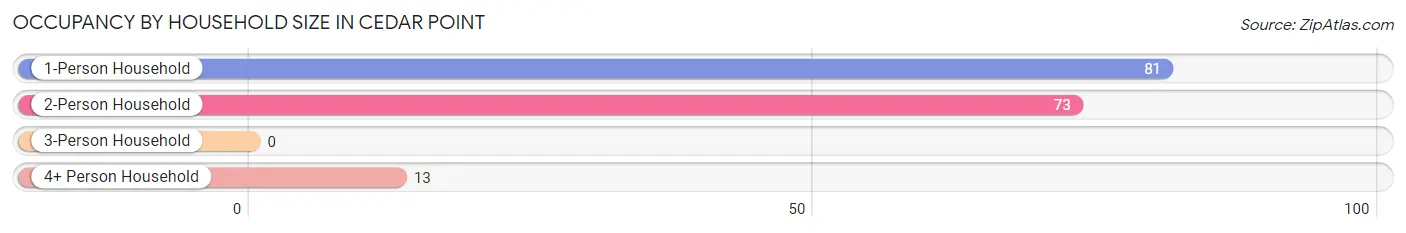
Occupancy by Household Size in Cedar Point
| Household Size | # Housing Units | % Housing Units |
| 1-Person Household | 81 | 48.5% |
| 2-Person Household | 73 | 43.7% |
| 3-Person Household | 0 | 0.0% |
| 4+ Person Household | 13 | 7.8% |
| Total Housing Units | 167 | 100.0% |
Occupancy by Ownership by Household Size in Cedar Point
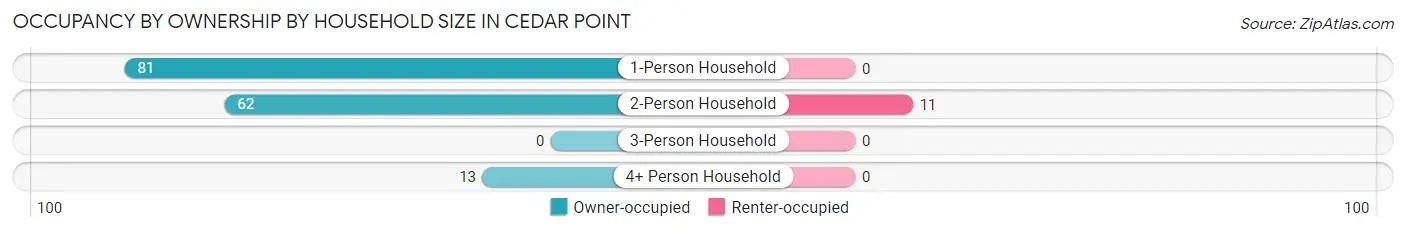
| Household Size | Owner-occupied | Renter-occupied |
| 1-Person Household | 81 (100.0%) | 0 (0.0%) |
| 2-Person Household | 62 (84.9%) | 11 (15.1%) |
| 3-Person Household | 0 (0.0%) | 0 (0.0%) |
| 4+ Person Household | 13 (100.0%) | 0 (0.0%) |
| Total Housing Units | 156 (93.4%) | 11 (6.6%) |
Occupancy by Educational Attainment in Cedar Point
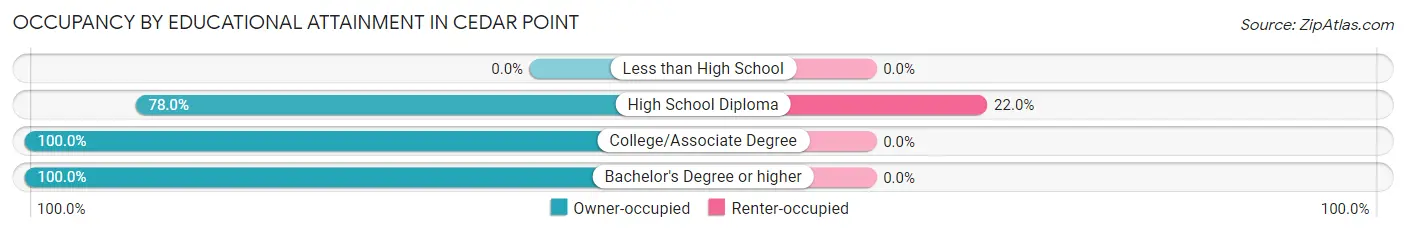
| Household Size | Owner-occupied | Renter-occupied |
| Less than High School | 0 (0.0%) | 0 (0.0%) |
| High School Diploma | 39 (78.0%) | 11 (22.0%) |
| College/Associate Degree | 83 (100.0%) | 0 (0.0%) |
| Bachelor's Degree or higher | 34 (100.0%) | 0 (0.0%) |
Occupancy by Age of Householder in Cedar Point
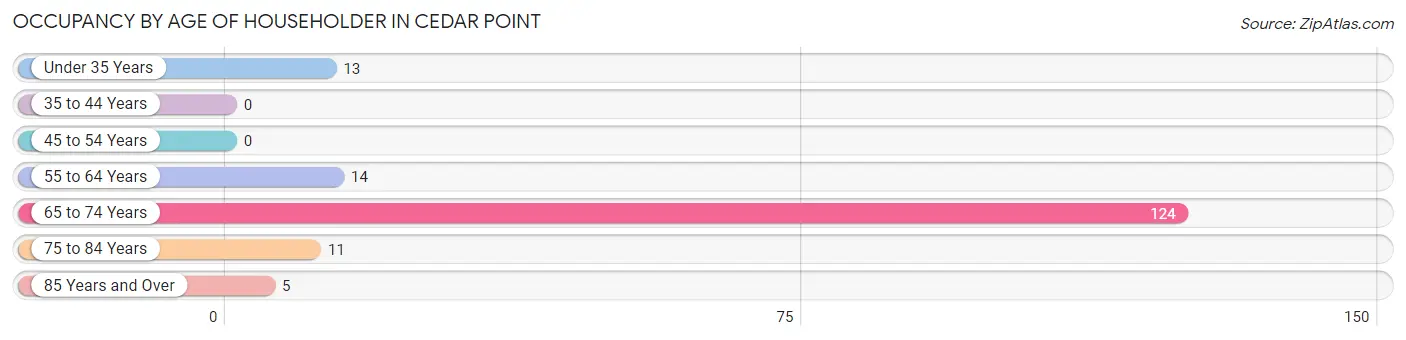
| Age Bracket | # Households | % Households |
| Under 35 Years | 13 | 7.8% |
| 35 to 44 Years | 0 | 0.0% |
| 45 to 54 Years | 0 | 0.0% |
| 55 to 64 Years | 14 | 8.4% |
| 65 to 74 Years | 124 | 74.3% |
| 75 to 84 Years | 11 | 6.6% |
| 85 Years and Over | 5 | 3.0% |
| Total | 167 | 100.0% |
Housing Finances in Cedar Point
Median Income by Occupancy in Cedar Point
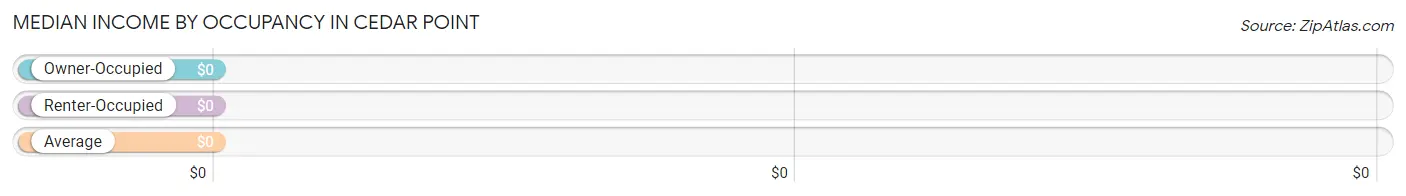
| Occupancy Type | # Households | Median Income |
| Owner-Occupied | 156 (93.4%) | $0 |
| Renter-Occupied | 11 (6.6%) | $0 |
| Average | 167 (100.0%) | $0 |
Occupancy by Householder Income Bracket in Cedar Point
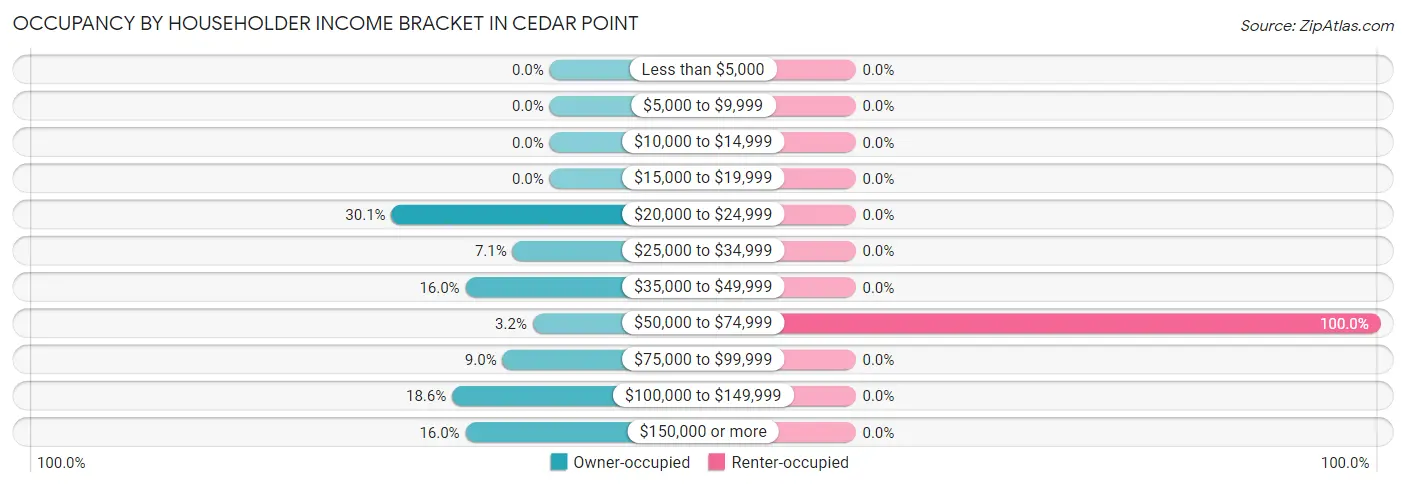
| Income Bracket | Owner-occupied | Renter-occupied |
| Less than $5,000 | 0 (0.0%) | 0 (0.0%) |
| $5,000 to $9,999 | 0 (0.0%) | 0 (0.0%) |
| $10,000 to $14,999 | 0 (0.0%) | 0 (0.0%) |
| $15,000 to $19,999 | 0 (0.0%) | 0 (0.0%) |
| $20,000 to $24,999 | 47 (30.1%) | 0 (0.0%) |
| $25,000 to $34,999 | 11 (7.0%) | 0 (0.0%) |
| $35,000 to $49,999 | 25 (16.0%) | 0 (0.0%) |
| $50,000 to $74,999 | 5 (3.2%) | 11 (100.0%) |
| $75,000 to $99,999 | 14 (9.0%) | 0 (0.0%) |
| $100,000 to $149,999 | 29 (18.6%) | 0 (0.0%) |
| $150,000 or more | 25 (16.0%) | 0 (0.0%) |
| Total | 156 (100.0%) | 11 (100.0%) |
Monthly Housing Cost Tiers in Cedar Point
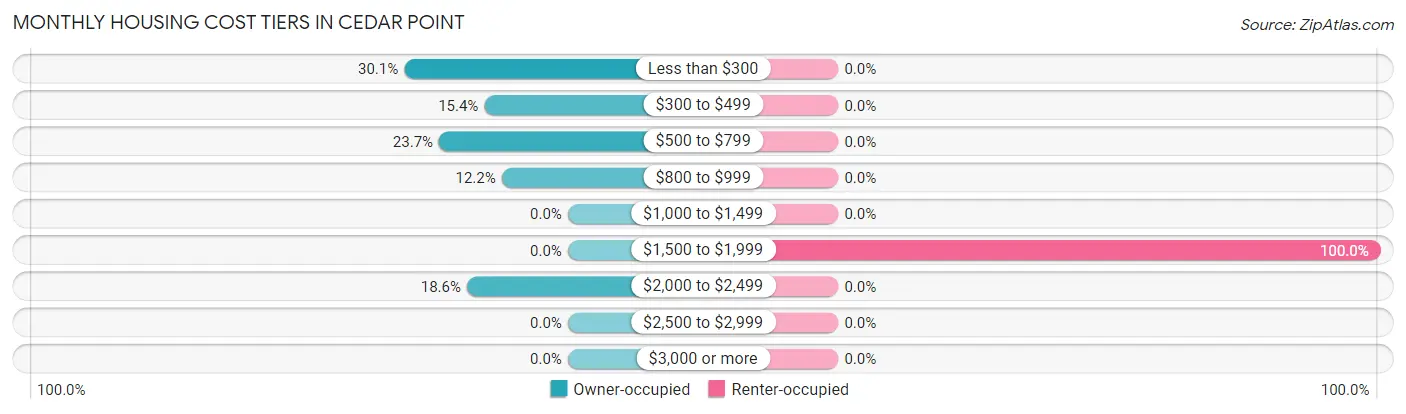
| Monthly Cost | Owner-occupied | Renter-occupied |
| Less than $300 | 47 (30.1%) | 0 (0.0%) |
| $300 to $499 | 24 (15.4%) | 0 (0.0%) |
| $500 to $799 | 37 (23.7%) | 0 (0.0%) |
| $800 to $999 | 19 (12.2%) | 0 (0.0%) |
| $1,000 to $1,499 | 0 (0.0%) | 0 (0.0%) |
| $1,500 to $1,999 | 0 (0.0%) | 11 (100.0%) |
| $2,000 to $2,499 | 29 (18.6%) | 0 (0.0%) |
| $2,500 to $2,999 | 0 (0.0%) | 0 (0.0%) |
| $3,000 or more | 0 (0.0%) | 0 (0.0%) |
| Total | 156 (100.0%) | 11 (100.0%) |
Physical Housing Characteristics in Cedar Point
Housing Structures in Cedar Point
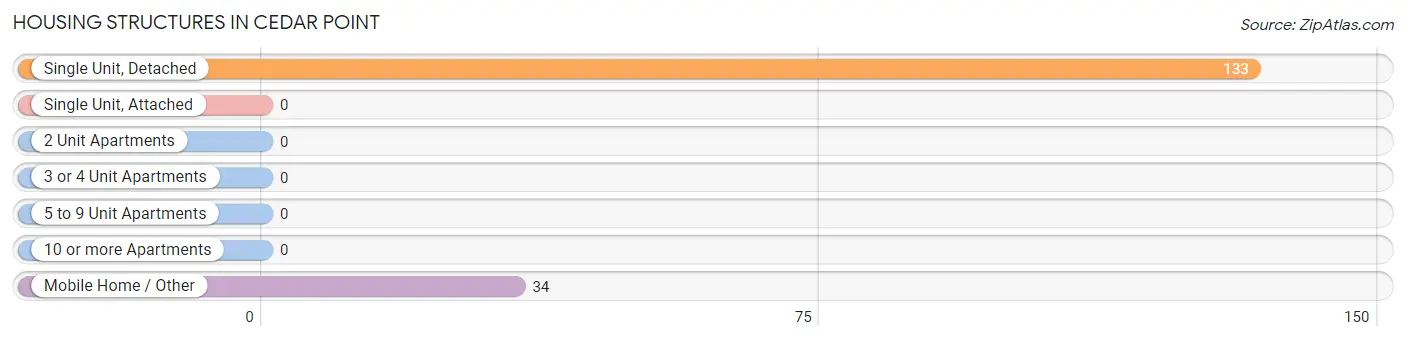
| Structure Type | # Housing Units | % Housing Units |
| Single Unit, Detached | 133 | 79.6% |
| Single Unit, Attached | 0 | 0.0% |
| 2 Unit Apartments | 0 | 0.0% |
| 3 or 4 Unit Apartments | 0 | 0.0% |
| 5 to 9 Unit Apartments | 0 | 0.0% |
| 10 or more Apartments | 0 | 0.0% |
| Mobile Home / Other | 34 | 20.4% |
| Total | 167 | 100.0% |
Housing Structures by Occupancy in Cedar Point
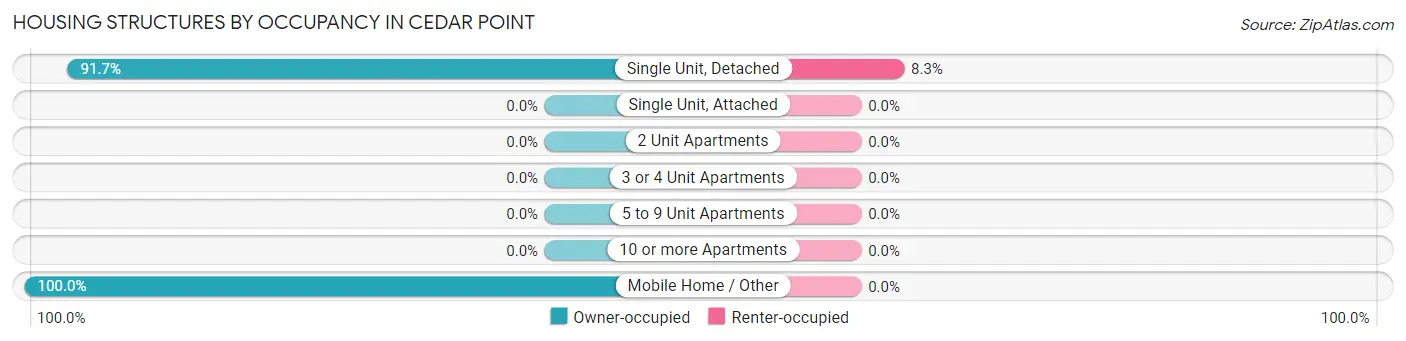
| Structure Type | Owner-occupied | Renter-occupied |
| Single Unit, Detached | 122 (91.7%) | 11 (8.3%) |
| Single Unit, Attached | 0 (0.0%) | 0 (0.0%) |
| 2 Unit Apartments | 0 (0.0%) | 0 (0.0%) |
| 3 or 4 Unit Apartments | 0 (0.0%) | 0 (0.0%) |
| 5 to 9 Unit Apartments | 0 (0.0%) | 0 (0.0%) |
| 10 or more Apartments | 0 (0.0%) | 0 (0.0%) |
| Mobile Home / Other | 34 (100.0%) | 0 (0.0%) |
| Total | 156 (93.4%) | 11 (6.6%) |
Housing Structures by Number of Rooms in Cedar Point
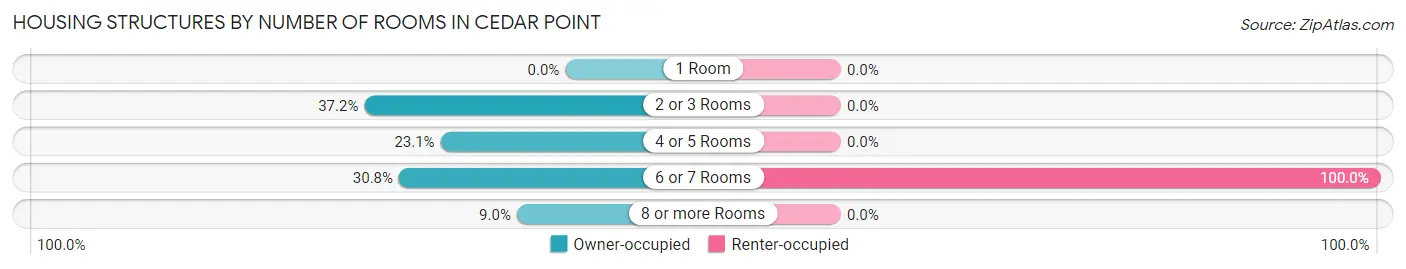
| Number of Rooms | Owner-occupied | Renter-occupied |
| 1 Room | 0 (0.0%) | 0 (0.0%) |
| 2 or 3 Rooms | 58 (37.2%) | 0 (0.0%) |
| 4 or 5 Rooms | 36 (23.1%) | 0 (0.0%) |
| 6 or 7 Rooms | 48 (30.8%) | 11 (100.0%) |
| 8 or more Rooms | 14 (9.0%) | 0 (0.0%) |
| Total | 156 (100.0%) | 11 (100.0%) |
Housing Structure by Heating Type in Cedar Point
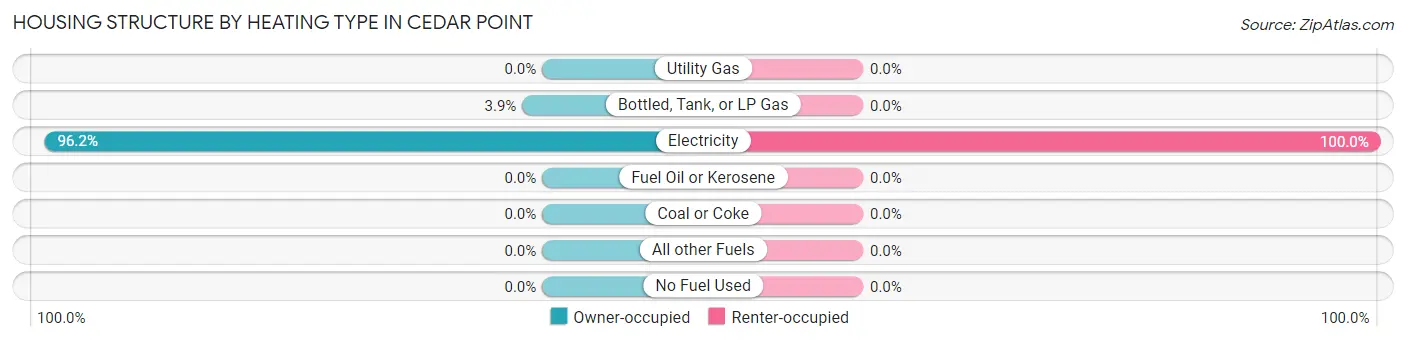
| Heating Type | Owner-occupied | Renter-occupied |
| Utility Gas | 0 (0.0%) | 0 (0.0%) |
| Bottled, Tank, or LP Gas | 6 (3.8%) | 0 (0.0%) |
| Electricity | 150 (96.2%) | 11 (100.0%) |
| Fuel Oil or Kerosene | 0 (0.0%) | 0 (0.0%) |
| Coal or Coke | 0 (0.0%) | 0 (0.0%) |
| All other Fuels | 0 (0.0%) | 0 (0.0%) |
| No Fuel Used | 0 (0.0%) | 0 (0.0%) |
| Total | 156 (100.0%) | 11 (100.0%) |
Household Vehicle Usage in Cedar Point
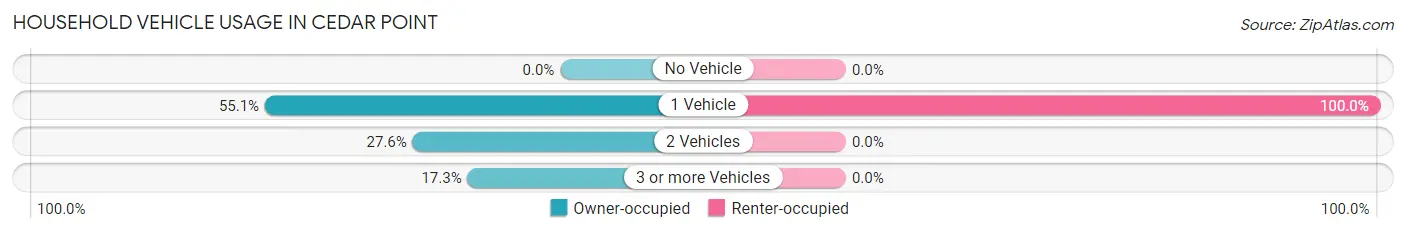
| Vehicles per Household | Owner-occupied | Renter-occupied |
| No Vehicle | 0 (0.0%) | 0 (0.0%) |
| 1 Vehicle | 86 (55.1%) | 11 (100.0%) |
| 2 Vehicles | 43 (27.6%) | 0 (0.0%) |
| 3 or more Vehicles | 27 (17.3%) | 0 (0.0%) |
| Total | 156 (100.0%) | 11 (100.0%) |
Real Estate & Mortgages in Cedar Point
Real Estate and Mortgage Overview in Cedar Point
| Characteristic | Without Mortgage | With Mortgage |
| Housing Units | 122 | 34 |
| Median Property Value | $136,700 | $0 |
| Median Household Income | - | - |
| Monthly Housing Costs | $458 | $0 |
| Real Estate Taxes | $1,285 | $0 |
Property Value by Mortgage Status in Cedar Point
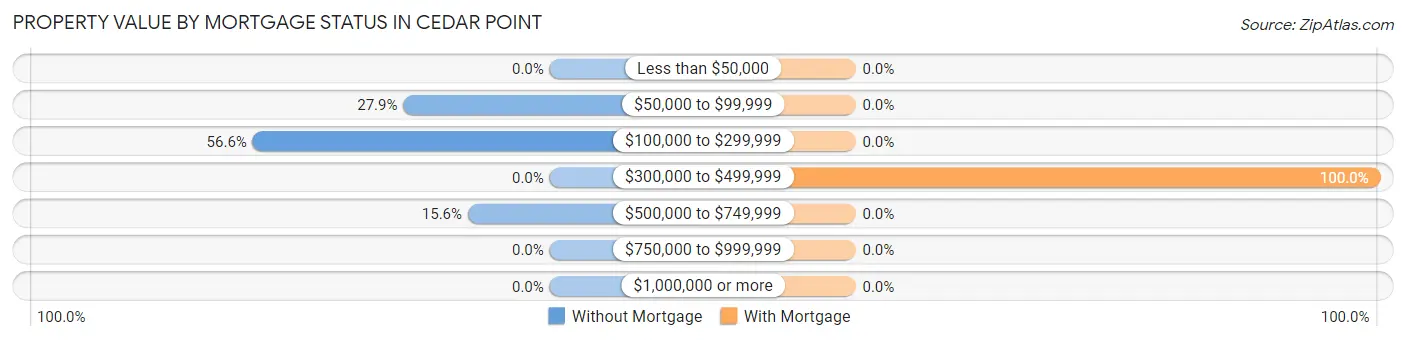
| Property Value | Without Mortgage | With Mortgage |
| Less than $50,000 | 0 (0.0%) | 0 (0.0%) |
| $50,000 to $99,999 | 34 (27.9%) | 0 (0.0%) |
| $100,000 to $299,999 | 69 (56.6%) | 0 (0.0%) |
| $300,000 to $499,999 | 0 (0.0%) | 34 (100.0%) |
| $500,000 to $749,999 | 19 (15.6%) | 0 (0.0%) |
| $750,000 to $999,999 | 0 (0.0%) | 0 (0.0%) |
| $1,000,000 or more | 0 (0.0%) | 0 (0.0%) |
| Total | 122 (100.0%) | 34 (100.0%) |
Household Income by Mortgage Status in Cedar Point
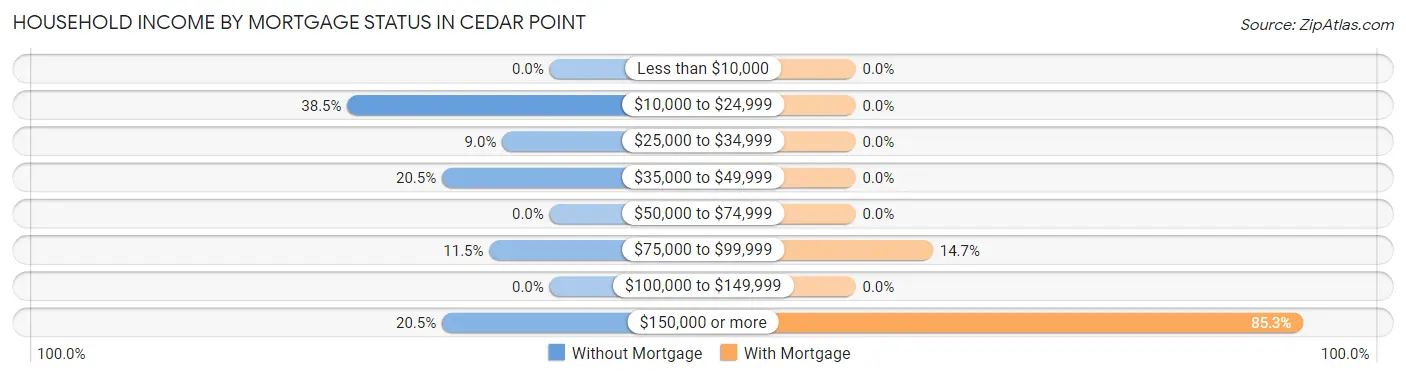
| Household Income | Without Mortgage | With Mortgage |
| Less than $10,000 | 0 (0.0%) | 0 (0.0%) |
| $10,000 to $24,999 | 47 (38.5%) | 0 (0.0%) |
| $25,000 to $34,999 | 11 (9.0%) | 0 (0.0%) |
| $35,000 to $49,999 | 25 (20.5%) | 0 (0.0%) |
| $50,000 to $74,999 | 0 (0.0%) | 0 (0.0%) |
| $75,000 to $99,999 | 14 (11.5%) | 5 (14.7%) |
| $100,000 to $149,999 | 0 (0.0%) | 0 (0.0%) |
| $150,000 or more | 25 (20.5%) | 29 (85.3%) |
| Total | 122 (100.0%) | 34 (100.0%) |
Property Value to Household Income Ratio in Cedar Point
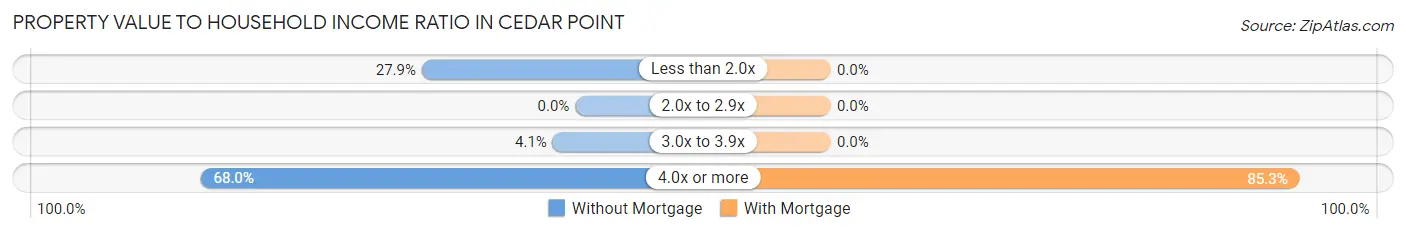
| Value-to-Income Ratio | Without Mortgage | With Mortgage |
| Less than 2.0x | 34 (27.9%) | 0 (0.0%) |
| 2.0x to 2.9x | 0 (0.0%) | 0 (0.0%) |
| 3.0x to 3.9x | 5 (4.1%) | 0 (0.0%) |
| 4.0x or more | 83 (68.0%) | 29 (85.3%) |
| Total | 122 (100.0%) | 34 (100.0%) |
Real Estate Taxes by Mortgage Status in Cedar Point
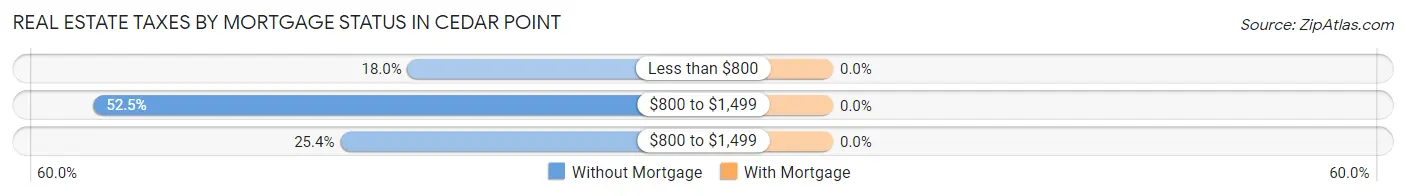
| Property Taxes | Without Mortgage | With Mortgage |
| Less than $800 | 22 (18.0%) | 0 (0.0%) |
| $800 to $1,499 | 64 (52.5%) | 0 (0.0%) |
| $800 to $1,499 | 31 (25.4%) | 0 (0.0%) |
| Total | 122 (100.0%) | 34 (100.0%) |
Health & Disability in Cedar Point
Health Insurance Coverage by Age in Cedar Point
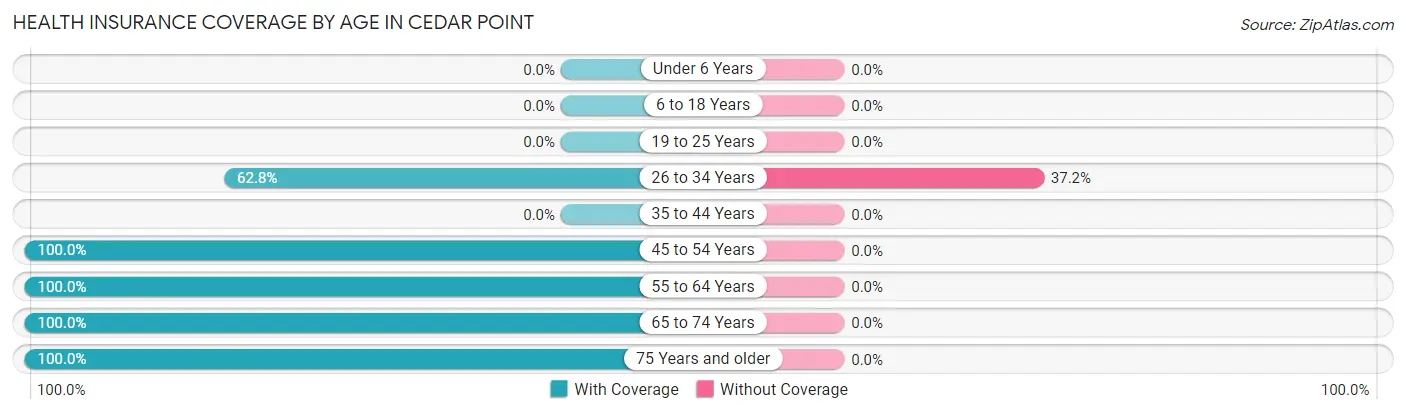
| Age Bracket | With Coverage | Without Coverage |
| Under 6 Years | 0 (0.0%) | 0 (0.0%) |
| 6 to 18 Years | 0 (0.0%) | 0 (0.0%) |
| 19 to 25 Years | 0 (0.0%) | 0 (0.0%) |
| 26 to 34 Years | 27 (62.8%) | 16 (37.2%) |
| 35 to 44 Years | 0 (0.0%) | 0 (0.0%) |
| 45 to 54 Years | 13 (100.0%) | 0 (0.0%) |
| 55 to 64 Years | 70 (100.0%) | 0 (0.0%) |
| 65 to 74 Years | 154 (100.0%) | 0 (0.0%) |
| 75 Years and older | 21 (100.0%) | 0 (0.0%) |
| Total | 285 (94.7%) | 16 (5.3%) |
Health Insurance Coverage by Citizenship Status in Cedar Point
| Citizenship Status | With Coverage | Without Coverage |
| Native Born | 0 (0.0%) | 0 (0.0%) |
| Foreign Born, Citizen | 0 (0.0%) | 0 (0.0%) |
| Foreign Born, not a Citizen | 0 (0.0%) | 0 (0.0%) |
Health Insurance Coverage by Household Income in Cedar Point
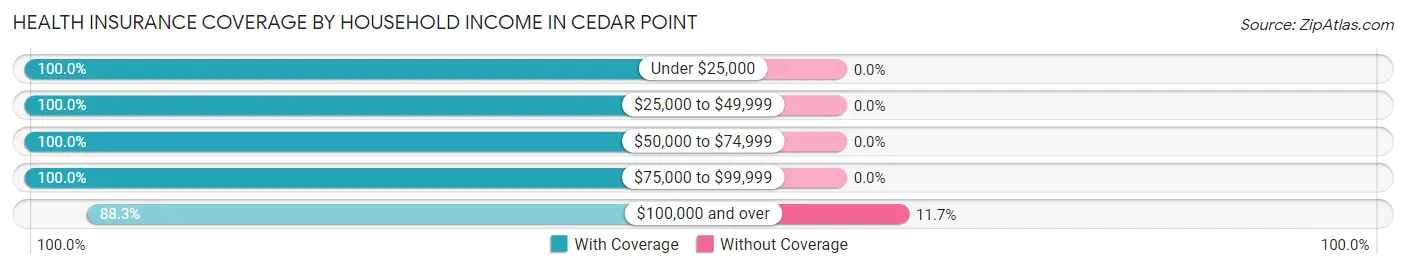
| Household Income | With Coverage | Without Coverage |
| Under $25,000 | 47 (100.0%) | 0 (0.0%) |
| $25,000 to $49,999 | 50 (100.0%) | 0 (0.0%) |
| $50,000 to $74,999 | 37 (100.0%) | 0 (0.0%) |
| $75,000 to $99,999 | 30 (100.0%) | 0 (0.0%) |
| $100,000 and over | 121 (88.3%) | 16 (11.7%) |
Public vs Private Health Insurance Coverage by Age in Cedar Point
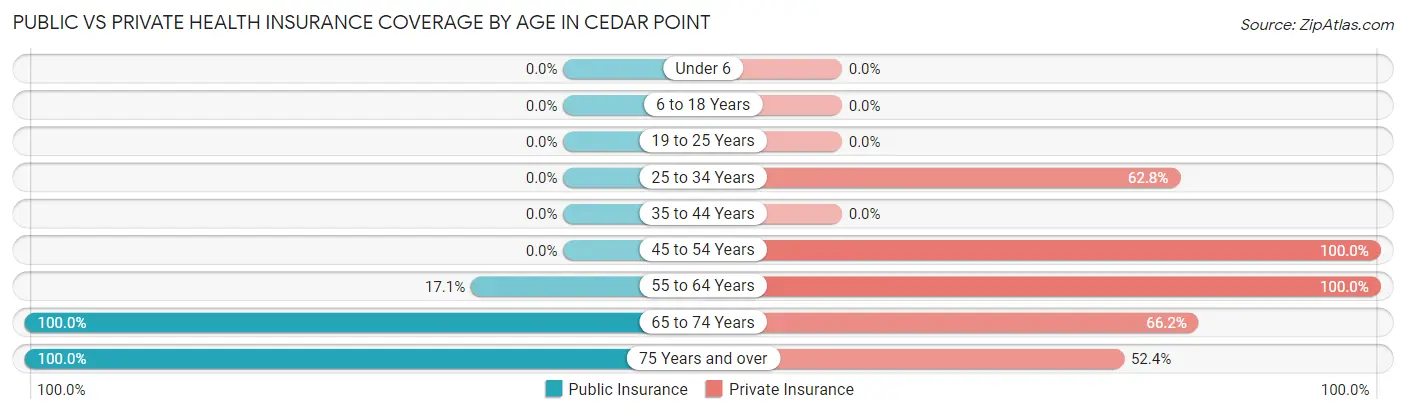
| Age Bracket | Public Insurance | Private Insurance |
| Under 6 | 0 (0.0%) | 0 (0.0%) |
| 6 to 18 Years | 0 (0.0%) | 0 (0.0%) |
| 19 to 25 Years | 0 (0.0%) | 0 (0.0%) |
| 25 to 34 Years | 0 (0.0%) | 27 (62.8%) |
| 35 to 44 Years | 0 (0.0%) | 0 (0.0%) |
| 45 to 54 Years | 0 (0.0%) | 13 (100.0%) |
| 55 to 64 Years | 12 (17.1%) | 70 (100.0%) |
| 65 to 74 Years | 154 (100.0%) | 102 (66.2%) |
| 75 Years and over | 21 (100.0%) | 11 (52.4%) |
| Total | 187 (62.1%) | 223 (74.1%) |
Disability Status by Sex by Age in Cedar Point
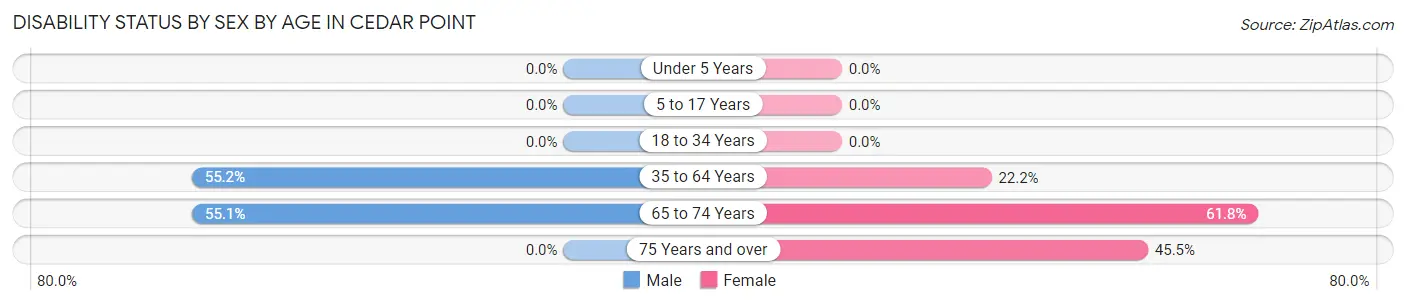
| Age Bracket | Male | Female |
| Under 5 Years | 0 (0.0%) | 0 (0.0%) |
| 5 to 17 Years | 0 (0.0%) | 0 (0.0%) |
| 18 to 34 Years | 0 (0.0%) | 0 (0.0%) |
| 35 to 64 Years | 16 (55.2%) | 12 (22.2%) |
| 65 to 74 Years | 43 (55.1%) | 47 (61.8%) |
| 75 Years and over | 0 (0.0%) | 5 (45.5%) |
Disability Class by Sex by Age in Cedar Point
Disability Class: Hearing Difficulty
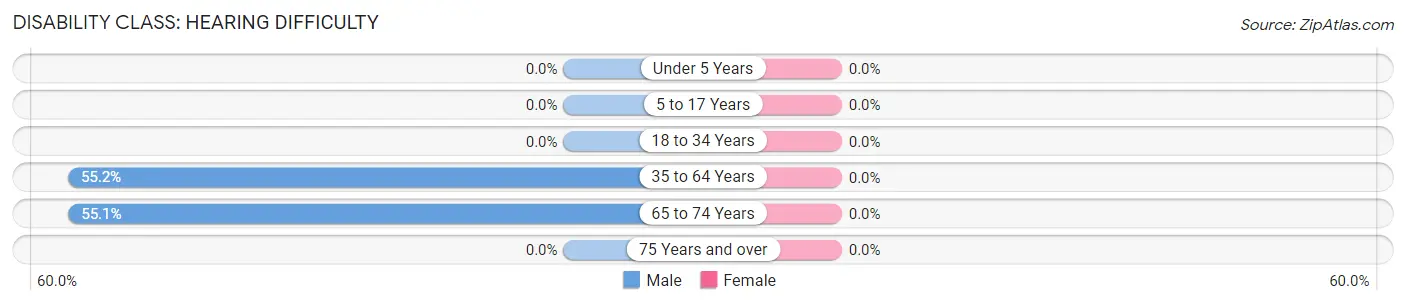
| Age Bracket | Male | Female |
| Under 5 Years | 0 (0.0%) | 0 (0.0%) |
| 5 to 17 Years | 0 (0.0%) | 0 (0.0%) |
| 18 to 34 Years | 0 (0.0%) | 0 (0.0%) |
| 35 to 64 Years | 16 (55.2%) | 0 (0.0%) |
| 65 to 74 Years | 43 (55.1%) | 0 (0.0%) |
| 75 Years and over | 0 (0.0%) | 0 (0.0%) |
Disability Class: Vision Difficulty
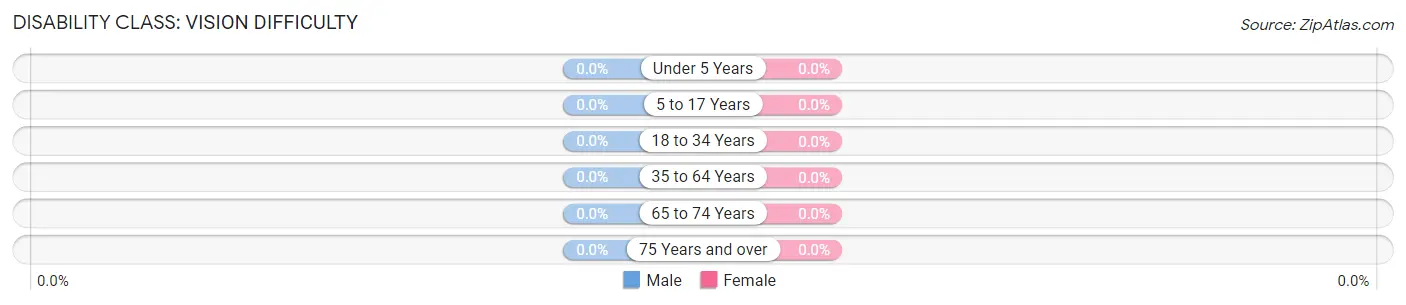
| Age Bracket | Male | Female |
| Under 5 Years | 0 (0.0%) | 0 (0.0%) |
| 5 to 17 Years | 0 (0.0%) | 0 (0.0%) |
| 18 to 34 Years | 0 (0.0%) | 0 (0.0%) |
| 35 to 64 Years | 0 (0.0%) | 0 (0.0%) |
| 65 to 74 Years | 0 (0.0%) | 0 (0.0%) |
| 75 Years and over | 0 (0.0%) | 0 (0.0%) |
Disability Class: Cognitive Difficulty
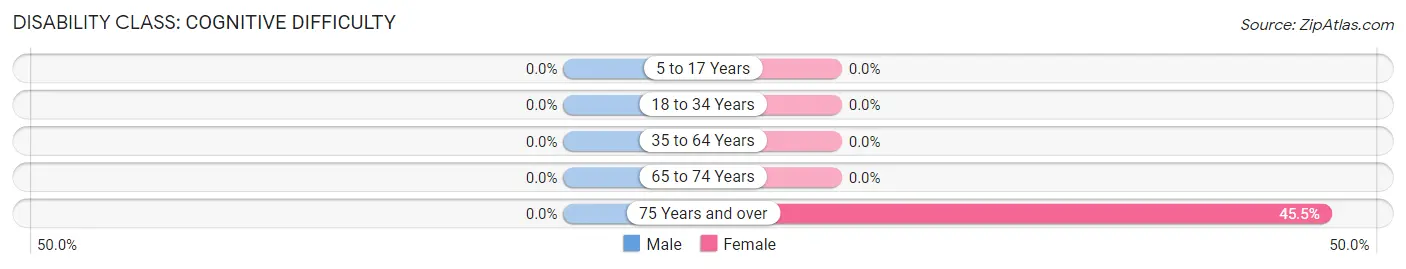
| Age Bracket | Male | Female |
| 5 to 17 Years | 0 (0.0%) | 0 (0.0%) |
| 18 to 34 Years | 0 (0.0%) | 0 (0.0%) |
| 35 to 64 Years | 0 (0.0%) | 0 (0.0%) |
| 65 to 74 Years | 0 (0.0%) | 0 (0.0%) |
| 75 Years and over | 0 (0.0%) | 5 (45.5%) |
Disability Class: Ambulatory Difficulty
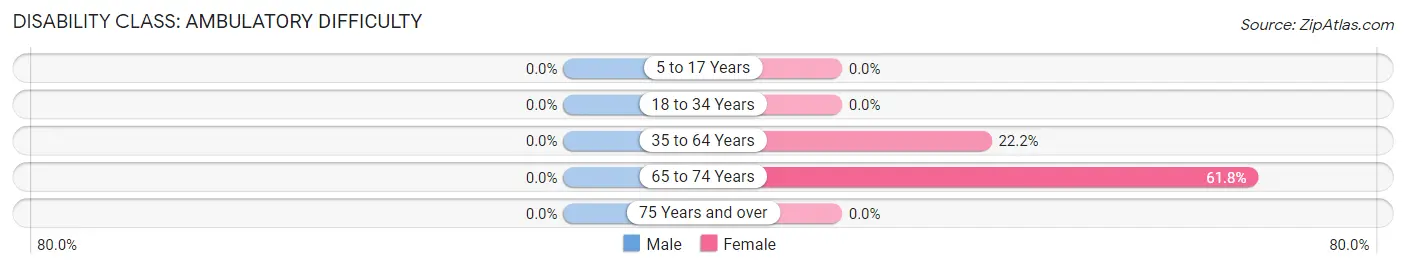
| Age Bracket | Male | Female |
| 5 to 17 Years | 0 (0.0%) | 0 (0.0%) |
| 18 to 34 Years | 0 (0.0%) | 0 (0.0%) |
| 35 to 64 Years | 0 (0.0%) | 12 (22.2%) |
| 65 to 74 Years | 0 (0.0%) | 47 (61.8%) |
| 75 Years and over | 0 (0.0%) | 0 (0.0%) |
Disability Class: Self-Care Difficulty
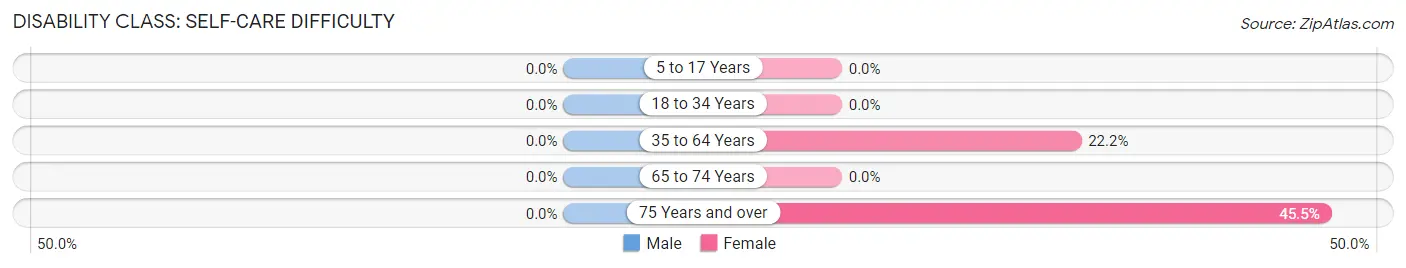
| Age Bracket | Male | Female |
| 5 to 17 Years | 0 (0.0%) | 0 (0.0%) |
| 18 to 34 Years | 0 (0.0%) | 0 (0.0%) |
| 35 to 64 Years | 0 (0.0%) | 12 (22.2%) |
| 65 to 74 Years | 0 (0.0%) | 0 (0.0%) |
| 75 Years and over | 0 (0.0%) | 5 (45.5%) |
Technology Access in Cedar Point
Computing Device Access in Cedar Point
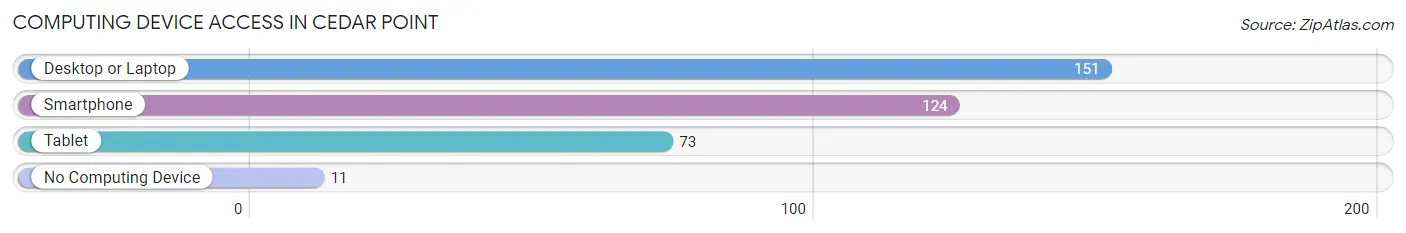
| Device Type | # Households | % Households |
| Desktop or Laptop | 151 | 90.4% |
| Smartphone | 124 | 74.3% |
| Tablet | 73 | 43.7% |
| No Computing Device | 11 | 6.6% |
| Total | 167 | 100.0% |
Internet Access in Cedar Point
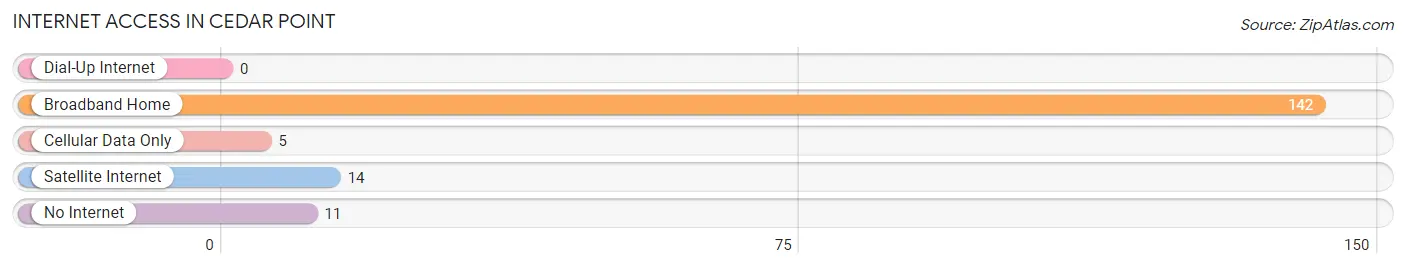
| Internet Type | # Households | % Households |
| Dial-Up Internet | 0 | 0.0% |
| Broadband Home | 142 | 85.0% |
| Cellular Data Only | 5 | 3.0% |
| Satellite Internet | 14 | 8.4% |
| No Internet | 11 | 6.6% |
| Total | 167 | 100.0% |
Cedar Point Summary
Cedar Point, Texas is a small unincorporated community located in the southeastern corner of Hardin County, Texas. It is situated on the banks of the Neches River, approximately 25 miles east of Beaumont and 25 miles west of Jasper. The population of Cedar Point was estimated to be around 200 people in 2020.
History
The area that is now Cedar Point was first settled in the early 1800s by a group of settlers from the United States. The settlers were attracted to the area due to its abundance of timber and the Neches River, which provided a convenient means of transportation. The settlement was originally known as “Cedar Point” due to the abundance of cedar trees in the area.
In 1836, the Republic of Texas was established and Cedar Point was officially recognized as a town. The town was incorporated in 1837 and the first post office was established in 1838. The town was named after the cedar trees that grew in the area.
In the late 1800s, Cedar Point became a popular destination for tourists due to its proximity to the Neches River and its abundance of natural beauty. The town was also known for its fishing and hunting opportunities.
In the early 1900s, Cedar Point began to experience a decline in population due to the introduction of the railroad. The railroad bypassed Cedar Point, causing many of the businesses in the town to close. The population of Cedar Point continued to decline until the 1950s when the town began to experience a resurgence in population due to the oil and gas industry.
Geography
Cedar Point is located in the southeastern corner of Hardin County, Texas. It is situated on the banks of the Neches River, approximately 25 miles east of Beaumont and 25 miles west of Jasper. The town is surrounded by dense forests and is home to a variety of wildlife, including deer, wild hogs, and various species of birds.
The climate in Cedar Point is humid subtropical, with hot summers and mild winters. The average temperature in the summer is around 90 degrees Fahrenheit and the average temperature in the winter is around 50 degrees Fahrenheit.
Economy
The economy of Cedar Point is largely based on the oil and gas industry. The town is home to several oil and gas companies, including Chevron, ExxonMobil, and Shell. The town is also home to several small businesses, including restaurants, convenience stores, and a few retail stores.
The town is also home to a few tourist attractions, including the Neches River National Wildlife Refuge and the Big Thicket National Preserve. These attractions draw visitors from all over the country and provide a boost to the local economy.
Demographics
The population of Cedar Point was estimated to be around 200 people in 2020. The majority of the population is white (90%), followed by African American (7%), Hispanic (2%), and other (1%). The median household income in Cedar Point is $45,000 and the median home value is $90,000. The town has a low unemployment rate of 3.5%.
Conclusion
Cedar Point, Texas is a small unincorporated community located in the southeastern corner of Hardin County, Texas. It is situated on the banks of the Neches River, approximately 25 miles east of Beaumont and 25 miles west of Jasper. The population of Cedar Point was estimated to be around 200 people in 2020. The economy of Cedar Point is largely based on the oil and gas industry and the town is home to several tourist attractions, including the Neches River National Wildlife Refuge and the Big Thicket National Preserve. The majority of the population is white (90%), followed by African American (7%), Hispanic (2%), and other (1%). The median household income in Cedar Point is $45,000 and the median home value is $90,000.
Common Questions
What is the Total Population of Cedar Point?
Total Population of Cedar Point is 301.
What is the Total Male Population of Cedar Point?
Total Male Population of Cedar Point is 147.
What is the Total Female Population of Cedar Point?
Total Female Population of Cedar Point is 154.
What is the Ratio of Males per 100 Females in Cedar Point?
There are 95.45 Males per 100 Females in Cedar Point.
What is the Ratio of Females per 100 Males in Cedar Point?
There are 104.76 Females per 100 Males in Cedar Point.
What is the Median Population Age in Cedar Point?
Median Population Age in Cedar Point is 65.8 Years.
What is the Average Family Size in Cedar Point
Average Family Size in Cedar Point is 3.0 People.
What is the Average Household Size in Cedar Point
Average Household Size in Cedar Point is 1.8 People.
What is Per Capita Income in Cedar Point?
Per Capita income in Cedar Point is $44,522.
What is the Median Family Income in Cedar Point?
Median Family Income in Cedar Point is $95,536.
What is Inequality or Gini Index in Cedar Point?
Inequality or Gini Index in Cedar Point is 0.41.
How Large is the Labor Force in Cedar Point?
There are 55 People in the Labor Forcein in Cedar Point.
What is the Percentage of People in the Labor Force in Cedar Point?
18.3% of People are in the Labor Force in Cedar Point.