Thunderbird Bay, TX
Thunderbird Bay Map
Thunderbird Bay Overview
766
TOTAL POPULATION
378
MALE POPULATION
388
FEMALE POPULATION
97.42
MALES / 100 FEMALES
102.65
FEMALES / 100 MALES
49.4
MEDIAN AGE
2.5
AVG FAMILY SIZE
1.7
AVG HOUSEHOLD SIZE
$31,863
PER CAPITA INCOME
$52,417
AVG FAMILY INCOME
$43,750
AVG HOUSEHOLD INCOME
53.4%
WAGE / INCOME GAP [ % ]
46.6¢/ $1
WAGE / INCOME GAP [ $ ]
0.43
INEQUALITY / GINI INDEX
343
LABOR FORCE [ PEOPLE ]
51.9%
PERCENT IN LABOR FORCE
14.6%
UNEMPLOYMENT RATE
Race in Thunderbird Bay
The most populous races in Thunderbird Bay are White / Caucasian (712 | 92.9%), Two or more Races (54 | 7.0%), and Hispanic or Latino (52 | 6.8%).
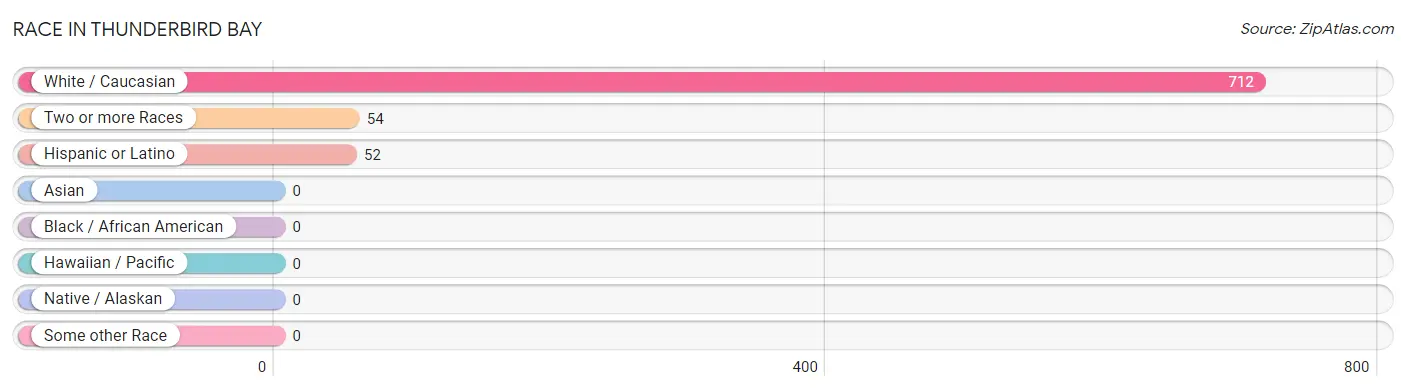
| Race | # Population | % Population |
| Asian | 0 | 0.0% |
| Black / African American | 0 | 0.0% |
| Hawaiian / Pacific | 0 | 0.0% |
| Hispanic or Latino | 52 | 6.8% |
| Native / Alaskan | 0 | 0.0% |
| White / Caucasian | 712 | 92.9% |
| Two or more Races | 54 | 7.0% |
| Some other Race | 0 | 0.0% |
| Total | 766 | 100.0% |
Ancestry in Thunderbird Bay
The most populous ancestries reported in Thunderbird Bay are German (241 | 31.5%), Irish (170 | 22.2%), English (141 | 18.4%), Scottish (77 | 10.1%), and Scotch-Irish (59 | 7.7%), together accounting for 89.8% of all Thunderbird Bay residents.
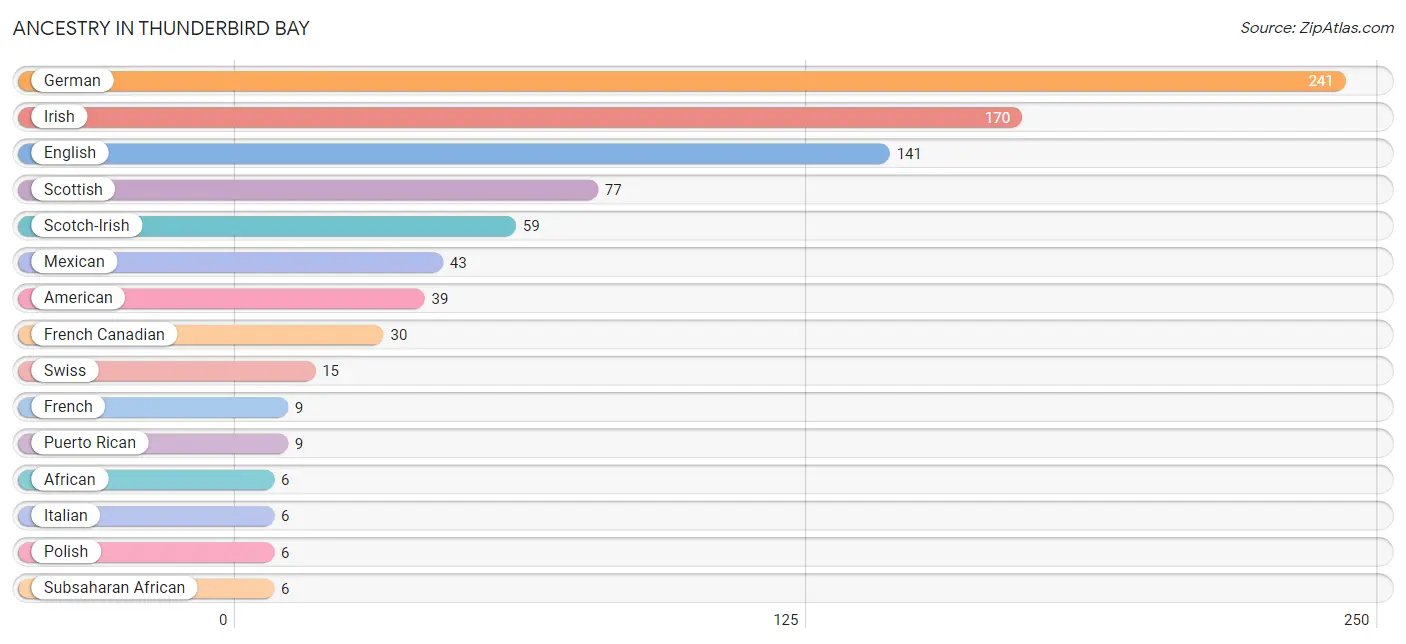
| Ancestry | # Population | % Population |
| African | 6 | 0.8% |
| American | 39 | 5.1% |
| Dutch | 5 | 0.6% |
| English | 141 | 18.4% |
| French | 9 | 1.2% |
| French Canadian | 30 | 3.9% |
| German | 241 | 31.5% |
| Irish | 170 | 22.2% |
| Italian | 6 | 0.8% |
| Mexican | 43 | 5.6% |
| Polish | 6 | 0.8% |
| Puerto Rican | 9 | 1.2% |
| Scotch-Irish | 59 | 7.7% |
| Scottish | 77 | 10.1% |
| Subsaharan African | 6 | 0.8% |
| Swiss | 15 | 2.0% | View All 16 Rows |
Immigrants in Thunderbird Bay
The most numerous immigrant groups reported in Thunderbird Bay came from Australia (11 | 1.4%), and Oceania (11 | 1.4%), together accounting for 2.9% of all Thunderbird Bay residents.
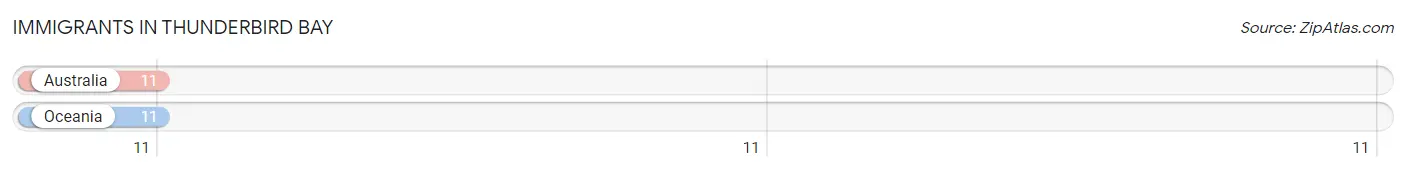
| Immigration Origin | # Population | % Population |
| Australia | 11 | 1.4% |
| Oceania | 11 | 1.4% | View All 2 Rows |
Sex and Age in Thunderbird Bay
Sex and Age in Thunderbird Bay
The most populous age groups in Thunderbird Bay are 70 to 74 Years (57 | 15.1%) for men and 30 to 34 Years (56 | 14.4%) for women.
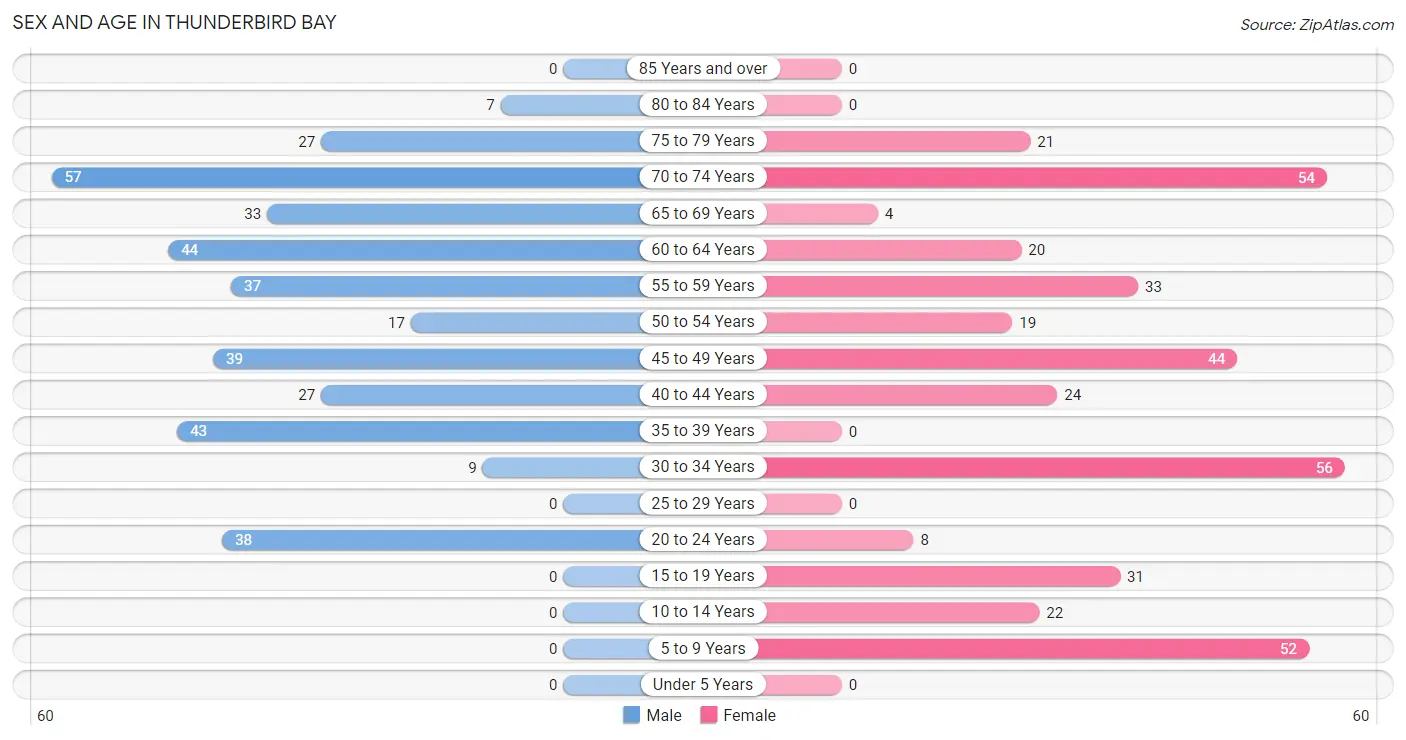
| Age Bracket | Male | Female |
| Under 5 Years | 0 (0.0%) | 0 (0.0%) |
| 5 to 9 Years | 0 (0.0%) | 52 (13.4%) |
| 10 to 14 Years | 0 (0.0%) | 22 (5.7%) |
| 15 to 19 Years | 0 (0.0%) | 31 (8.0%) |
| 20 to 24 Years | 38 (10.1%) | 8 (2.1%) |
| 25 to 29 Years | 0 (0.0%) | 0 (0.0%) |
| 30 to 34 Years | 9 (2.4%) | 56 (14.4%) |
| 35 to 39 Years | 43 (11.4%) | 0 (0.0%) |
| 40 to 44 Years | 27 (7.1%) | 24 (6.2%) |
| 45 to 49 Years | 39 (10.3%) | 44 (11.3%) |
| 50 to 54 Years | 17 (4.5%) | 19 (4.9%) |
| 55 to 59 Years | 37 (9.8%) | 33 (8.5%) |
| 60 to 64 Years | 44 (11.6%) | 20 (5.1%) |
| 65 to 69 Years | 33 (8.7%) | 4 (1.0%) |
| 70 to 74 Years | 57 (15.1%) | 54 (13.9%) |
| 75 to 79 Years | 27 (7.1%) | 21 (5.4%) |
| 80 to 84 Years | 7 (1.8%) | 0 (0.0%) |
| 85 Years and over | 0 (0.0%) | 0 (0.0%) |
| Total | 378 (100.0%) | 388 (100.0%) |
Families and Households in Thunderbird Bay
Median Family Size in Thunderbird Bay
The median family size in Thunderbird Bay is 2.52 persons per family, with single female/mother families (9 | 4.3%) accounting for the largest median family size of 2.56 persons per family. On the other hand, single male/father families (16 | 7.7%) represent the smallest median family size with 2.19 persons per family.
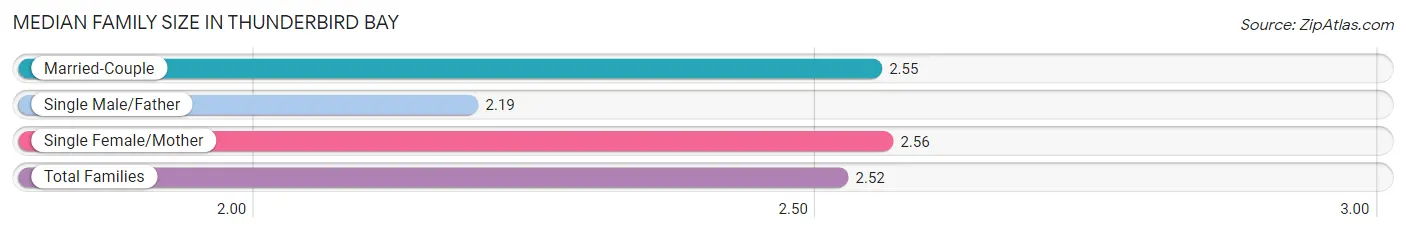
| Family Type | # Families | Family Size |
| Married-Couple | 182 (87.9%) | 2.55 |
| Single Male/Father | 16 (7.7%) | 2.19 |
| Single Female/Mother | 9 (4.3%) | 2.56 |
| Total Families | 207 (100.0%) | 2.52 |
Median Household Size in Thunderbird Bay
The median household size in Thunderbird Bay is 1.73 persons per household, with single female/mother households (9 | 2.0%) accounting for the largest median household size of 2.56 persons per household. non-family households (235 | 53.2%) represent the smallest median household size with 1.04 persons per household.
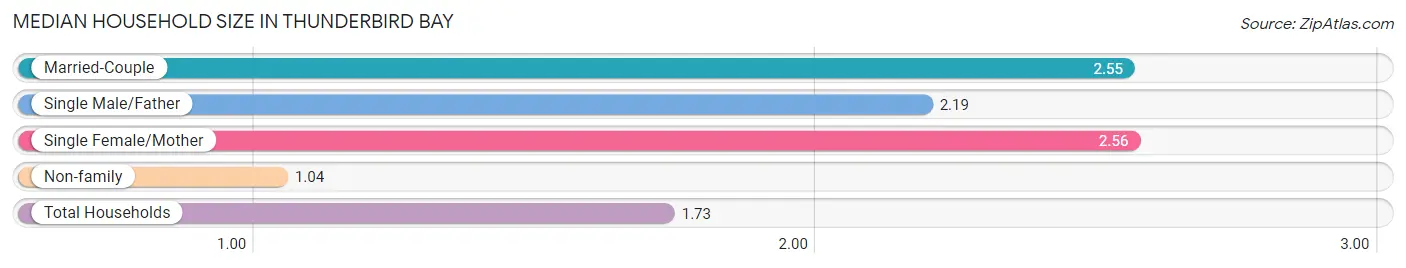
| Household Type | # Households | Household Size |
| Married-Couple | 182 (41.2%) | 2.55 |
| Single Male/Father | 16 (3.6%) | 2.19 |
| Single Female/Mother | 9 (2.0%) | 2.56 |
| Non-family | 235 (53.2%) | 1.04 |
| Total Households | 442 (100.0%) | 1.73 |
Household Size by Marriage Status in Thunderbird Bay
Out of a total of 442 households in Thunderbird Bay, 207 (46.8%) are family households, while 235 (53.2%) are nonfamily households. The most numerous type of family households are 2-person households, comprising 136, and the most common type of nonfamily households are 1-person households, comprising 226.
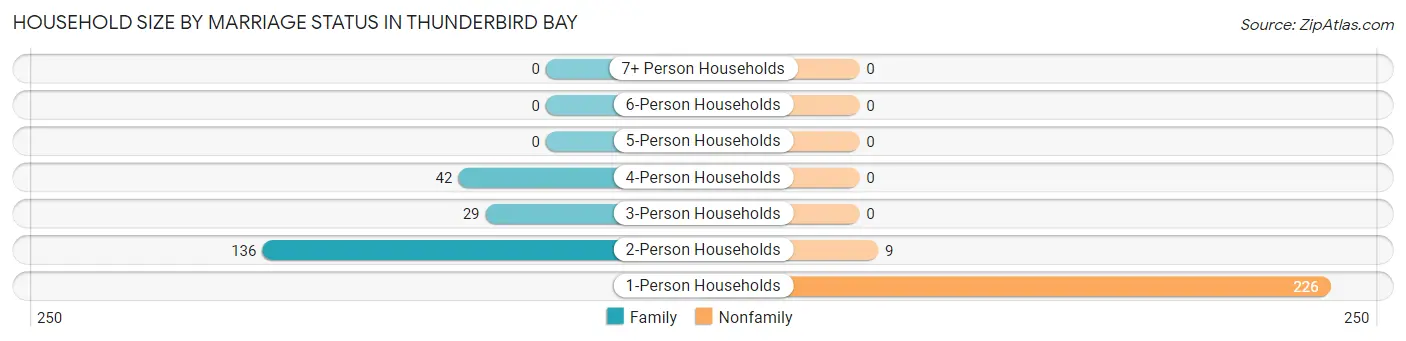
| Household Size | Family Households | Nonfamily Households |
| 1-Person Households | - | 226 (51.1%) |
| 2-Person Households | 136 (30.8%) | 9 (2.0%) |
| 3-Person Households | 29 (6.6%) | 0 (0.0%) |
| 4-Person Households | 42 (9.5%) | 0 (0.0%) |
| 5-Person Households | 0 (0.0%) | 0 (0.0%) |
| 6-Person Households | 0 (0.0%) | 0 (0.0%) |
| 7+ Person Households | 0 (0.0%) | 0 (0.0%) |
| Total | 207 (46.8%) | 235 (53.2%) |
Female Fertility in Thunderbird Bay
Fertility by Age in Thunderbird Bay
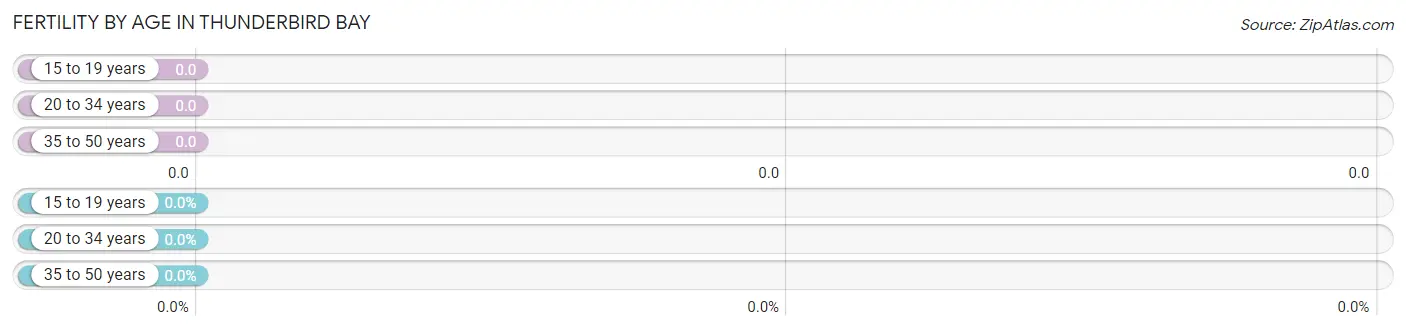
| Age Bracket | Women with Births | Births / 1,000 Women |
| 15 to 19 years | 0 (0.0%) | 0.0 |
| 20 to 34 years | 0 (0.0%) | 0.0 |
| 35 to 50 years | 0 (0.0%) | 0.0 |
| Total | 0 (0.0%) | 0.0 |
Fertility by Age by Marriage Status in Thunderbird Bay
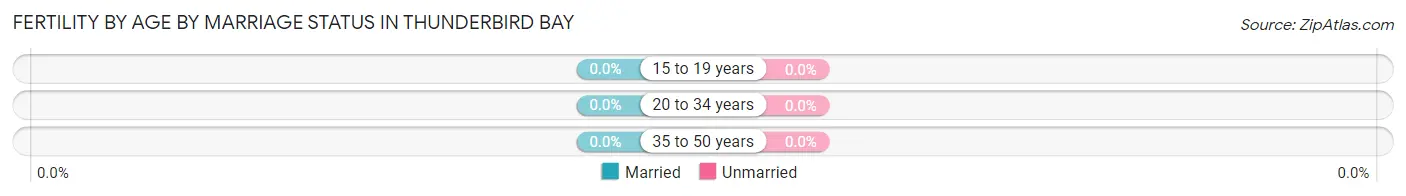
| Age Bracket | Married | Unmarried |
| 15 to 19 years | 0 (0.0%) | 0 (0.0%) |
| 20 to 34 years | 0 (0.0%) | 0 (0.0%) |
| 35 to 50 years | 0 (0.0%) | 0 (0.0%) |
| Total | 0 (0.0%) | 0 (0.0%) |
Fertility by Education in Thunderbird Bay
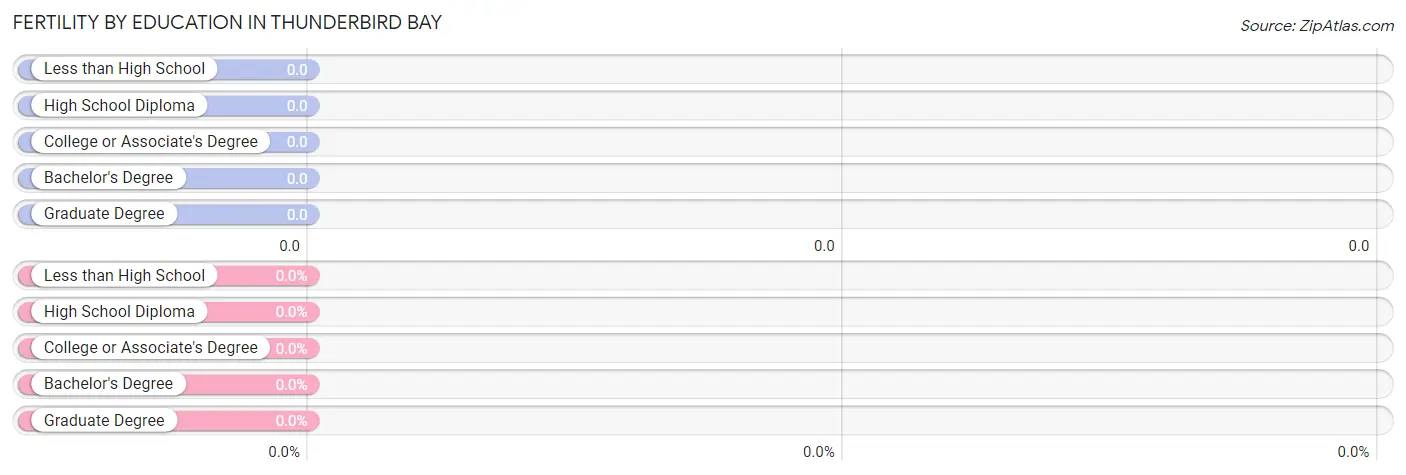
| Educational Attainment | Women with Births | Births / 1,000 Women |
| Less than High School | 0 (0.0%) | 0.0 |
| High School Diploma | 0 (0.0%) | 0.0 |
| College or Associate's Degree | 0 (0.0%) | 0.0 |
| Bachelor's Degree | 0 (0.0%) | 0.0 |
| Graduate Degree | 0 (0.0%) | 0.0 |
| Total | 0 (0.0%) | 0.0 |
Fertility by Education by Marriage Status in Thunderbird Bay
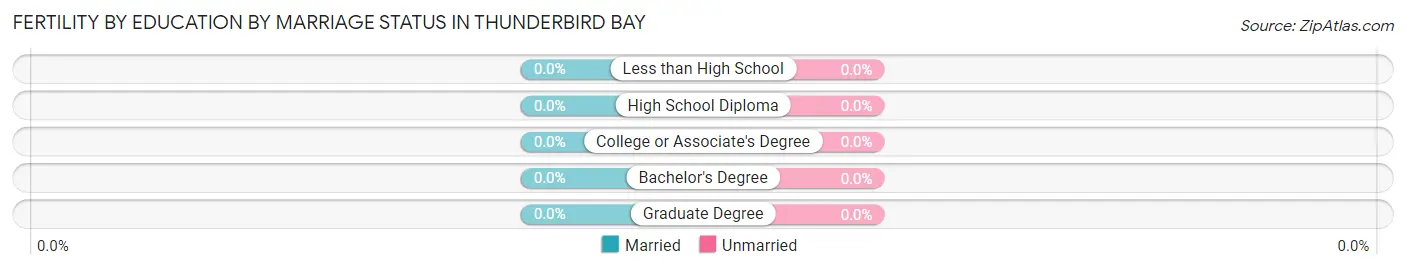
| Educational Attainment | Married | Unmarried |
| Less than High School | 0 (0.0%) | 0 (0.0%) |
| High School Diploma | 0 (0.0%) | 0 (0.0%) |
| College or Associate's Degree | 0 (0.0%) | 0 (0.0%) |
| Bachelor's Degree | 0 (0.0%) | 0 (0.0%) |
| Graduate Degree | 0 (0.0%) | 0 (0.0%) |
| Total | 0 (0.0%) | 0 (0.0%) |
Income in Thunderbird Bay
Income Overview in Thunderbird Bay
Per Capita Income in Thunderbird Bay is $31,863, while median incomes of families and households are $52,417 and $43,750 respectively.
| Characteristic | Number | Measure |
| Per Capita Income | 766 | $31,863 |
| Median Family Income | 207 | $52,417 |
| Mean Family Income | 207 | $70,000 |
| Median Household Income | 442 | $43,750 |
| Mean Household Income | 442 | $54,924 |
| Income Deficit | 207 | $0 |
| Wage / Income Gap (%) | 766 | 53.40% |
| Wage / Income Gap ($) | 766 | 46.60¢ per $1 |
| Gini / Inequality Index | 766 | 0.43 |
Earnings by Sex in Thunderbird Bay
Average Earnings in Thunderbird Bay are $32,375, $60,066 for men and $27,991 for women, a difference of 53.4%.
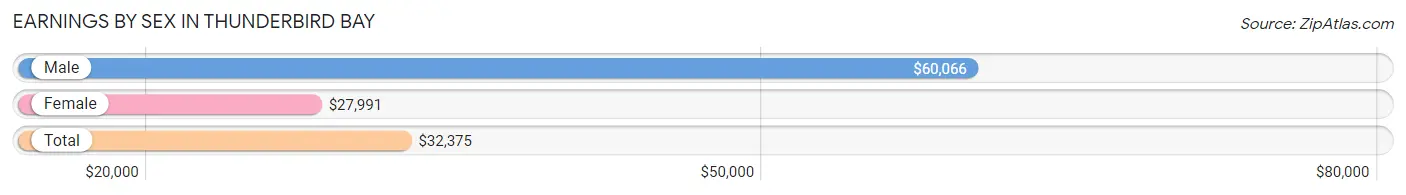
| Sex | Number | Average Earnings |
| Male | 185 (58.7%) | $60,066 |
| Female | 130 (41.3%) | $27,991 |
| Total | 315 (100.0%) | $32,375 |
Earnings by Sex by Income Bracket in Thunderbird Bay
The most common earnings brackets in Thunderbird Bay are $100,000+ for men (57 | 30.8%) and $25,000 to $29,999 for women (56 | 43.1%).
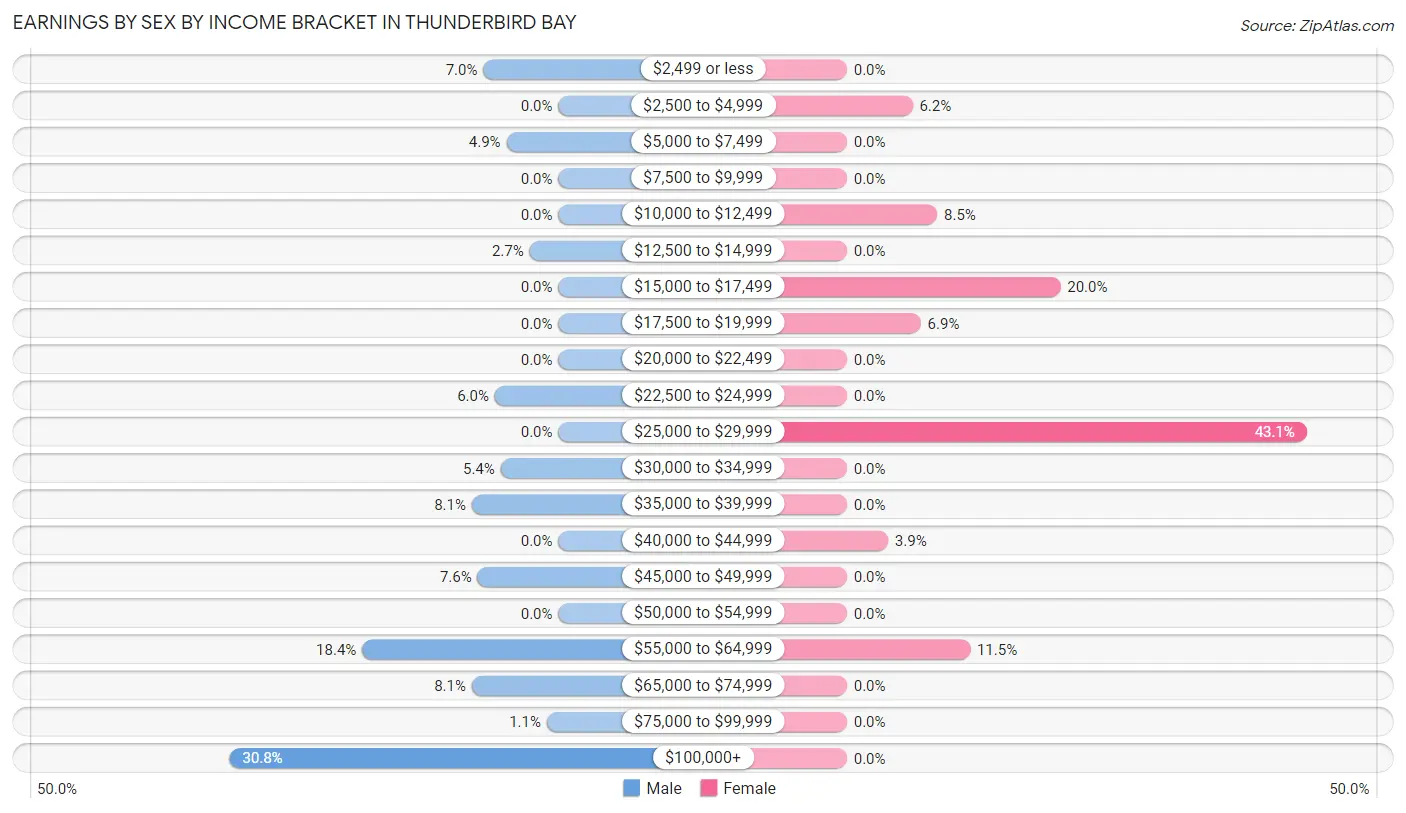
| Income | Male | Female |
| $2,499 or less | 13 (7.0%) | 0 (0.0%) |
| $2,500 to $4,999 | 0 (0.0%) | 8 (6.1%) |
| $5,000 to $7,499 | 9 (4.9%) | 0 (0.0%) |
| $7,500 to $9,999 | 0 (0.0%) | 0 (0.0%) |
| $10,000 to $12,499 | 0 (0.0%) | 11 (8.5%) |
| $12,500 to $14,999 | 5 (2.7%) | 0 (0.0%) |
| $15,000 to $17,499 | 0 (0.0%) | 26 (20.0%) |
| $17,500 to $19,999 | 0 (0.0%) | 9 (6.9%) |
| $20,000 to $22,499 | 0 (0.0%) | 0 (0.0%) |
| $22,500 to $24,999 | 11 (5.9%) | 0 (0.0%) |
| $25,000 to $29,999 | 0 (0.0%) | 56 (43.1%) |
| $30,000 to $34,999 | 10 (5.4%) | 0 (0.0%) |
| $35,000 to $39,999 | 15 (8.1%) | 0 (0.0%) |
| $40,000 to $44,999 | 0 (0.0%) | 5 (3.8%) |
| $45,000 to $49,999 | 14 (7.6%) | 0 (0.0%) |
| $50,000 to $54,999 | 0 (0.0%) | 0 (0.0%) |
| $55,000 to $64,999 | 34 (18.4%) | 15 (11.5%) |
| $65,000 to $74,999 | 15 (8.1%) | 0 (0.0%) |
| $75,000 to $99,999 | 2 (1.1%) | 0 (0.0%) |
| $100,000+ | 57 (30.8%) | 0 (0.0%) |
| Total | 185 (100.0%) | 130 (100.0%) |
Earnings by Sex by Educational Attainment in Thunderbird Bay
Average earnings in Thunderbird Bay are $60,724 for men and $28,170 for women, a difference of 53.6%. Men with an educational attainment of high school diploma enjoy the highest average annual earnings of $47,054, while those with high school diploma education earn the least with $47,054. Women with an educational attainment of college or associate's degree earn the most with the average annual earnings of $28,170, while those with college or associate's degree education have the smallest earnings of $28,170.
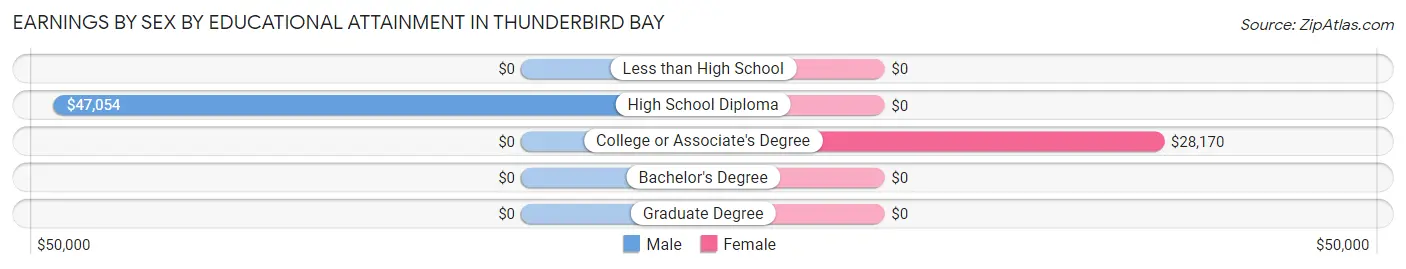
| Educational Attainment | Male Income | Female Income |
| Less than High School | - | - |
| High School Diploma | $47,054 | $0 |
| College or Associate's Degree | - | - |
| Bachelor's Degree | - | - |
| Graduate Degree | - | - |
| Total | $60,724 | $28,170 |
Family Income in Thunderbird Bay
Family Income Brackets in Thunderbird Bay
According to the Thunderbird Bay family income data, there are 68 families falling into the $35,000 to $49,999 income range, which is the most common income bracket and makes up 32.9% of all families.
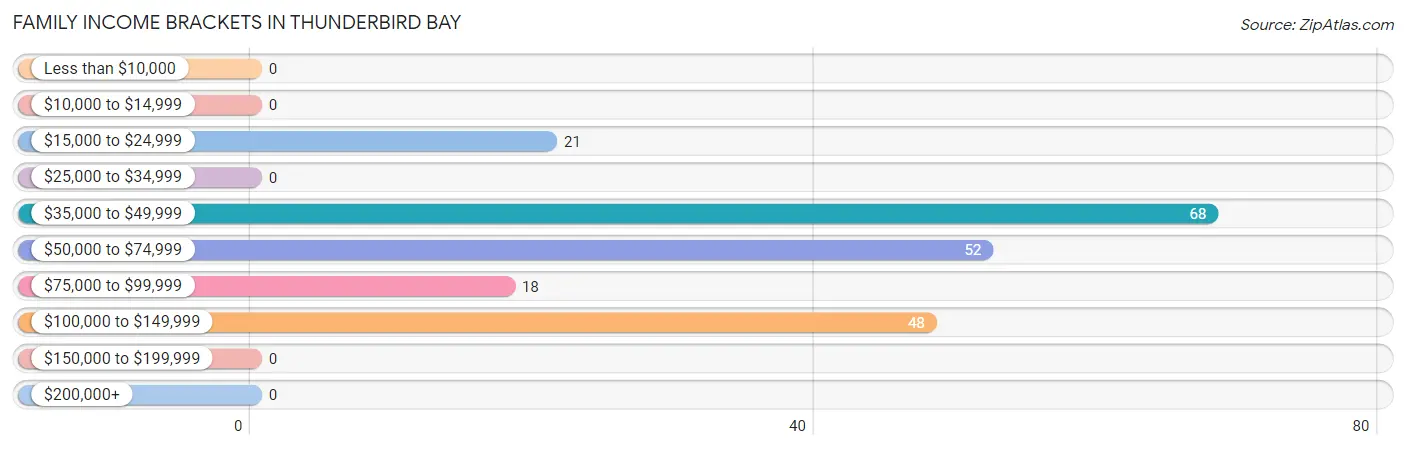
| Income Bracket | # Families | % Families |
| Less than $10,000 | 0 | 0.0% |
| $10,000 to $14,999 | 0 | 0.0% |
| $15,000 to $24,999 | 21 | 10.1% |
| $25,000 to $34,999 | 0 | 0.0% |
| $35,000 to $49,999 | 68 | 32.9% |
| $50,000 to $74,999 | 52 | 25.1% |
| $75,000 to $99,999 | 18 | 8.7% |
| $100,000 to $149,999 | 48 | 23.2% |
| $150,000 to $199,999 | 0 | 0.0% |
| $200,000+ | 0 | 0.0% |
Family Income by Famaliy Size in Thunderbird Bay
3-person families (29 | 14.0%) account for the highest median family income in Thunderbird Bay with $68,583 per family, while 2-person families (136 | 65.7%) have the highest median income of $23,882 per family member.
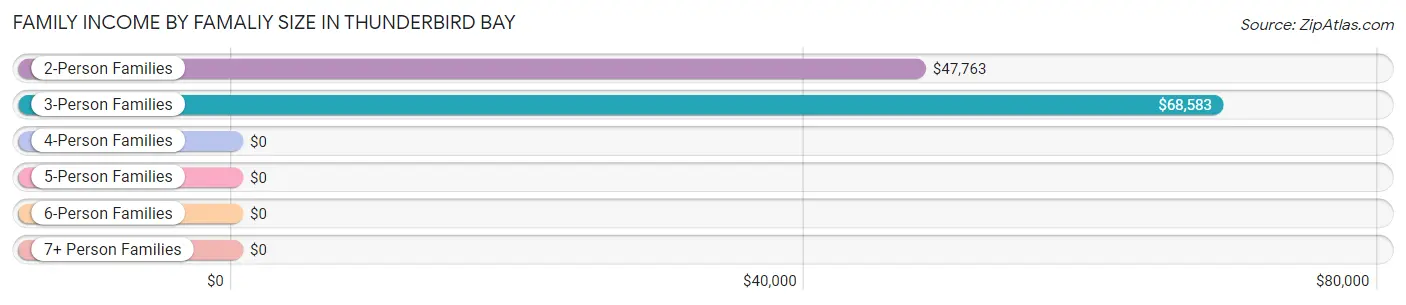
| Income Bracket | # Families | Median Income |
| 2-Person Families | 136 (65.7%) | $47,763 |
| 3-Person Families | 29 (14.0%) | $68,583 |
| 4-Person Families | 42 (20.3%) | $0 |
| 5-Person Families | 0 (0.0%) | $0 |
| 6-Person Families | 0 (0.0%) | $0 |
| 7+ Person Families | 0 (0.0%) | $0 |
| Total | 207 (100.0%) | $52,417 |
Family Income by Number of Earners in Thunderbird Bay
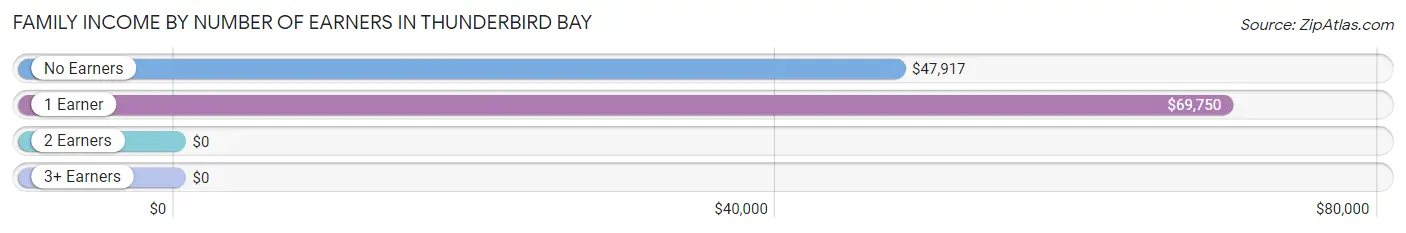
| Number of Earners | # Families | Median Income |
| No Earners | 66 (31.9%) | $47,917 |
| 1 Earner | 93 (44.9%) | $69,750 |
| 2 Earners | 48 (23.2%) | $0 |
| 3+ Earners | 0 (0.0%) | $0 |
| Total | 207 (100.0%) | $52,417 |
Household Income in Thunderbird Bay
Household Income Brackets in Thunderbird Bay
With 98 households falling in the category, the $100,000 to $149,999 income range is the most frequent in Thunderbird Bay, accounting for 22.2% of all households.
| Income Bracket | # Households | % Households |
| Less than $10,000 | 54 | 12.2% |
| $10,000 to $14,999 | 7 | 1.6% |
| $15,000 to $24,999 | 63 | 14.3% |
| $25,000 to $34,999 | 65 | 14.7% |
| $35,000 to $49,999 | 74 | 16.7% |
| $50,000 to $74,999 | 63 | 14.3% |
| $75,000 to $99,999 | 18 | 4.1% |
| $100,000 to $149,999 | 98 | 22.2% |
| $150,000 to $199,999 | 0 | 0.0% |
| $200,000+ | 0 | 0.0% |
Household Income by Householder Age in Thunderbird Bay
The median household income in Thunderbird Bay is $43,750, with the highest median household income of $50,333 found in the 45 to 64 years age bracket for the primary householder. A total of 126 households (28.5%) fall into this category. Meanwhile, the 15 to 24 years age bracket for the primary householder has the lowest median household income of $0, with 38 households (8.6%) in this group.
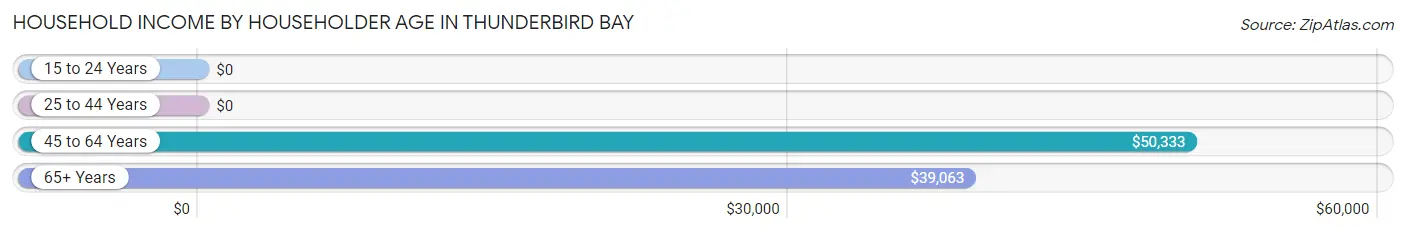
| Income Bracket | # Households | Median Income |
| 15 to 24 Years | 38 (8.6%) | $0 |
| 25 to 44 Years | 135 (30.5%) | $0 |
| 45 to 64 Years | 126 (28.5%) | $50,333 |
| 65+ Years | 143 (32.4%) | $39,063 |
| Total | 442 (100.0%) | $43,750 |
Poverty in Thunderbird Bay
Income Below Poverty by Sex and Age in Thunderbird Bay
With 18.8% poverty level for males and 12.1% for females among the residents of Thunderbird Bay, 25 to 34 year old males and 65 to 74 year old females are the most vulnerable to poverty, with 9 males (100.0%) and 37 females (63.8%) in their respective age groups living below the poverty level.
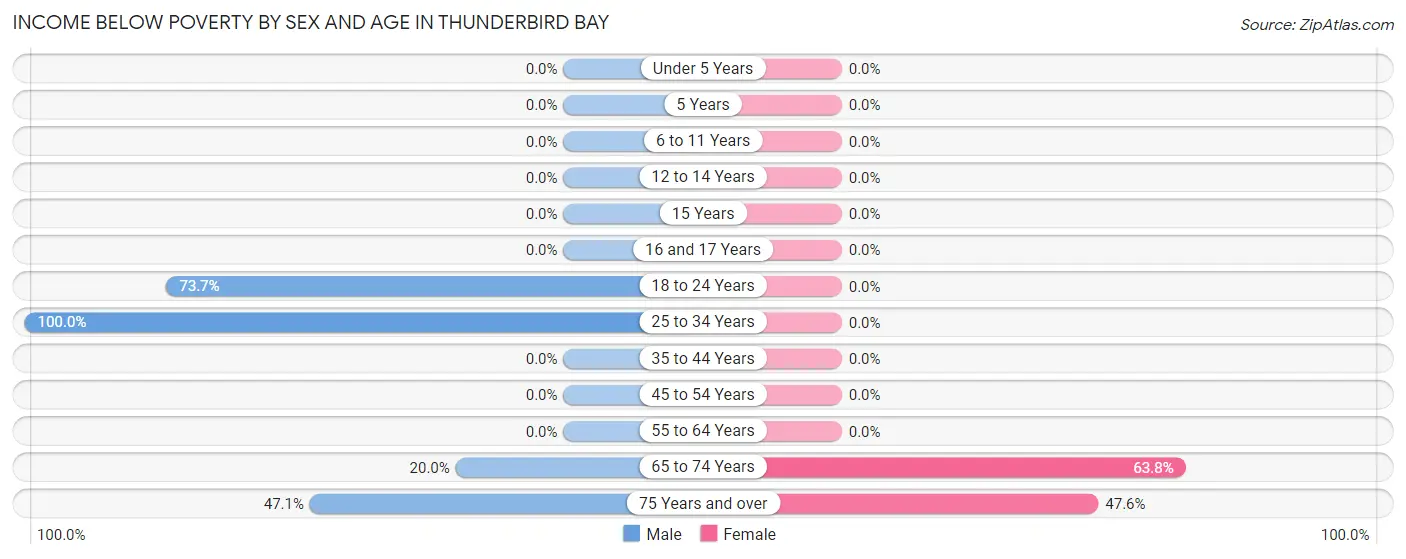
| Age Bracket | Male | Female |
| Under 5 Years | 0 (0.0%) | 0 (0.0%) |
| 5 Years | 0 (0.0%) | 0 (0.0%) |
| 6 to 11 Years | 0 (0.0%) | 0 (0.0%) |
| 12 to 14 Years | 0 (0.0%) | 0 (0.0%) |
| 15 Years | 0 (0.0%) | 0 (0.0%) |
| 16 and 17 Years | 0 (0.0%) | 0 (0.0%) |
| 18 to 24 Years | 28 (73.7%) | 0 (0.0%) |
| 25 to 34 Years | 9 (100.0%) | 0 (0.0%) |
| 35 to 44 Years | 0 (0.0%) | 0 (0.0%) |
| 45 to 54 Years | 0 (0.0%) | 0 (0.0%) |
| 55 to 64 Years | 0 (0.0%) | 0 (0.0%) |
| 65 to 74 Years | 18 (20.0%) | 37 (63.8%) |
| 75 Years and over | 16 (47.1%) | 10 (47.6%) |
| Total | 71 (18.8%) | 47 (12.1%) |
Income Above Poverty by Sex and Age in Thunderbird Bay
According to the poverty statistics in Thunderbird Bay, males aged 35 to 44 years and females aged 5 years are the age groups that are most secure financially, with 100.0% of males and 100.0% of females in these age groups living above the poverty line.
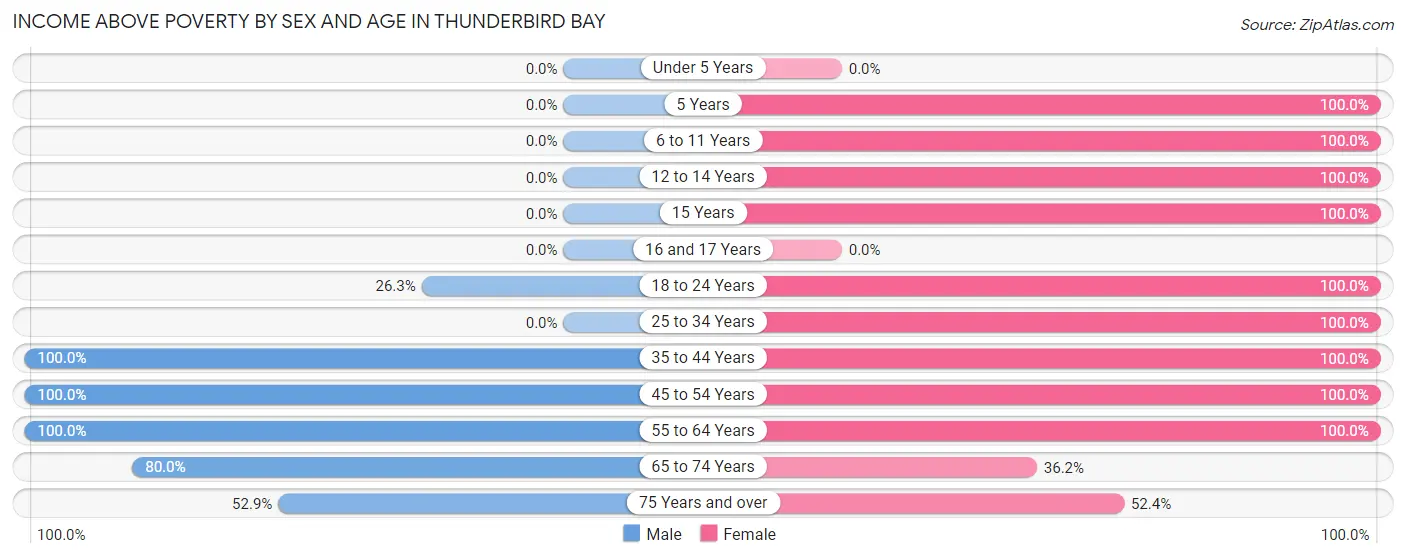
| Age Bracket | Male | Female |
| Under 5 Years | 0 (0.0%) | 0 (0.0%) |
| 5 Years | 0 (0.0%) | 6 (100.0%) |
| 6 to 11 Years | 0 (0.0%) | 51 (100.0%) |
| 12 to 14 Years | 0 (0.0%) | 17 (100.0%) |
| 15 Years | 0 (0.0%) | 31 (100.0%) |
| 16 and 17 Years | 0 (0.0%) | 0 (0.0%) |
| 18 to 24 Years | 10 (26.3%) | 8 (100.0%) |
| 25 to 34 Years | 0 (0.0%) | 56 (100.0%) |
| 35 to 44 Years | 70 (100.0%) | 24 (100.0%) |
| 45 to 54 Years | 56 (100.0%) | 63 (100.0%) |
| 55 to 64 Years | 81 (100.0%) | 53 (100.0%) |
| 65 to 74 Years | 72 (80.0%) | 21 (36.2%) |
| 75 Years and over | 18 (52.9%) | 11 (52.4%) |
| Total | 307 (81.2%) | 341 (87.9%) |
Income Below Poverty Among Married-Couple Families in Thunderbird Bay
The poverty statistics for married-couple families in Thunderbird Bay show that 11.5% or 21 of the total 182 families live below the poverty line. Families with no children have the highest poverty rate of 17.6%, comprising of 21 families. On the other hand, families with 1 or 2 children have the lowest poverty rate of 0.0%, which includes 0 families.
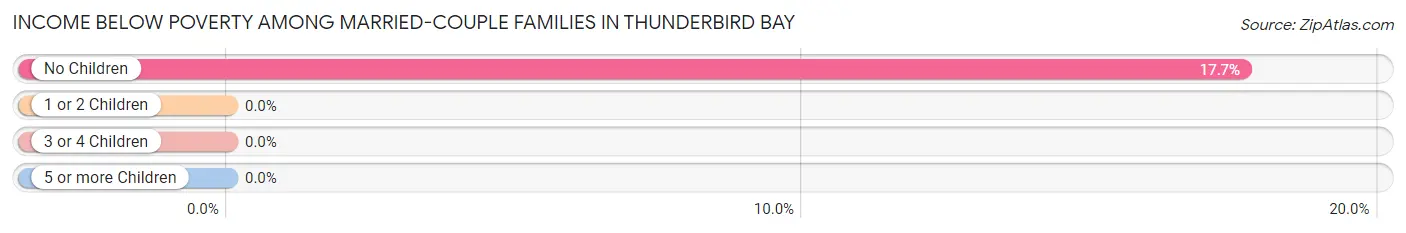
| Children | Above Poverty | Below Poverty |
| No Children | 98 (82.4%) | 21 (17.6%) |
| 1 or 2 Children | 63 (100.0%) | 0 (0.0%) |
| 3 or 4 Children | 0 (0.0%) | 0 (0.0%) |
| 5 or more Children | 0 (0.0%) | 0 (0.0%) |
| Total | 161 (88.5%) | 21 (11.5%) |
Income Below Poverty Among Single-Parent Households in Thunderbird Bay
| Children | Single Father | Single Mother |
| No Children | 0 (0.0%) | 0 (0.0%) |
| 1 or 2 Children | 0 (0.0%) | 0 (0.0%) |
| 3 or 4 Children | 0 (0.0%) | 0 (0.0%) |
| 5 or more Children | 0 (0.0%) | 0 (0.0%) |
| Total | 0 (0.0%) | 0 (0.0%) |
Income Below Poverty Among Married-Couple vs Single-Parent Households in Thunderbird Bay
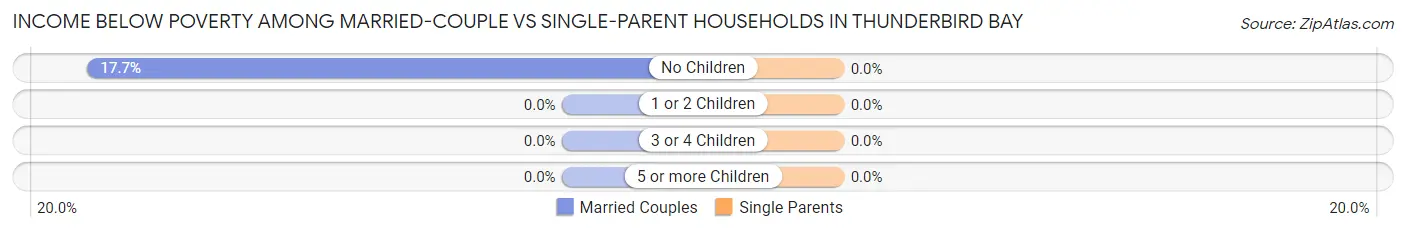
| Children | Married-Couple Families | Single-Parent Households |
| No Children | 21 (17.6%) | 0 (0.0%) |
| 1 or 2 Children | 0 (0.0%) | 0 (0.0%) |
| 3 or 4 Children | 0 (0.0%) | 0 (0.0%) |
| 5 or more Children | 0 (0.0%) | 0 (0.0%) |
| Total | 21 (11.5%) | 0 (0.0%) |
Employment Characteristics in Thunderbird Bay
Employment by Class of Employer in Thunderbird Bay
Among the 293 employed individuals in Thunderbird Bay, private company employees (228 | 77.8%), self-employed (not incorporated) (23 | 7.9%), and not-for-profit organizations (23 | 7.9%) make up the most common classes of employment.
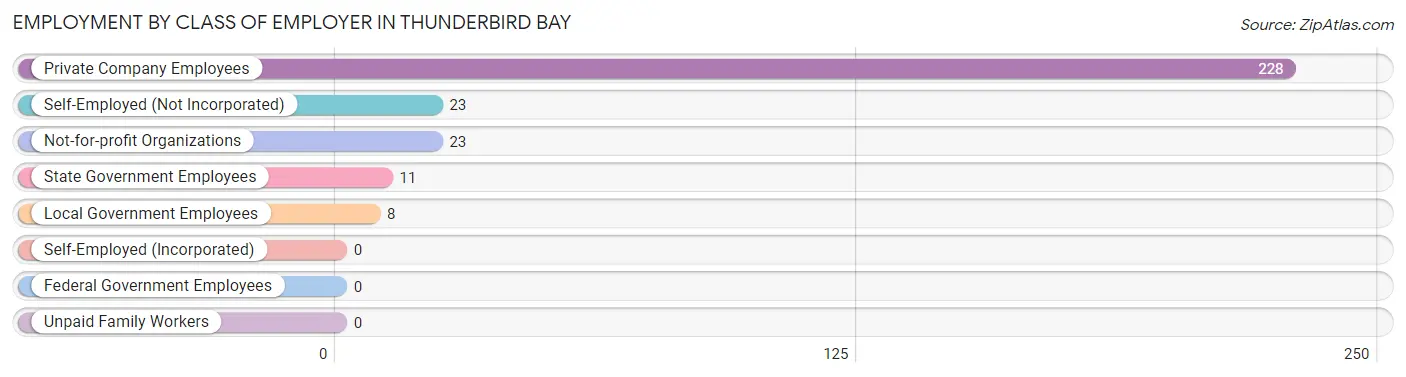
| Employer Class | # Employees | % Employees |
| Private Company Employees | 228 | 77.8% |
| Self-Employed (Incorporated) | 0 | 0.0% |
| Self-Employed (Not Incorporated) | 23 | 7.9% |
| Not-for-profit Organizations | 23 | 7.9% |
| Local Government Employees | 8 | 2.7% |
| State Government Employees | 11 | 3.7% |
| Federal Government Employees | 0 | 0.0% |
| Unpaid Family Workers | 0 | 0.0% |
| Total | 293 | 100.0% |
Employment Status by Age in Thunderbird Bay
According to the labor force statistics for Thunderbird Bay, out of the total population over 16 years of age (661), 51.9% or 343 individuals are in the labor force, with 14.6% or 50 of them unemployed. The age group with the highest labor force participation rate is 20 to 24 years, with 100.0% or 46 individuals in the labor force. Within the labor force, the 20 to 24 years age range has the highest percentage of unemployed individuals, with 60.9% or 28 of them being unemployed.
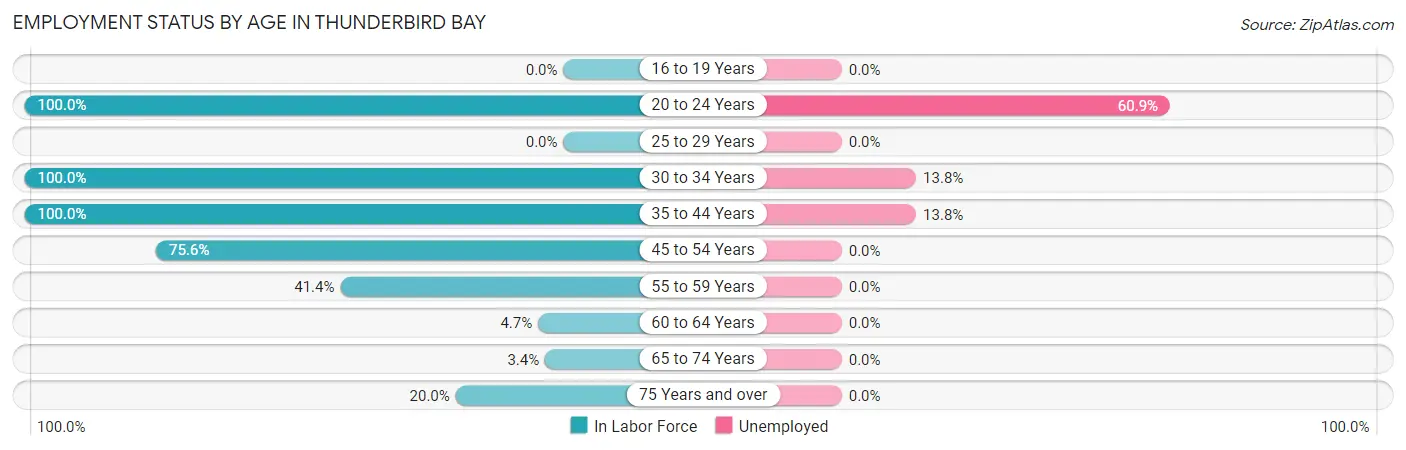
| Age Bracket | In Labor Force | Unemployed |
| 16 to 19 Years | 0 (0.0%) | 0 (0.0%) |
| 20 to 24 Years | 46 (100.0%) | 28 (60.9%) |
| 25 to 29 Years | 0 (0.0%) | 0 (0.0%) |
| 30 to 34 Years | 65 (100.0%) | 9 (13.8%) |
| 35 to 44 Years | 94 (100.0%) | 13 (13.8%) |
| 45 to 54 Years | 90 (75.6%) | 0 (0.0%) |
| 55 to 59 Years | 29 (41.4%) | 0 (0.0%) |
| 60 to 64 Years | 3 (4.7%) | 0 (0.0%) |
| 65 to 74 Years | 5 (3.4%) | 0 (0.0%) |
| 75 Years and over | 11 (20.0%) | 0 (0.0%) |
| Total | 343 (51.9%) | 50 (14.6%) |
Employment Status by Educational Attainment in Thunderbird Bay
According to labor force statistics for Thunderbird Bay, 68.2% of individuals (281) out of the total population between 25 and 64 years of age (412) are in the labor force, with 7.8% or 22 of them being unemployed. The group with the highest labor force participation rate are those with the educational attainment of bachelor's degree or higher, with 100.0% or 32 individuals in the labor force. Within the labor force, individuals with high school diploma education have the highest percentage of unemployment, with 15.8% or 9 of them being unemployed.
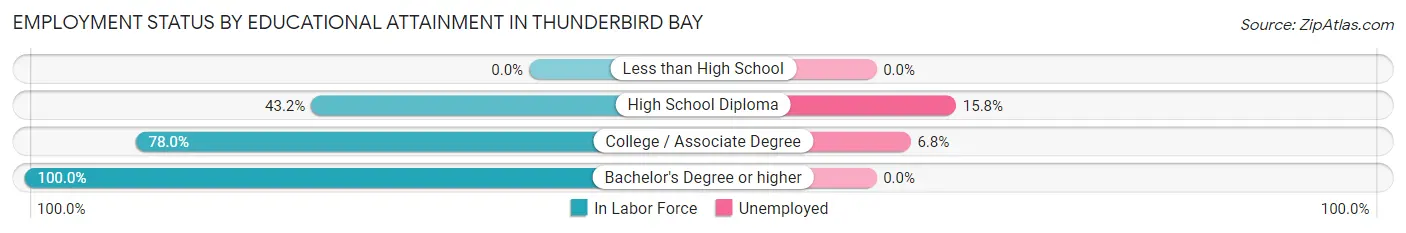
| Educational Attainment | In Labor Force | Unemployed |
| Less than High School | 0 (0.0%) | 0 (0.0%) |
| High School Diploma | 57 (43.2%) | 21 (15.8%) |
| College / Associate Degree | 192 (78.0%) | 17 (6.8%) |
| Bachelor's Degree or higher | 32 (100.0%) | 0 (0.0%) |
| Total | 281 (68.2%) | 32 (7.8%) |
Employment Occupations by Sex in Thunderbird Bay
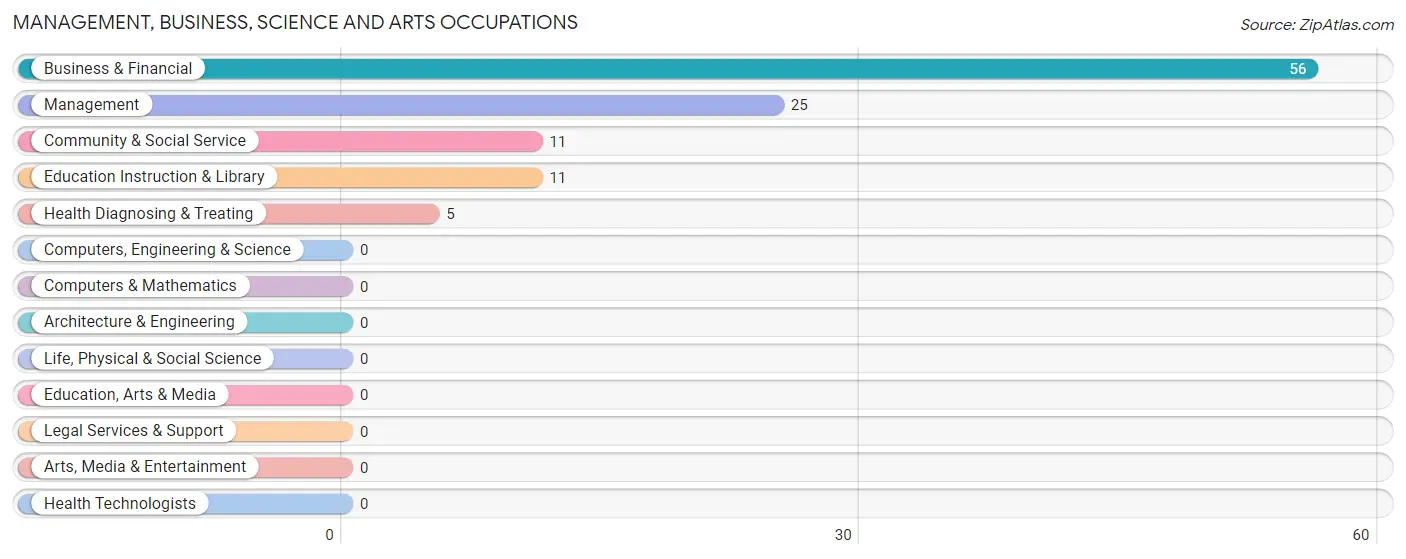
Management, Business, Science and Arts Occupations
The most common Management, Business, Science and Arts occupations in Thunderbird Bay are Business & Financial (56 | 19.1%), Management (25 | 8.5%), Community & Social Service (11 | 3.7%), Education Instruction & Library (11 | 3.7%), and Health Diagnosing & Treating (5 | 1.7%).
Management, Business, Science and Arts Occupations by Sex
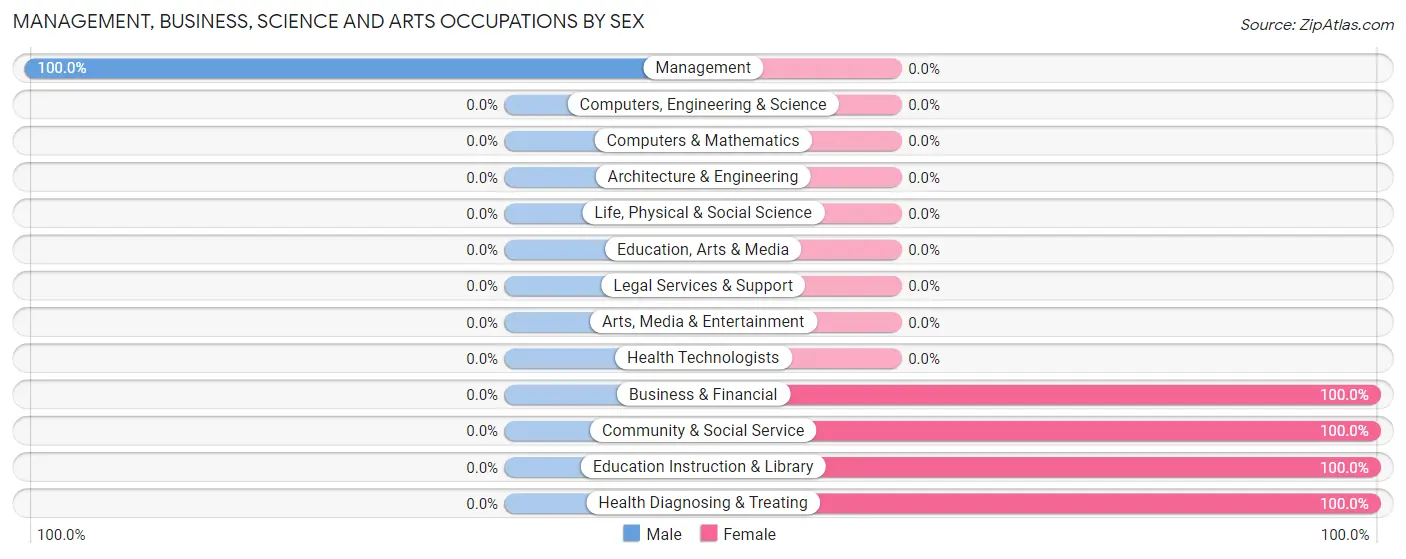
| Occupation | Male | Female |
| Management | 25 (100.0%) | 0 (0.0%) |
| Business & Financial | 0 (0.0%) | 56 (100.0%) |
| Computers, Engineering & Science | 0 (0.0%) | 0 (0.0%) |
| Computers & Mathematics | 0 (0.0%) | 0 (0.0%) |
| Architecture & Engineering | 0 (0.0%) | 0 (0.0%) |
| Life, Physical & Social Science | 0 (0.0%) | 0 (0.0%) |
| Community & Social Service | 0 (0.0%) | 11 (100.0%) |
| Education, Arts & Media | 0 (0.0%) | 0 (0.0%) |
| Legal Services & Support | 0 (0.0%) | 0 (0.0%) |
| Education Instruction & Library | 0 (0.0%) | 11 (100.0%) |
| Arts, Media & Entertainment | 0 (0.0%) | 0 (0.0%) |
| Health Diagnosing & Treating | 0 (0.0%) | 5 (100.0%) |
| Health Technologists | 0 (0.0%) | 0 (0.0%) |
| Total (Category) | 25 (25.8%) | 72 (74.2%) |
| Total (Overall) | 163 (55.6%) | 130 (44.4%) |
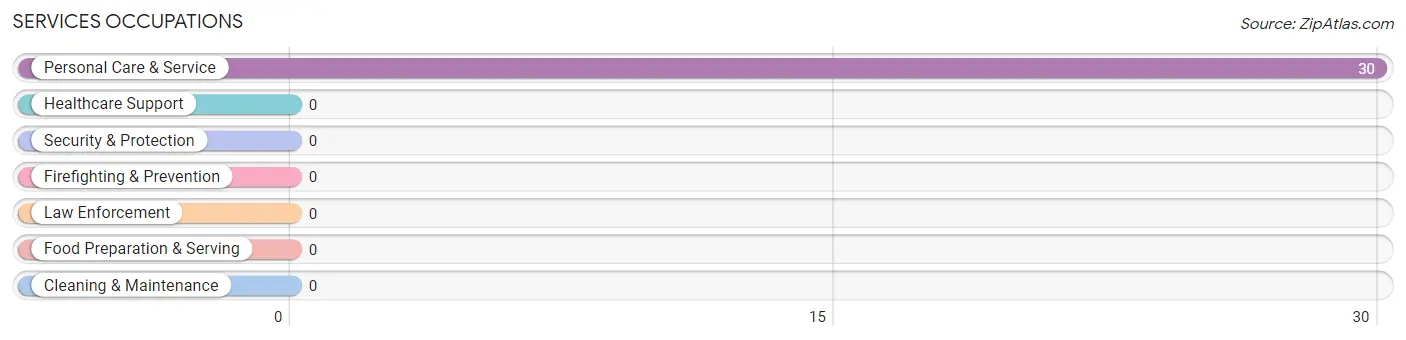
Services Occupations
The most common Services occupations in Thunderbird Bay are , and Personal Care & Service (30 | 10.2%).
Services Occupations by Sex
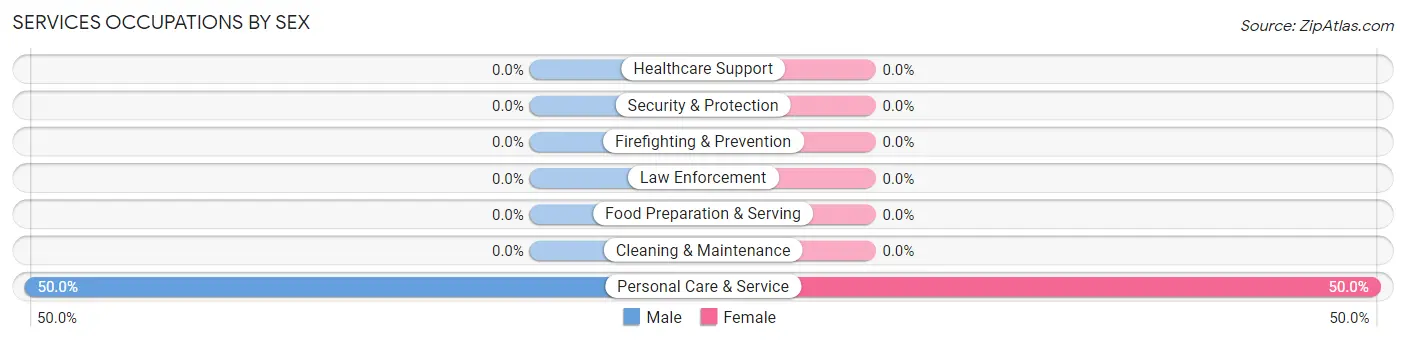
| Occupation | Male | Female |
| Healthcare Support | 0 (0.0%) | 0 (0.0%) |
| Security & Protection | 0 (0.0%) | 0 (0.0%) |
| Firefighting & Prevention | 0 (0.0%) | 0 (0.0%) |
| Law Enforcement | 0 (0.0%) | 0 (0.0%) |
| Food Preparation & Serving | 0 (0.0%) | 0 (0.0%) |
| Cleaning & Maintenance | 0 (0.0%) | 0 (0.0%) |
| Personal Care & Service | 15 (50.0%) | 15 (50.0%) |
| Total (Category) | 15 (50.0%) | 15 (50.0%) |
| Total (Overall) | 163 (55.6%) | 130 (44.4%) |
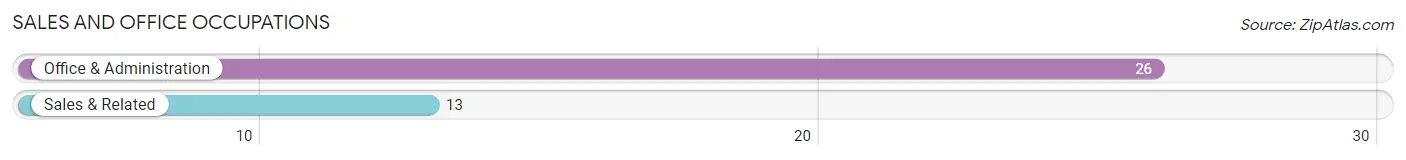
Sales and Office Occupations
The most common Sales and Office occupations in Thunderbird Bay are Office & Administration (26 | 8.9%), and Sales & Related (13 | 4.4%).
Sales and Office Occupations by Sex
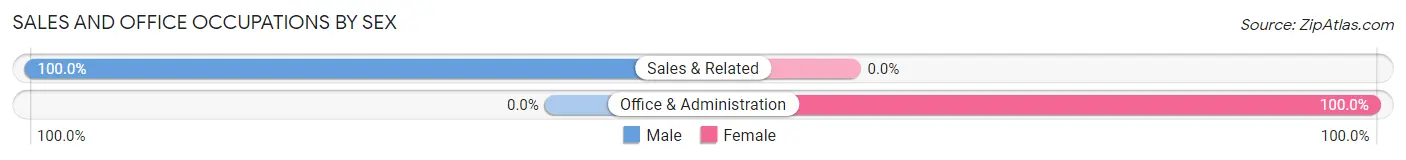
| Occupation | Male | Female |
| Sales & Related | 13 (100.0%) | 0 (0.0%) |
| Office & Administration | 0 (0.0%) | 26 (100.0%) |
| Total (Category) | 13 (33.3%) | 26 (66.7%) |
| Total (Overall) | 163 (55.6%) | 130 (44.4%) |
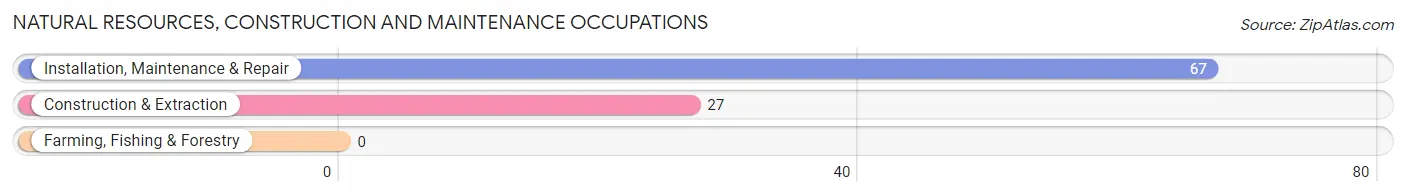
Natural Resources, Construction and Maintenance Occupations
The most common Natural Resources, Construction and Maintenance occupations in Thunderbird Bay are Installation, Maintenance & Repair (67 | 22.9%), and Construction & Extraction (27 | 9.2%).
Natural Resources, Construction and Maintenance Occupations by Sex
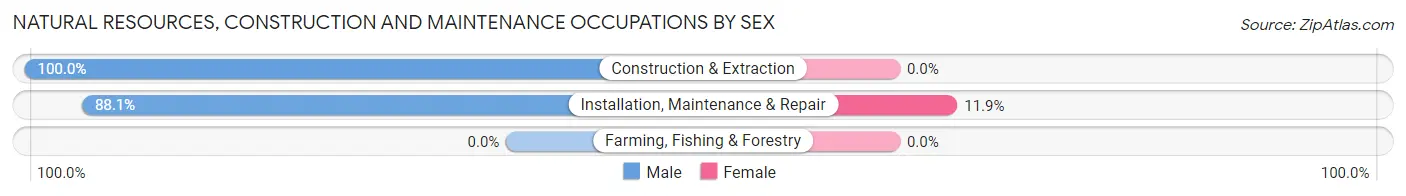
| Occupation | Male | Female |
| Farming, Fishing & Forestry | 0 (0.0%) | 0 (0.0%) |
| Construction & Extraction | 27 (100.0%) | 0 (0.0%) |
| Installation, Maintenance & Repair | 59 (88.1%) | 8 (11.9%) |
| Total (Category) | 86 (91.5%) | 8 (8.5%) |
| Total (Overall) | 163 (55.6%) | 130 (44.4%) |
Production, Transportation and Moving Occupations
The most common Production, Transportation and Moving occupations in Thunderbird Bay are Transportation (19 | 6.5%), and Material Moving (14 | 4.8%).
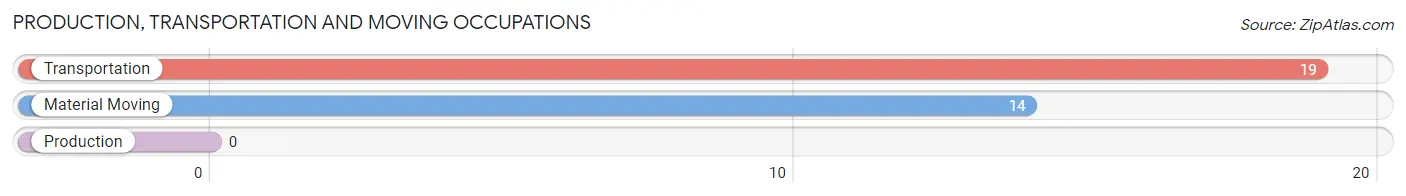
Production, Transportation and Moving Occupations by Sex
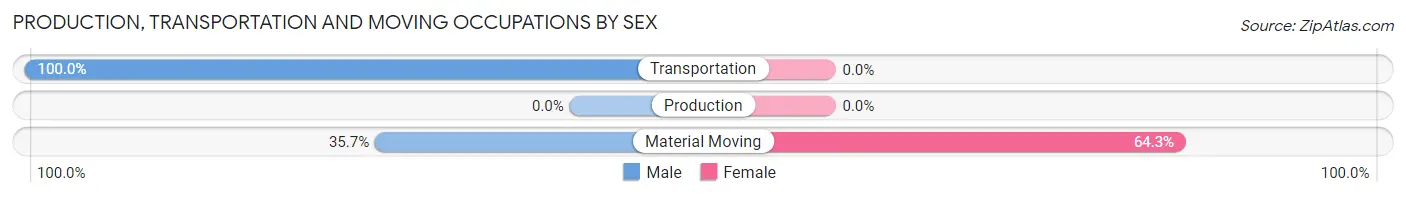
| Occupation | Male | Female |
| Production | 0 (0.0%) | 0 (0.0%) |
| Transportation | 19 (100.0%) | 0 (0.0%) |
| Material Moving | 5 (35.7%) | 9 (64.3%) |
| Total (Category) | 24 (72.7%) | 9 (27.3%) |
| Total (Overall) | 163 (55.6%) | 130 (44.4%) |
Employment Industries by Sex in Thunderbird Bay
Employment Industries in Thunderbird Bay
The major employment industries in Thunderbird Bay include Administrative & Support (74 | 25.3%), Manufacturing (30 | 10.2%), Mining, Quarrying, & Extraction (27 | 9.2%), Retail Trade (20 | 6.8%), and Construction (19 | 6.5%).
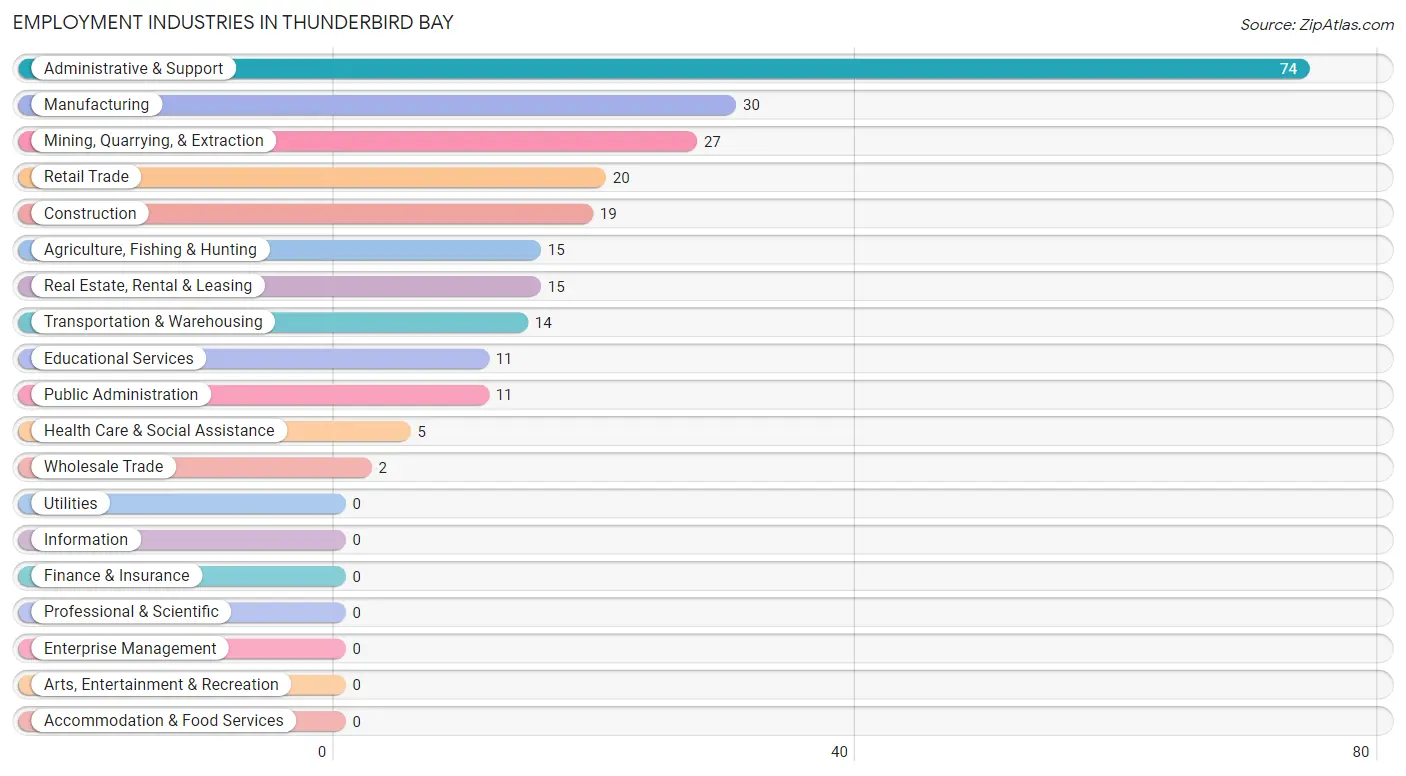
Employment Industries by Sex in Thunderbird Bay
The Thunderbird Bay industries that see more men than women are Agriculture, Fishing & Hunting (100.0%), Mining, Quarrying, & Extraction (100.0%), and Construction (100.0%), whereas the industries that tend to have a higher number of women are Educational Services (100.0%), Health Care & Social Assistance (100.0%), and Public Administration (100.0%).
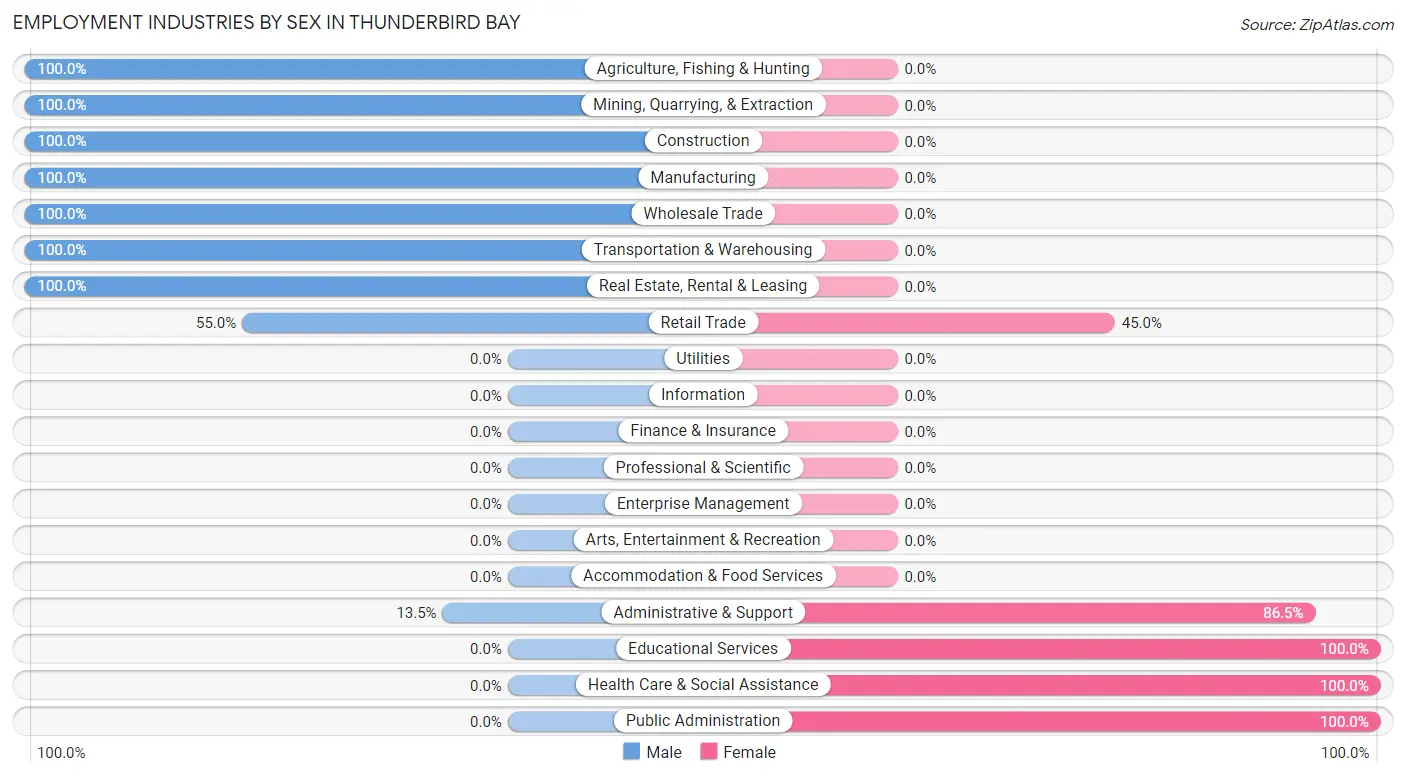
| Industry | Male | Female |
| Agriculture, Fishing & Hunting | 15 (100.0%) | 0 (0.0%) |
| Mining, Quarrying, & Extraction | 27 (100.0%) | 0 (0.0%) |
| Construction | 19 (100.0%) | 0 (0.0%) |
| Manufacturing | 30 (100.0%) | 0 (0.0%) |
| Wholesale Trade | 2 (100.0%) | 0 (0.0%) |
| Retail Trade | 11 (55.0%) | 9 (45.0%) |
| Transportation & Warehousing | 14 (100.0%) | 0 (0.0%) |
| Utilities | 0 (0.0%) | 0 (0.0%) |
| Information | 0 (0.0%) | 0 (0.0%) |
| Finance & Insurance | 0 (0.0%) | 0 (0.0%) |
| Real Estate, Rental & Leasing | 15 (100.0%) | 0 (0.0%) |
| Professional & Scientific | 0 (0.0%) | 0 (0.0%) |
| Enterprise Management | 0 (0.0%) | 0 (0.0%) |
| Administrative & Support | 10 (13.5%) | 64 (86.5%) |
| Educational Services | 0 (0.0%) | 11 (100.0%) |
| Health Care & Social Assistance | 0 (0.0%) | 5 (100.0%) |
| Arts, Entertainment & Recreation | 0 (0.0%) | 0 (0.0%) |
| Accommodation & Food Services | 0 (0.0%) | 0 (0.0%) |
| Public Administration | 0 (0.0%) | 11 (100.0%) |
| Total | 163 (55.6%) | 130 (44.4%) |
Education in Thunderbird Bay
School Enrollment in Thunderbird Bay
The most common levels of schooling among the 117 students in Thunderbird Bay are high school (48 | 41.0%), elementary school (46 | 39.3%), and college / undergraduate (12 | 10.3%).
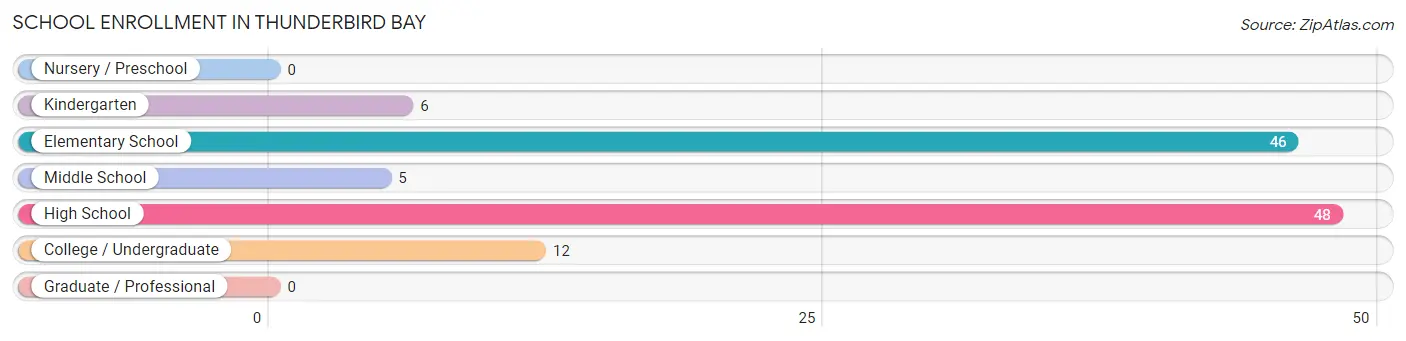
| School Level | # Students | % Students |
| Nursery / Preschool | 0 | 0.0% |
| Kindergarten | 6 | 5.1% |
| Elementary School | 46 | 39.3% |
| Middle School | 5 | 4.3% |
| High School | 48 | 41.0% |
| College / Undergraduate | 12 | 10.3% |
| Graduate / Professional | 0 | 0.0% |
| Total | 117 | 100.0% |
School Enrollment by Age by Funding Source in Thunderbird Bay
Out of a total of 117 students who are enrolled in schools in Thunderbird Bay, 4 (3.4%) attend a private institution, while the remaining 113 (96.6%) are enrolled in public schools. The age group of 35 years and over has the highest likelihood of being enrolled in private schools, with 4 (100.0% in the age bracket) enrolled. Conversely, the age group of 5 to 9 year old has the lowest likelihood of being enrolled in a private school, with 52 (100.0% in the age bracket) attending a public institution.
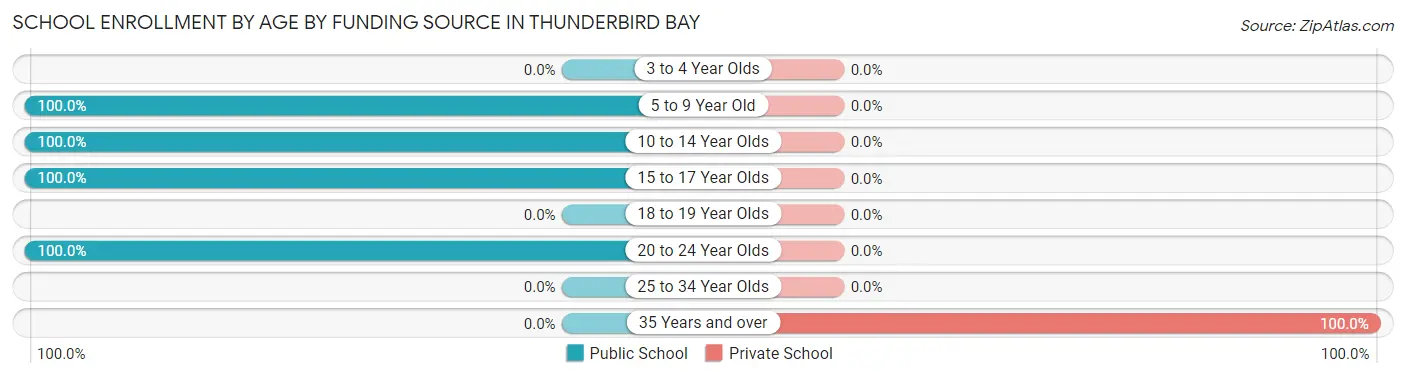
| Age Bracket | Public School | Private School |
| 3 to 4 Year Olds | 0 (0.0%) | 0 (0.0%) |
| 5 to 9 Year Old | 52 (100.0%) | 0 (0.0%) |
| 10 to 14 Year Olds | 22 (100.0%) | 0 (0.0%) |
| 15 to 17 Year Olds | 31 (100.0%) | 0 (0.0%) |
| 18 to 19 Year Olds | 0 (0.0%) | 0 (0.0%) |
| 20 to 24 Year Olds | 8 (100.0%) | 0 (0.0%) |
| 25 to 34 Year Olds | 0 (0.0%) | 0 (0.0%) |
| 35 Years and over | 0 (0.0%) | 4 (100.0%) |
| Total | 113 (96.6%) | 4 (3.4%) |
Educational Attainment by Field of Study in Thunderbird Bay
Engineering (30 | 60.0%), education (12 | 24.0%), computers & mathematics (6 | 12.0%), and business (2 | 4.0%) are the most common fields of study among 50 individuals in Thunderbird Bay who have obtained a bachelor's degree or higher.
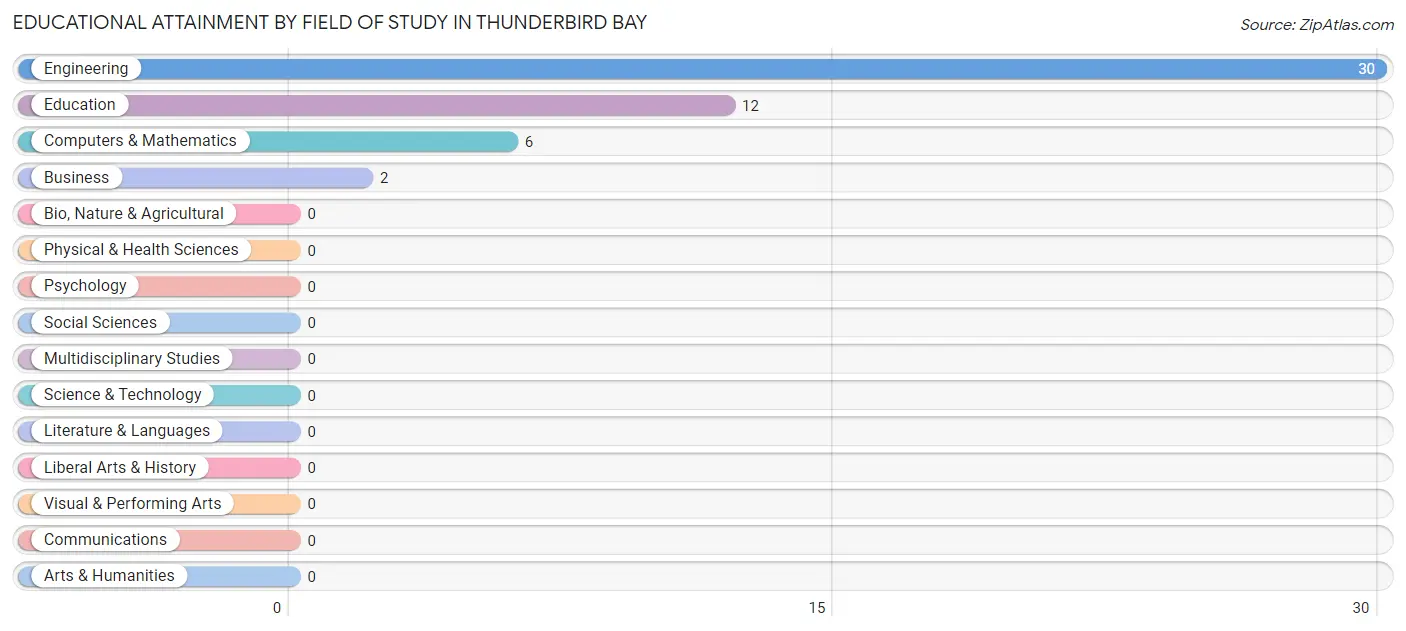
| Field of Study | # Graduates | % Graduates |
| Computers & Mathematics | 6 | 12.0% |
| Bio, Nature & Agricultural | 0 | 0.0% |
| Physical & Health Sciences | 0 | 0.0% |
| Psychology | 0 | 0.0% |
| Social Sciences | 0 | 0.0% |
| Engineering | 30 | 60.0% |
| Multidisciplinary Studies | 0 | 0.0% |
| Science & Technology | 0 | 0.0% |
| Business | 2 | 4.0% |
| Education | 12 | 24.0% |
| Literature & Languages | 0 | 0.0% |
| Liberal Arts & History | 0 | 0.0% |
| Visual & Performing Arts | 0 | 0.0% |
| Communications | 0 | 0.0% |
| Arts & Humanities | 0 | 0.0% |
| Total | 50 | 100.0% |
Transportation & Commute in Thunderbird Bay
Vehicle Availability by Sex in Thunderbird Bay
The most prevalent vehicle ownership categories in Thunderbird Bay are males with 2 vehicles (118, accounting for 72.4%) and females with 2 vehicles (38, making up 90.8%).
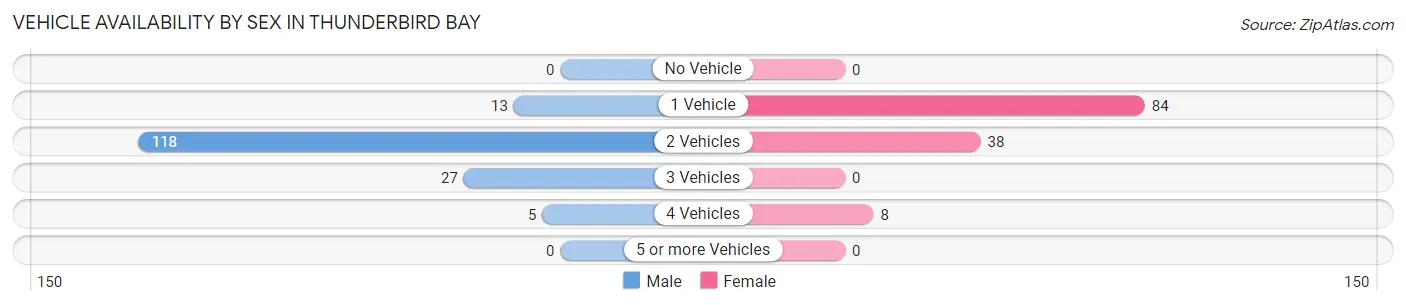
| Vehicles Available | Male | Female |
| No Vehicle | 0 (0.0%) | 0 (0.0%) |
| 1 Vehicle | 13 (8.0%) | 84 (64.6%) |
| 2 Vehicles | 118 (72.4%) | 38 (29.2%) |
| 3 Vehicles | 27 (16.6%) | 0 (0.0%) |
| 4 Vehicles | 5 (3.1%) | 8 (6.1%) |
| 5 or more Vehicles | 0 (0.0%) | 0 (0.0%) |
| Total | 163 (100.0%) | 130 (100.0%) |
Commute Time in Thunderbird Bay
The most frequently occuring commute durations in Thunderbird Bay are 30 to 34 minutes (46 commuters, 20.1%), 20 to 24 minutes (45 commuters, 19.7%), and 40 to 44 minutes (30 commuters, 13.1%).
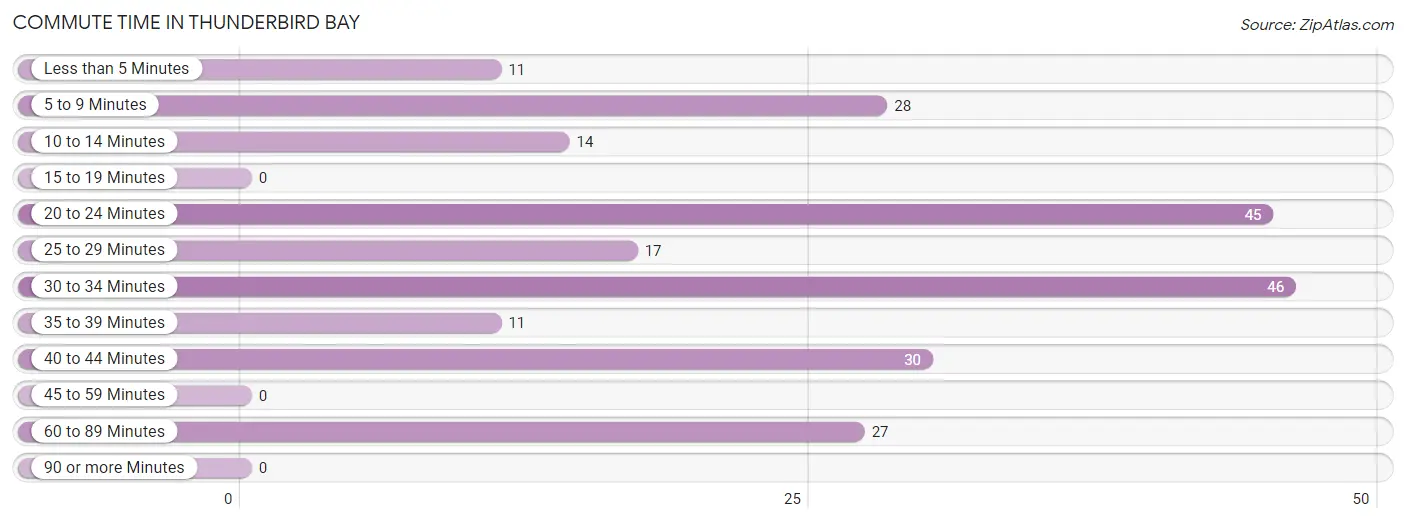
| Commute Time | # Commuters | % Commuters |
| Less than 5 Minutes | 11 | 4.8% |
| 5 to 9 Minutes | 28 | 12.2% |
| 10 to 14 Minutes | 14 | 6.1% |
| 15 to 19 Minutes | 0 | 0.0% |
| 20 to 24 Minutes | 45 | 19.7% |
| 25 to 29 Minutes | 17 | 7.4% |
| 30 to 34 Minutes | 46 | 20.1% |
| 35 to 39 Minutes | 11 | 4.8% |
| 40 to 44 Minutes | 30 | 13.1% |
| 45 to 59 Minutes | 0 | 0.0% |
| 60 to 89 Minutes | 27 | 11.8% |
| 90 or more Minutes | 0 | 0.0% |
Commute Time by Sex in Thunderbird Bay
The most common commute times in Thunderbird Bay are 20 to 24 minutes (30 commuters, 18.4%) for males and 5 to 9 minutes (23 commuters, 34.8%) for females.
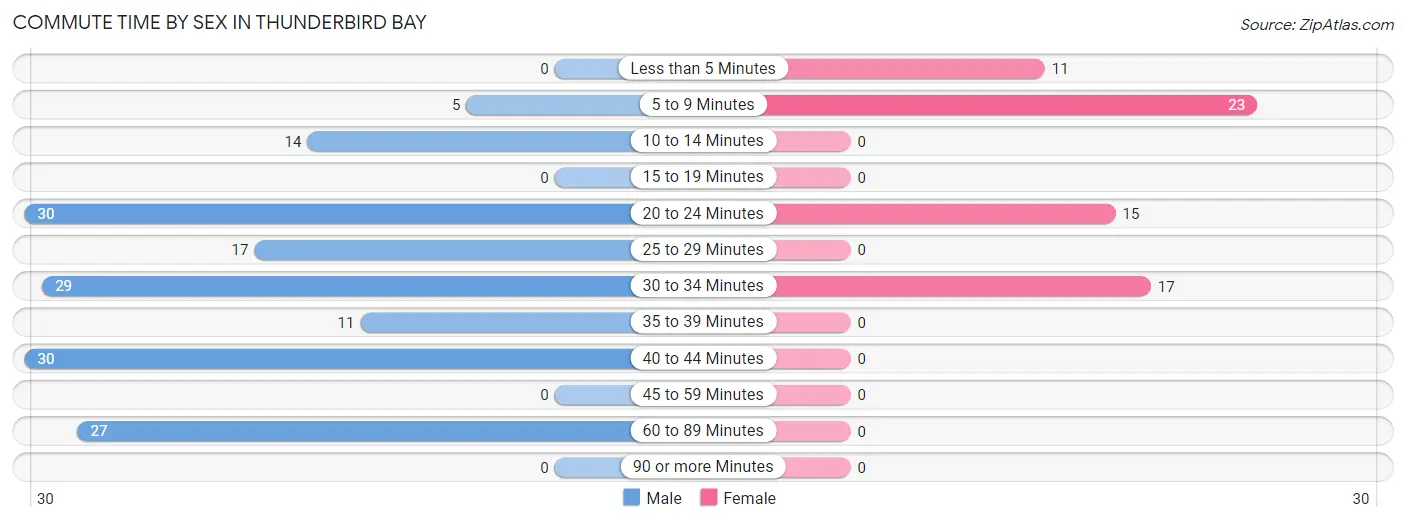
| Commute Time | Male | Female |
| Less than 5 Minutes | 0 (0.0%) | 11 (16.7%) |
| 5 to 9 Minutes | 5 (3.1%) | 23 (34.8%) |
| 10 to 14 Minutes | 14 (8.6%) | 0 (0.0%) |
| 15 to 19 Minutes | 0 (0.0%) | 0 (0.0%) |
| 20 to 24 Minutes | 30 (18.4%) | 15 (22.7%) |
| 25 to 29 Minutes | 17 (10.4%) | 0 (0.0%) |
| 30 to 34 Minutes | 29 (17.8%) | 17 (25.8%) |
| 35 to 39 Minutes | 11 (6.8%) | 0 (0.0%) |
| 40 to 44 Minutes | 30 (18.4%) | 0 (0.0%) |
| 45 to 59 Minutes | 0 (0.0%) | 0 (0.0%) |
| 60 to 89 Minutes | 27 (16.6%) | 0 (0.0%) |
| 90 or more Minutes | 0 (0.0%) | 0 (0.0%) |
Time of Departure to Work by Sex in Thunderbird Bay
The most frequent times of departure to work in Thunderbird Bay are 5:30 AM to 5:59 AM (30, 18.4%) for males and 7:30 AM to 7:59 AM (15, 22.7%) for females.
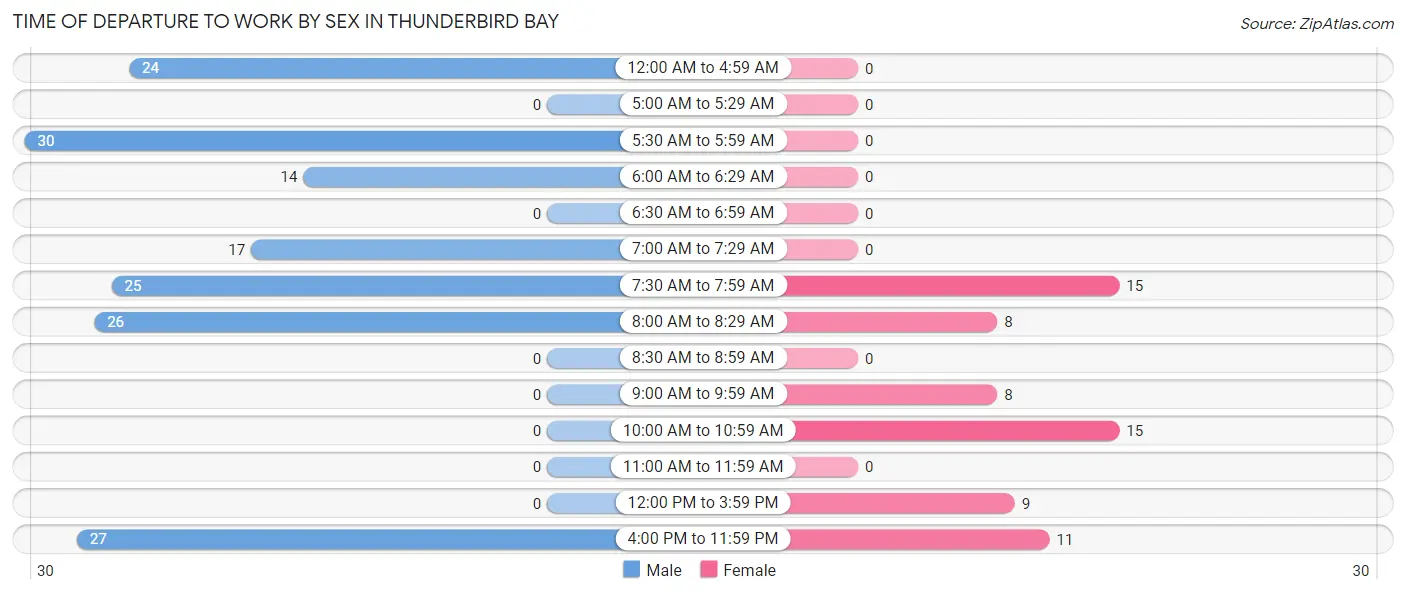
| Time of Departure | Male | Female |
| 12:00 AM to 4:59 AM | 24 (14.7%) | 0 (0.0%) |
| 5:00 AM to 5:29 AM | 0 (0.0%) | 0 (0.0%) |
| 5:30 AM to 5:59 AM | 30 (18.4%) | 0 (0.0%) |
| 6:00 AM to 6:29 AM | 14 (8.6%) | 0 (0.0%) |
| 6:30 AM to 6:59 AM | 0 (0.0%) | 0 (0.0%) |
| 7:00 AM to 7:29 AM | 17 (10.4%) | 0 (0.0%) |
| 7:30 AM to 7:59 AM | 25 (15.3%) | 15 (22.7%) |
| 8:00 AM to 8:29 AM | 26 (16.0%) | 8 (12.1%) |
| 8:30 AM to 8:59 AM | 0 (0.0%) | 0 (0.0%) |
| 9:00 AM to 9:59 AM | 0 (0.0%) | 8 (12.1%) |
| 10:00 AM to 10:59 AM | 0 (0.0%) | 15 (22.7%) |
| 11:00 AM to 11:59 AM | 0 (0.0%) | 0 (0.0%) |
| 12:00 PM to 3:59 PM | 0 (0.0%) | 9 (13.6%) |
| 4:00 PM to 11:59 PM | 27 (16.6%) | 11 (16.7%) |
| Total | 163 (100.0%) | 66 (100.0%) |
Housing Occupancy in Thunderbird Bay
Occupancy by Ownership in Thunderbird Bay
Of the total 442 dwellings in Thunderbird Bay, owner-occupied units account for 300 (67.9%), while renter-occupied units make up 142 (32.1%).
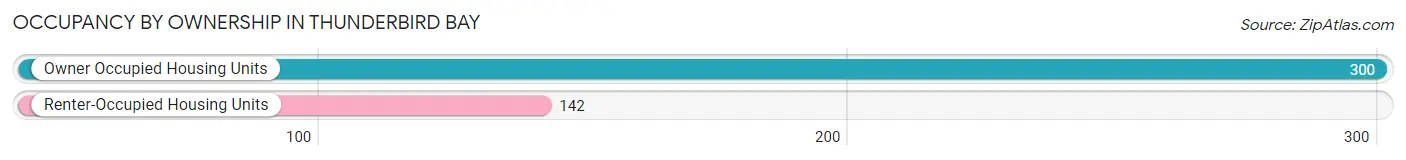
| Occupancy | # Housing Units | % Housing Units |
| Owner Occupied Housing Units | 300 | 67.9% |
| Renter-Occupied Housing Units | 142 | 32.1% |
| Total Occupied Housing Units | 442 | 100.0% |
Occupancy by Household Size in Thunderbird Bay
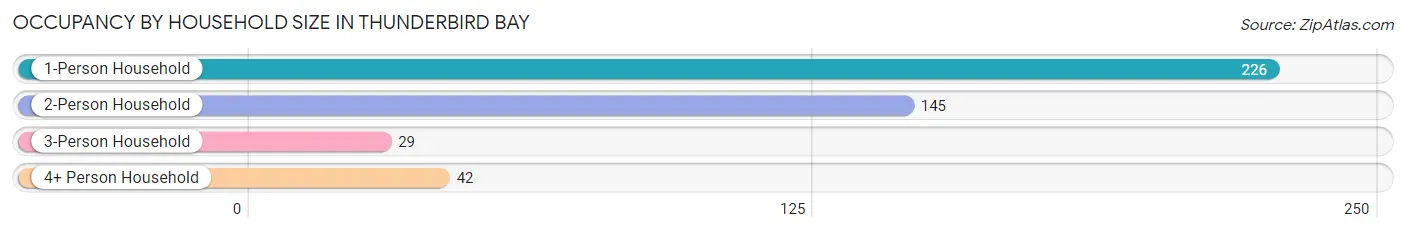
| Household Size | # Housing Units | % Housing Units |
| 1-Person Household | 226 | 51.1% |
| 2-Person Household | 145 | 32.8% |
| 3-Person Household | 29 | 6.6% |
| 4+ Person Household | 42 | 9.5% |
| Total Housing Units | 442 | 100.0% |
Occupancy by Ownership by Household Size in Thunderbird Bay
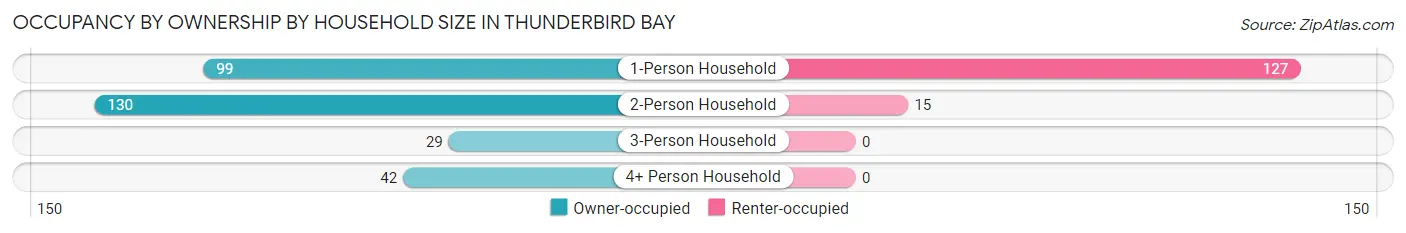
| Household Size | Owner-occupied | Renter-occupied |
| 1-Person Household | 99 (43.8%) | 127 (56.2%) |
| 2-Person Household | 130 (89.7%) | 15 (10.3%) |
| 3-Person Household | 29 (100.0%) | 0 (0.0%) |
| 4+ Person Household | 42 (100.0%) | 0 (0.0%) |
| Total Housing Units | 300 (67.9%) | 142 (32.1%) |
Occupancy by Educational Attainment in Thunderbird Bay
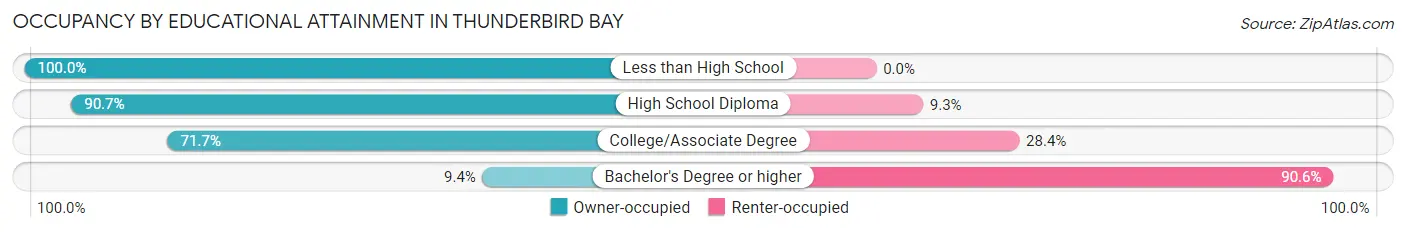
| Household Size | Owner-occupied | Renter-occupied |
| Less than High School | 9 (100.0%) | 0 (0.0%) |
| High School Diploma | 98 (90.7%) | 10 (9.3%) |
| College/Associate Degree | 187 (71.7%) | 74 (28.3%) |
| Bachelor's Degree or higher | 6 (9.4%) | 58 (90.6%) |
Occupancy by Age of Householder in Thunderbird Bay
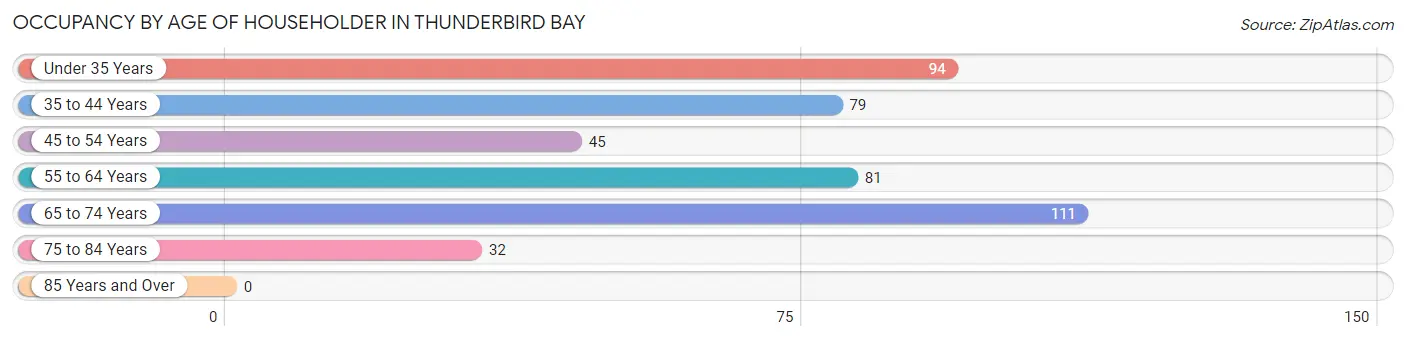
| Age Bracket | # Households | % Households |
| Under 35 Years | 94 | 21.3% |
| 35 to 44 Years | 79 | 17.9% |
| 45 to 54 Years | 45 | 10.2% |
| 55 to 64 Years | 81 | 18.3% |
| 65 to 74 Years | 111 | 25.1% |
| 75 to 84 Years | 32 | 7.2% |
| 85 Years and Over | 0 | 0.0% |
| Total | 442 | 100.0% |
Housing Finances in Thunderbird Bay
Median Income by Occupancy in Thunderbird Bay
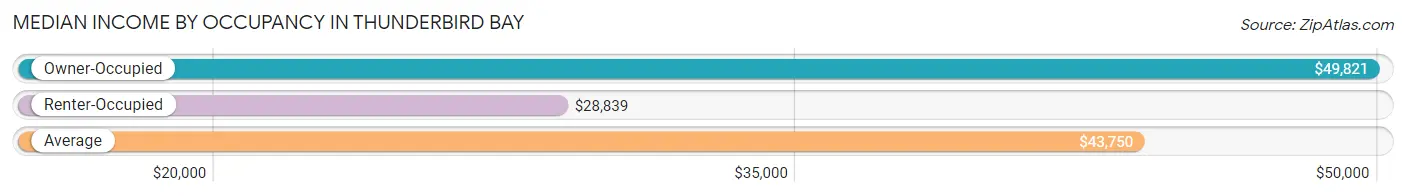
| Occupancy Type | # Households | Median Income |
| Owner-Occupied | 300 (67.9%) | $49,821 |
| Renter-Occupied | 142 (32.1%) | $28,839 |
| Average | 442 (100.0%) | $43,750 |
Occupancy by Householder Income Bracket in Thunderbird Bay
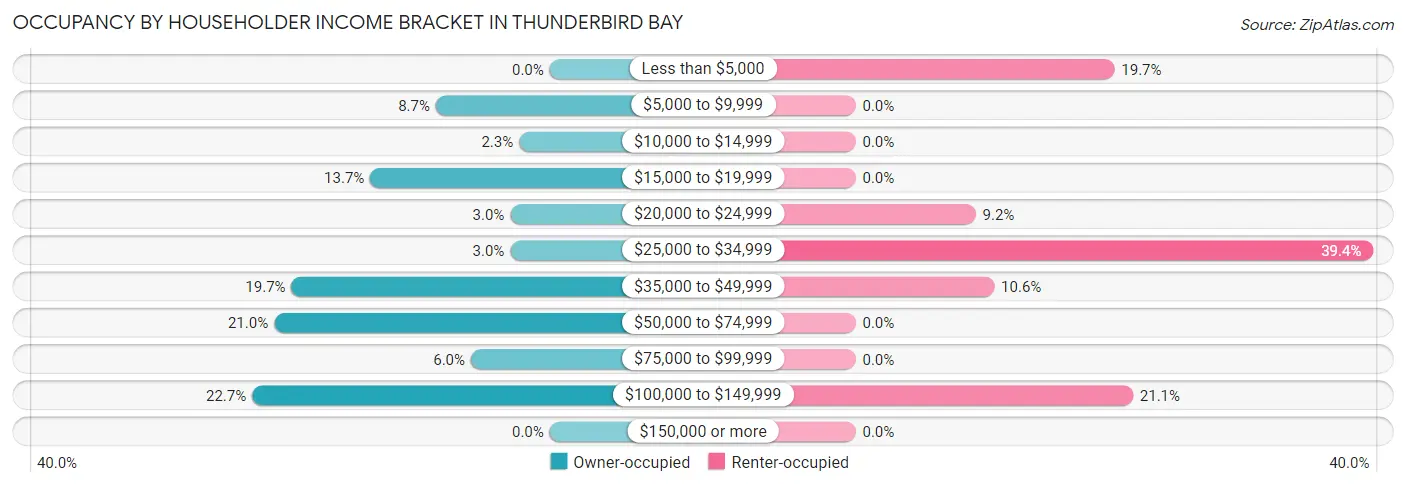
| Income Bracket | Owner-occupied | Renter-occupied |
| Less than $5,000 | 0 (0.0%) | 28 (19.7%) |
| $5,000 to $9,999 | 26 (8.7%) | 0 (0.0%) |
| $10,000 to $14,999 | 7 (2.3%) | 0 (0.0%) |
| $15,000 to $19,999 | 41 (13.7%) | 0 (0.0%) |
| $20,000 to $24,999 | 9 (3.0%) | 13 (9.1%) |
| $25,000 to $34,999 | 9 (3.0%) | 56 (39.4%) |
| $35,000 to $49,999 | 59 (19.7%) | 15 (10.6%) |
| $50,000 to $74,999 | 63 (21.0%) | 0 (0.0%) |
| $75,000 to $99,999 | 18 (6.0%) | 0 (0.0%) |
| $100,000 to $149,999 | 68 (22.7%) | 30 (21.1%) |
| $150,000 or more | 0 (0.0%) | 0 (0.0%) |
| Total | 300 (100.0%) | 142 (100.0%) |
Monthly Housing Cost Tiers in Thunderbird Bay
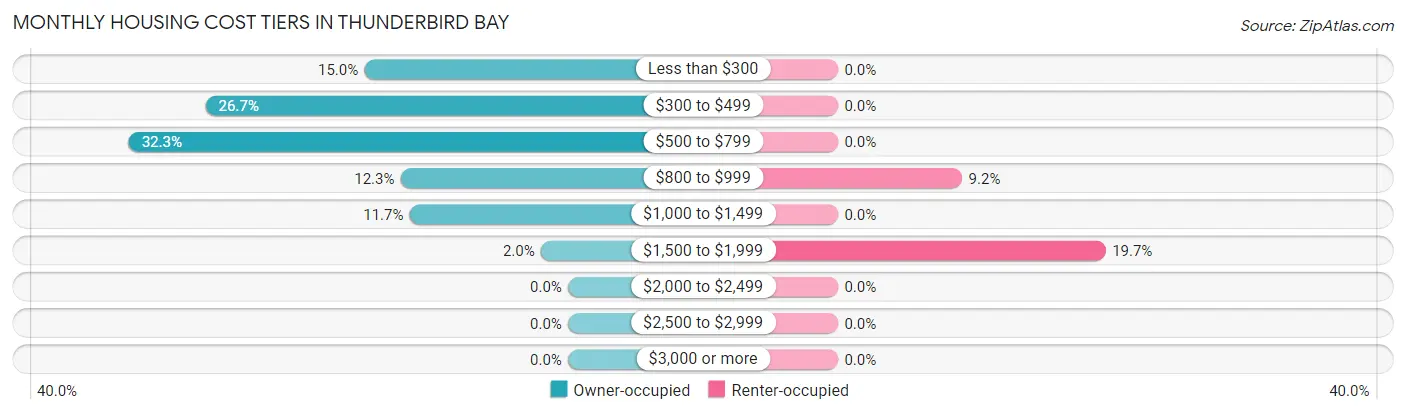
| Monthly Cost | Owner-occupied | Renter-occupied |
| Less than $300 | 45 (15.0%) | 0 (0.0%) |
| $300 to $499 | 80 (26.7%) | 0 (0.0%) |
| $500 to $799 | 97 (32.3%) | 0 (0.0%) |
| $800 to $999 | 37 (12.3%) | 13 (9.1%) |
| $1,000 to $1,499 | 35 (11.7%) | 0 (0.0%) |
| $1,500 to $1,999 | 6 (2.0%) | 28 (19.7%) |
| $2,000 to $2,499 | 0 (0.0%) | 0 (0.0%) |
| $2,500 to $2,999 | 0 (0.0%) | 0 (0.0%) |
| $3,000 or more | 0 (0.0%) | 0 (0.0%) |
| Total | 300 (100.0%) | 142 (100.0%) |
Physical Housing Characteristics in Thunderbird Bay
Housing Structures in Thunderbird Bay
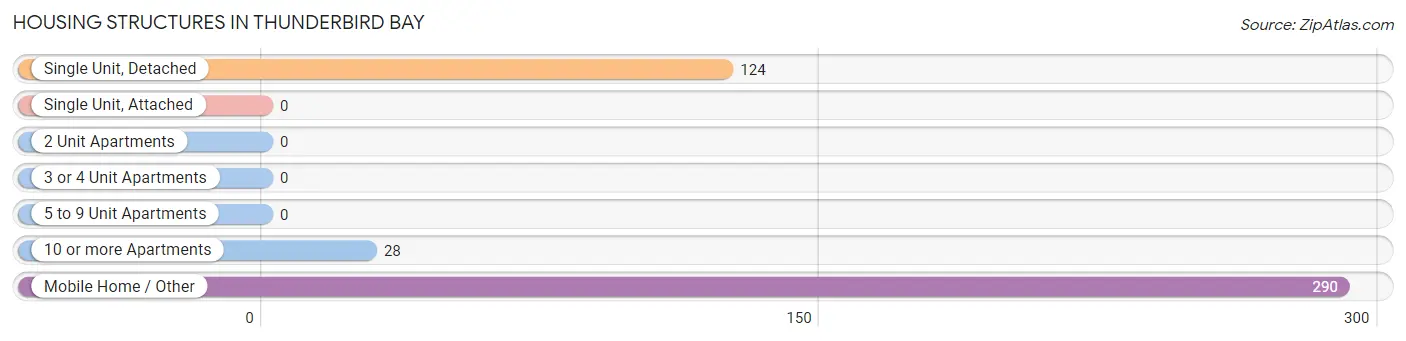
| Structure Type | # Housing Units | % Housing Units |
| Single Unit, Detached | 124 | 28.1% |
| Single Unit, Attached | 0 | 0.0% |
| 2 Unit Apartments | 0 | 0.0% |
| 3 or 4 Unit Apartments | 0 | 0.0% |
| 5 to 9 Unit Apartments | 0 | 0.0% |
| 10 or more Apartments | 28 | 6.3% |
| Mobile Home / Other | 290 | 65.6% |
| Total | 442 | 100.0% |
Housing Structures by Occupancy in Thunderbird Bay
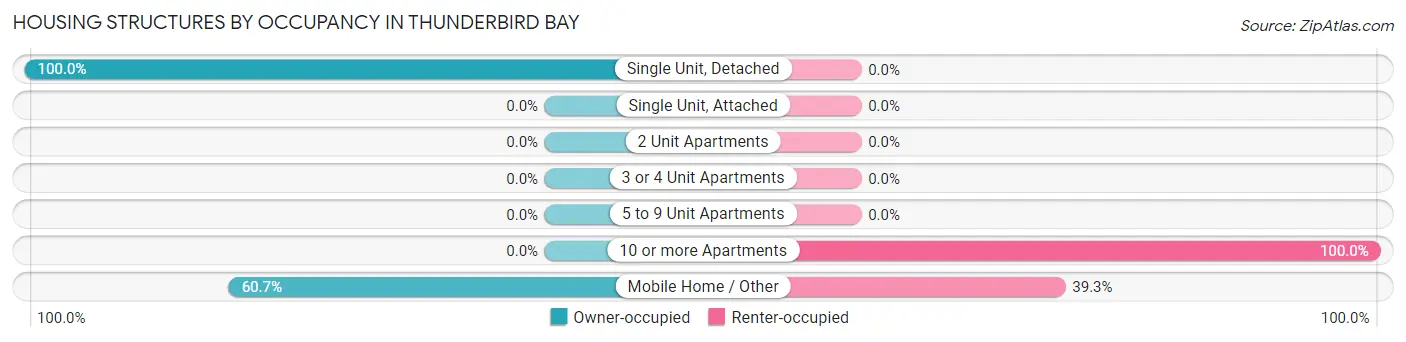
| Structure Type | Owner-occupied | Renter-occupied |
| Single Unit, Detached | 124 (100.0%) | 0 (0.0%) |
| Single Unit, Attached | 0 (0.0%) | 0 (0.0%) |
| 2 Unit Apartments | 0 (0.0%) | 0 (0.0%) |
| 3 or 4 Unit Apartments | 0 (0.0%) | 0 (0.0%) |
| 5 to 9 Unit Apartments | 0 (0.0%) | 0 (0.0%) |
| 10 or more Apartments | 0 (0.0%) | 28 (100.0%) |
| Mobile Home / Other | 176 (60.7%) | 114 (39.3%) |
| Total | 300 (67.9%) | 142 (32.1%) |
Housing Structures by Number of Rooms in Thunderbird Bay
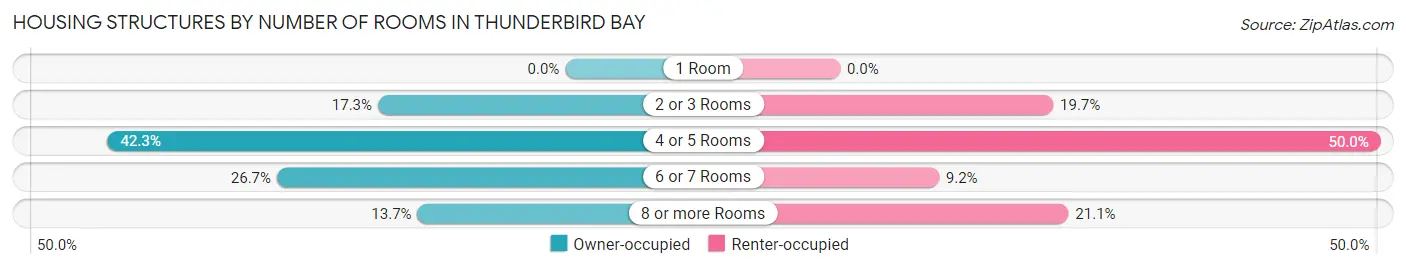
| Number of Rooms | Owner-occupied | Renter-occupied |
| 1 Room | 0 (0.0%) | 0 (0.0%) |
| 2 or 3 Rooms | 52 (17.3%) | 28 (19.7%) |
| 4 or 5 Rooms | 127 (42.3%) | 71 (50.0%) |
| 6 or 7 Rooms | 80 (26.7%) | 13 (9.1%) |
| 8 or more Rooms | 41 (13.7%) | 30 (21.1%) |
| Total | 300 (100.0%) | 142 (100.0%) |
Housing Structure by Heating Type in Thunderbird Bay
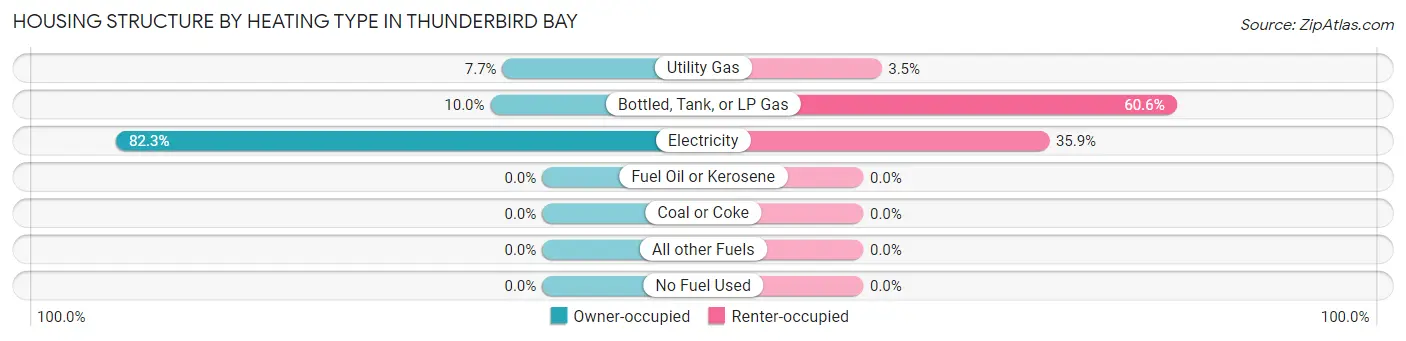
| Heating Type | Owner-occupied | Renter-occupied |
| Utility Gas | 23 (7.7%) | 5 (3.5%) |
| Bottled, Tank, or LP Gas | 30 (10.0%) | 86 (60.6%) |
| Electricity | 247 (82.3%) | 51 (35.9%) |
| Fuel Oil or Kerosene | 0 (0.0%) | 0 (0.0%) |
| Coal or Coke | 0 (0.0%) | 0 (0.0%) |
| All other Fuels | 0 (0.0%) | 0 (0.0%) |
| No Fuel Used | 0 (0.0%) | 0 (0.0%) |
| Total | 300 (100.0%) | 142 (100.0%) |
Household Vehicle Usage in Thunderbird Bay
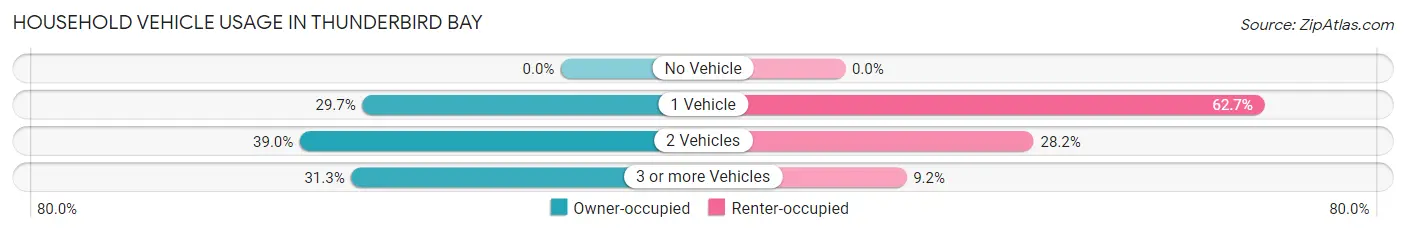
| Vehicles per Household | Owner-occupied | Renter-occupied |
| No Vehicle | 0 (0.0%) | 0 (0.0%) |
| 1 Vehicle | 89 (29.7%) | 89 (62.7%) |
| 2 Vehicles | 117 (39.0%) | 40 (28.2%) |
| 3 or more Vehicles | 94 (31.3%) | 13 (9.1%) |
| Total | 300 (100.0%) | 142 (100.0%) |
Real Estate & Mortgages in Thunderbird Bay
Real Estate and Mortgage Overview in Thunderbird Bay
| Characteristic | Without Mortgage | With Mortgage |
| Housing Units | 186 | 114 |
| Median Property Value | $80,500 | $0 |
| Median Household Income | $46,786 | $0 |
| Monthly Housing Costs | $406 | $0 |
| Real Estate Taxes | $900 | $0 |
Property Value by Mortgage Status in Thunderbird Bay
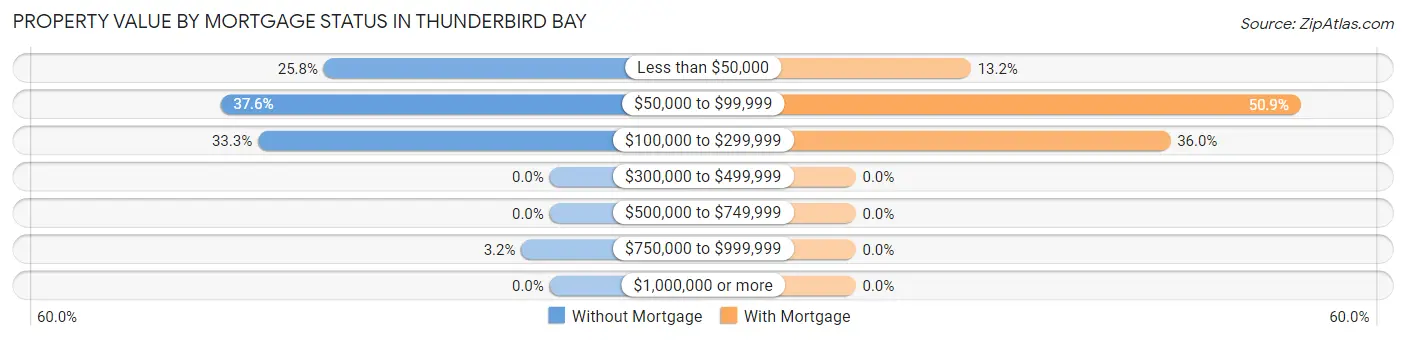
| Property Value | Without Mortgage | With Mortgage |
| Less than $50,000 | 48 (25.8%) | 15 (13.2%) |
| $50,000 to $99,999 | 70 (37.6%) | 58 (50.9%) |
| $100,000 to $299,999 | 62 (33.3%) | 41 (36.0%) |
| $300,000 to $499,999 | 0 (0.0%) | 0 (0.0%) |
| $500,000 to $749,999 | 0 (0.0%) | 0 (0.0%) |
| $750,000 to $999,999 | 6 (3.2%) | 0 (0.0%) |
| $1,000,000 or more | 0 (0.0%) | 0 (0.0%) |
| Total | 186 (100.0%) | 114 (100.0%) |
Household Income by Mortgage Status in Thunderbird Bay
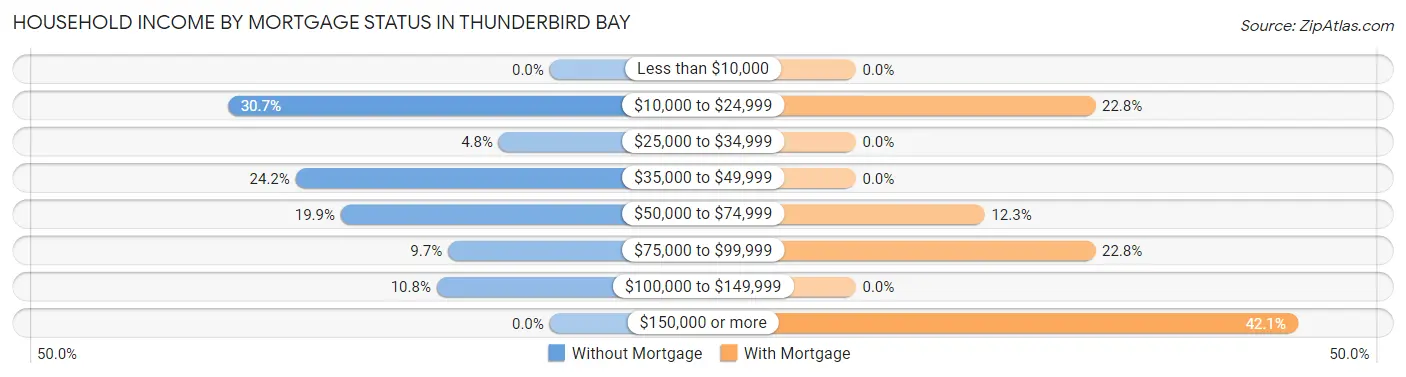
| Household Income | Without Mortgage | With Mortgage |
| Less than $10,000 | 0 (0.0%) | 0 (0.0%) |
| $10,000 to $24,999 | 57 (30.6%) | 26 (22.8%) |
| $25,000 to $34,999 | 9 (4.8%) | 0 (0.0%) |
| $35,000 to $49,999 | 45 (24.2%) | 0 (0.0%) |
| $50,000 to $74,999 | 37 (19.9%) | 14 (12.3%) |
| $75,000 to $99,999 | 18 (9.7%) | 26 (22.8%) |
| $100,000 to $149,999 | 20 (10.7%) | 0 (0.0%) |
| $150,000 or more | 0 (0.0%) | 48 (42.1%) |
| Total | 186 (100.0%) | 114 (100.0%) |
Property Value to Household Income Ratio in Thunderbird Bay
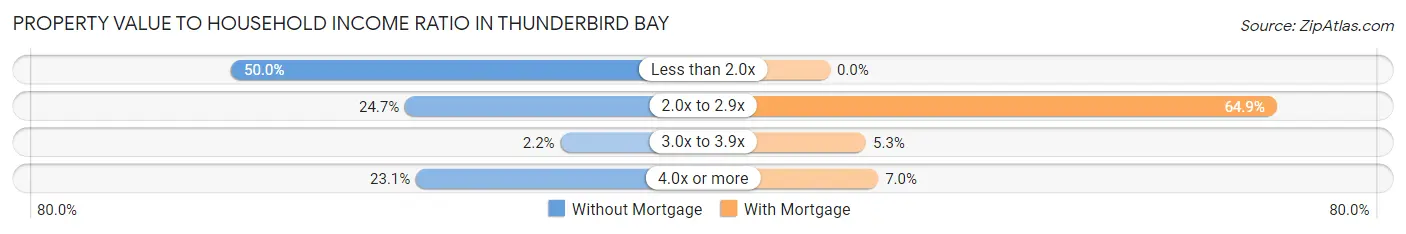
| Value-to-Income Ratio | Without Mortgage | With Mortgage |
| Less than 2.0x | 93 (50.0%) | 0 (0.0%) |
| 2.0x to 2.9x | 46 (24.7%) | 74 (64.9%) |
| 3.0x to 3.9x | 4 (2.1%) | 6 (5.3%) |
| 4.0x or more | 43 (23.1%) | 8 (7.0%) |
| Total | 186 (100.0%) | 114 (100.0%) |
Real Estate Taxes by Mortgage Status in Thunderbird Bay
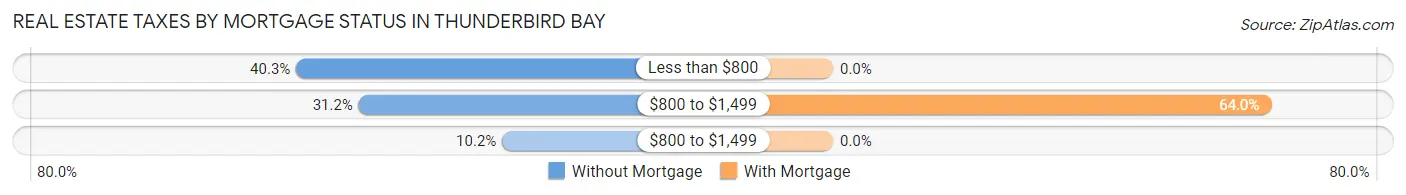
| Property Taxes | Without Mortgage | With Mortgage |
| Less than $800 | 75 (40.3%) | 0 (0.0%) |
| $800 to $1,499 | 58 (31.2%) | 73 (64.0%) |
| $800 to $1,499 | 19 (10.2%) | 0 (0.0%) |
| Total | 186 (100.0%) | 114 (100.0%) |
Health & Disability in Thunderbird Bay
Health Insurance Coverage by Age in Thunderbird Bay
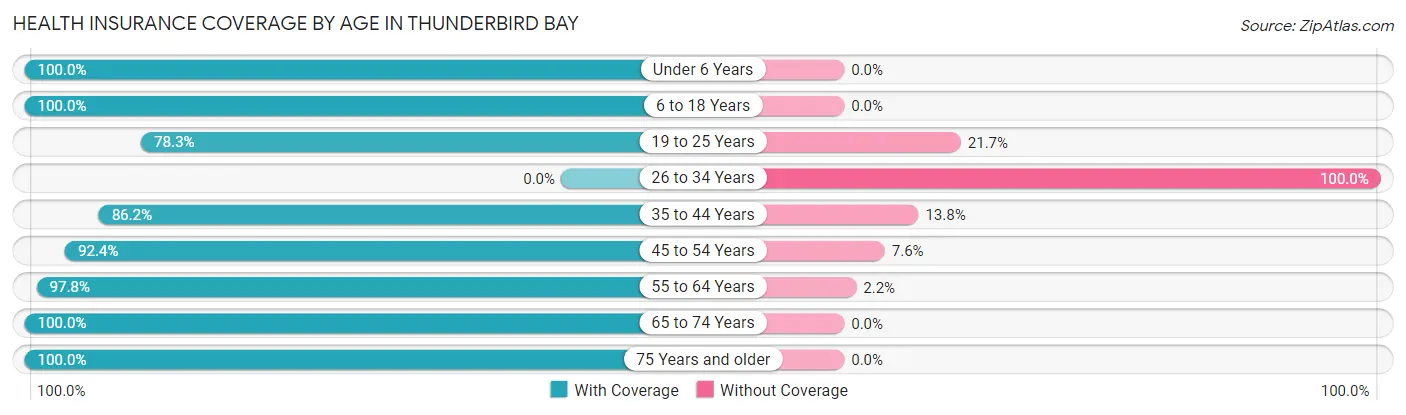
| Age Bracket | With Coverage | Without Coverage |
| Under 6 Years | 6 (100.0%) | 0 (0.0%) |
| 6 to 18 Years | 99 (100.0%) | 0 (0.0%) |
| 19 to 25 Years | 36 (78.3%) | 10 (21.7%) |
| 26 to 34 Years | 0 (0.0%) | 65 (100.0%) |
| 35 to 44 Years | 81 (86.2%) | 13 (13.8%) |
| 45 to 54 Years | 110 (92.4%) | 9 (7.6%) |
| 55 to 64 Years | 131 (97.8%) | 3 (2.2%) |
| 65 to 74 Years | 148 (100.0%) | 0 (0.0%) |
| 75 Years and older | 55 (100.0%) | 0 (0.0%) |
| Total | 666 (87.0%) | 100 (13.1%) |
Health Insurance Coverage by Citizenship Status in Thunderbird Bay
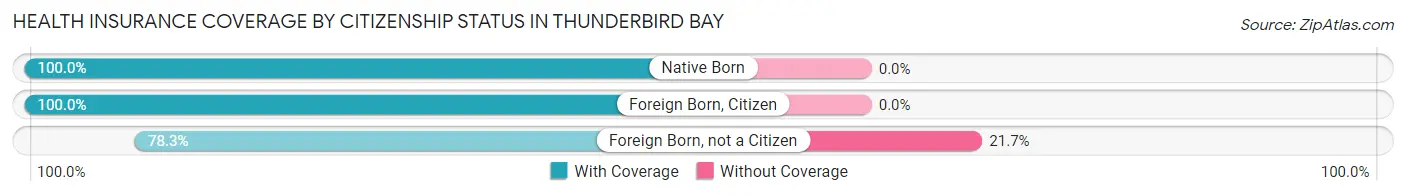
| Citizenship Status | With Coverage | Without Coverage |
| Native Born | 6 (100.0%) | 0 (0.0%) |
| Foreign Born, Citizen | 99 (100.0%) | 0 (0.0%) |
| Foreign Born, not a Citizen | 36 (78.3%) | 10 (21.7%) |
Health Insurance Coverage by Household Income in Thunderbird Bay
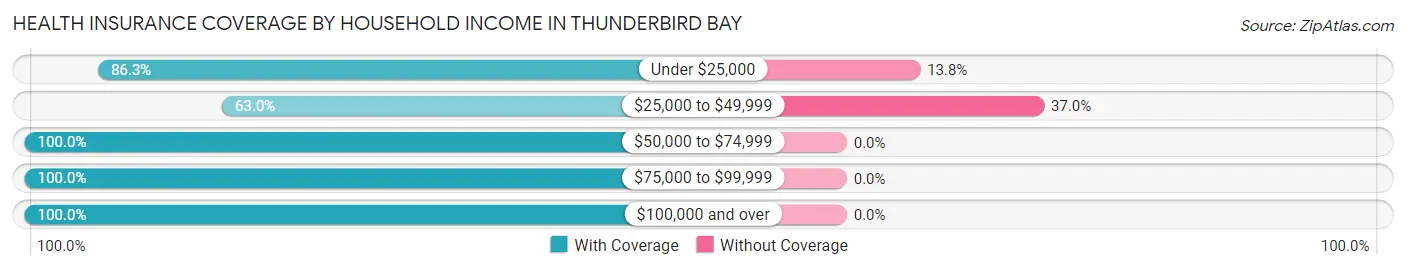
| Household Income | With Coverage | Without Coverage |
| Under $25,000 | 138 (86.3%) | 22 (13.8%) |
| $25,000 to $49,999 | 133 (63.0%) | 78 (37.0%) |
| $50,000 to $74,999 | 136 (100.0%) | 0 (0.0%) |
| $75,000 to $99,999 | 39 (100.0%) | 0 (0.0%) |
| $100,000 and over | 220 (100.0%) | 0 (0.0%) |
Public vs Private Health Insurance Coverage by Age in Thunderbird Bay
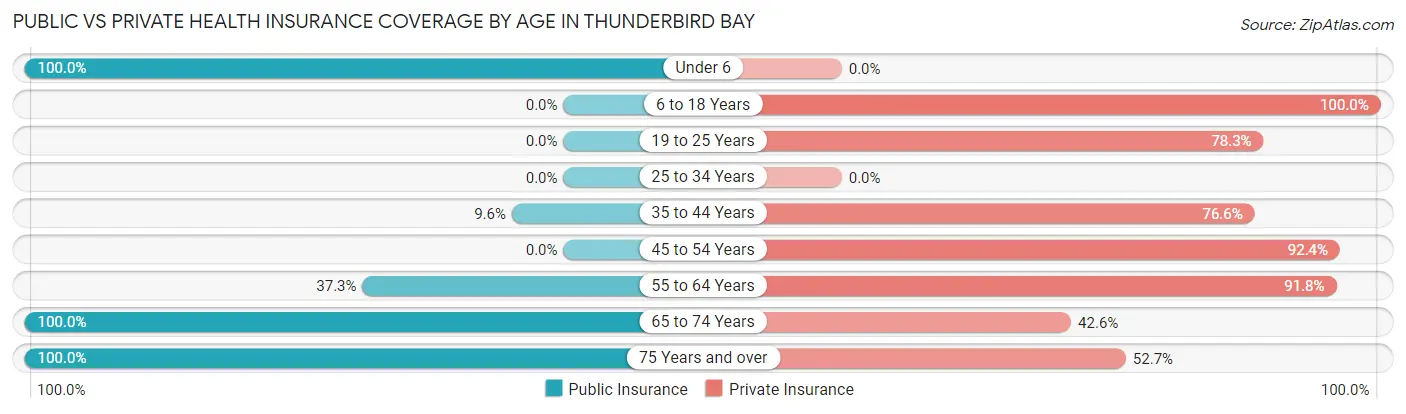
| Age Bracket | Public Insurance | Private Insurance |
| Under 6 | 6 (100.0%) | 0 (0.0%) |
| 6 to 18 Years | 0 (0.0%) | 99 (100.0%) |
| 19 to 25 Years | 0 (0.0%) | 36 (78.3%) |
| 25 to 34 Years | 0 (0.0%) | 0 (0.0%) |
| 35 to 44 Years | 9 (9.6%) | 72 (76.6%) |
| 45 to 54 Years | 0 (0.0%) | 110 (92.4%) |
| 55 to 64 Years | 50 (37.3%) | 123 (91.8%) |
| 65 to 74 Years | 148 (100.0%) | 63 (42.6%) |
| 75 Years and over | 55 (100.0%) | 29 (52.7%) |
| Total | 268 (35.0%) | 532 (69.5%) |
Disability Status by Sex by Age in Thunderbird Bay
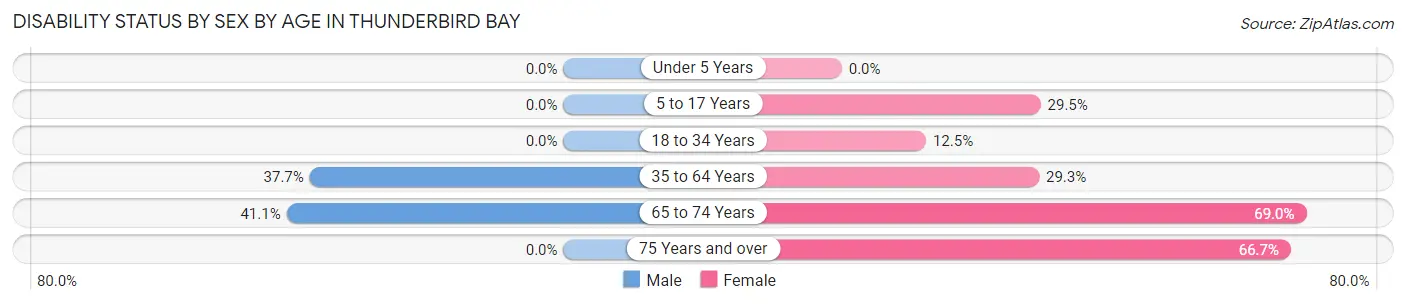
| Age Bracket | Male | Female |
| Under 5 Years | 0 (0.0%) | 0 (0.0%) |
| 5 to 17 Years | 0 (0.0%) | 31 (29.5%) |
| 18 to 34 Years | 0 (0.0%) | 8 (12.5%) |
| 35 to 64 Years | 78 (37.7%) | 41 (29.3%) |
| 65 to 74 Years | 37 (41.1%) | 40 (69.0%) |
| 75 Years and over | 0 (0.0%) | 14 (66.7%) |
Disability Class by Sex by Age in Thunderbird Bay
Disability Class: Hearing Difficulty
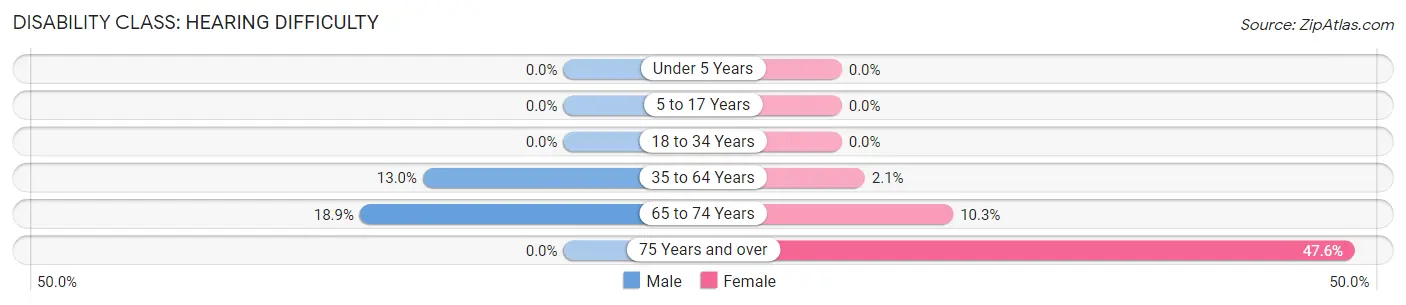
| Age Bracket | Male | Female |
| Under 5 Years | 0 (0.0%) | 0 (0.0%) |
| 5 to 17 Years | 0 (0.0%) | 0 (0.0%) |
| 18 to 34 Years | 0 (0.0%) | 0 (0.0%) |
| 35 to 64 Years | 27 (13.0%) | 3 (2.1%) |
| 65 to 74 Years | 17 (18.9%) | 6 (10.3%) |
| 75 Years and over | 0 (0.0%) | 10 (47.6%) |
Disability Class: Vision Difficulty
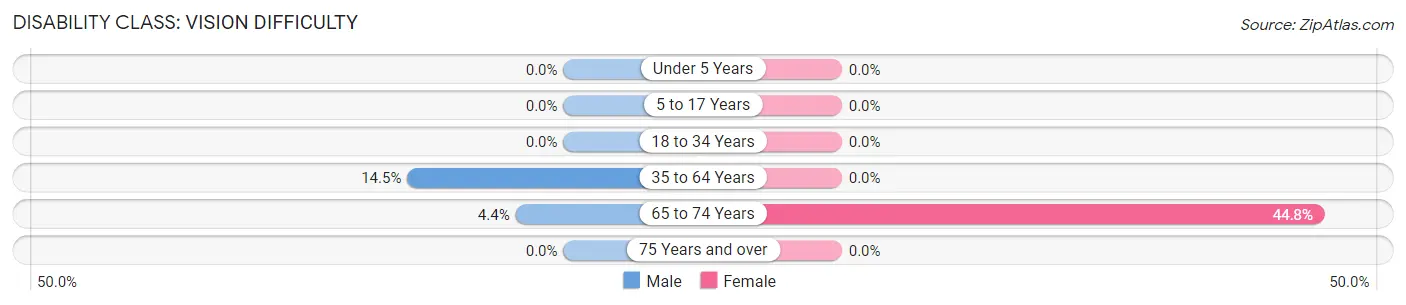
| Age Bracket | Male | Female |
| Under 5 Years | 0 (0.0%) | 0 (0.0%) |
| 5 to 17 Years | 0 (0.0%) | 0 (0.0%) |
| 18 to 34 Years | 0 (0.0%) | 0 (0.0%) |
| 35 to 64 Years | 30 (14.5%) | 0 (0.0%) |
| 65 to 74 Years | 4 (4.4%) | 26 (44.8%) |
| 75 Years and over | 0 (0.0%) | 0 (0.0%) |
Disability Class: Cognitive Difficulty
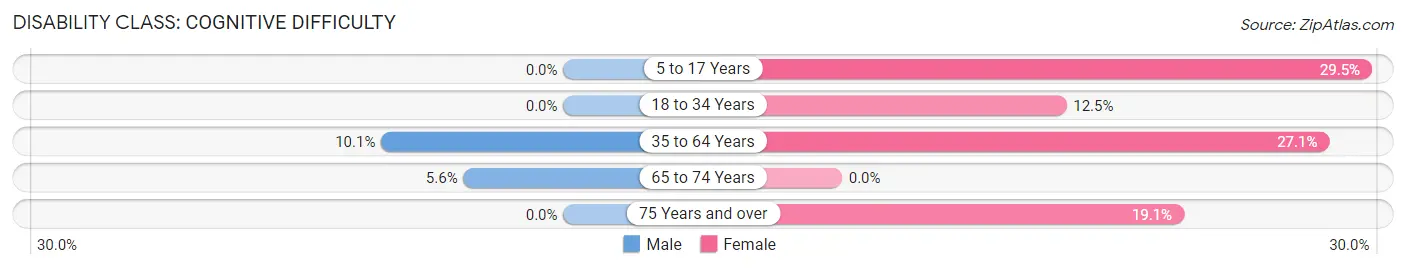
| Age Bracket | Male | Female |
| 5 to 17 Years | 0 (0.0%) | 31 (29.5%) |
| 18 to 34 Years | 0 (0.0%) | 8 (12.5%) |
| 35 to 64 Years | 21 (10.1%) | 38 (27.1%) |
| 65 to 74 Years | 5 (5.6%) | 0 (0.0%) |
| 75 Years and over | 0 (0.0%) | 4 (19.1%) |
Disability Class: Ambulatory Difficulty
| Age Bracket | Male | Female |
| 5 to 17 Years | 0 (0.0%) | 0 (0.0%) |
| 18 to 34 Years | 0 (0.0%) | 0 (0.0%) |
| 35 to 64 Years | 6 (2.9%) | 3 (2.1%) |
| 65 to 74 Years | 27 (30.0%) | 40 (69.0%) |
| 75 Years and over | 0 (0.0%) | 10 (47.6%) |
Disability Class: Self-Care Difficulty
| Age Bracket | Male | Female |
| 5 to 17 Years | 0 (0.0%) | 0 (0.0%) |
| 18 to 34 Years | 0 (0.0%) | 0 (0.0%) |
| 35 to 64 Years | 6 (2.9%) | 0 (0.0%) |
| 65 to 74 Years | 0 (0.0%) | 30 (51.7%) |
| 75 Years and over | 0 (0.0%) | 0 (0.0%) |
Technology Access in Thunderbird Bay
Computing Device Access in Thunderbird Bay
| Device Type | # Households | % Households |
| Desktop or Laptop | 302 | 68.3% |
| Smartphone | 431 | 97.5% |
| Tablet | 194 | 43.9% |
| No Computing Device | 7 | 1.6% |
| Total | 442 | 100.0% |
Internet Access in Thunderbird Bay
| Internet Type | # Households | % Households |
| Dial-Up Internet | 0 | 0.0% |
| Broadband Home | 97 | 22.0% |
| Cellular Data Only | 110 | 24.9% |
| Satellite Internet | 203 | 45.9% |
| No Internet | 21 | 4.8% |
| Total | 442 | 100.0% |
Thunderbird Bay Summary
Thunderbird Bay is a small town located in the state of Texas, United States. It is situated on the Gulf of Mexico, just south of Galveston. The town is known for its beautiful beaches, fishing, and recreational activities.
History
The area that is now Thunderbird Bay was first settled in the late 1800s by a group of fishermen from the nearby town of Galveston. The fishermen were attracted to the area due to its abundance of fish and other marine life. The town was officially established in 1891 and was named after the thunderbird, a mythical creature that was believed to bring good luck.
The town grew slowly over the years, but it was not until the 1950s that it began to experience a period of rapid growth. This was due to the development of the nearby port of Galveston, which brought in a large number of tourists and businesses. The town also benefited from the construction of a bridge connecting it to the mainland.
Geography
Thunderbird Bay is located on the Gulf of Mexico, just south of Galveston. The town is situated on a peninsula, with the Gulf of Mexico to the east and the Intracoastal Waterway to the west. The town is surrounded by a number of small islands, including Mustang Island, San Jose Island, and Padre Island.
The town has a humid subtropical climate, with hot summers and mild winters. The average temperature in the summer is around 80 degrees Fahrenheit, while in the winter it is around 60 degrees Fahrenheit. The town receives an average of 40 inches of rain per year.
Economy
The economy of Thunderbird Bay is largely based on tourism and fishing. The town is home to a number of hotels, restaurants, and other businesses that cater to tourists. The town also has a number of marinas and boat docks, which attract a large number of recreational boaters.
The town is also home to a number of commercial fishing operations, which provide a significant portion of the town’s income. The town is also home to a number of seafood processing plants, which process the catch from the local fishing boats.
Demographics
As of the 2010 census, the population of Thunderbird Bay was 2,845. The town has a median age of 44.7 years, with a gender ratio of 51.2% female and 48.8% male. The town is predominantly white, with a population that is 94.2% white, 2.2% Hispanic, 1.2% African American, and 2.4% other.
The median household income in Thunderbird Bay is $45,945, and the median home value is $179,400. The town has a poverty rate of 11.2%, which is slightly higher than the national average.
Conclusion
Thunderbird Bay is a small town located in the state of Texas, United States. It is situated on the Gulf of Mexico, just south of Galveston. The town is known for its beautiful beaches, fishing, and recreational activities. The economy of Thunderbird Bay is largely based on tourism and fishing, and the town has a population of 2,845 as of the 2010 census. The town has a median age of 44.7 years, with a gender ratio of 51.2% female and 48.8% male. The town is predominantly white, with a population that is 94.2% white, 2.2% Hispanic, 1.2% African American, and 2.4% other. The median household income in Thunderbird Bay is $45,945, and the median home value is $179,400.
Common Questions
What is the Total Population of Thunderbird Bay?
Total Population of Thunderbird Bay is 766.
What is the Total Male Population of Thunderbird Bay?
Total Male Population of Thunderbird Bay is 378.
What is the Total Female Population of Thunderbird Bay?
Total Female Population of Thunderbird Bay is 388.
What is the Ratio of Males per 100 Females in Thunderbird Bay?
There are 97.42 Males per 100 Females in Thunderbird Bay.
What is the Ratio of Females per 100 Males in Thunderbird Bay?
There are 102.65 Females per 100 Males in Thunderbird Bay.
What is the Median Population Age in Thunderbird Bay?
Median Population Age in Thunderbird Bay is 49.4 Years.
What is the Average Family Size in Thunderbird Bay
Average Family Size in Thunderbird Bay is 2.5 People.
What is the Average Household Size in Thunderbird Bay
Average Household Size in Thunderbird Bay is 1.7 People.
What is Per Capita Income in Thunderbird Bay?
Per Capita income in Thunderbird Bay is $31,863.
What is the Median Family Income in Thunderbird Bay?
Median Family Income in Thunderbird Bay is $52,417.
What is the Median Household income in Thunderbird Bay?
Median Household Income in Thunderbird Bay is $43,750.
What is Income or Wage Gap in Thunderbird Bay?
Income or Wage Gap in Thunderbird Bay is 53.4%.
Women in Thunderbird Bay earn 46.6 cents for every dollar earned by a man.
What is Inequality or Gini Index in Thunderbird Bay?
Inequality or Gini Index in Thunderbird Bay is 0.43.
How Large is the Labor Force in Thunderbird Bay?
There are 343 People in the Labor Forcein in Thunderbird Bay.
What is the Percentage of People in the Labor Force in Thunderbird Bay?
51.9% of People are in the Labor Force in Thunderbird Bay.
What is the Unemployment Rate in Thunderbird Bay?
Unemployment Rate in Thunderbird Bay is 14.6%.