Indian Hills, TX
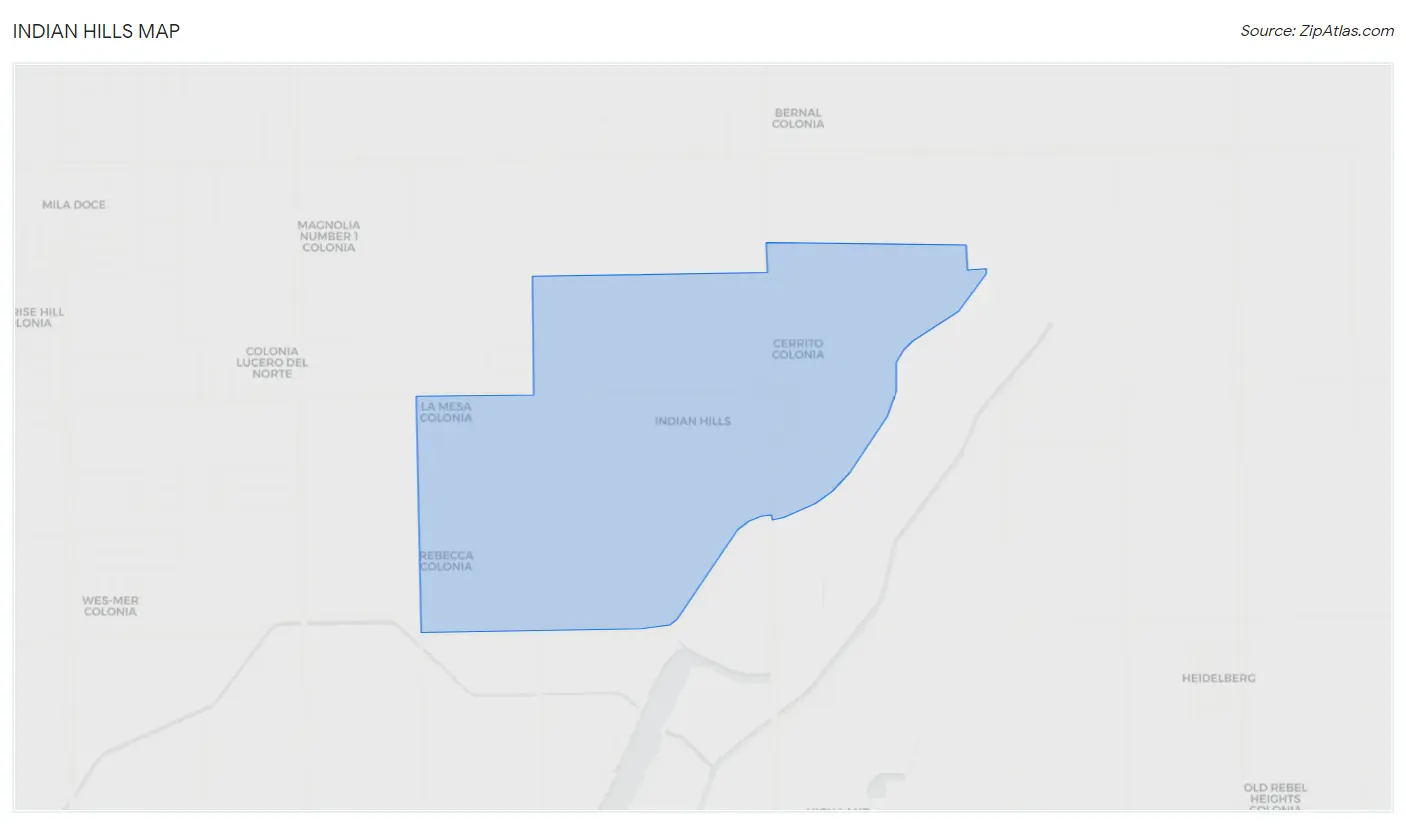
Indian Hills Map
Indian Hills Overview
3,188
TOTAL POPULATION
1,390
MALE POPULATION
1,798
FEMALE POPULATION
77.31
MALES / 100 FEMALES
129.35
FEMALES / 100 MALES
24.0
MEDIAN AGE
4.3
AVG FAMILY SIZE
4.4
AVG HOUSEHOLD SIZE
$8,674
PER CAPITA INCOME
$26,173
AVG FAMILY INCOME
$26,557
AVG HOUSEHOLD INCOME
12.6%
WAGE / INCOME GAP [ % ]
87.4¢/ $1
WAGE / INCOME GAP [ $ ]
0.41
INEQUALITY / GINI INDEX
885
LABOR FORCE [ PEOPLE ]
39.9%
PERCENT IN LABOR FORCE
1.9%
UNEMPLOYMENT RATE
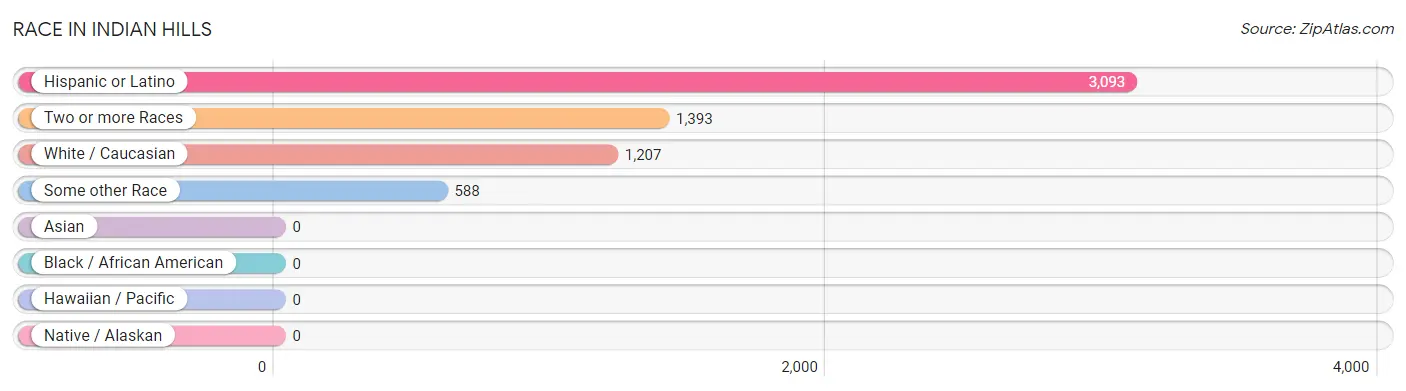
Race in Indian Hills
The most populous races in Indian Hills are Hispanic or Latino (3,093 | 97.0%), Two or more Races (1,393 | 43.7%), and White / Caucasian (1,207 | 37.9%).
| Race | # Population | % Population |
| Asian | 0 | 0.0% |
| Black / African American | 0 | 0.0% |
| Hawaiian / Pacific | 0 | 0.0% |
| Hispanic or Latino | 3,093 | 97.0% |
| Native / Alaskan | 0 | 0.0% |
| White / Caucasian | 1,207 | 37.9% |
| Two or more Races | 1,393 | 43.7% |
| Some other Race | 588 | 18.4% |
| Total | 3,188 | 100.0% |
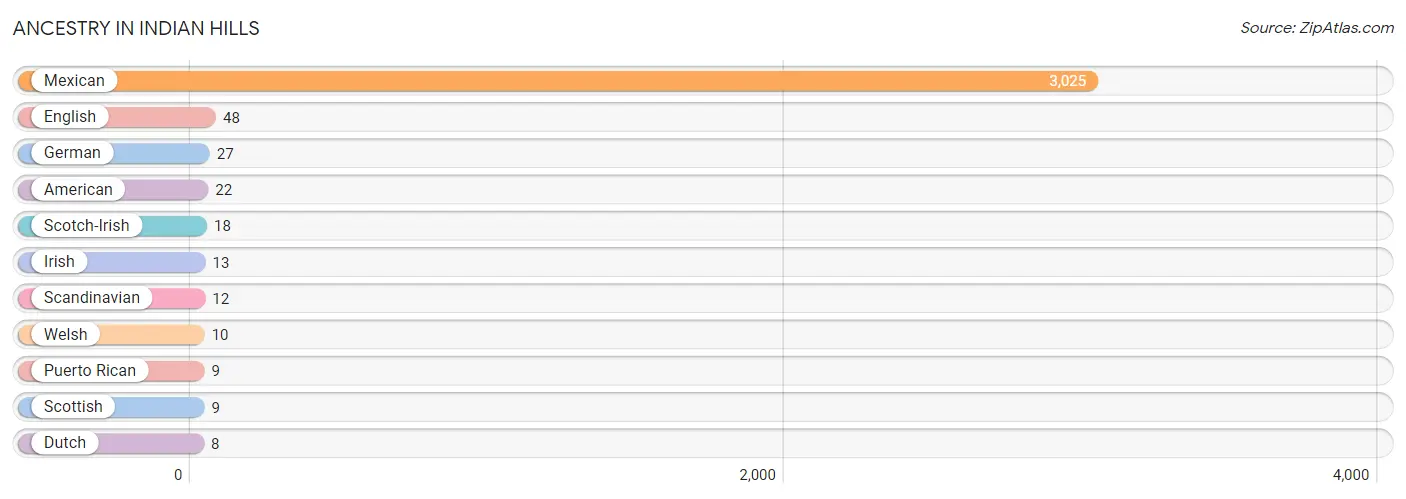
Ancestry in Indian Hills
The most populous ancestries reported in Indian Hills are Mexican (3,025 | 94.9%), English (48 | 1.5%), German (27 | 0.9%), American (22 | 0.7%), and Scotch-Irish (18 | 0.6%), together accounting for 98.5% of all Indian Hills residents.
| Ancestry | # Population | % Population |
| American | 22 | 0.7% |
| Dutch | 8 | 0.3% |
| English | 48 | 1.5% |
| German | 27 | 0.9% |
| Irish | 13 | 0.4% |
| Mexican | 3,025 | 94.9% |
| Puerto Rican | 9 | 0.3% |
| Scandinavian | 12 | 0.4% |
| Scotch-Irish | 18 | 0.6% |
| Scottish | 9 | 0.3% |
| Welsh | 10 | 0.3% | View All 11 Rows |
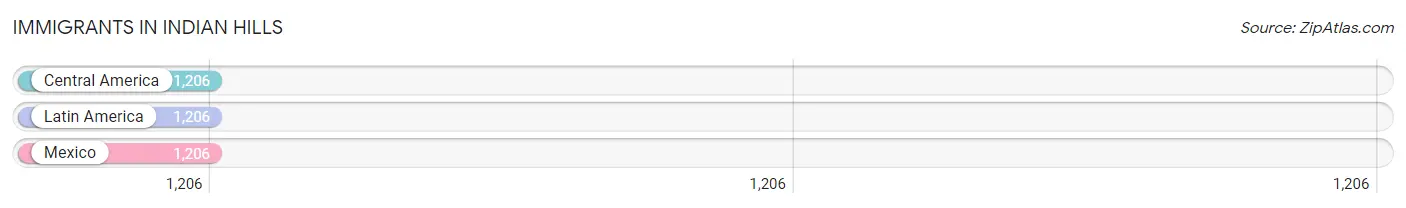
Immigrants in Indian Hills
The most numerous immigrant groups reported in Indian Hills came from Central America (1,206 | 37.8%), Latin America (1,206 | 37.8%), and Mexico (1,206 | 37.8%), together accounting for 113.5% of all Indian Hills residents.
| Immigration Origin | # Population | % Population |
| Central America | 1,206 | 37.8% |
| Latin America | 1,206 | 37.8% |
| Mexico | 1,206 | 37.8% | View All 3 Rows |
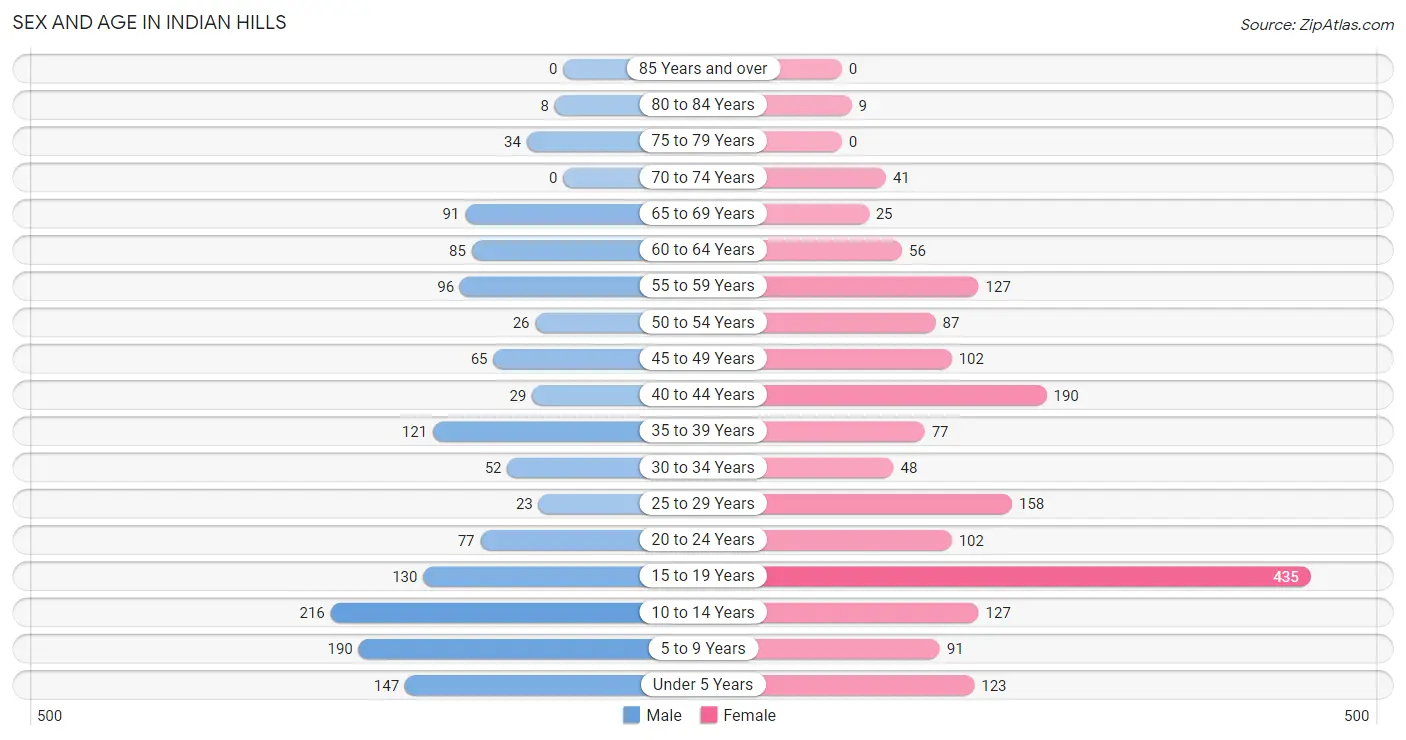
Sex and Age in Indian Hills
Sex and Age in Indian Hills
The most populous age groups in Indian Hills are 10 to 14 Years (216 | 15.5%) for men and 15 to 19 Years (435 | 24.2%) for women.
| Age Bracket | Male | Female |
| Under 5 Years | 147 (10.6%) | 123 (6.8%) |
| 5 to 9 Years | 190 (13.7%) | 91 (5.1%) |
| 10 to 14 Years | 216 (15.5%) | 127 (7.1%) |
| 15 to 19 Years | 130 (9.3%) | 435 (24.2%) |
| 20 to 24 Years | 77 (5.5%) | 102 (5.7%) |
| 25 to 29 Years | 23 (1.7%) | 158 (8.8%) |
| 30 to 34 Years | 52 (3.7%) | 48 (2.7%) |
| 35 to 39 Years | 121 (8.7%) | 77 (4.3%) |
| 40 to 44 Years | 29 (2.1%) | 190 (10.6%) |
| 45 to 49 Years | 65 (4.7%) | 102 (5.7%) |
| 50 to 54 Years | 26 (1.9%) | 87 (4.8%) |
| 55 to 59 Years | 96 (6.9%) | 127 (7.1%) |
| 60 to 64 Years | 85 (6.1%) | 56 (3.1%) |
| 65 to 69 Years | 91 (6.6%) | 25 (1.4%) |
| 70 to 74 Years | 0 (0.0%) | 41 (2.3%) |
| 75 to 79 Years | 34 (2.5%) | 0 (0.0%) |
| 80 to 84 Years | 8 (0.6%) | 9 (0.5%) |
| 85 Years and over | 0 (0.0%) | 0 (0.0%) |
| Total | 1,390 (100.0%) | 1,798 (100.0%) |
Families and Households in Indian Hills
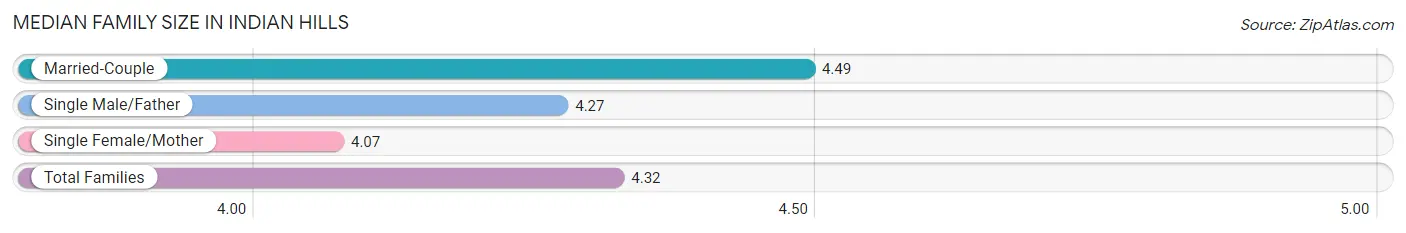
Median Family Size in Indian Hills
The median family size in Indian Hills is 4.32 persons per family, with married-couple families (423 | 59.5%) accounting for the largest median family size of 4.49 persons per family. On the other hand, single female/mother families (266 | 37.4%) represent the smallest median family size with 4.07 persons per family.
| Family Type | # Families | Family Size |
| Married-Couple | 423 (59.5%) | 4.49 |
| Single Male/Father | 22 (3.1%) | 4.27 |
| Single Female/Mother | 266 (37.4%) | 4.07 |
| Total Families | 711 (100.0%) | 4.32 |
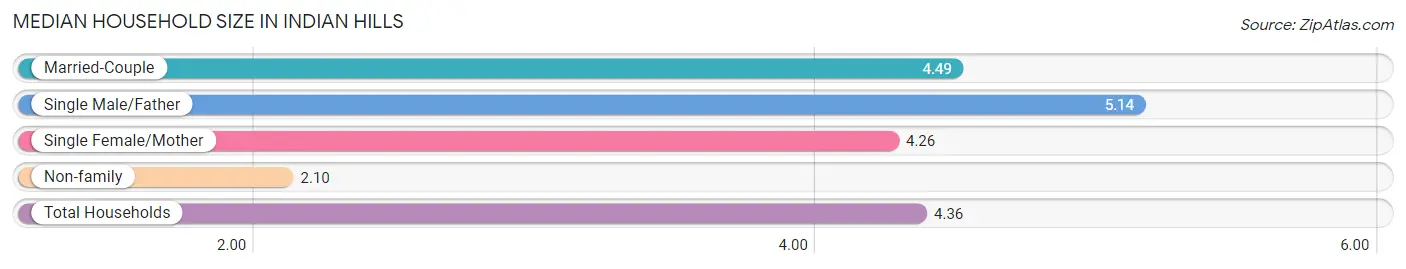
Median Household Size in Indian Hills
The median household size in Indian Hills is 4.36 persons per household, with single male/father households (22 | 3.0%) accounting for the largest median household size of 5.14 persons per household. non-family households (21 | 2.9%) represent the smallest median household size with 2.10 persons per household.
| Household Type | # Households | Household Size |
| Married-Couple | 423 (57.8%) | 4.49 |
| Single Male/Father | 22 (3.0%) | 5.14 |
| Single Female/Mother | 266 (36.3%) | 4.26 |
| Non-family | 21 (2.9%) | 2.10 |
| Total Households | 732 (100.0%) | 4.36 |
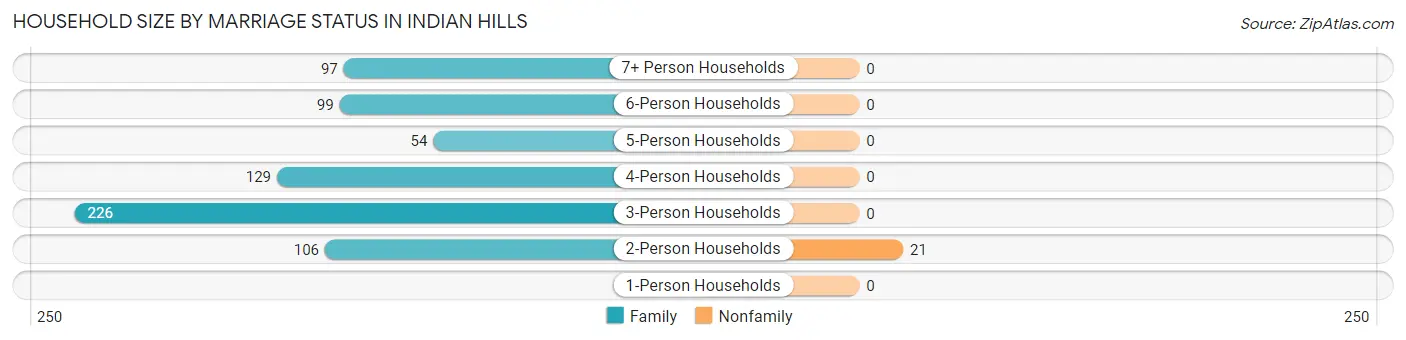
Household Size by Marriage Status in Indian Hills
Out of a total of 732 households in Indian Hills, 711 (97.1%) are family households, while 21 (2.9%) are nonfamily households. The most numerous type of family households are 3-person households, comprising 226, and the most common type of nonfamily households are 2-person households, comprising 21.
| Household Size | Family Households | Nonfamily Households |
| 1-Person Households | - | 0 (0.0%) |
| 2-Person Households | 106 (14.5%) | 21 (2.9%) |
| 3-Person Households | 226 (30.9%) | 0 (0.0%) |
| 4-Person Households | 129 (17.6%) | 0 (0.0%) |
| 5-Person Households | 54 (7.4%) | 0 (0.0%) |
| 6-Person Households | 99 (13.5%) | 0 (0.0%) |
| 7+ Person Households | 97 (13.3%) | 0 (0.0%) |
| Total | 711 (97.1%) | 21 (2.9%) |
Female Fertility in Indian Hills
Fertility by Age in Indian Hills
Average fertility rate in Indian Hills is 118.0 births per 1,000 women. Women in the age bracket of 20 to 34 years have the highest fertility rate with 153.0 births per 1,000 women. Women in the age bracket of 35 to 50 years acount for 42.0% of all women with births.
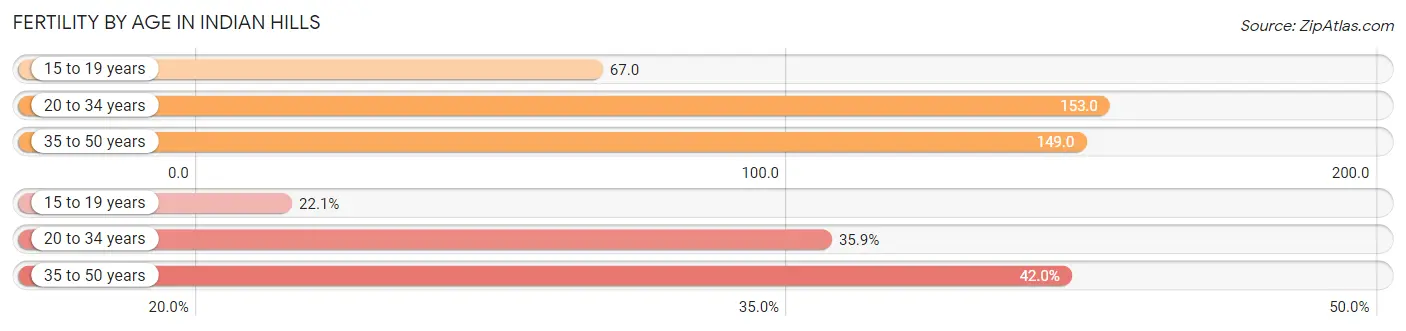
| Age Bracket | Women with Births | Births / 1,000 Women |
| 15 to 19 years | 29 (22.1%) | 67.0 |
| 20 to 34 years | 47 (35.9%) | 153.0 |
| 35 to 50 years | 55 (42.0%) | 149.0 |
| Total | 131 (100.0%) | 118.0 |
Fertility by Age by Marriage Status in Indian Hills
49.6% of women with births (131) in Indian Hills are married. The highest percentage of unmarried women with births falls into 15 to 19 years age bracket with 100.0% of them unmarried at the time of birth, while the lowest percentage of unmarried women with births belong to 20 to 34 years age bracket with 17.0% of them unmarried.
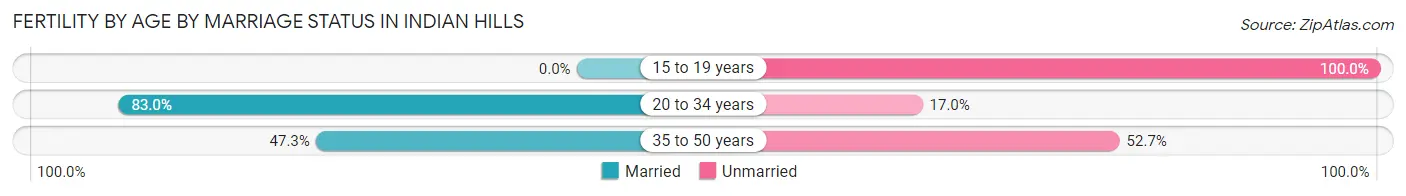
| Age Bracket | Married | Unmarried |
| 15 to 19 years | 0 (0.0%) | 29 (100.0%) |
| 20 to 34 years | 39 (83.0%) | 8 (17.0%) |
| 35 to 50 years | 26 (47.3%) | 29 (52.7%) |
| Total | 65 (49.6%) | 66 (50.4%) |
Fertility by Education in Indian Hills
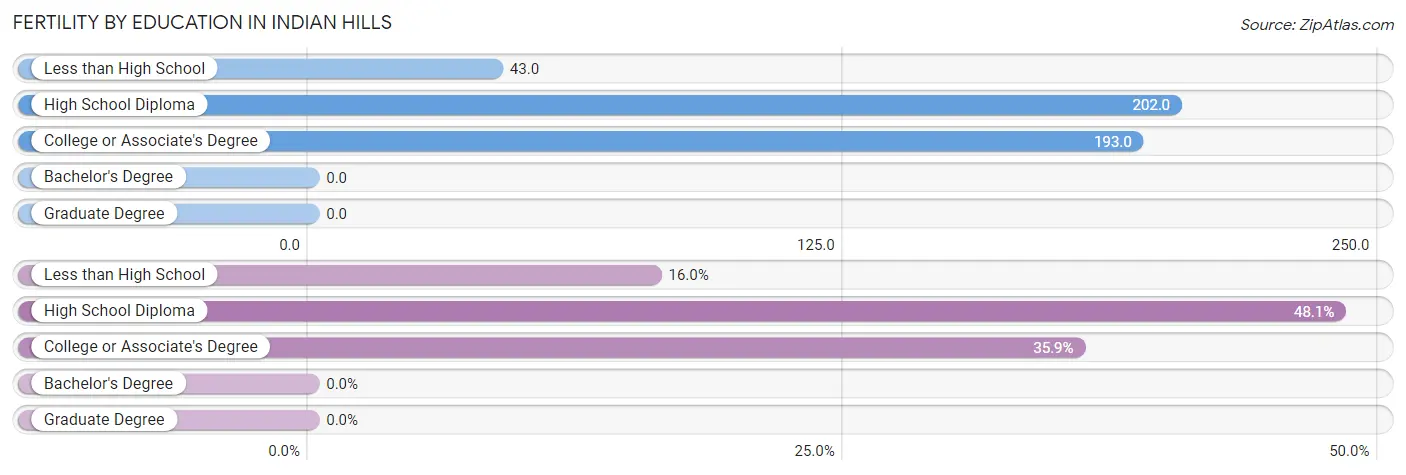
| Educational Attainment | Women with Births | Births / 1,000 Women |
| Less than High School | 21 (16.0%) | 43.0 |
| High School Diploma | 63 (48.1%) | 202.0 |
| College or Associate's Degree | 47 (35.9%) | 193.0 |
| Bachelor's Degree | 0 (0.0%) | 0.0 |
| Graduate Degree | 0 (0.0%) | 0.0 |
| Total | 131 (100.0%) | 118.0 |
Fertility by Education by Marriage Status in Indian Hills
50.4% of women with births in Indian Hills are unmarried. Women with the educational attainment of college or associate's degree are most likely to be married with 83.0% of them married at childbirth, while women with the educational attainment of less than high school are least likely to be married with 100.0% of them unmarried at childbirth.
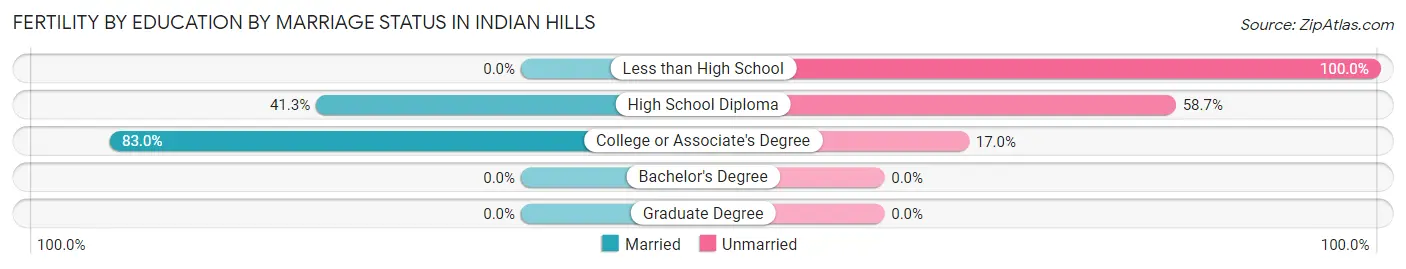
| Educational Attainment | Married | Unmarried |
| Less than High School | 0 (0.0%) | 21 (100.0%) |
| High School Diploma | 26 (41.3%) | 37 (58.7%) |
| College or Associate's Degree | 39 (83.0%) | 8 (17.0%) |
| Bachelor's Degree | 0 (0.0%) | 0 (0.0%) |
| Graduate Degree | 0 (0.0%) | 0 (0.0%) |
| Total | 65 (49.6%) | 66 (50.4%) |
Income in Indian Hills
Income Overview in Indian Hills
Per Capita Income in Indian Hills is $8,674, while median incomes of families and households are $26,173 and $26,557 respectively.
| Characteristic | Number | Measure |
| Per Capita Income | 3,188 | $8,674 |
| Median Family Income | 711 | $26,173 |
| Mean Family Income | 711 | $37,332 |
| Median Household Income | 732 | $26,557 |
| Mean Household Income | 732 | $40,366 |
| Income Deficit | 711 | $0 |
| Wage / Income Gap (%) | 3,188 | 12.64% |
| Wage / Income Gap ($) | 3,188 | 87.36¢ per $1 |
| Gini / Inequality Index | 3,188 | 0.41 |
Earnings by Sex in Indian Hills
Average Earnings in Indian Hills are $17,500, $16,653 for men and $19,063 for women, a difference of 12.6%.
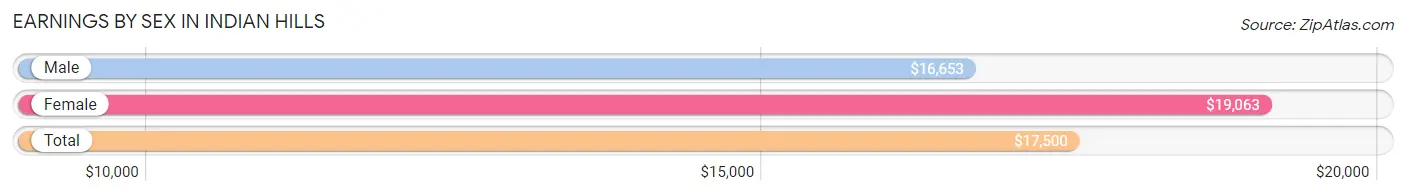
| Sex | Number | Average Earnings |
| Male | 458 (45.6%) | $16,653 |
| Female | 546 (54.4%) | $19,063 |
| Total | 1,004 (100.0%) | $17,500 |
Earnings by Sex by Income Bracket in Indian Hills
The most common earnings brackets in Indian Hills are $2,500 to $4,999 for men (105 | 22.9%) and $25,000 to $29,999 for women (126 | 23.1%).
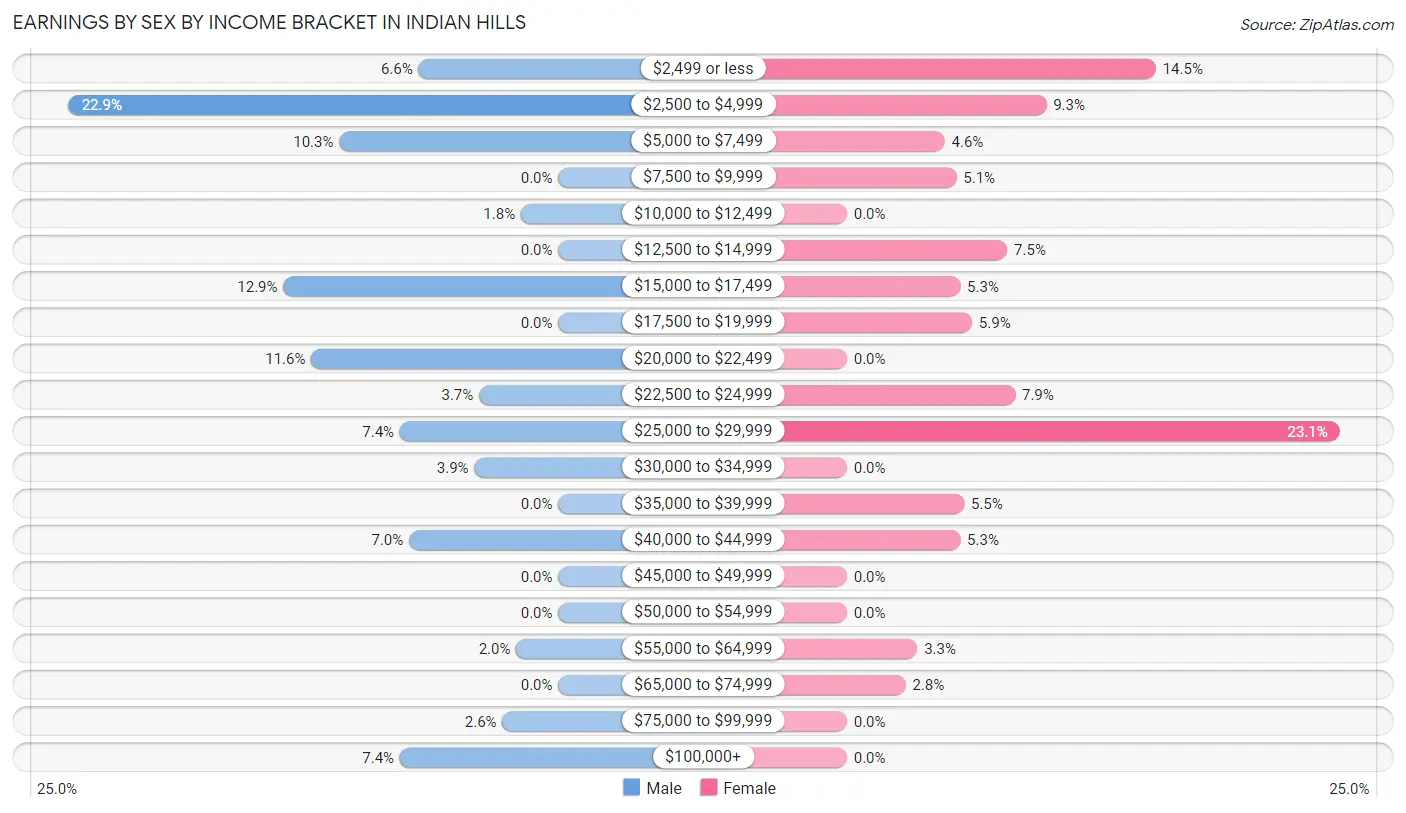
| Income | Male | Female |
| $2,499 or less | 30 (6.6%) | 79 (14.5%) |
| $2,500 to $4,999 | 105 (22.9%) | 51 (9.3%) |
| $5,000 to $7,499 | 47 (10.3%) | 25 (4.6%) |
| $7,500 to $9,999 | 0 (0.0%) | 28 (5.1%) |
| $10,000 to $12,499 | 8 (1.8%) | 0 (0.0%) |
| $12,500 to $14,999 | 0 (0.0%) | 41 (7.5%) |
| $15,000 to $17,499 | 59 (12.9%) | 29 (5.3%) |
| $17,500 to $19,999 | 0 (0.0%) | 32 (5.9%) |
| $20,000 to $22,499 | 53 (11.6%) | 0 (0.0%) |
| $22,500 to $24,999 | 17 (3.7%) | 43 (7.9%) |
| $25,000 to $29,999 | 34 (7.4%) | 126 (23.1%) |
| $30,000 to $34,999 | 18 (3.9%) | 0 (0.0%) |
| $35,000 to $39,999 | 0 (0.0%) | 30 (5.5%) |
| $40,000 to $44,999 | 32 (7.0%) | 29 (5.3%) |
| $45,000 to $49,999 | 0 (0.0%) | 0 (0.0%) |
| $50,000 to $54,999 | 0 (0.0%) | 0 (0.0%) |
| $55,000 to $64,999 | 9 (2.0%) | 18 (3.3%) |
| $65,000 to $74,999 | 0 (0.0%) | 15 (2.8%) |
| $75,000 to $99,999 | 12 (2.6%) | 0 (0.0%) |
| $100,000+ | 34 (7.4%) | 0 (0.0%) |
| Total | 458 (100.0%) | 546 (100.0%) |
Earnings by Sex by Educational Attainment in Indian Hills
Average earnings in Indian Hills are $17,203 for men and $19,570 for women, a difference of 12.1%. Men with an educational attainment of high school diploma enjoy the highest average annual earnings of $25,404, while those with high school diploma education earn the least with $25,404. Women with an educational attainment of college or associate's degree earn the most with the average annual earnings of $40,388, while those with less than high school education have the smallest earnings of $18,281.
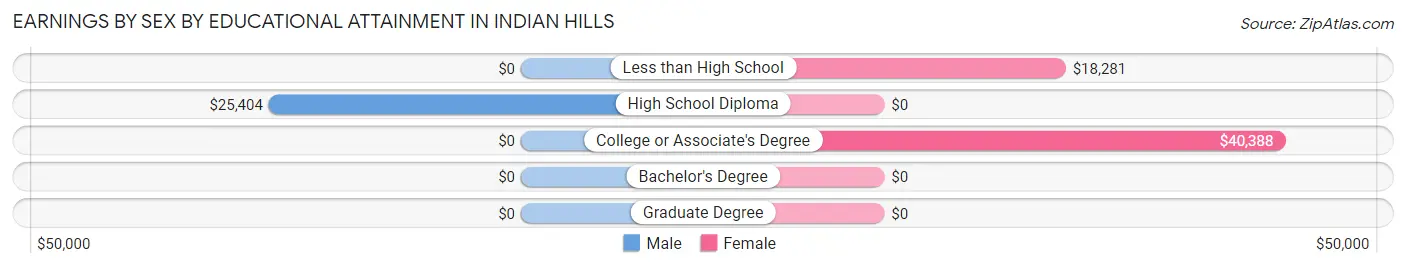
| Educational Attainment | Male Income | Female Income |
| Less than High School | - | - |
| High School Diploma | $25,404 | $0 |
| College or Associate's Degree | - | - |
| Bachelor's Degree | - | - |
| Graduate Degree | - | - |
| Total | $17,203 | $19,570 |
Family Income in Indian Hills
Family Income Brackets in Indian Hills
According to the Indian Hills family income data, there are 221 families falling into the $25,000 to $34,999 income range, which is the most common income bracket and makes up 31.1% of all families.
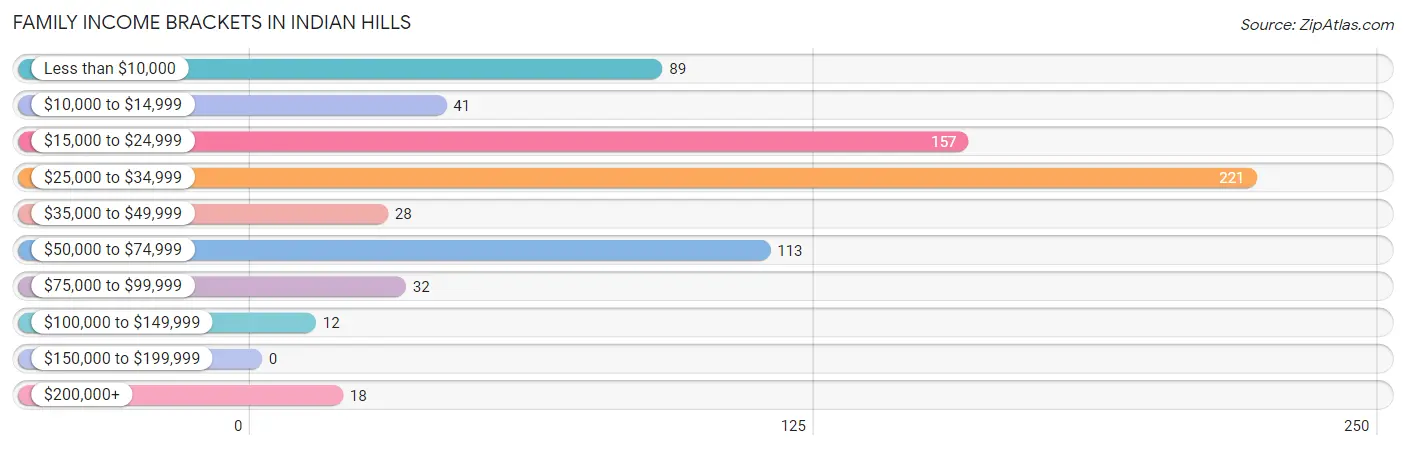
| Income Bracket | # Families | % Families |
| Less than $10,000 | 89 | 12.5% |
| $10,000 to $14,999 | 41 | 5.8% |
| $15,000 to $24,999 | 157 | 22.1% |
| $25,000 to $34,999 | 221 | 31.1% |
| $35,000 to $49,999 | 28 | 3.9% |
| $50,000 to $74,999 | 113 | 15.9% |
| $75,000 to $99,999 | 32 | 4.5% |
| $100,000 to $149,999 | 12 | 1.7% |
| $150,000 to $199,999 | 0 | 0.0% |
| $200,000+ | 18 | 2.5% |
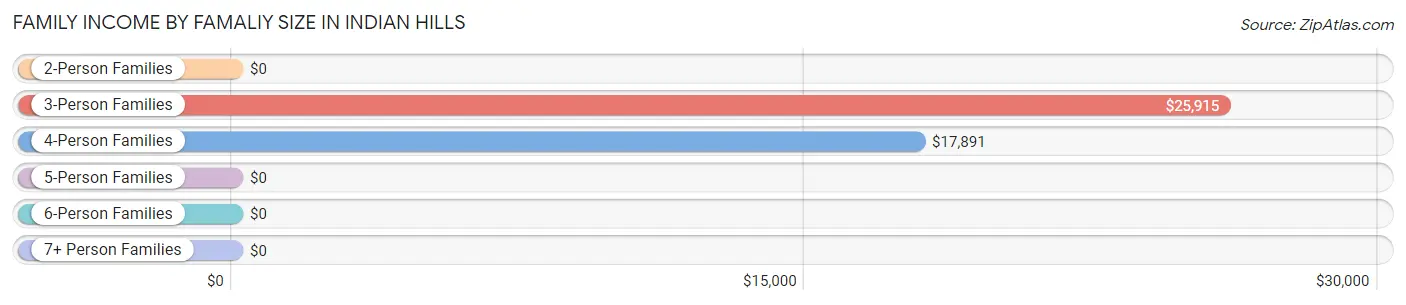
Family Income by Famaliy Size in Indian Hills
3-person families (255 | 35.9%) account for the highest median family income in Indian Hills with $25,915 per family, while 3-person families (255 | 35.9%) have the highest median income of $8,638 per family member.
| Income Bracket | # Families | Median Income |
| 2-Person Families | 106 (14.9%) | $0 |
| 3-Person Families | 255 (35.9%) | $25,915 |
| 4-Person Families | 122 (17.2%) | $17,891 |
| 5-Person Families | 32 (4.5%) | $0 |
| 6-Person Families | 99 (13.9%) | $0 |
| 7+ Person Families | 97 (13.6%) | $0 |
| Total | 711 (100.0%) | $26,173 |
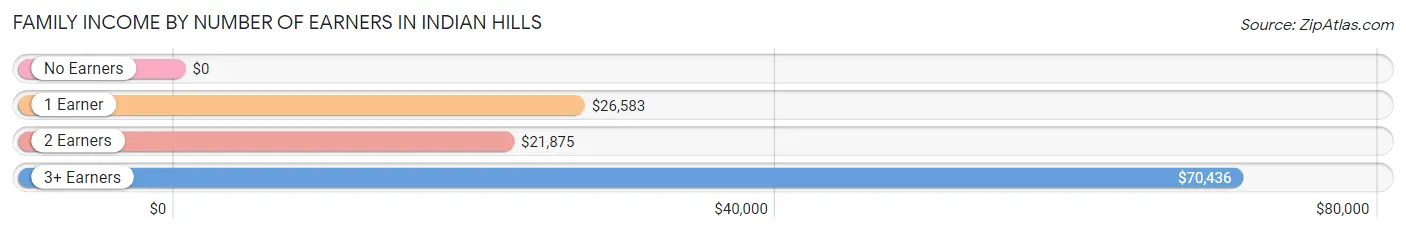
Family Income by Number of Earners in Indian Hills
| Number of Earners | # Families | Median Income |
| No Earners | 110 (15.5%) | $0 |
| 1 Earner | 278 (39.1%) | $26,583 |
| 2 Earners | 252 (35.4%) | $21,875 |
| 3+ Earners | 71 (10.0%) | $70,436 |
| Total | 711 (100.0%) | $26,173 |
Household Income in Indian Hills
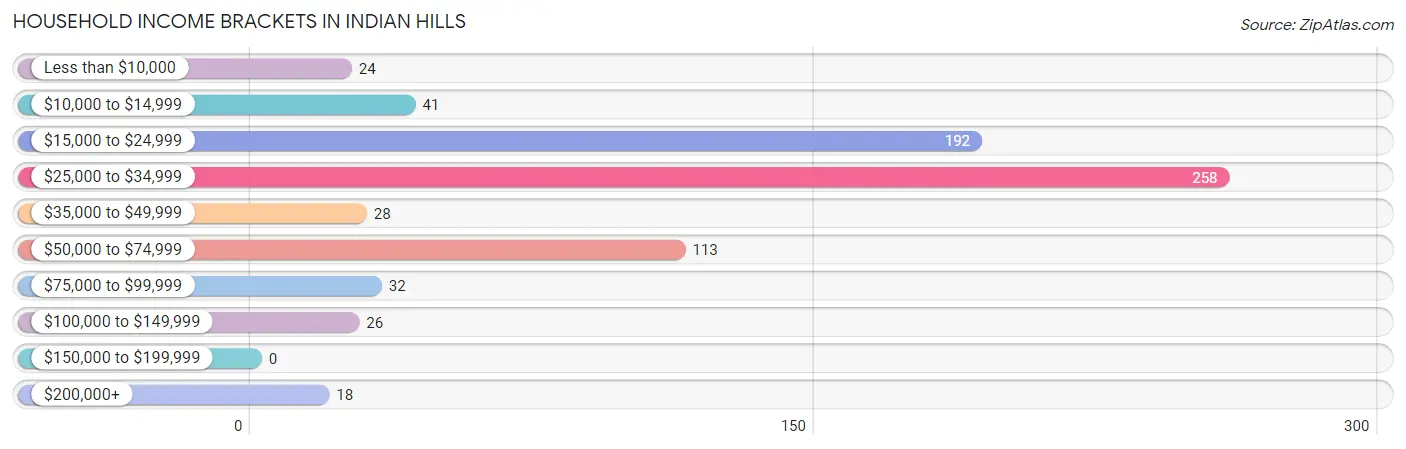
Household Income Brackets in Indian Hills
With 258 households falling in the category, the $25,000 to $34,999 income range is the most frequent in Indian Hills, accounting for 35.2% of all households.
| Income Bracket | # Households | % Households |
| Less than $10,000 | 24 | 3.3% |
| $10,000 to $14,999 | 41 | 5.6% |
| $15,000 to $24,999 | 192 | 26.2% |
| $25,000 to $34,999 | 258 | 35.2% |
| $35,000 to $49,999 | 28 | 3.8% |
| $50,000 to $74,999 | 113 | 15.4% |
| $75,000 to $99,999 | 32 | 4.4% |
| $100,000 to $149,999 | 26 | 3.6% |
| $150,000 to $199,999 | 0 | 0.0% |
| $200,000+ | 18 | 2.5% |
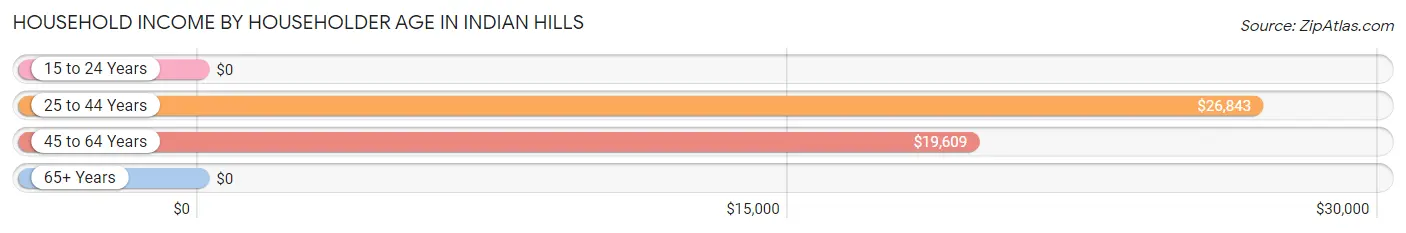
Household Income by Householder Age in Indian Hills
The median household income in Indian Hills is $26,557, with the highest median household income of $26,843 found in the 25 to 44 years age bracket for the primary householder. A total of 294 households (40.2%) fall into this category.
| Income Bracket | # Households | Median Income |
| 15 to 24 Years | 0 (0.0%) | $0 |
| 25 to 44 Years | 294 (40.2%) | $26,843 |
| 45 to 64 Years | 298 (40.7%) | $19,609 |
| 65+ Years | 140 (19.1%) | $0 |
| Total | 732 (100.0%) | $26,557 |
Poverty in Indian Hills
Income Below Poverty by Sex and Age in Indian Hills
With 72.3% poverty level for males and 57.3% for females among the residents of Indian Hills, under 5 year old males and 15 year old females are the most vulnerable to poverty, with 147 males (100.0%) and 47 females (100.0%) in their respective age groups living below the poverty level.
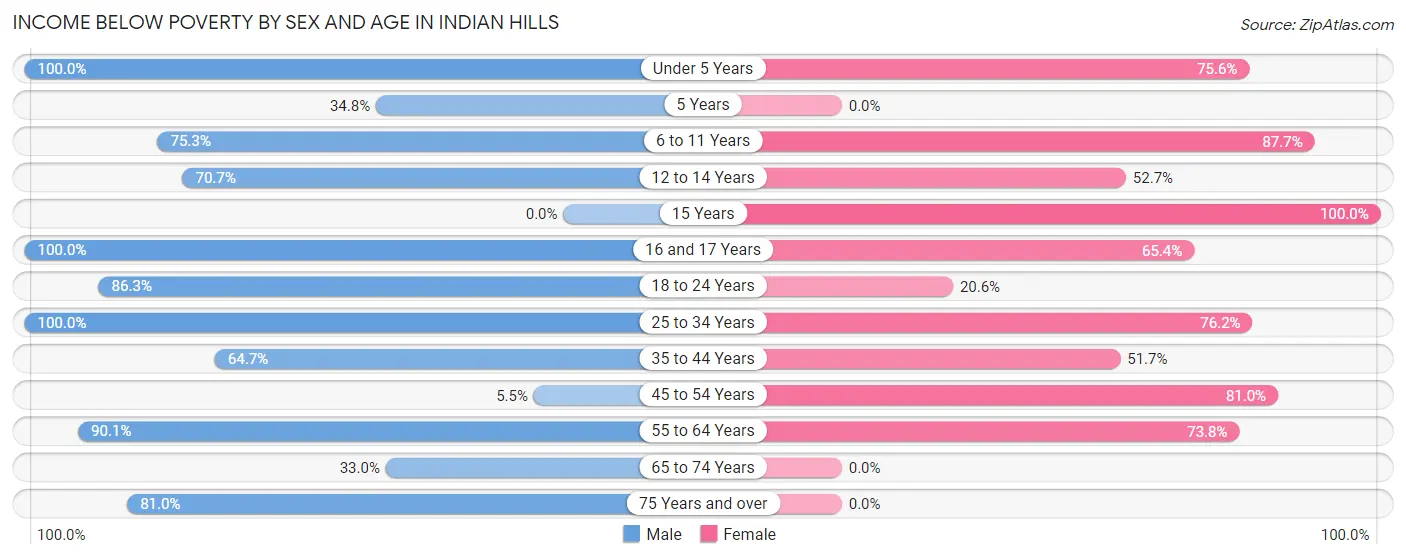
| Age Bracket | Male | Female |
| Under 5 Years | 147 (100.0%) | 93 (75.6%) |
| 5 Years | 8 (34.8%) | 0 (0.0%) |
| 6 to 11 Years | 232 (75.3%) | 143 (87.7%) |
| 12 to 14 Years | 53 (70.7%) | 29 (52.7%) |
| 15 Years | 0 (0.0%) | 47 (100.0%) |
| 16 and 17 Years | 48 (100.0%) | 51 (65.4%) |
| 18 to 24 Years | 113 (86.3%) | 85 (20.6%) |
| 25 to 34 Years | 75 (100.0%) | 157 (76.2%) |
| 35 to 44 Years | 97 (64.7%) | 138 (51.7%) |
| 45 to 54 Years | 5 (5.5%) | 153 (80.9%) |
| 55 to 64 Years | 163 (90.1%) | 135 (73.8%) |
| 65 to 74 Years | 30 (33.0%) | 0 (0.0%) |
| 75 Years and over | 34 (80.9%) | 0 (0.0%) |
| Total | 1,005 (72.3%) | 1,031 (57.3%) |
Income Above Poverty by Sex and Age in Indian Hills
According to the poverty statistics in Indian Hills, males aged 15 years and females aged 65 to 74 years are the age groups that are most secure financially, with 100.0% of males and 100.0% of females in these age groups living above the poverty line.
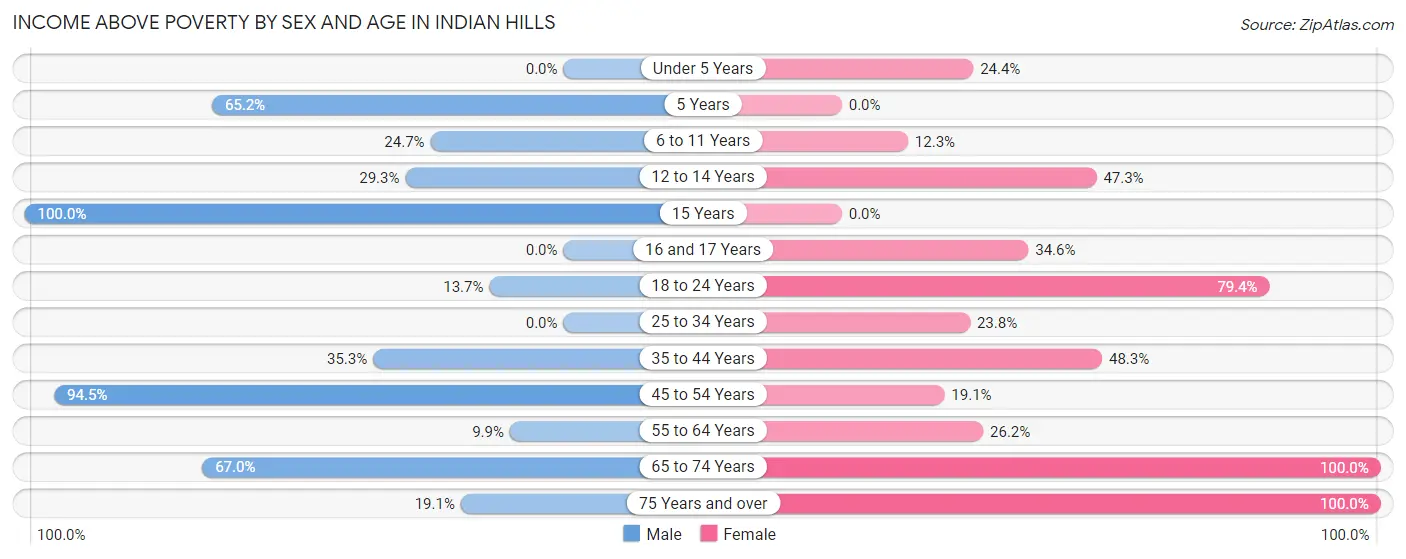
| Age Bracket | Male | Female |
| Under 5 Years | 0 (0.0%) | 30 (24.4%) |
| 5 Years | 15 (65.2%) | 0 (0.0%) |
| 6 to 11 Years | 76 (24.7%) | 20 (12.3%) |
| 12 to 14 Years | 22 (29.3%) | 26 (47.3%) |
| 15 Years | 28 (100.0%) | 0 (0.0%) |
| 16 and 17 Years | 0 (0.0%) | 27 (34.6%) |
| 18 to 24 Years | 18 (13.7%) | 327 (79.4%) |
| 25 to 34 Years | 0 (0.0%) | 49 (23.8%) |
| 35 to 44 Years | 53 (35.3%) | 129 (48.3%) |
| 45 to 54 Years | 86 (94.5%) | 36 (19.1%) |
| 55 to 64 Years | 18 (9.9%) | 48 (26.2%) |
| 65 to 74 Years | 61 (67.0%) | 66 (100.0%) |
| 75 Years and over | 8 (19.1%) | 9 (100.0%) |
| Total | 385 (27.7%) | 767 (42.7%) |
Income Below Poverty Among Married-Couple Families in Indian Hills
The poverty statistics for married-couple families in Indian Hills show that 60.3% or 255 of the total 423 families live below the poverty line. Families with 5 or more children have the highest poverty rate of 100.0%, comprising of 26 families. On the other hand, families with 3 or 4 children have the lowest poverty rate of 45.1%, which includes 50 families.
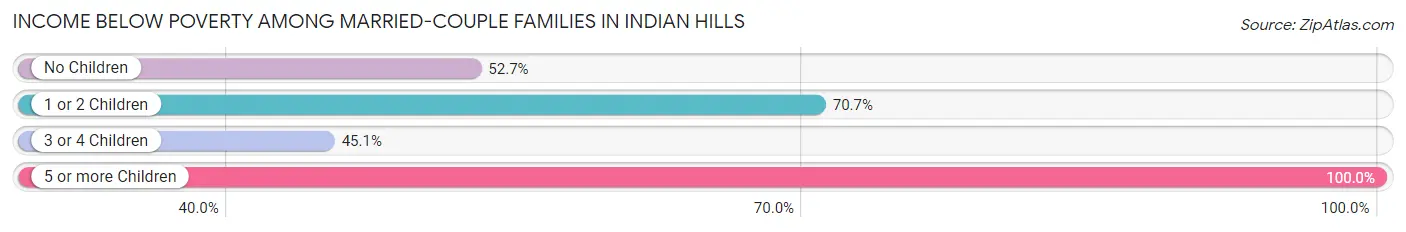
| Children | Above Poverty | Below Poverty |
| No Children | 61 (47.3%) | 68 (52.7%) |
| 1 or 2 Children | 46 (29.3%) | 111 (70.7%) |
| 3 or 4 Children | 61 (54.9%) | 50 (45.1%) |
| 5 or more Children | 0 (0.0%) | 26 (100.0%) |
| Total | 168 (39.7%) | 255 (60.3%) |
Income Below Poverty Among Single-Parent Households in Indian Hills
According to the poverty data in Indian Hills, 100.0% or 22 single-father households and 48.1% or 128 single-mother households are living below the poverty line. Among single-father households, those with 1 or 2 children have the highest poverty rate, with 22 households (100.0%) experiencing poverty. Likewise, among single-mother households, those with 5 or more children have the highest poverty rate, with 21 households (100.0%) falling below the poverty line.
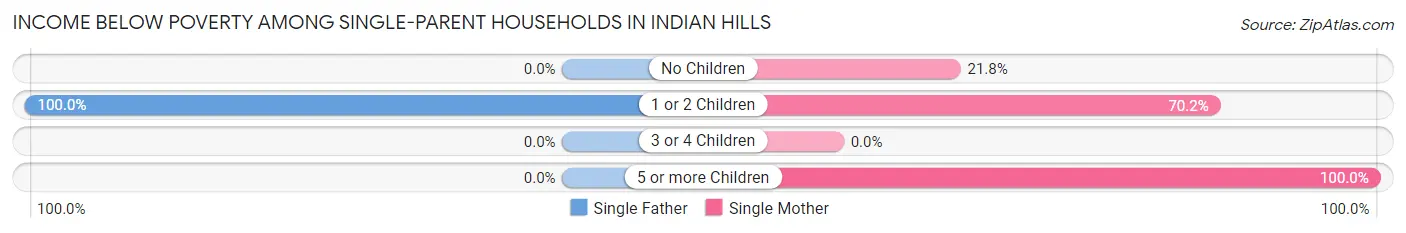
| Children | Single Father | Single Mother |
| No Children | 0 (0.0%) | 27 (21.8%) |
| 1 or 2 Children | 22 (100.0%) | 80 (70.2%) |
| 3 or 4 Children | 0 (0.0%) | 0 (0.0%) |
| 5 or more Children | 0 (0.0%) | 21 (100.0%) |
| Total | 22 (100.0%) | 128 (48.1%) |
Income Below Poverty Among Married-Couple vs Single-Parent Households in Indian Hills
The poverty data for Indian Hills shows that 255 of the married-couple family households (60.3%) and 150 of the single-parent households (52.1%) are living below the poverty level. Within the married-couple family households, those with 5 or more children have the highest poverty rate, with 26 households (100.0%) falling below the poverty line. Among the single-parent households, those with 5 or more children have the highest poverty rate, with 21 household (100.0%) living below poverty.
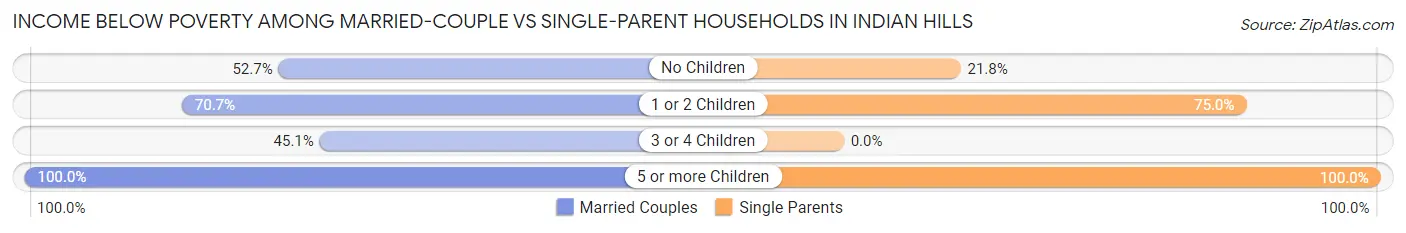
| Children | Married-Couple Families | Single-Parent Households |
| No Children | 68 (52.7%) | 27 (21.8%) |
| 1 or 2 Children | 111 (70.7%) | 102 (75.0%) |
| 3 or 4 Children | 50 (45.1%) | 0 (0.0%) |
| 5 or more Children | 26 (100.0%) | 21 (100.0%) |
| Total | 255 (60.3%) | 150 (52.1%) |
Employment Characteristics in Indian Hills
Employment by Class of Employer in Indian Hills
Among the 869 employed individuals in Indian Hills, private company employees (583 | 67.1%), self-employed (not incorporated) (170 | 19.6%), and unpaid family workers (44 | 5.1%) make up the most common classes of employment.
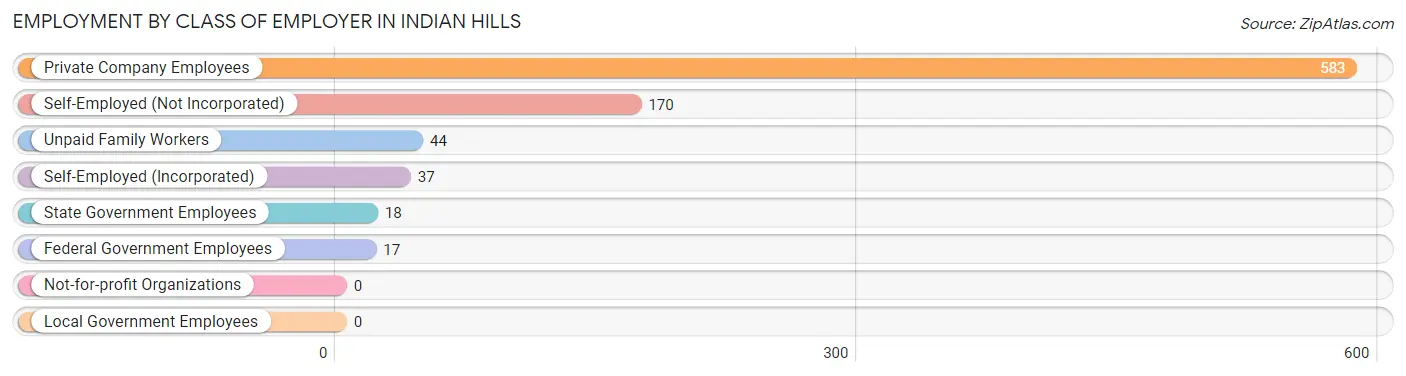
| Employer Class | # Employees | % Employees |
| Private Company Employees | 583 | 67.1% |
| Self-Employed (Incorporated) | 37 | 4.3% |
| Self-Employed (Not Incorporated) | 170 | 19.6% |
| Not-for-profit Organizations | 0 | 0.0% |
| Local Government Employees | 0 | 0.0% |
| State Government Employees | 18 | 2.1% |
| Federal Government Employees | 17 | 2.0% |
| Unpaid Family Workers | 44 | 5.1% |
| Total | 869 | 100.0% |
Employment Status by Age in Indian Hills
According to the labor force statistics for Indian Hills, out of the total population over 16 years of age (2,219), 39.9% or 885 individuals are in the labor force, with 1.9% or 17 of them unemployed. The age group with the highest labor force participation rate is 45 to 54 years, with 81.4% or 228 individuals in the labor force. Within the labor force, the 16 to 19 years age range has the highest percentage of unemployed individuals, with 19.5% or 8 of them being unemployed.
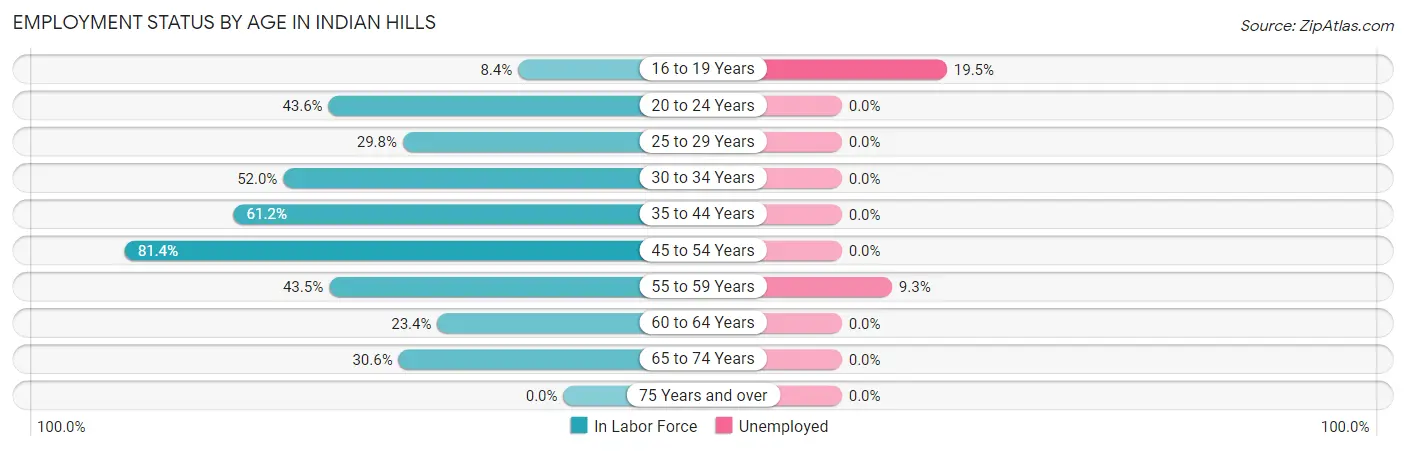
| Age Bracket | In Labor Force | Unemployed |
| 16 to 19 Years | 41 (8.4%) | 8 (19.5%) |
| 20 to 24 Years | 78 (43.6%) | 0 (0.0%) |
| 25 to 29 Years | 54 (29.8%) | 0 (0.0%) |
| 30 to 34 Years | 52 (52.0%) | 0 (0.0%) |
| 35 to 44 Years | 255 (61.2%) | 0 (0.0%) |
| 45 to 54 Years | 228 (81.4%) | 0 (0.0%) |
| 55 to 59 Years | 97 (43.5%) | 9 (9.3%) |
| 60 to 64 Years | 33 (23.4%) | 0 (0.0%) |
| 65 to 74 Years | 48 (30.6%) | 0 (0.0%) |
| 75 Years and over | 0 (0.0%) | 0 (0.0%) |
| Total | 885 (39.9%) | 17 (1.9%) |
Employment Status by Educational Attainment in Indian Hills
According to labor force statistics for Indian Hills, 53.6% of individuals (719) out of the total population between 25 and 64 years of age (1,342) are in the labor force, with 1.3% or 9 of them being unemployed. The group with the highest labor force participation rate are those with the educational attainment of high school diploma, with 67.9% or 197 individuals in the labor force. Within the labor force, individuals with college / associate degree education have the highest percentage of unemployment, with 8.1% or 9 of them being unemployed.
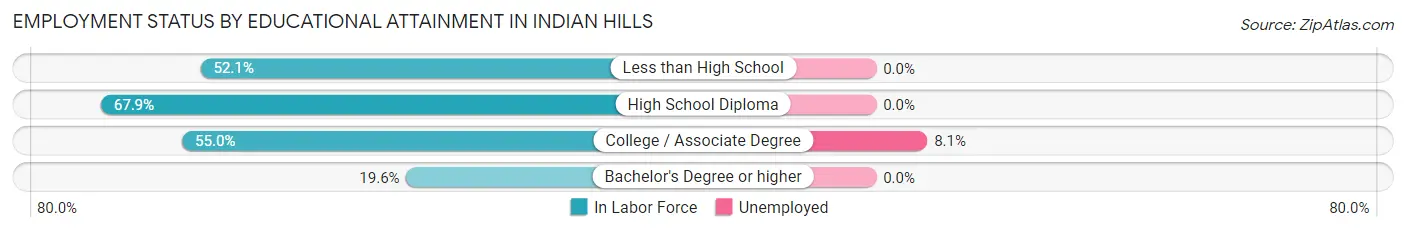
| Educational Attainment | In Labor Force | Unemployed |
| Less than High School | 392 (52.1%) | 0 (0.0%) |
| High School Diploma | 197 (67.9%) | 0 (0.0%) |
| College / Associate Degree | 111 (55.0%) | 16 (8.1%) |
| Bachelor's Degree or higher | 19 (19.6%) | 0 (0.0%) |
| Total | 719 (53.6%) | 17 (1.3%) |
Employment Occupations by Sex in Indian Hills
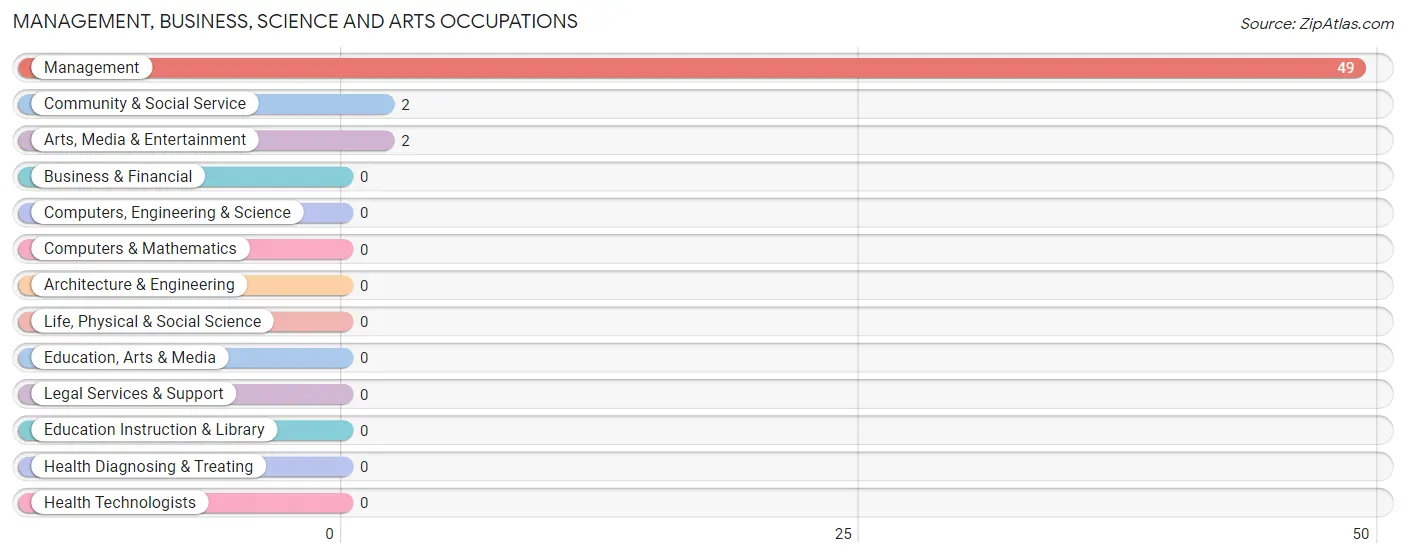
Management, Business, Science and Arts Occupations
The most common Management, Business, Science and Arts occupations in Indian Hills are Management (49 | 5.6%), Community & Social Service (2 | 0.2%), and Arts, Media & Entertainment (2 | 0.2%).
Management, Business, Science and Arts Occupations by Sex
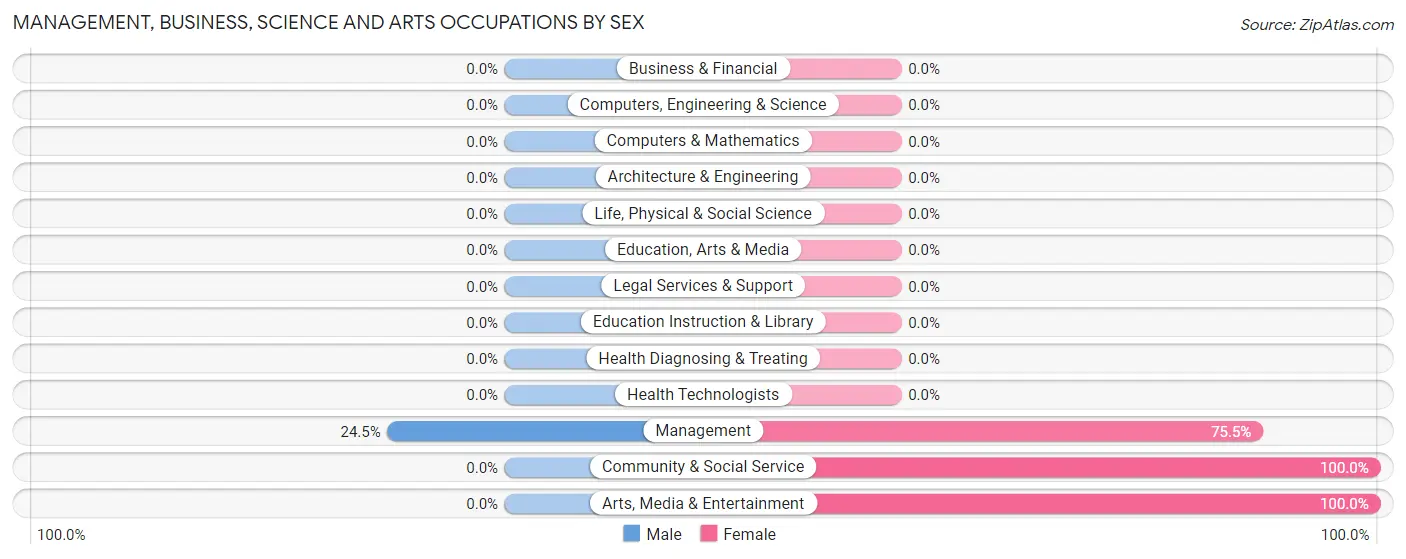
| Occupation | Male | Female |
| Management | 12 (24.5%) | 37 (75.5%) |
| Business & Financial | 0 (0.0%) | 0 (0.0%) |
| Computers, Engineering & Science | 0 (0.0%) | 0 (0.0%) |
| Computers & Mathematics | 0 (0.0%) | 0 (0.0%) |
| Architecture & Engineering | 0 (0.0%) | 0 (0.0%) |
| Life, Physical & Social Science | 0 (0.0%) | 0 (0.0%) |
| Community & Social Service | 0 (0.0%) | 2 (100.0%) |
| Education, Arts & Media | 0 (0.0%) | 0 (0.0%) |
| Legal Services & Support | 0 (0.0%) | 0 (0.0%) |
| Education Instruction & Library | 0 (0.0%) | 0 (0.0%) |
| Arts, Media & Entertainment | 0 (0.0%) | 2 (100.0%) |
| Health Diagnosing & Treating | 0 (0.0%) | 0 (0.0%) |
| Health Technologists | 0 (0.0%) | 0 (0.0%) |
| Total (Category) | 12 (23.5%) | 39 (76.5%) |
| Total (Overall) | 386 (44.4%) | 483 (55.6%) |
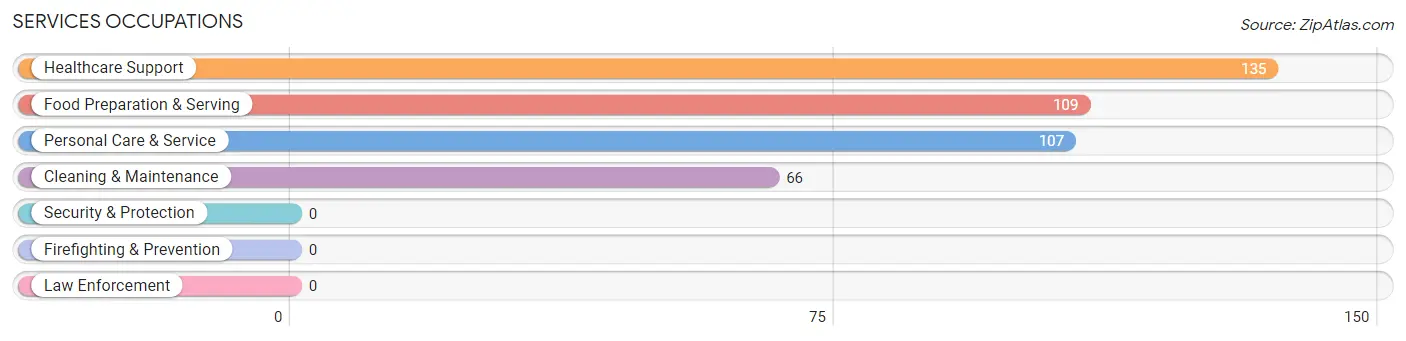
Services Occupations
The most common Services occupations in Indian Hills are Healthcare Support (135 | 15.5%), Food Preparation & Serving (109 | 12.5%), Personal Care & Service (107 | 12.3%), and Cleaning & Maintenance (66 | 7.6%).
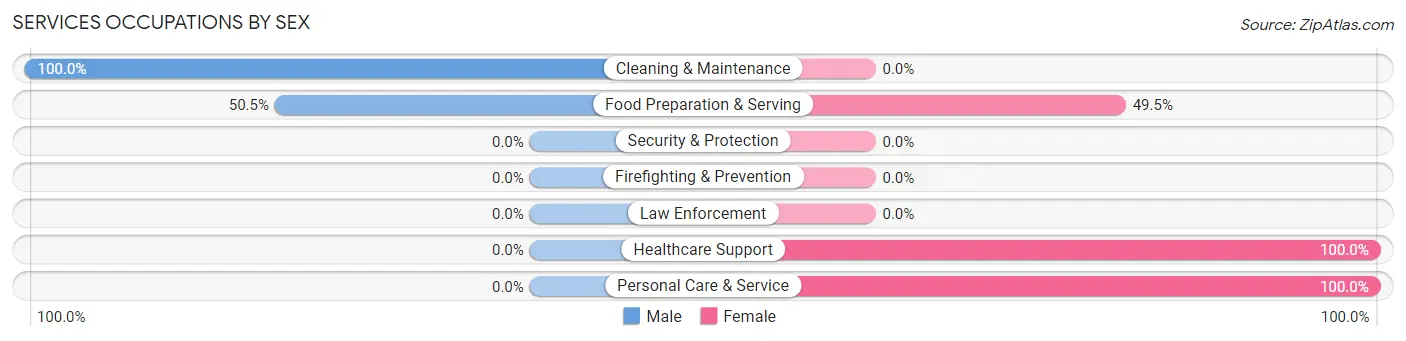
Services Occupations by Sex
Within the Services occupations in Indian Hills, the most male-oriented occupations are Cleaning & Maintenance (100.0%), and Food Preparation & Serving (50.5%), while the most female-oriented occupations are Healthcare Support (100.0%), Personal Care & Service (100.0%), and Food Preparation & Serving (49.5%).
| Occupation | Male | Female |
| Healthcare Support | 0 (0.0%) | 135 (100.0%) |
| Security & Protection | 0 (0.0%) | 0 (0.0%) |
| Firefighting & Prevention | 0 (0.0%) | 0 (0.0%) |
| Law Enforcement | 0 (0.0%) | 0 (0.0%) |
| Food Preparation & Serving | 55 (50.5%) | 54 (49.5%) |
| Cleaning & Maintenance | 66 (100.0%) | 0 (0.0%) |
| Personal Care & Service | 0 (0.0%) | 107 (100.0%) |
| Total (Category) | 121 (29.0%) | 296 (71.0%) |
| Total (Overall) | 386 (44.4%) | 483 (55.6%) |
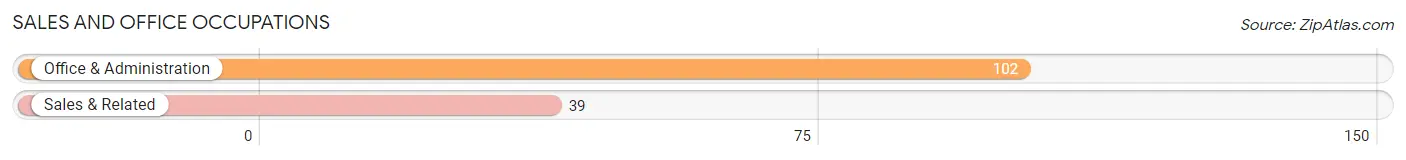
Sales and Office Occupations
The most common Sales and Office occupations in Indian Hills are Office & Administration (102 | 11.7%), and Sales & Related (39 | 4.5%).
Sales and Office Occupations by Sex
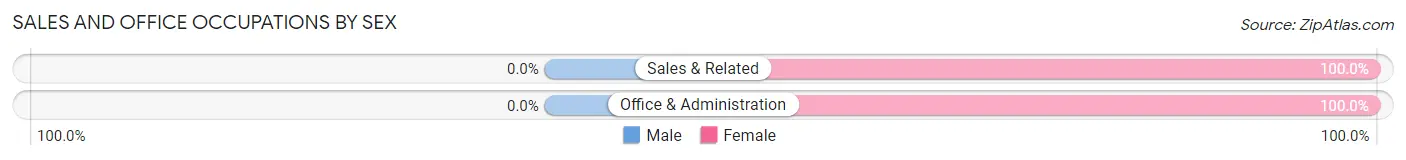
| Occupation | Male | Female |
| Sales & Related | 0 (0.0%) | 39 (100.0%) |
| Office & Administration | 0 (0.0%) | 102 (100.0%) |
| Total (Category) | 0 (0.0%) | 141 (100.0%) |
| Total (Overall) | 386 (44.4%) | 483 (55.6%) |
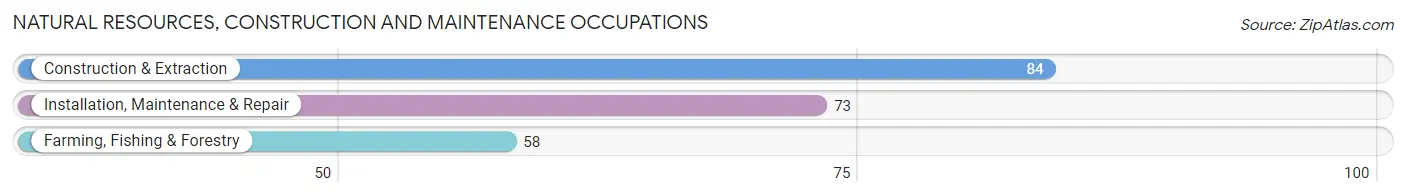
Natural Resources, Construction and Maintenance Occupations
The most common Natural Resources, Construction and Maintenance occupations in Indian Hills are Construction & Extraction (84 | 9.7%), Installation, Maintenance & Repair (73 | 8.4%), and Farming, Fishing & Forestry (58 | 6.7%).
Natural Resources, Construction and Maintenance Occupations by Sex
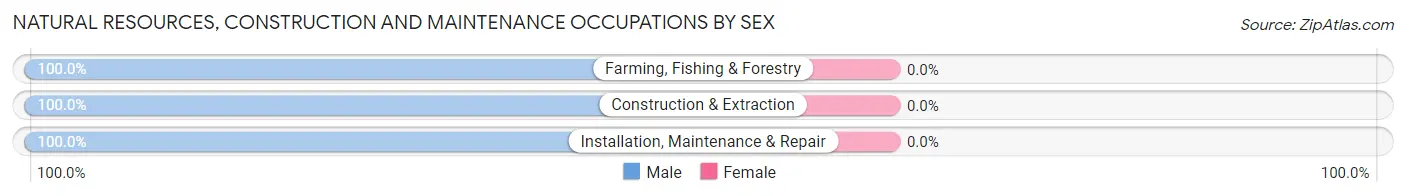
| Occupation | Male | Female |
| Farming, Fishing & Forestry | 58 (100.0%) | 0 (0.0%) |
| Construction & Extraction | 84 (100.0%) | 0 (0.0%) |
| Installation, Maintenance & Repair | 73 (100.0%) | 0 (0.0%) |
| Total (Category) | 215 (100.0%) | 0 (0.0%) |
| Total (Overall) | 386 (44.4%) | 483 (55.6%) |
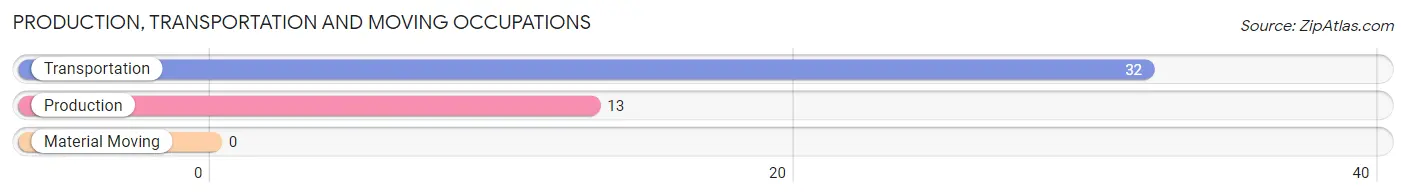
Production, Transportation and Moving Occupations
The most common Production, Transportation and Moving occupations in Indian Hills are Transportation (32 | 3.7%), and Production (13 | 1.5%).
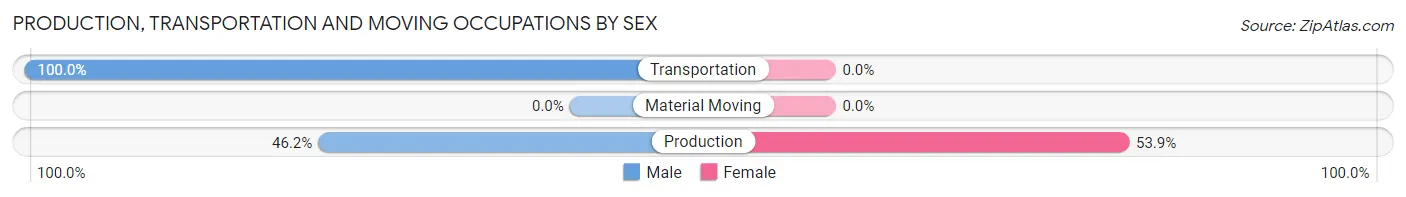
Production, Transportation and Moving Occupations by Sex
| Occupation | Male | Female |
| Production | 6 (46.2%) | 7 (53.8%) |
| Transportation | 32 (100.0%) | 0 (0.0%) |
| Material Moving | 0 (0.0%) | 0 (0.0%) |
| Total (Category) | 38 (84.4%) | 7 (15.6%) |
| Total (Overall) | 386 (44.4%) | 483 (55.6%) |
Employment Industries by Sex in Indian Hills
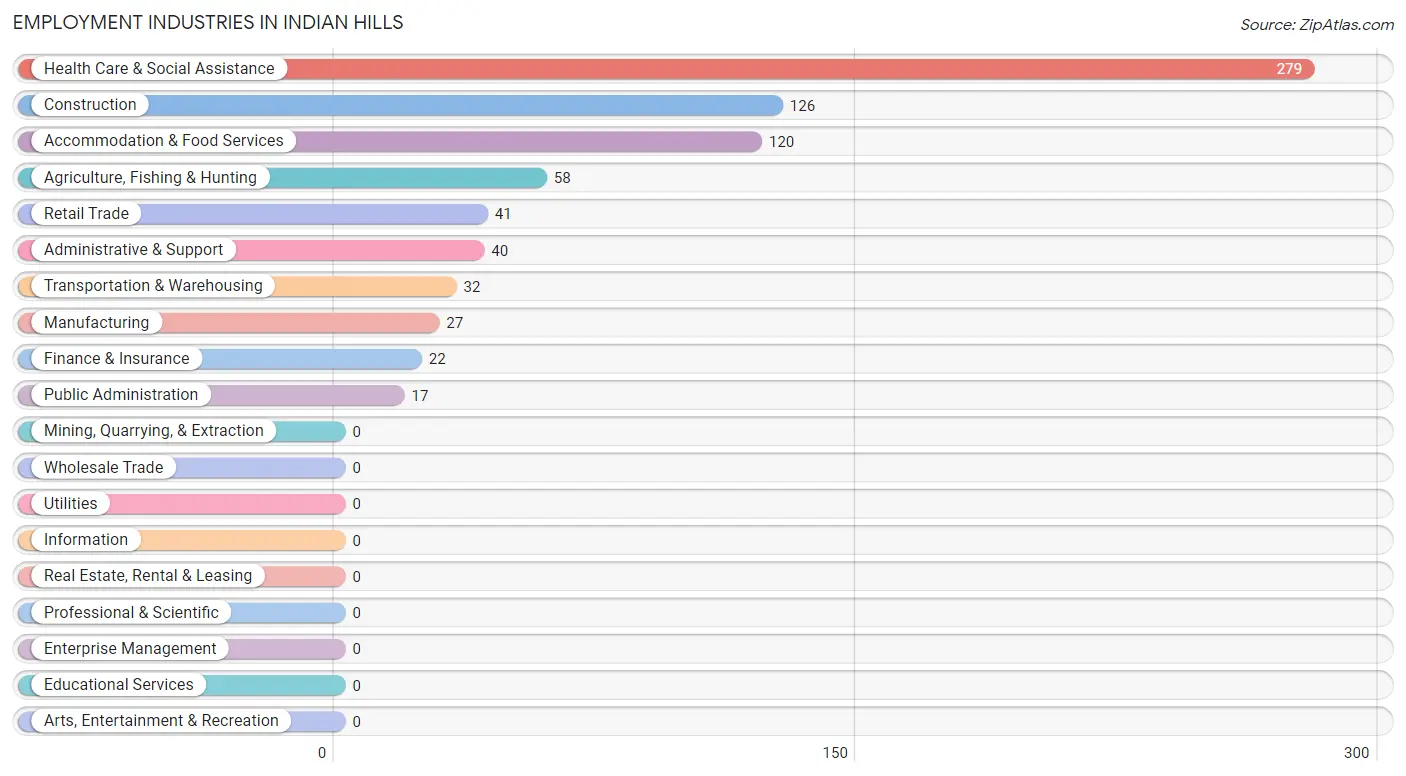
Employment Industries in Indian Hills
The major employment industries in Indian Hills include Health Care & Social Assistance (279 | 32.1%), Construction (126 | 14.5%), Accommodation & Food Services (120 | 13.8%), Agriculture, Fishing & Hunting (58 | 6.7%), and Retail Trade (41 | 4.7%).
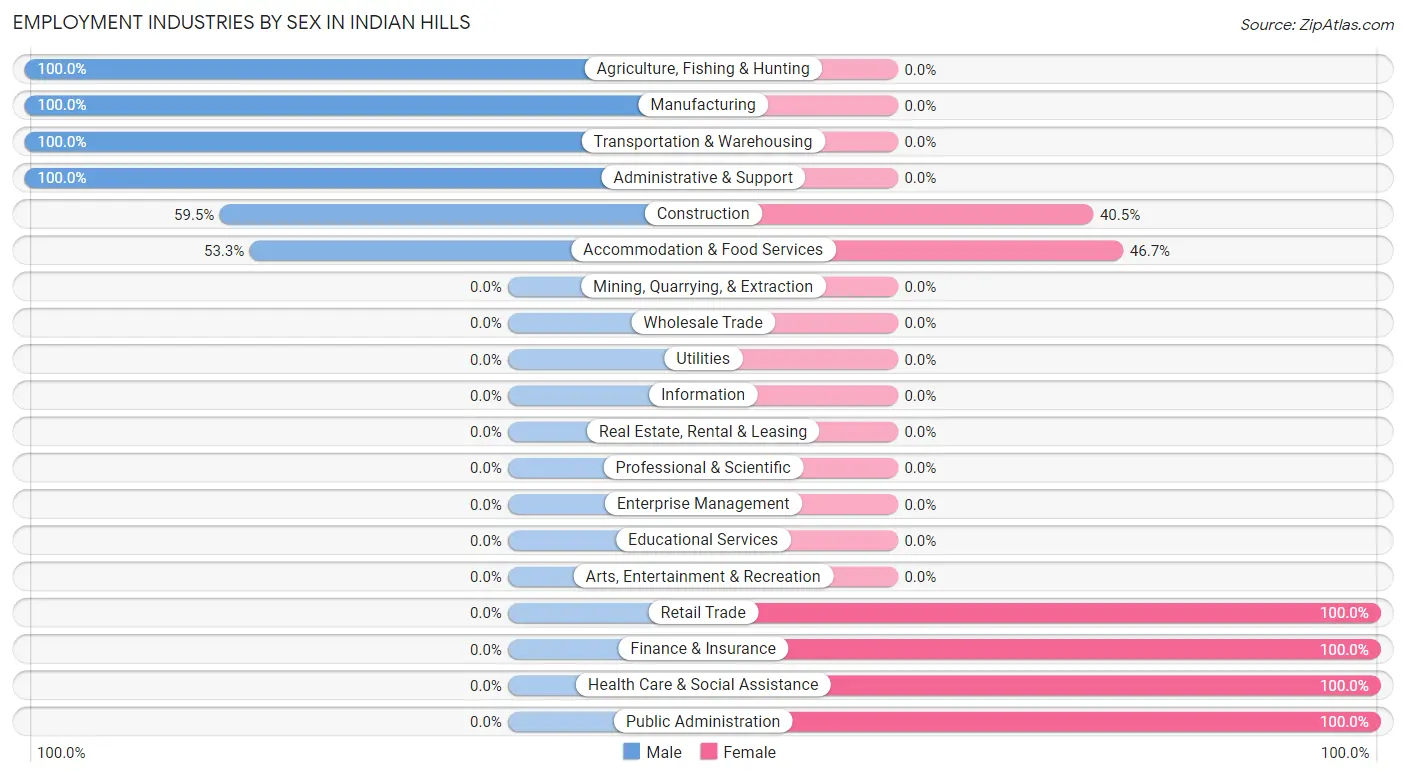
Employment Industries by Sex in Indian Hills
The Indian Hills industries that see more men than women are Agriculture, Fishing & Hunting (100.0%), Manufacturing (100.0%), and Transportation & Warehousing (100.0%), whereas the industries that tend to have a higher number of women are Retail Trade (100.0%), Finance & Insurance (100.0%), and Health Care & Social Assistance (100.0%).
| Industry | Male | Female |
| Agriculture, Fishing & Hunting | 58 (100.0%) | 0 (0.0%) |
| Mining, Quarrying, & Extraction | 0 (0.0%) | 0 (0.0%) |
| Construction | 75 (59.5%) | 51 (40.5%) |
| Manufacturing | 27 (100.0%) | 0 (0.0%) |
| Wholesale Trade | 0 (0.0%) | 0 (0.0%) |
| Retail Trade | 0 (0.0%) | 41 (100.0%) |
| Transportation & Warehousing | 32 (100.0%) | 0 (0.0%) |
| Utilities | 0 (0.0%) | 0 (0.0%) |
| Information | 0 (0.0%) | 0 (0.0%) |
| Finance & Insurance | 0 (0.0%) | 22 (100.0%) |
| Real Estate, Rental & Leasing | 0 (0.0%) | 0 (0.0%) |
| Professional & Scientific | 0 (0.0%) | 0 (0.0%) |
| Enterprise Management | 0 (0.0%) | 0 (0.0%) |
| Administrative & Support | 40 (100.0%) | 0 (0.0%) |
| Educational Services | 0 (0.0%) | 0 (0.0%) |
| Health Care & Social Assistance | 0 (0.0%) | 279 (100.0%) |
| Arts, Entertainment & Recreation | 0 (0.0%) | 0 (0.0%) |
| Accommodation & Food Services | 64 (53.3%) | 56 (46.7%) |
| Public Administration | 0 (0.0%) | 17 (100.0%) |
| Total | 386 (44.4%) | 483 (55.6%) |
Education in Indian Hills
School Enrollment in Indian Hills
The most common levels of schooling among the 1,064 students in Indian Hills are elementary school (345 | 32.4%), high school (342 | 32.1%), and middle school (244 | 22.9%).
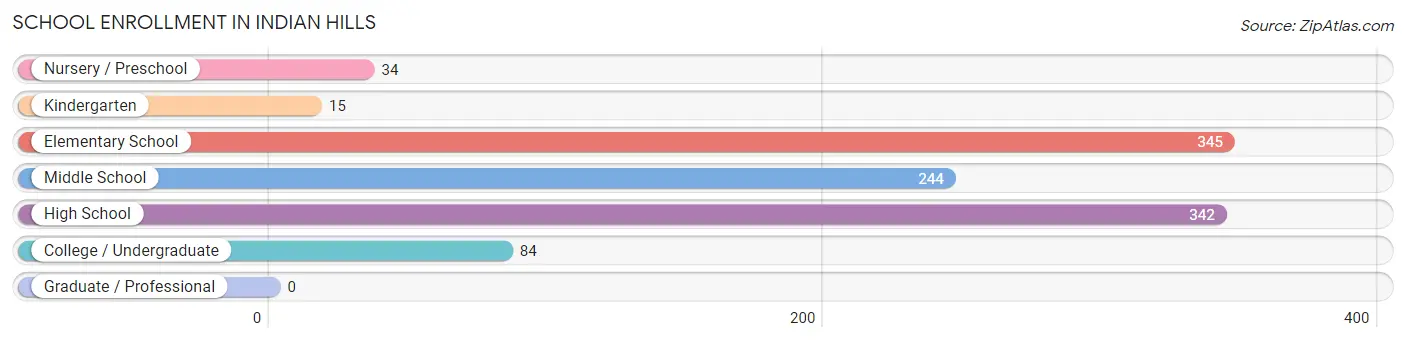
| School Level | # Students | % Students |
| Nursery / Preschool | 34 | 3.2% |
| Kindergarten | 15 | 1.4% |
| Elementary School | 345 | 32.4% |
| Middle School | 244 | 22.9% |
| High School | 342 | 32.1% |
| College / Undergraduate | 84 | 7.9% |
| Graduate / Professional | 0 | 0.0% |
| Total | 1,064 | 100.0% |
School Enrollment by Age by Funding Source in Indian Hills
Out of a total of 1,064 students who are enrolled in schools in Indian Hills, 33 (3.1%) attend a private institution, while the remaining 1,031 (96.9%) are enrolled in public schools. The age group of 20 to 24 year olds has the highest likelihood of being enrolled in private schools, with 33 (61.1% in the age bracket) enrolled. Conversely, the age group of 3 to 4 year olds has the lowest likelihood of being enrolled in a private school, with 26 (100.0% in the age bracket) attending a public institution.
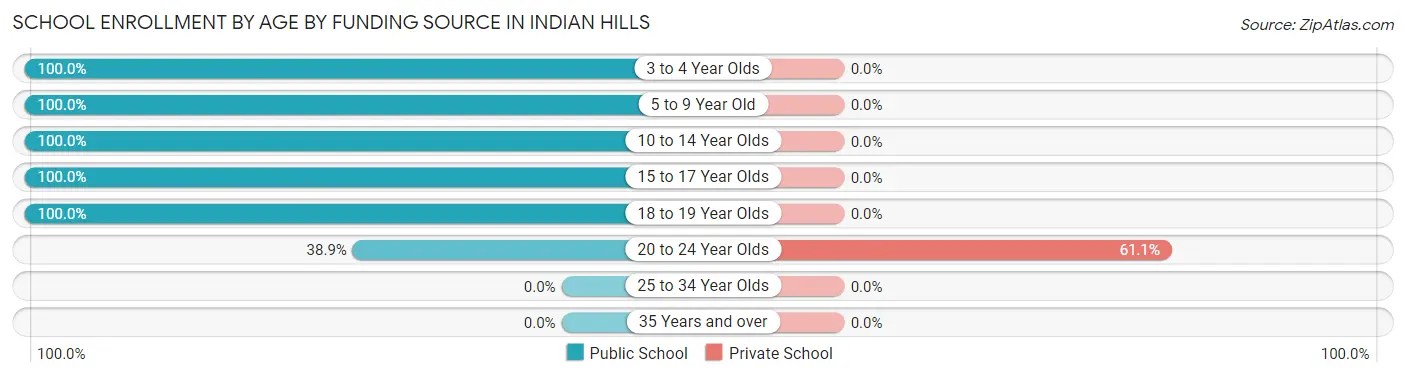
| Age Bracket | Public School | Private School |
| 3 to 4 Year Olds | 26 (100.0%) | 0 (0.0%) |
| 5 to 9 Year Old | 265 (100.0%) | 0 (0.0%) |
| 10 to 14 Year Olds | 328 (100.0%) | 0 (0.0%) |
| 15 to 17 Year Olds | 201 (100.0%) | 0 (0.0%) |
| 18 to 19 Year Olds | 190 (100.0%) | 0 (0.0%) |
| 20 to 24 Year Olds | 21 (38.9%) | 33 (61.1%) |
| 25 to 34 Year Olds | 0 (0.0%) | 0 (0.0%) |
| 35 Years and over | 0 (0.0%) | 0 (0.0%) |
| Total | 1,031 (96.9%) | 33 (3.1%) |
Educational Attainment by Field of Study in Indian Hills
Education (47 | 40.2%), engineering (30 | 25.6%), social sciences (20 | 17.1%), and literature & languages (20 | 17.1%) are the most common fields of study among 117 individuals in Indian Hills who have obtained a bachelor's degree or higher.
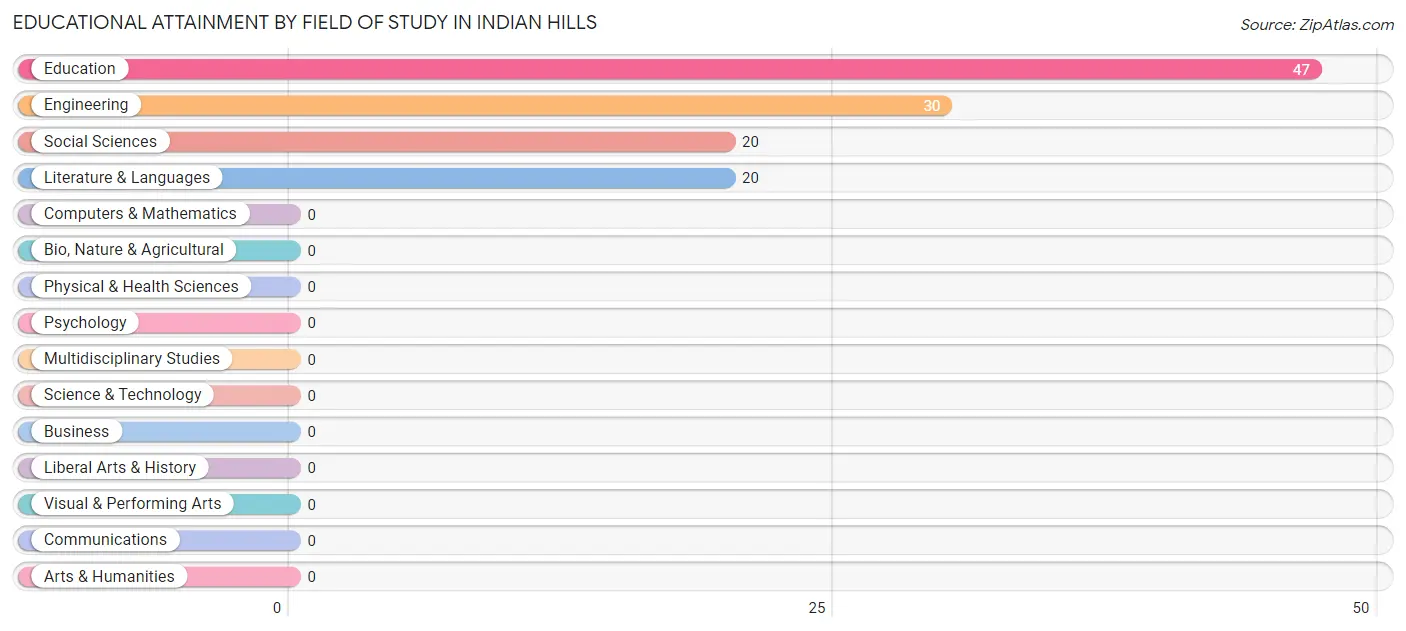
| Field of Study | # Graduates | % Graduates |
| Computers & Mathematics | 0 | 0.0% |
| Bio, Nature & Agricultural | 0 | 0.0% |
| Physical & Health Sciences | 0 | 0.0% |
| Psychology | 0 | 0.0% |
| Social Sciences | 20 | 17.1% |
| Engineering | 30 | 25.6% |
| Multidisciplinary Studies | 0 | 0.0% |
| Science & Technology | 0 | 0.0% |
| Business | 0 | 0.0% |
| Education | 47 | 40.2% |
| Literature & Languages | 20 | 17.1% |
| Liberal Arts & History | 0 | 0.0% |
| Visual & Performing Arts | 0 | 0.0% |
| Communications | 0 | 0.0% |
| Arts & Humanities | 0 | 0.0% |
| Total | 117 | 100.0% |
Transportation & Commute in Indian Hills
Vehicle Availability by Sex in Indian Hills
The most prevalent vehicle ownership categories in Indian Hills are males with 2 vehicles (274, accounting for 71.0%) and females with 2 vehicles (284, making up 56.7%).
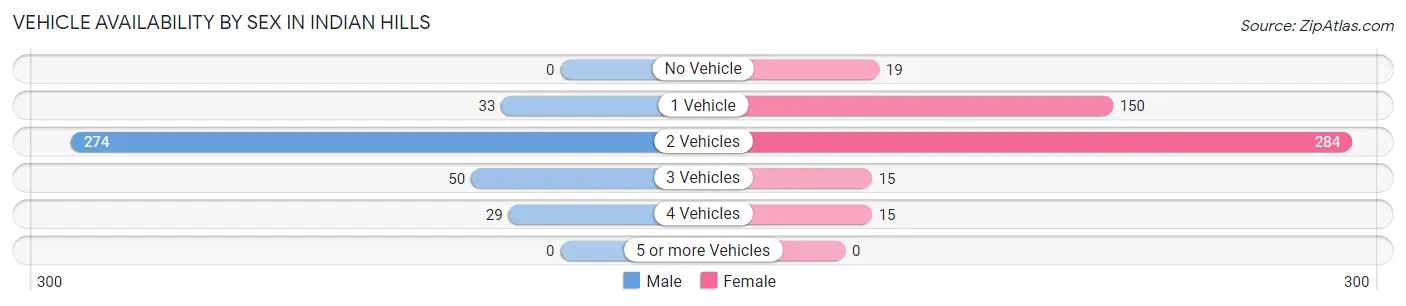
| Vehicles Available | Male | Female |
| No Vehicle | 0 (0.0%) | 19 (3.9%) |
| 1 Vehicle | 33 (8.6%) | 150 (31.1%) |
| 2 Vehicles | 274 (71.0%) | 284 (58.8%) |
| 3 Vehicles | 50 (13.0%) | 15 (3.1%) |
| 4 Vehicles | 29 (7.5%) | 15 (3.1%) |
| 5 or more Vehicles | 0 (0.0%) | 0 (0.0%) |
| Total | 386 (100.0%) | 483 (100.0%) |
Commute Time in Indian Hills
The most frequently occuring commute durations in Indian Hills are 30 to 34 minutes (183 commuters, 26.4%), 25 to 29 minutes (97 commuters, 14.0%), and 15 to 19 minutes (91 commuters, 13.1%).
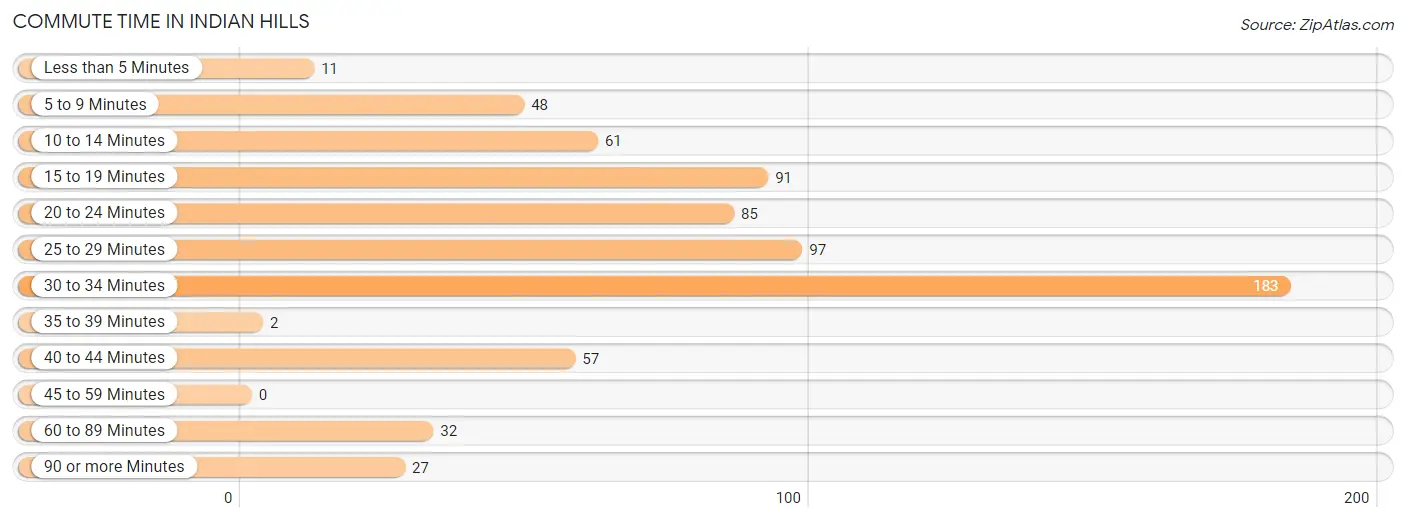
| Commute Time | # Commuters | % Commuters |
| Less than 5 Minutes | 11 | 1.6% |
| 5 to 9 Minutes | 48 | 6.9% |
| 10 to 14 Minutes | 61 | 8.8% |
| 15 to 19 Minutes | 91 | 13.1% |
| 20 to 24 Minutes | 85 | 12.2% |
| 25 to 29 Minutes | 97 | 14.0% |
| 30 to 34 Minutes | 183 | 26.4% |
| 35 to 39 Minutes | 2 | 0.3% |
| 40 to 44 Minutes | 57 | 8.2% |
| 45 to 59 Minutes | 0 | 0.0% |
| 60 to 89 Minutes | 32 | 4.6% |
| 90 or more Minutes | 27 | 3.9% |
Commute Time by Sex in Indian Hills
The most common commute times in Indian Hills are 40 to 44 minutes (57 commuters, 23.4%) for males and 30 to 34 minutes (175 commuters, 38.9%) for females.
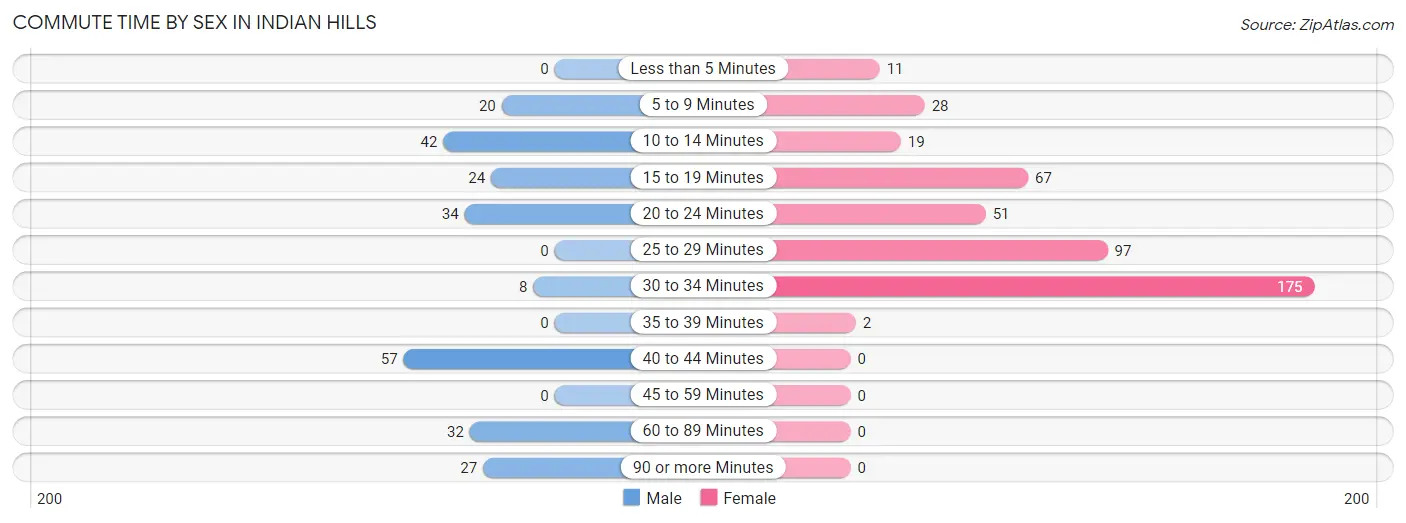
| Commute Time | Male | Female |
| Less than 5 Minutes | 0 (0.0%) | 11 (2.4%) |
| 5 to 9 Minutes | 20 (8.2%) | 28 (6.2%) |
| 10 to 14 Minutes | 42 (17.2%) | 19 (4.2%) |
| 15 to 19 Minutes | 24 (9.8%) | 67 (14.9%) |
| 20 to 24 Minutes | 34 (13.9%) | 51 (11.3%) |
| 25 to 29 Minutes | 0 (0.0%) | 97 (21.6%) |
| 30 to 34 Minutes | 8 (3.3%) | 175 (38.9%) |
| 35 to 39 Minutes | 0 (0.0%) | 2 (0.4%) |
| 40 to 44 Minutes | 57 (23.4%) | 0 (0.0%) |
| 45 to 59 Minutes | 0 (0.0%) | 0 (0.0%) |
| 60 to 89 Minutes | 32 (13.1%) | 0 (0.0%) |
| 90 or more Minutes | 27 (11.1%) | 0 (0.0%) |
Time of Departure to Work by Sex in Indian Hills
The most frequent times of departure to work in Indian Hills are 7:00 AM to 7:29 AM (46, 18.9%) for males and 6:00 AM to 6:29 AM (126, 28.0%) for females.
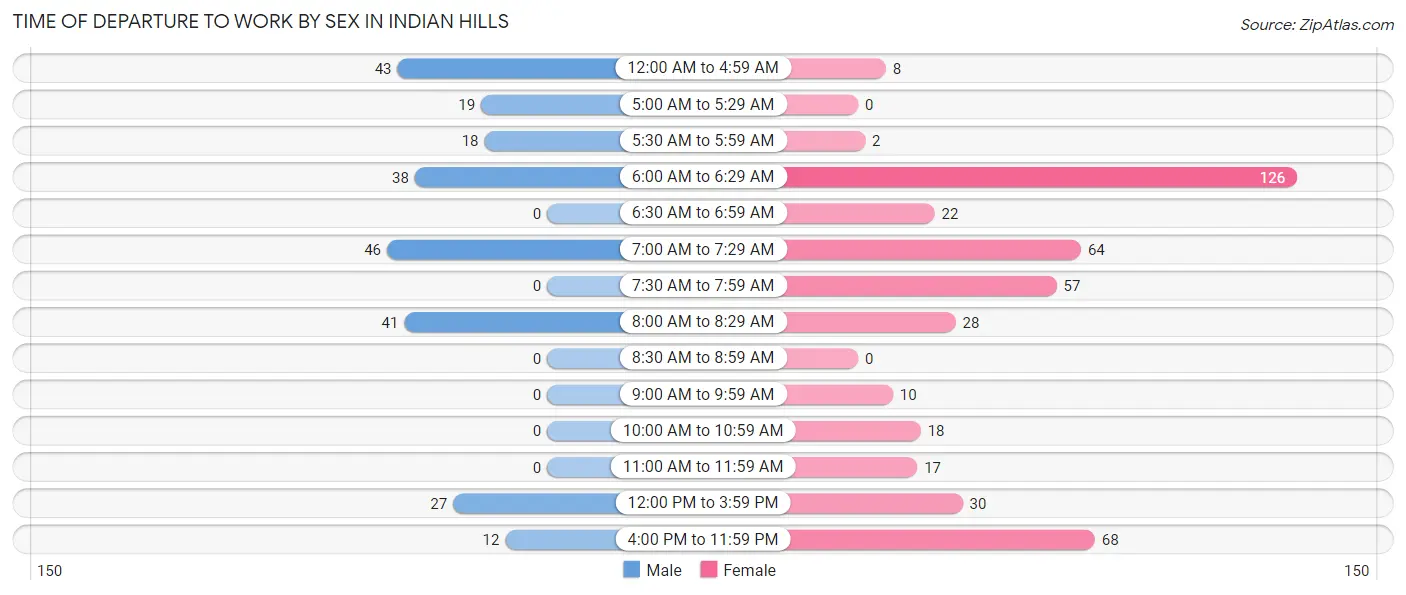
| Time of Departure | Male | Female |
| 12:00 AM to 4:59 AM | 43 (17.6%) | 8 (1.8%) |
| 5:00 AM to 5:29 AM | 19 (7.8%) | 0 (0.0%) |
| 5:30 AM to 5:59 AM | 18 (7.4%) | 2 (0.4%) |
| 6:00 AM to 6:29 AM | 38 (15.6%) | 126 (28.0%) |
| 6:30 AM to 6:59 AM | 0 (0.0%) | 22 (4.9%) |
| 7:00 AM to 7:29 AM | 46 (18.9%) | 64 (14.2%) |
| 7:30 AM to 7:59 AM | 0 (0.0%) | 57 (12.7%) |
| 8:00 AM to 8:29 AM | 41 (16.8%) | 28 (6.2%) |
| 8:30 AM to 8:59 AM | 0 (0.0%) | 0 (0.0%) |
| 9:00 AM to 9:59 AM | 0 (0.0%) | 10 (2.2%) |
| 10:00 AM to 10:59 AM | 0 (0.0%) | 18 (4.0%) |
| 11:00 AM to 11:59 AM | 0 (0.0%) | 17 (3.8%) |
| 12:00 PM to 3:59 PM | 27 (11.1%) | 30 (6.7%) |
| 4:00 PM to 11:59 PM | 12 (4.9%) | 68 (15.1%) |
| Total | 244 (100.0%) | 450 (100.0%) |
Housing Occupancy in Indian Hills
Occupancy by Ownership in Indian Hills
Of the total 732 dwellings in Indian Hills, owner-occupied units account for 664 (90.7%), while renter-occupied units make up 68 (9.3%).
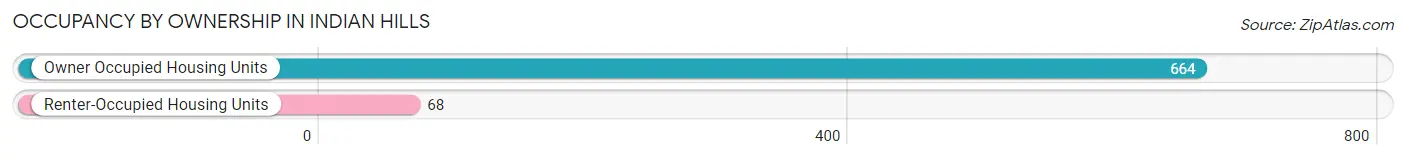
| Occupancy | # Housing Units | % Housing Units |
| Owner Occupied Housing Units | 664 | 90.7% |
| Renter-Occupied Housing Units | 68 | 9.3% |
| Total Occupied Housing Units | 732 | 100.0% |
Occupancy by Household Size in Indian Hills
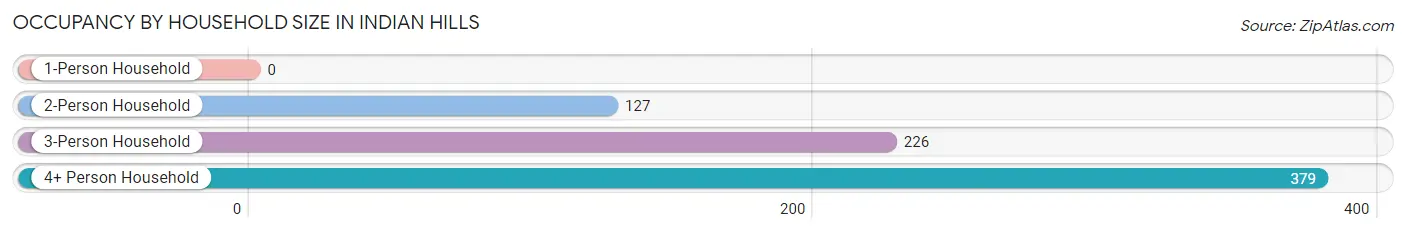
| Household Size | # Housing Units | % Housing Units |
| 1-Person Household | 0 | 0.0% |
| 2-Person Household | 127 | 17.3% |
| 3-Person Household | 226 | 30.9% |
| 4+ Person Household | 379 | 51.8% |
| Total Housing Units | 732 | 100.0% |
Occupancy by Ownership by Household Size in Indian Hills
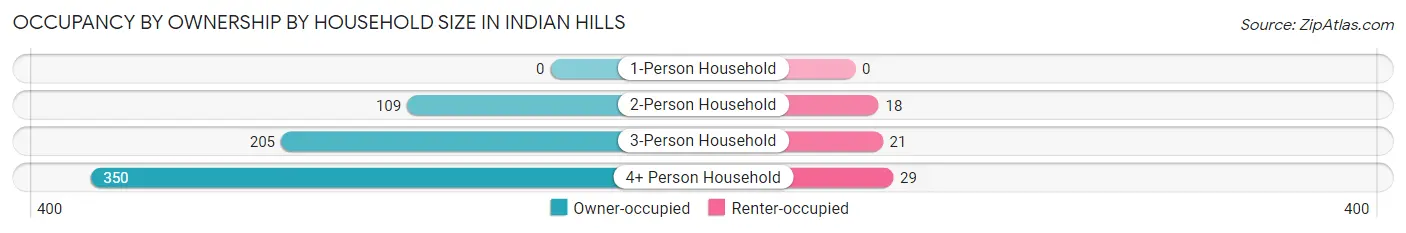
| Household Size | Owner-occupied | Renter-occupied |
| 1-Person Household | 0 (0.0%) | 0 (0.0%) |
| 2-Person Household | 109 (85.8%) | 18 (14.2%) |
| 3-Person Household | 205 (90.7%) | 21 (9.3%) |
| 4+ Person Household | 350 (92.3%) | 29 (7.6%) |
| Total Housing Units | 664 (90.7%) | 68 (9.3%) |
Occupancy by Educational Attainment in Indian Hills
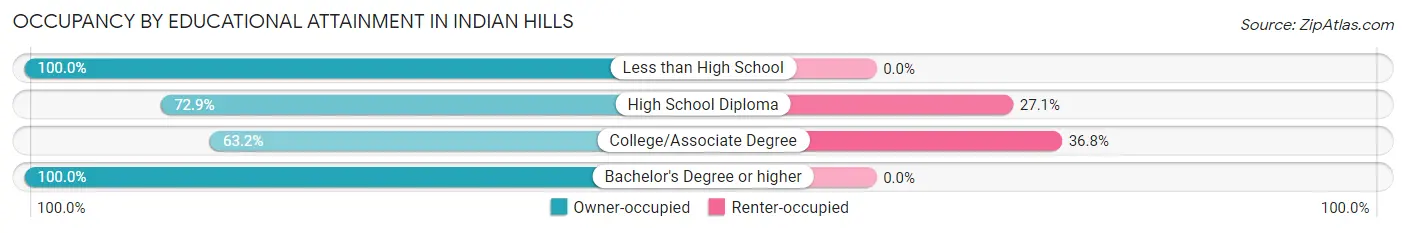
| Household Size | Owner-occupied | Renter-occupied |
| Less than High School | 489 (100.0%) | 0 (0.0%) |
| High School Diploma | 78 (72.9%) | 29 (27.1%) |
| College/Associate Degree | 67 (63.2%) | 39 (36.8%) |
| Bachelor's Degree or higher | 30 (100.0%) | 0 (0.0%) |
Occupancy by Age of Householder in Indian Hills
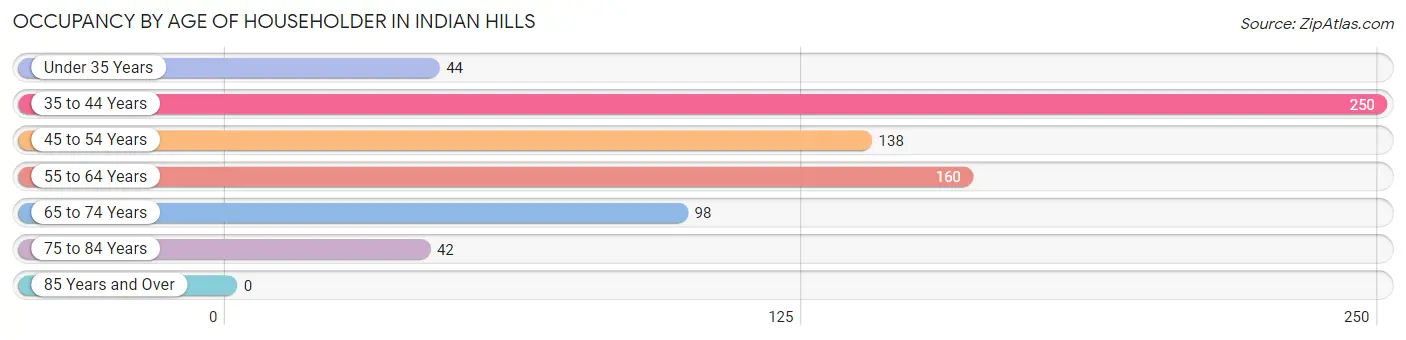
| Age Bracket | # Households | % Households |
| Under 35 Years | 44 | 6.0% |
| 35 to 44 Years | 250 | 34.2% |
| 45 to 54 Years | 138 | 18.9% |
| 55 to 64 Years | 160 | 21.9% |
| 65 to 74 Years | 98 | 13.4% |
| 75 to 84 Years | 42 | 5.7% |
| 85 Years and Over | 0 | 0.0% |
| Total | 732 | 100.0% |
Housing Finances in Indian Hills
Median Income by Occupancy in Indian Hills
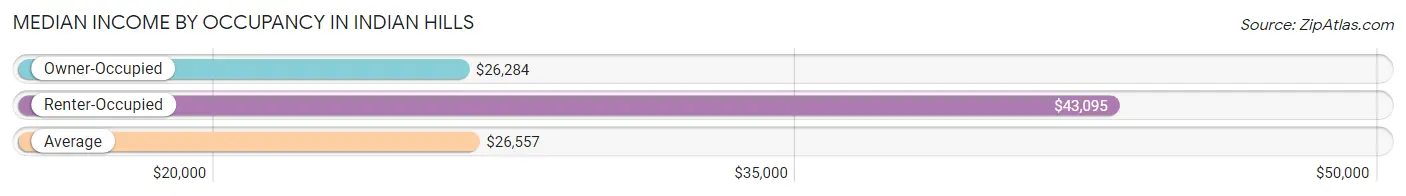
| Occupancy Type | # Households | Median Income |
| Owner-Occupied | 664 (90.7%) | $26,284 |
| Renter-Occupied | 68 (9.3%) | $43,095 |
| Average | 732 (100.0%) | $26,557 |
Occupancy by Householder Income Bracket in Indian Hills
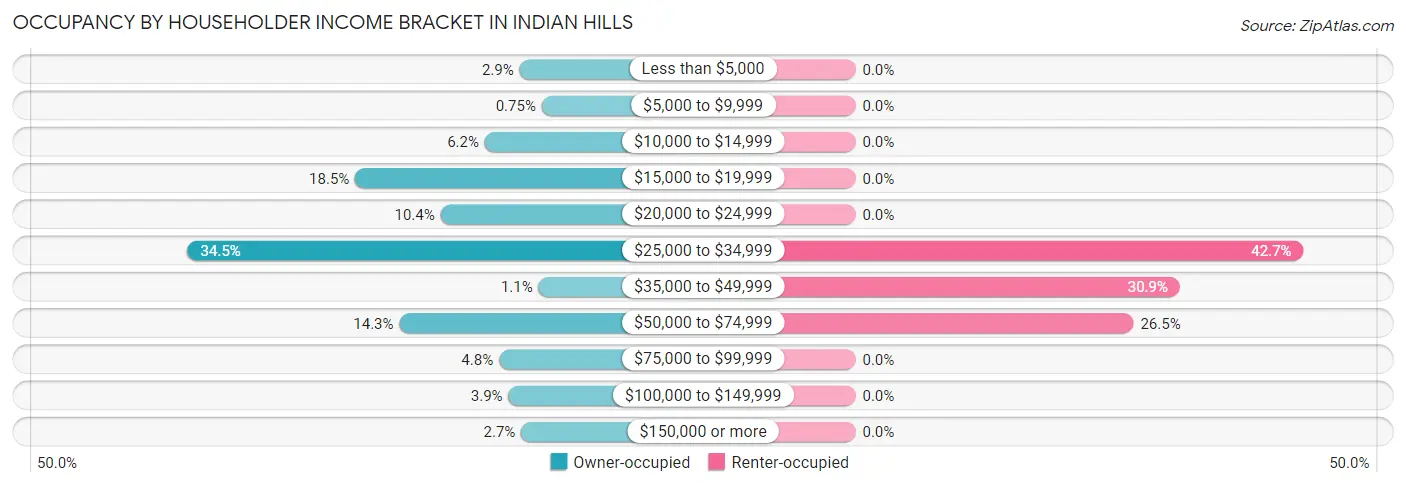
| Income Bracket | Owner-occupied | Renter-occupied |
| Less than $5,000 | 19 (2.9%) | 0 (0.0%) |
| $5,000 to $9,999 | 5 (0.7%) | 0 (0.0%) |
| $10,000 to $14,999 | 41 (6.2%) | 0 (0.0%) |
| $15,000 to $19,999 | 123 (18.5%) | 0 (0.0%) |
| $20,000 to $24,999 | 69 (10.4%) | 0 (0.0%) |
| $25,000 to $34,999 | 229 (34.5%) | 29 (42.6%) |
| $35,000 to $49,999 | 7 (1.1%) | 21 (30.9%) |
| $50,000 to $74,999 | 95 (14.3%) | 18 (26.5%) |
| $75,000 to $99,999 | 32 (4.8%) | 0 (0.0%) |
| $100,000 to $149,999 | 26 (3.9%) | 0 (0.0%) |
| $150,000 or more | 18 (2.7%) | 0 (0.0%) |
| Total | 664 (100.0%) | 68 (100.0%) |
Monthly Housing Cost Tiers in Indian Hills
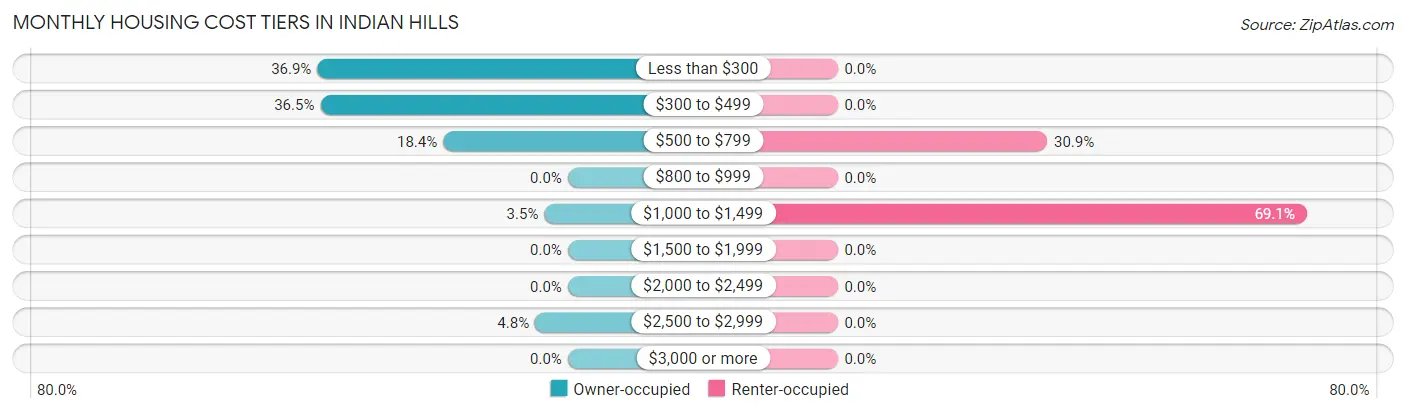
| Monthly Cost | Owner-occupied | Renter-occupied |
| Less than $300 | 245 (36.9%) | 0 (0.0%) |
| $300 to $499 | 242 (36.4%) | 0 (0.0%) |
| $500 to $799 | 122 (18.4%) | 21 (30.9%) |
| $800 to $999 | 0 (0.0%) | 0 (0.0%) |
| $1,000 to $1,499 | 23 (3.5%) | 47 (69.1%) |
| $1,500 to $1,999 | 0 (0.0%) | 0 (0.0%) |
| $2,000 to $2,499 | 0 (0.0%) | 0 (0.0%) |
| $2,500 to $2,999 | 32 (4.8%) | 0 (0.0%) |
| $3,000 or more | 0 (0.0%) | 0 (0.0%) |
| Total | 664 (100.0%) | 68 (100.0%) |
Physical Housing Characteristics in Indian Hills
Housing Structures in Indian Hills
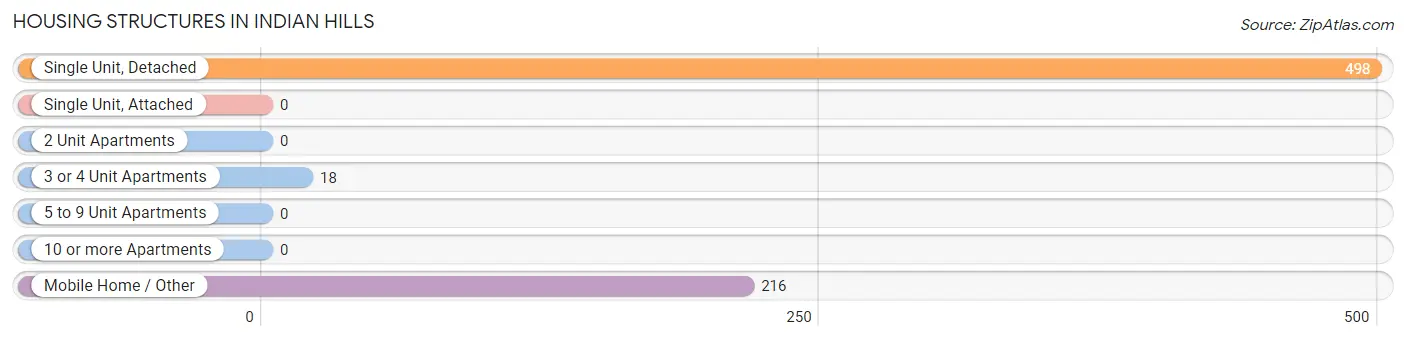
| Structure Type | # Housing Units | % Housing Units |
| Single Unit, Detached | 498 | 68.0% |
| Single Unit, Attached | 0 | 0.0% |
| 2 Unit Apartments | 0 | 0.0% |
| 3 or 4 Unit Apartments | 18 | 2.5% |
| 5 to 9 Unit Apartments | 0 | 0.0% |
| 10 or more Apartments | 0 | 0.0% |
| Mobile Home / Other | 216 | 29.5% |
| Total | 732 | 100.0% |
Housing Structures by Occupancy in Indian Hills
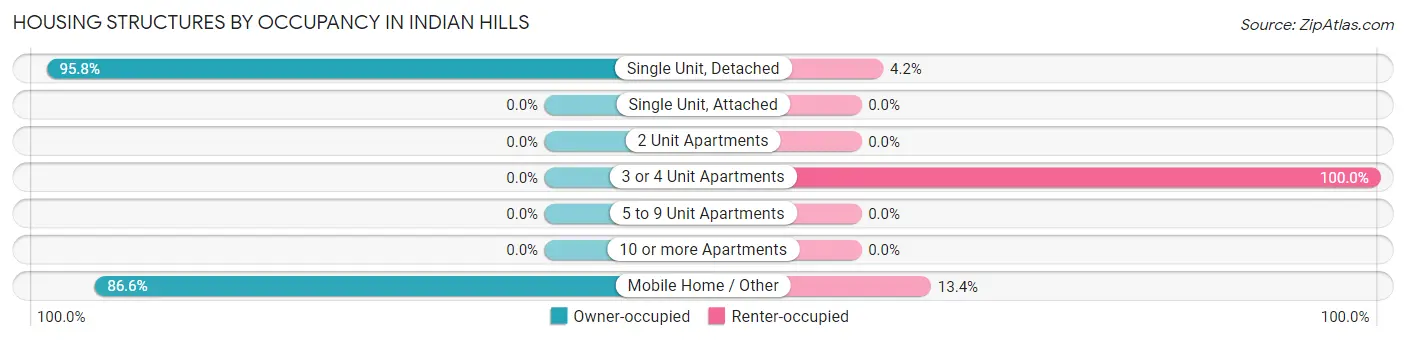
| Structure Type | Owner-occupied | Renter-occupied |
| Single Unit, Detached | 477 (95.8%) | 21 (4.2%) |
| Single Unit, Attached | 0 (0.0%) | 0 (0.0%) |
| 2 Unit Apartments | 0 (0.0%) | 0 (0.0%) |
| 3 or 4 Unit Apartments | 0 (0.0%) | 18 (100.0%) |
| 5 to 9 Unit Apartments | 0 (0.0%) | 0 (0.0%) |
| 10 or more Apartments | 0 (0.0%) | 0 (0.0%) |
| Mobile Home / Other | 187 (86.6%) | 29 (13.4%) |
| Total | 664 (90.7%) | 68 (9.3%) |
Housing Structures by Number of Rooms in Indian Hills
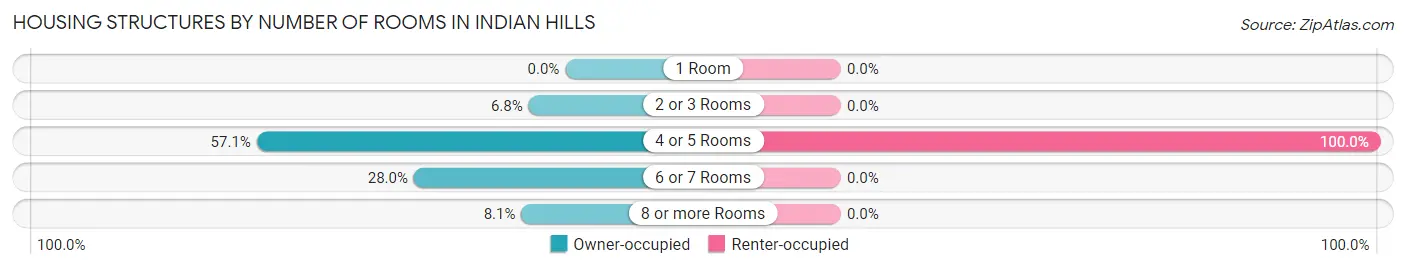
| Number of Rooms | Owner-occupied | Renter-occupied |
| 1 Room | 0 (0.0%) | 0 (0.0%) |
| 2 or 3 Rooms | 45 (6.8%) | 0 (0.0%) |
| 4 or 5 Rooms | 379 (57.1%) | 68 (100.0%) |
| 6 or 7 Rooms | 186 (28.0%) | 0 (0.0%) |
| 8 or more Rooms | 54 (8.1%) | 0 (0.0%) |
| Total | 664 (100.0%) | 68 (100.0%) |
Housing Structure by Heating Type in Indian Hills
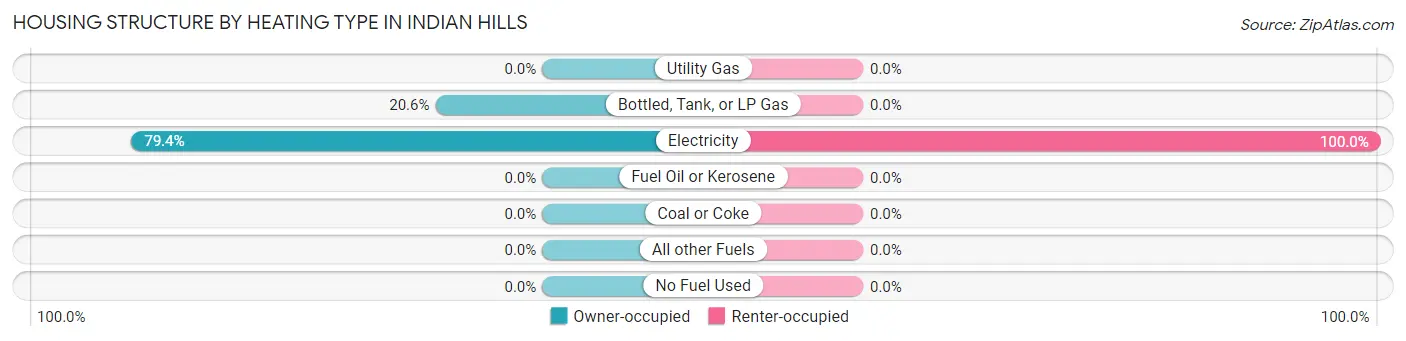
| Heating Type | Owner-occupied | Renter-occupied |
| Utility Gas | 0 (0.0%) | 0 (0.0%) |
| Bottled, Tank, or LP Gas | 137 (20.6%) | 0 (0.0%) |
| Electricity | 527 (79.4%) | 68 (100.0%) |
| Fuel Oil or Kerosene | 0 (0.0%) | 0 (0.0%) |
| Coal or Coke | 0 (0.0%) | 0 (0.0%) |
| All other Fuels | 0 (0.0%) | 0 (0.0%) |
| No Fuel Used | 0 (0.0%) | 0 (0.0%) |
| Total | 664 (100.0%) | 68 (100.0%) |
Household Vehicle Usage in Indian Hills
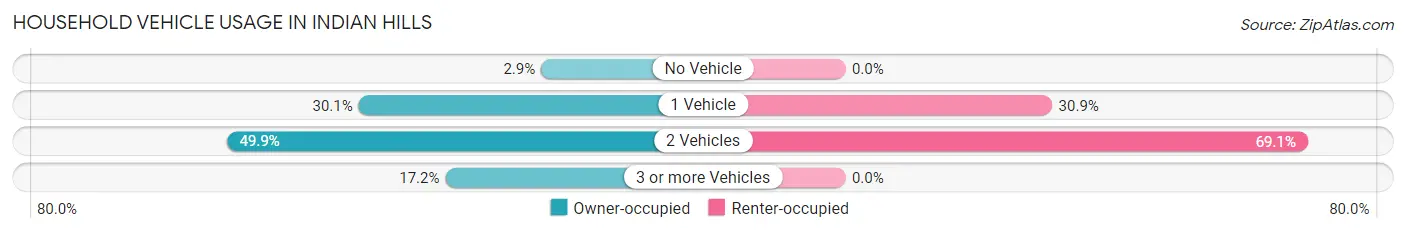
| Vehicles per Household | Owner-occupied | Renter-occupied |
| No Vehicle | 19 (2.9%) | 0 (0.0%) |
| 1 Vehicle | 200 (30.1%) | 21 (30.9%) |
| 2 Vehicles | 331 (49.8%) | 47 (69.1%) |
| 3 or more Vehicles | 114 (17.2%) | 0 (0.0%) |
| Total | 664 (100.0%) | 68 (100.0%) |
Real Estate & Mortgages in Indian Hills
Real Estate and Mortgage Overview in Indian Hills
| Characteristic | Without Mortgage | With Mortgage |
| Housing Units | 581 | 83 |
| Median Property Value | $49,400 | $114,700 |
| Median Household Income | $25,681 | $0 |
| Monthly Housing Costs | $339 | $0 |
| Real Estate Taxes | $631 | $0 |
Property Value by Mortgage Status in Indian Hills
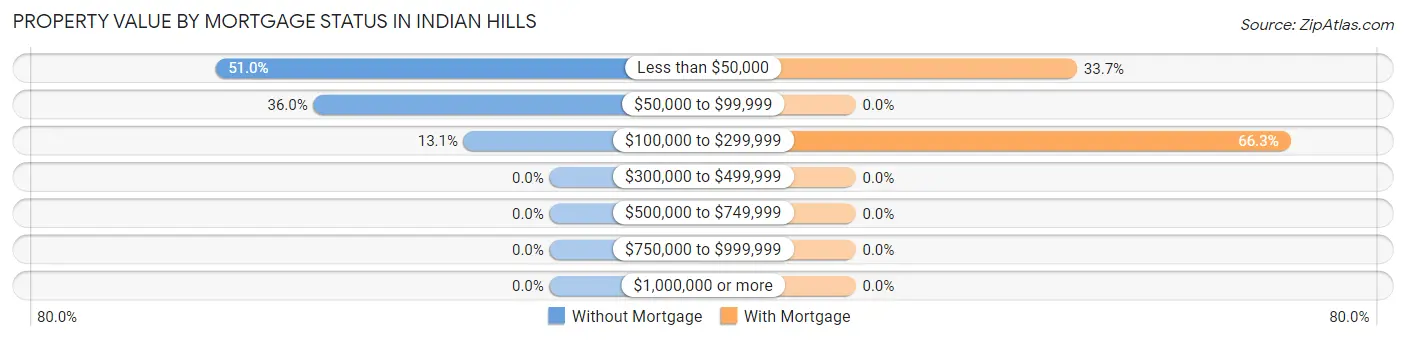
| Property Value | Without Mortgage | With Mortgage |
| Less than $50,000 | 296 (50.9%) | 28 (33.7%) |
| $50,000 to $99,999 | 209 (36.0%) | 0 (0.0%) |
| $100,000 to $299,999 | 76 (13.1%) | 55 (66.3%) |
| $300,000 to $499,999 | 0 (0.0%) | 0 (0.0%) |
| $500,000 to $749,999 | 0 (0.0%) | 0 (0.0%) |
| $750,000 to $999,999 | 0 (0.0%) | 0 (0.0%) |
| $1,000,000 or more | 0 (0.0%) | 0 (0.0%) |
| Total | 581 (100.0%) | 83 (100.0%) |
Household Income by Mortgage Status in Indian Hills
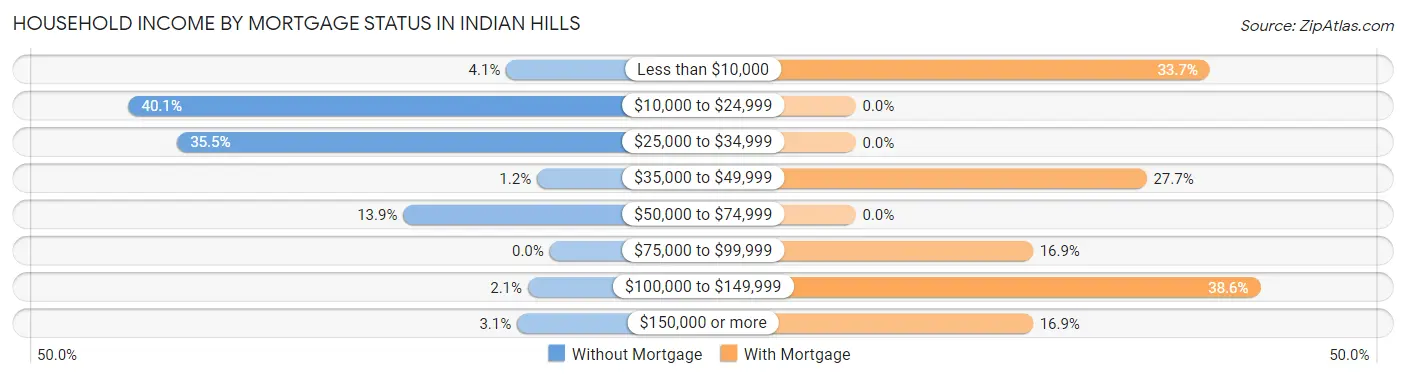
| Household Income | Without Mortgage | With Mortgage |
| Less than $10,000 | 24 (4.1%) | 28 (33.7%) |
| $10,000 to $24,999 | 233 (40.1%) | 0 (0.0%) |
| $25,000 to $34,999 | 206 (35.5%) | 0 (0.0%) |
| $35,000 to $49,999 | 7 (1.2%) | 23 (27.7%) |
| $50,000 to $74,999 | 81 (13.9%) | 0 (0.0%) |
| $75,000 to $99,999 | 0 (0.0%) | 14 (16.9%) |
| $100,000 to $149,999 | 12 (2.1%) | 32 (38.6%) |
| $150,000 or more | 18 (3.1%) | 14 (16.9%) |
| Total | 581 (100.0%) | 83 (100.0%) |
Property Value to Household Income Ratio in Indian Hills
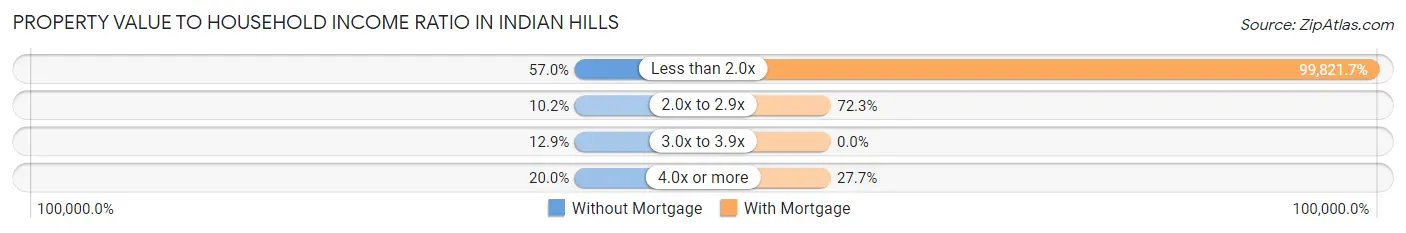
| Value-to-Income Ratio | Without Mortgage | With Mortgage |
| Less than 2.0x | 331 (57.0%) | 82,852 (99,821.7%) |
| 2.0x to 2.9x | 59 (10.2%) | 60 (72.3%) |
| 3.0x to 3.9x | 75 (12.9%) | 0 (0.0%) |
| 4.0x or more | 116 (20.0%) | 23 (27.7%) |
| Total | 581 (100.0%) | 83 (100.0%) |
Real Estate Taxes by Mortgage Status in Indian Hills
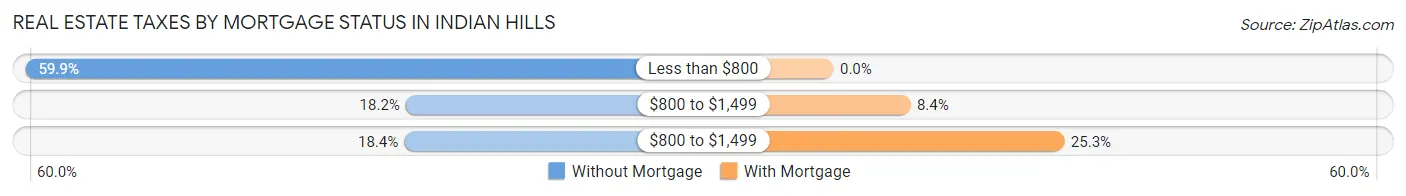
| Property Taxes | Without Mortgage | With Mortgage |
| Less than $800 | 348 (59.9%) | 0 (0.0%) |
| $800 to $1,499 | 106 (18.2%) | 7 (8.4%) |
| $800 to $1,499 | 107 (18.4%) | 21 (25.3%) |
| Total | 581 (100.0%) | 83 (100.0%) |
Health & Disability in Indian Hills
Health Insurance Coverage by Age in Indian Hills
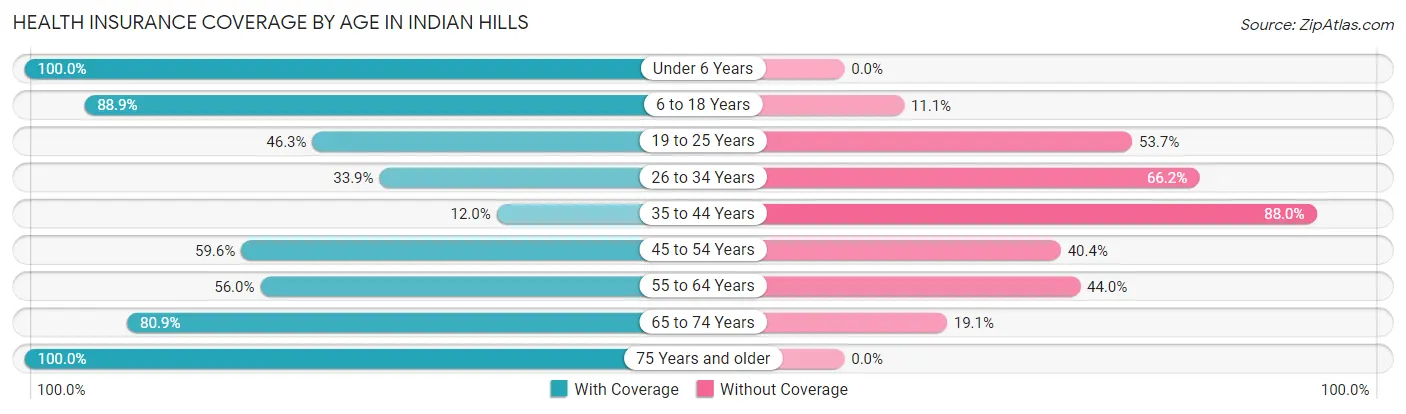
| Age Bracket | With Coverage | Without Coverage |
| Under 6 Years | 293 (100.0%) | 0 (0.0%) |
| 6 to 18 Years | 871 (88.9%) | 109 (11.1%) |
| 19 to 25 Years | 209 (46.3%) | 242 (53.7%) |
| 26 to 34 Years | 66 (33.9%) | 129 (66.1%) |
| 35 to 44 Years | 50 (12.0%) | 367 (88.0%) |
| 45 to 54 Years | 167 (59.6%) | 113 (40.4%) |
| 55 to 64 Years | 204 (56.0%) | 160 (44.0%) |
| 65 to 74 Years | 127 (80.9%) | 30 (19.1%) |
| 75 Years and older | 51 (100.0%) | 0 (0.0%) |
| Total | 2,038 (63.9%) | 1,150 (36.1%) |
Health Insurance Coverage by Citizenship Status in Indian Hills
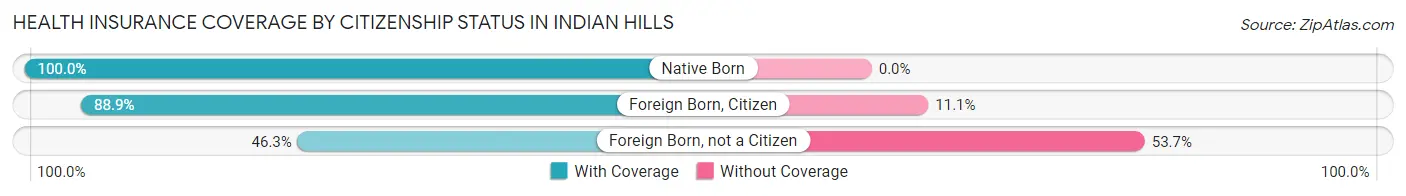
| Citizenship Status | With Coverage | Without Coverage |
| Native Born | 293 (100.0%) | 0 (0.0%) |
| Foreign Born, Citizen | 871 (88.9%) | 109 (11.1%) |
| Foreign Born, not a Citizen | 209 (46.3%) | 242 (53.7%) |
Health Insurance Coverage by Household Income in Indian Hills
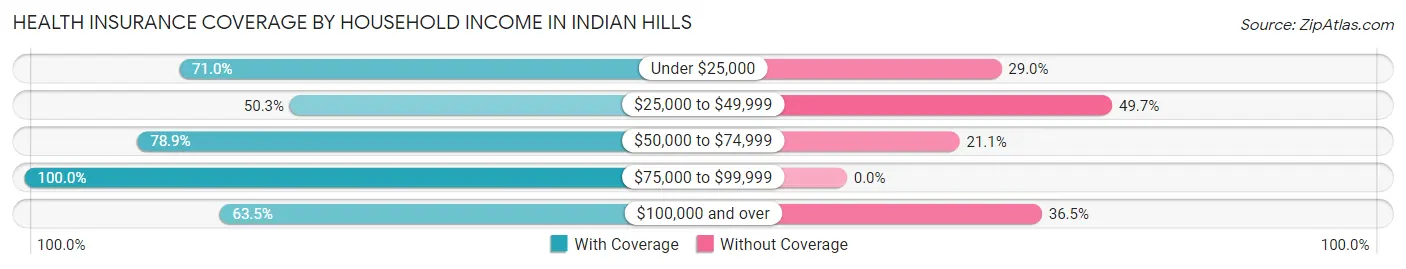
| Household Income | With Coverage | Without Coverage |
| Under $25,000 | 709 (71.0%) | 289 (29.0%) |
| $25,000 to $49,999 | 661 (50.3%) | 653 (49.7%) |
| $50,000 to $74,999 | 407 (78.9%) | 109 (21.1%) |
| $75,000 to $99,999 | 89 (100.0%) | 0 (0.0%) |
| $100,000 and over | 172 (63.5%) | 99 (36.5%) |
Public vs Private Health Insurance Coverage by Age in Indian Hills
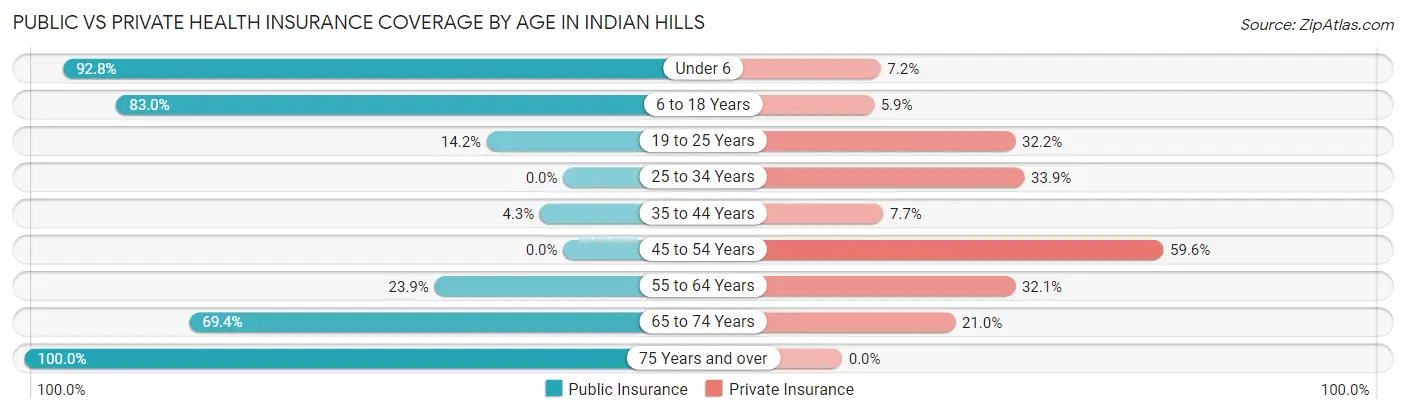
| Age Bracket | Public Insurance | Private Insurance |
| Under 6 | 272 (92.8%) | 21 (7.2%) |
| 6 to 18 Years | 813 (83.0%) | 58 (5.9%) |
| 19 to 25 Years | 64 (14.2%) | 145 (32.2%) |
| 25 to 34 Years | 0 (0.0%) | 66 (33.9%) |
| 35 to 44 Years | 18 (4.3%) | 32 (7.7%) |
| 45 to 54 Years | 0 (0.0%) | 167 (59.6%) |
| 55 to 64 Years | 87 (23.9%) | 117 (32.1%) |
| 65 to 74 Years | 109 (69.4%) | 33 (21.0%) |
| 75 Years and over | 51 (100.0%) | 0 (0.0%) |
| Total | 1,414 (44.4%) | 639 (20.0%) |
Disability Status by Sex by Age in Indian Hills
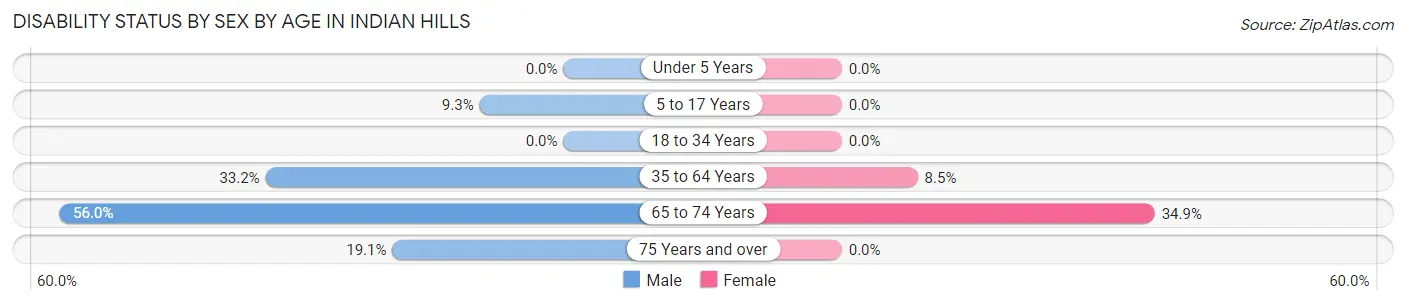
| Age Bracket | Male | Female |
| Under 5 Years | 0 (0.0%) | 0 (0.0%) |
| 5 to 17 Years | 45 (9.3%) | 0 (0.0%) |
| 18 to 34 Years | 0 (0.0%) | 0 (0.0%) |
| 35 to 64 Years | 140 (33.2%) | 54 (8.5%) |
| 65 to 74 Years | 51 (56.0%) | 23 (34.8%) |
| 75 Years and over | 8 (19.1%) | 0 (0.0%) |
Disability Class by Sex by Age in Indian Hills
Disability Class: Hearing Difficulty
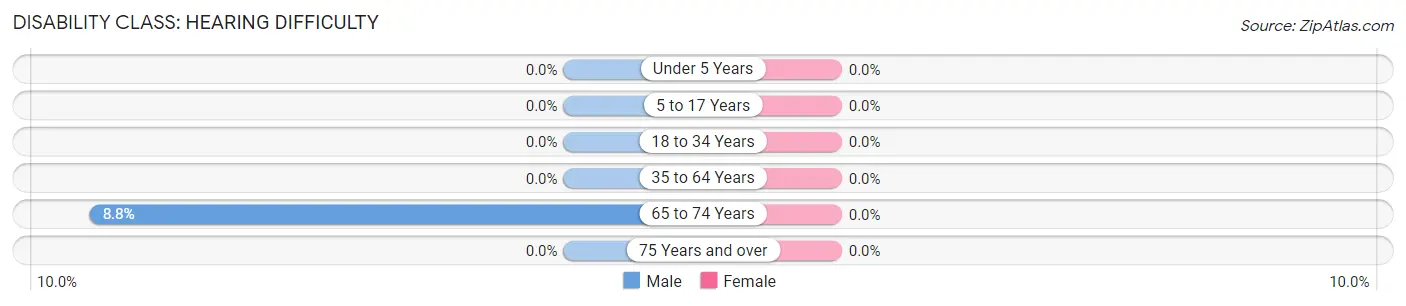
| Age Bracket | Male | Female |
| Under 5 Years | 0 (0.0%) | 0 (0.0%) |
| 5 to 17 Years | 0 (0.0%) | 0 (0.0%) |
| 18 to 34 Years | 0 (0.0%) | 0 (0.0%) |
| 35 to 64 Years | 0 (0.0%) | 0 (0.0%) |
| 65 to 74 Years | 8 (8.8%) | 0 (0.0%) |
| 75 Years and over | 0 (0.0%) | 0 (0.0%) |
Disability Class: Vision Difficulty
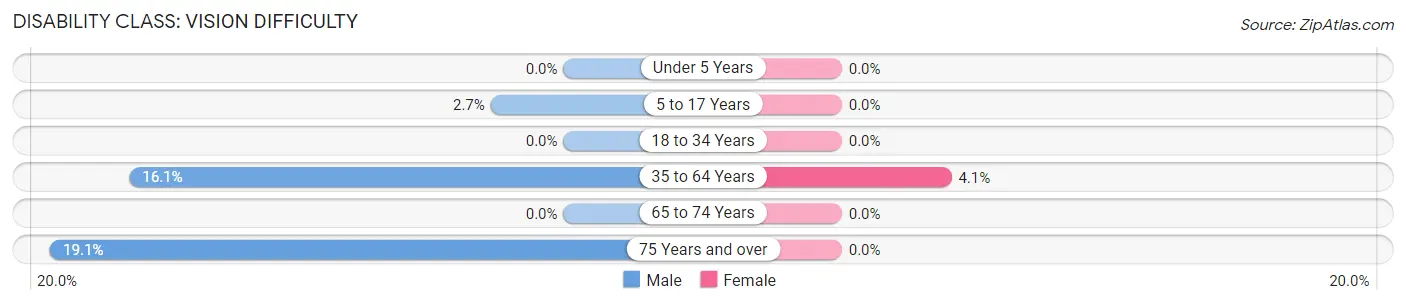
| Age Bracket | Male | Female |
| Under 5 Years | 0 (0.0%) | 0 (0.0%) |
| 5 to 17 Years | 13 (2.7%) | 0 (0.0%) |
| 18 to 34 Years | 0 (0.0%) | 0 (0.0%) |
| 35 to 64 Years | 68 (16.1%) | 26 (4.1%) |
| 65 to 74 Years | 0 (0.0%) | 0 (0.0%) |
| 75 Years and over | 8 (19.1%) | 0 (0.0%) |
Disability Class: Cognitive Difficulty
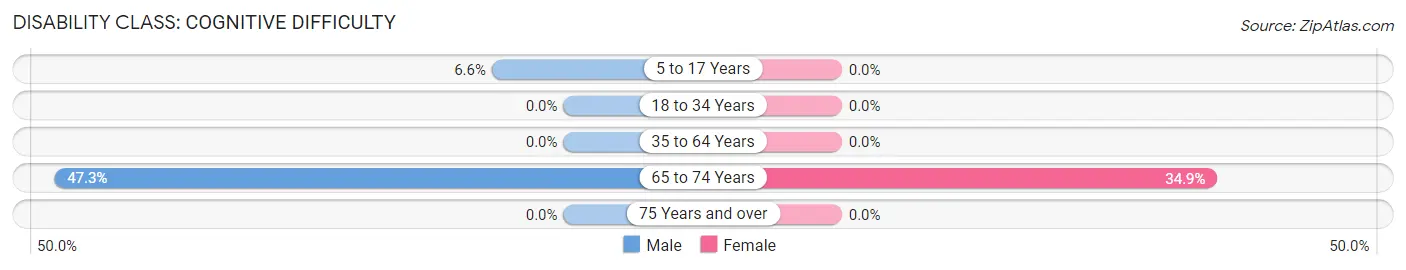
| Age Bracket | Male | Female |
| 5 to 17 Years | 32 (6.6%) | 0 (0.0%) |
| 18 to 34 Years | 0 (0.0%) | 0 (0.0%) |
| 35 to 64 Years | 0 (0.0%) | 0 (0.0%) |
| 65 to 74 Years | 43 (47.2%) | 23 (34.8%) |
| 75 Years and over | 0 (0.0%) | 0 (0.0%) |
Disability Class: Ambulatory Difficulty
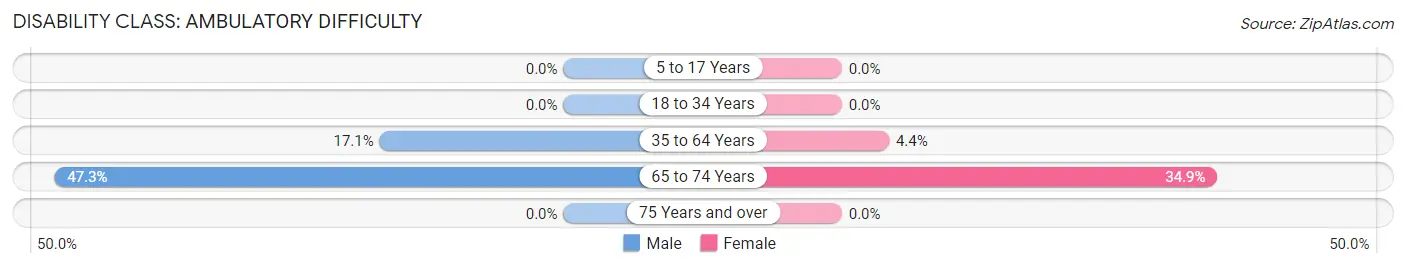
| Age Bracket | Male | Female |
| 5 to 17 Years | 0 (0.0%) | 0 (0.0%) |
| 18 to 34 Years | 0 (0.0%) | 0 (0.0%) |
| 35 to 64 Years | 72 (17.1%) | 28 (4.4%) |
| 65 to 74 Years | 43 (47.2%) | 23 (34.8%) |
| 75 Years and over | 0 (0.0%) | 0 (0.0%) |
Disability Class: Self-Care Difficulty
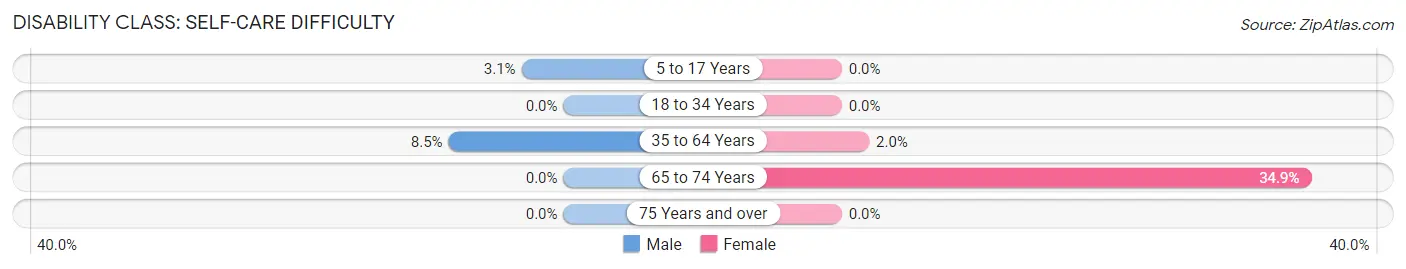
| Age Bracket | Male | Female |
| 5 to 17 Years | 15 (3.1%) | 0 (0.0%) |
| 18 to 34 Years | 0 (0.0%) | 0 (0.0%) |
| 35 to 64 Years | 36 (8.5%) | 13 (2.0%) |
| 65 to 74 Years | 0 (0.0%) | 23 (34.8%) |
| 75 Years and over | 0 (0.0%) | 0 (0.0%) |
Technology Access in Indian Hills
Computing Device Access in Indian Hills
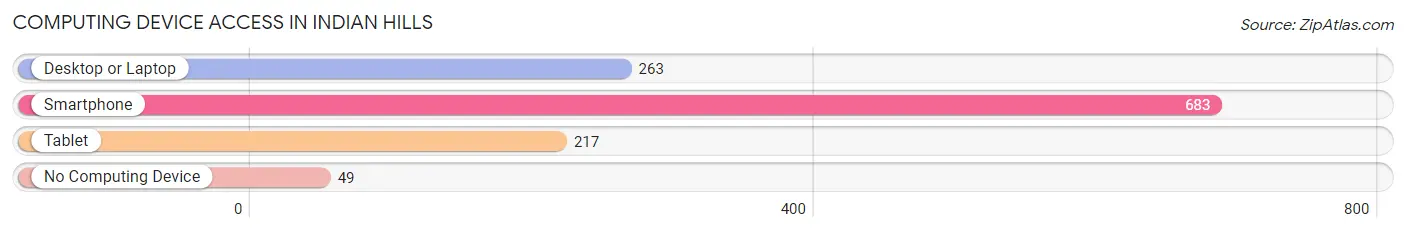
| Device Type | # Households | % Households |
| Desktop or Laptop | 263 | 35.9% |
| Smartphone | 683 | 93.3% |
| Tablet | 217 | 29.6% |
| No Computing Device | 49 | 6.7% |
| Total | 732 | 100.0% |
Internet Access in Indian Hills
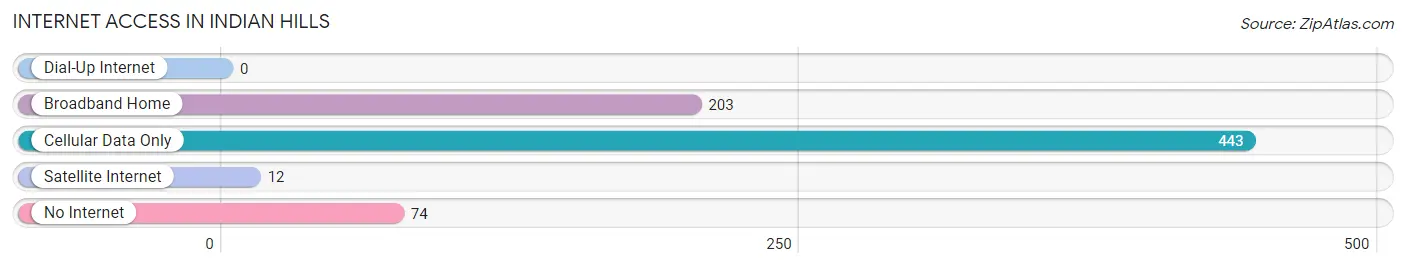
| Internet Type | # Households | % Households |
| Dial-Up Internet | 0 | 0.0% |
| Broadband Home | 203 | 27.7% |
| Cellular Data Only | 443 | 60.5% |
| Satellite Internet | 12 | 1.6% |
| No Internet | 74 | 10.1% |
| Total | 732 | 100.0% |
Indian Hills Summary
History
Indian Hills, Texas is a small unincorporated community located in the southeastern corner of the state, in the county of San Patricio. The area was first settled in the late 1800s by a group of settlers from the nearby town of Refugio. The settlers were attracted to the area due to its fertile soil and abundant wildlife. The area was originally known as Indian Hill, but the name was changed to Indian Hills in the early 1900s.
The area was primarily used for ranching and farming until the 1950s, when oil was discovered in the area. This led to a boom in the local economy, as oil companies began to move into the area and build refineries and other infrastructure. The population of Indian Hills grew rapidly during this time, and the town became a hub for the oil industry.
In the late 1970s, the oil industry began to decline, and the population of Indian Hills began to decline as well. The town has since become a quiet, rural community, with a population of just over 500 people.
Geography
Indian Hills is located in the southeastern corner of Texas, in San Patricio County. The town is situated on the banks of the Nueces River, and is surrounded by rolling hills and open fields. The area is known for its mild climate, with temperatures rarely reaching extreme highs or lows.
The town is located approximately 30 miles from the city of Corpus Christi, and is within easy driving distance of other major cities in the region, such as San Antonio and Austin.
Economy
The economy of Indian Hills is largely based on agriculture and ranching. The area is known for its fertile soil, and is home to a variety of crops, including corn, cotton, and sorghum. The area is also home to a number of cattle ranches, and is a popular destination for hunting and fishing.
In addition to agriculture, the town is also home to a number of small businesses, including restaurants, convenience stores, and auto repair shops. The town is also home to a number of oil and gas companies, which provide jobs for many of the town’s residents.
Demographics
As of the 2010 census, the population of Indian Hills was 514. The population is largely made up of white (83.3%) and Hispanic (14.2%) residents. The median household income in the town is $37,500, and the median age is 37.
The town is served by the San Patricio County School District, which includes two elementary schools, one middle school, and one high school. The town is also home to a number of churches, including the First Baptist Church of Indian Hills.
Conclusion
Indian Hills, Texas is a small, rural community located in the southeastern corner of the state. The area was originally settled in the late 1800s, and has since become a hub for the oil industry. The town is now largely based on agriculture and ranching, and is home to a population of just over 500 people. The town is served by the San Patricio County School District, and is home to a number of churches and small businesses.
Common Questions
What is the Total Population of Indian Hills?
Total Population of Indian Hills is 3,188.
What is the Total Male Population of Indian Hills?
Total Male Population of Indian Hills is 1,390.
What is the Total Female Population of Indian Hills?
Total Female Population of Indian Hills is 1,798.
What is the Ratio of Males per 100 Females in Indian Hills?
There are 77.31 Males per 100 Females in Indian Hills.
What is the Ratio of Females per 100 Males in Indian Hills?
There are 129.35 Females per 100 Males in Indian Hills.
What is the Median Population Age in Indian Hills?
Median Population Age in Indian Hills is 24.0 Years.
What is the Average Family Size in Indian Hills
Average Family Size in Indian Hills is 4.3 People.
What is the Average Household Size in Indian Hills
Average Household Size in Indian Hills is 4.4 People.
What is Per Capita Income in Indian Hills?
Per Capita income in Indian Hills is $8,674.
What is the Median Family Income in Indian Hills?
Median Family Income in Indian Hills is $26,173.
What is the Median Household income in Indian Hills?
Median Household Income in Indian Hills is $26,557.
What is Income or Wage Gap in Indian Hills?
Income or Wage Gap in Indian Hills is 12.6%.
Women in Indian Hills earn 87.4 cents for every dollar earned by a man.
What is Inequality or Gini Index in Indian Hills?
Inequality or Gini Index in Indian Hills is 0.41.
How Large is the Labor Force in Indian Hills?
There are 885 People in the Labor Forcein in Indian Hills.
What is the Percentage of People in the Labor Force in Indian Hills?
39.9% of People are in the Labor Force in Indian Hills.
What is the Unemployment Rate in Indian Hills?
Unemployment Rate in Indian Hills is 1.9%.