Sansom Park, TX
Sansom Park Map
Sansom Park Overview
5,387
TOTAL POPULATION
3,044
MALE POPULATION
2,343
FEMALE POPULATION
129.92
MALES / 100 FEMALES
76.97
FEMALES / 100 MALES
34.4
MEDIAN AGE
4.0
AVG FAMILY SIZE
3.2
AVG HOUSEHOLD SIZE
$22,263
PER CAPITA INCOME
$58,796
AVG FAMILY INCOME
$54,909
AVG HOUSEHOLD INCOME
1.7%
WAGE / INCOME GAP [ % ]
98.3¢/ $1
WAGE / INCOME GAP [ $ ]
$5,328
FAMILY INCOME DEFICIT
0.43
INEQUALITY / GINI INDEX
2,408
LABOR FORCE [ PEOPLE ]
62.9%
PERCENT IN LABOR FORCE
7.4%
UNEMPLOYMENT RATE
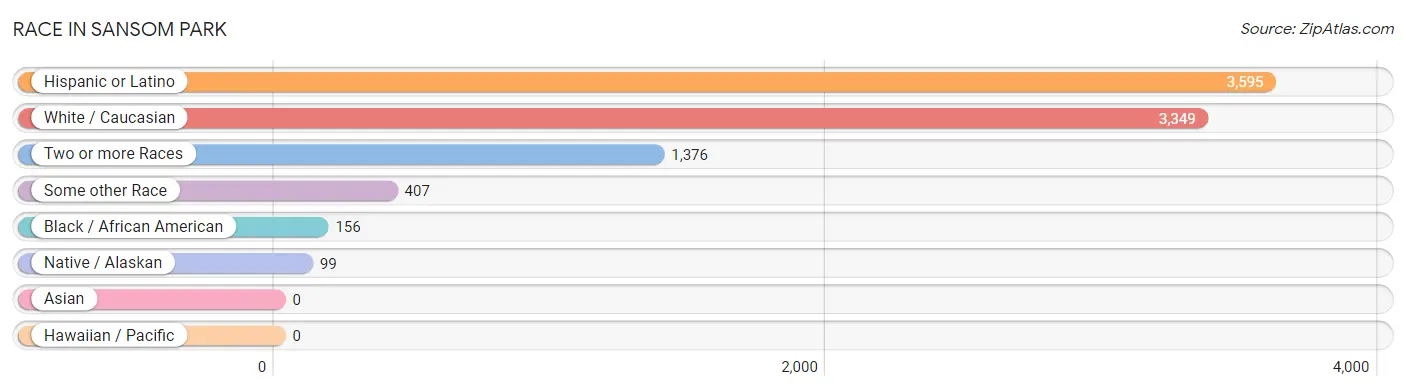
Race in Sansom Park
The most populous races in Sansom Park are Hispanic or Latino (3,595 | 66.7%), White / Caucasian (3,349 | 62.2%), and Two or more Races (1,376 | 25.5%).
| Race | # Population | % Population |
| Asian | 0 | 0.0% |
| Black / African American | 156 | 2.9% |
| Hawaiian / Pacific | 0 | 0.0% |
| Hispanic or Latino | 3,595 | 66.7% |
| Native / Alaskan | 99 | 1.8% |
| White / Caucasian | 3,349 | 62.2% |
| Two or more Races | 1,376 | 25.5% |
| Some other Race | 407 | 7.6% |
| Total | 5,387 | 100.0% |
Ancestry in Sansom Park
The most populous ancestries reported in Sansom Park are Mexican (3,407 | 63.2%), English (322 | 6.0%), Irish (213 | 4.0%), American (206 | 3.8%), and German (124 | 2.3%), together accounting for 79.3% of all Sansom Park residents.

| Ancestry | # Population | % Population |
| American | 206 | 3.8% |
| Arab | 41 | 0.8% |
| British | 60 | 1.1% |
| Cherokee | 8 | 0.2% |
| English | 322 | 6.0% |
| European | 10 | 0.2% |
| French Canadian | 20 | 0.4% |
| German | 124 | 2.3% |
| Irish | 213 | 4.0% |
| Italian | 6 | 0.1% |
| Lebanese | 41 | 0.8% |
| Mexican | 3,407 | 63.2% |
| Mexican American Indian | 99 | 1.8% |
| Polish | 54 | 1.0% |
| Portuguese | 25 | 0.5% |
| Puerto Rican | 91 | 1.7% |
| Scottish | 6 | 0.1% |
| Spaniard | 33 | 0.6% |
| Spanish | 32 | 0.6% |
| Swedish | 40 | 0.7% | View All 20 Rows |
Immigrants in Sansom Park
The most numerous immigrant groups reported in Sansom Park came from Central America (703 | 13.1%), Latin America (703 | 13.1%), Mexico (703 | 13.1%), Asia (33 | 0.6%), and Lebanon (33 | 0.6%), together accounting for 40.4% of all Sansom Park residents.

| Immigration Origin | # Population | % Population |
| Asia | 33 | 0.6% |
| Central America | 703 | 13.1% |
| Europe | 25 | 0.5% |
| Latin America | 703 | 13.1% |
| Lebanon | 33 | 0.6% |
| Mexico | 703 | 13.1% |
| Portugal | 25 | 0.5% |
| Southern Europe | 25 | 0.5% |
| Western Asia | 33 | 0.6% | View All 9 Rows |
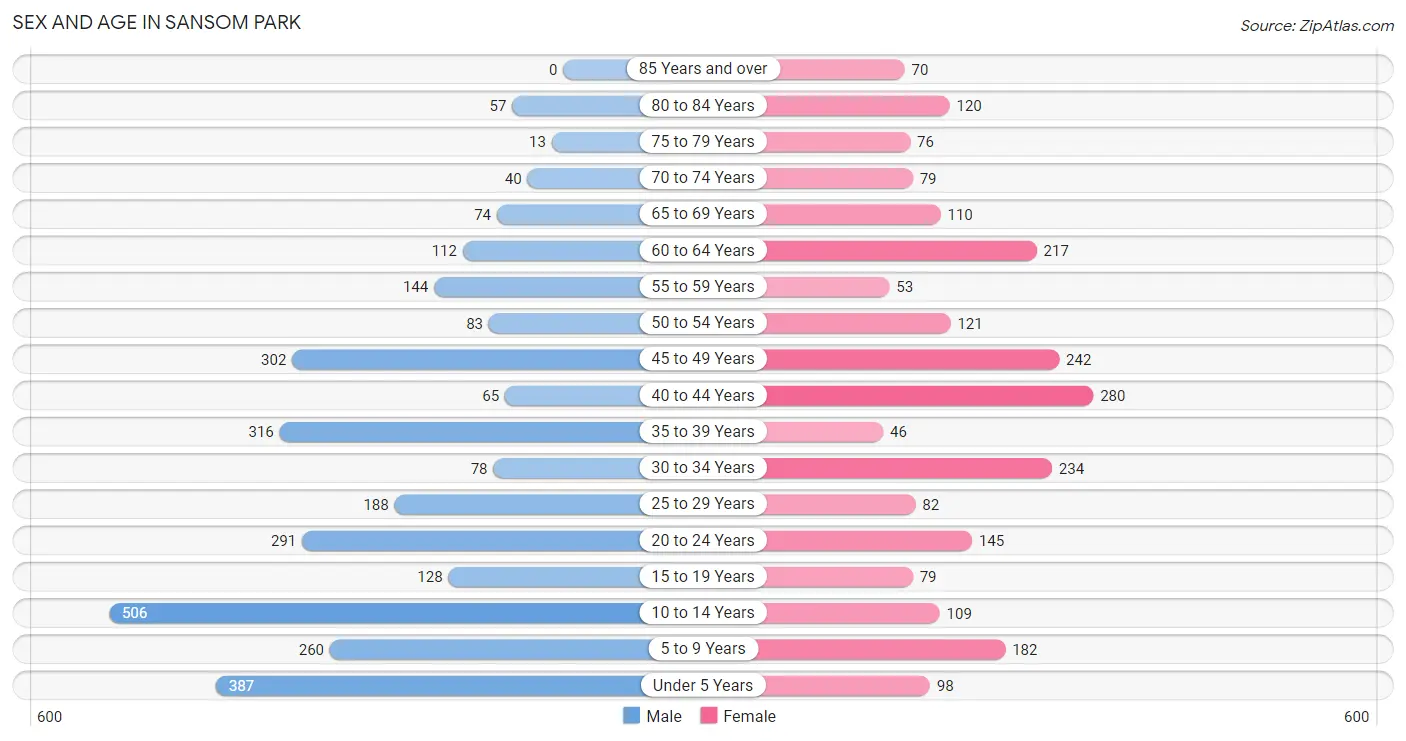
Sex and Age in Sansom Park
Sex and Age in Sansom Park
The most populous age groups in Sansom Park are 10 to 14 Years (506 | 16.6%) for men and 40 to 44 Years (280 | 11.9%) for women.
| Age Bracket | Male | Female |
| Under 5 Years | 387 (12.7%) | 98 (4.2%) |
| 5 to 9 Years | 260 (8.5%) | 182 (7.8%) |
| 10 to 14 Years | 506 (16.6%) | 109 (4.6%) |
| 15 to 19 Years | 128 (4.2%) | 79 (3.4%) |
| 20 to 24 Years | 291 (9.6%) | 145 (6.2%) |
| 25 to 29 Years | 188 (6.2%) | 82 (3.5%) |
| 30 to 34 Years | 78 (2.6%) | 234 (10.0%) |
| 35 to 39 Years | 316 (10.4%) | 46 (2.0%) |
| 40 to 44 Years | 65 (2.1%) | 280 (11.9%) |
| 45 to 49 Years | 302 (9.9%) | 242 (10.3%) |
| 50 to 54 Years | 83 (2.7%) | 121 (5.2%) |
| 55 to 59 Years | 144 (4.7%) | 53 (2.3%) |
| 60 to 64 Years | 112 (3.7%) | 217 (9.3%) |
| 65 to 69 Years | 74 (2.4%) | 110 (4.7%) |
| 70 to 74 Years | 40 (1.3%) | 79 (3.4%) |
| 75 to 79 Years | 13 (0.4%) | 76 (3.2%) |
| 80 to 84 Years | 57 (1.9%) | 120 (5.1%) |
| 85 Years and over | 0 (0.0%) | 70 (3.0%) |
| Total | 3,044 (100.0%) | 2,343 (100.0%) |
Families and Households in Sansom Park
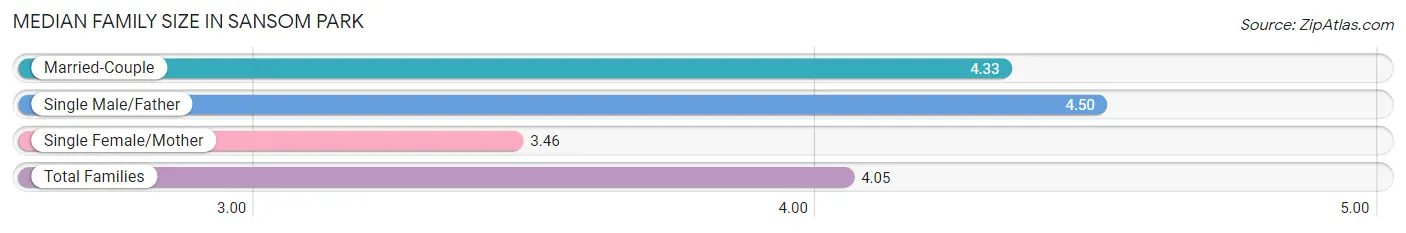
Median Family Size in Sansom Park
The median family size in Sansom Park is 4.05 persons per family, with single male/father families (10 | 0.9%) accounting for the largest median family size of 4.5 persons per family. On the other hand, single female/mother families (340 | 31.4%) represent the smallest median family size with 3.46 persons per family.
| Family Type | # Families | Family Size |
| Married-Couple | 732 (67.6%) | 4.33 |
| Single Male/Father | 10 (0.9%) | 4.50 |
| Single Female/Mother | 340 (31.4%) | 3.46 |
| Total Families | 1,082 (100.0%) | 4.05 |
Median Household Size in Sansom Park
The median household size in Sansom Park is 3.23 persons per household, with single male/father households (10 | 0.6%) accounting for the largest median household size of 4.5 persons per household. non-family households (553 | 33.8%) represent the smallest median household size with 1.51 persons per household.
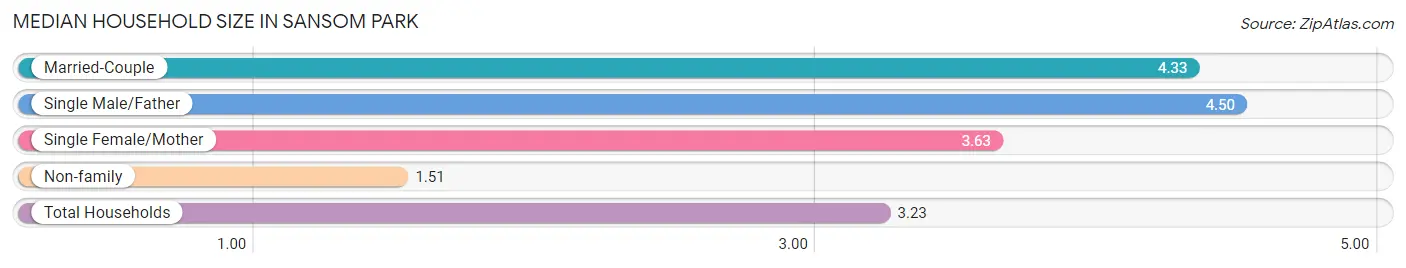
| Household Type | # Households | Household Size |
| Married-Couple | 732 (44.8%) | 4.33 |
| Single Male/Father | 10 (0.6%) | 4.50 |
| Single Female/Mother | 340 (20.8%) | 3.63 |
| Non-family | 553 (33.8%) | 1.51 |
| Total Households | 1,635 (100.0%) | 3.23 |
Household Size by Marriage Status in Sansom Park
Out of a total of 1,635 households in Sansom Park, 1,082 (66.2%) are family households, while 553 (33.8%) are nonfamily households. The most numerous type of family households are 2-person households, comprising 364, and the most common type of nonfamily households are 1-person households, comprising 359.
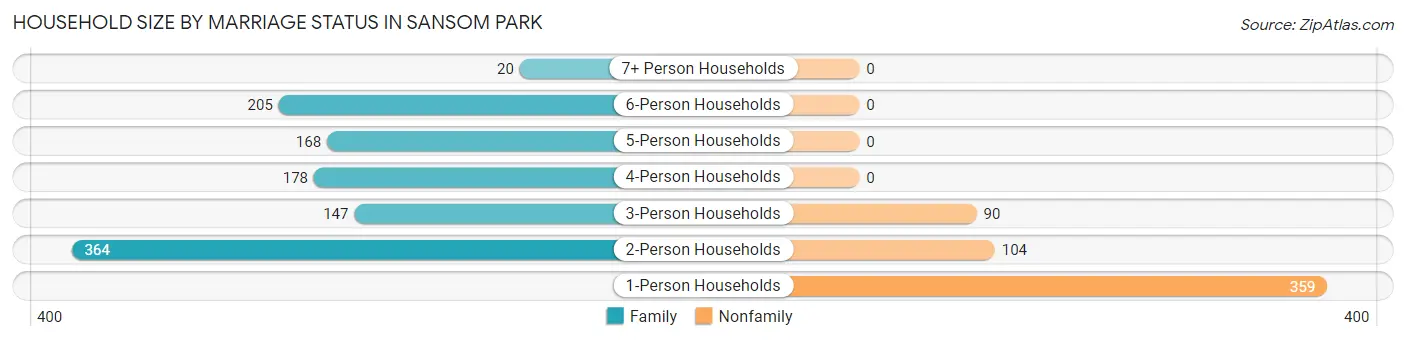
| Household Size | Family Households | Nonfamily Households |
| 1-Person Households | - | 359 (22.0%) |
| 2-Person Households | 364 (22.3%) | 104 (6.4%) |
| 3-Person Households | 147 (9.0%) | 90 (5.5%) |
| 4-Person Households | 178 (10.9%) | 0 (0.0%) |
| 5-Person Households | 168 (10.3%) | 0 (0.0%) |
| 6-Person Households | 205 (12.5%) | 0 (0.0%) |
| 7+ Person Households | 20 (1.2%) | 0 (0.0%) |
| Total | 1,082 (66.2%) | 553 (33.8%) |
Female Fertility in Sansom Park
Fertility by Age in Sansom Park
Average fertility rate in Sansom Park is 80.0 births per 1,000 women. Women in the age bracket of 20 to 34 years have the highest fertility rate with 143.0 births per 1,000 women. Women in the age bracket of 20 to 34 years acount for 72.5% of all women with births.
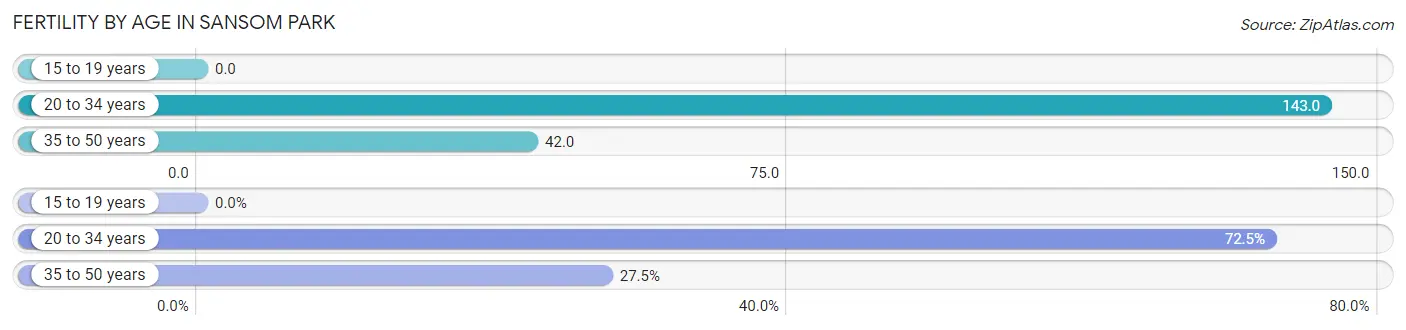
| Age Bracket | Women with Births | Births / 1,000 Women |
| 15 to 19 years | 0 (0.0%) | 0.0 |
| 20 to 34 years | 66 (72.5%) | 143.0 |
| 35 to 50 years | 25 (27.5%) | 42.0 |
| Total | 91 (100.0%) | 80.0 |
Fertility by Age by Marriage Status in Sansom Park
63.7% of women with births (91) in Sansom Park are married. The highest percentage of unmarried women with births falls into 20 to 34 years age bracket with 50.0% of them unmarried at the time of birth, while the lowest percentage of unmarried women with births belong to 35 to 50 years age bracket with 0.0% of them unmarried.
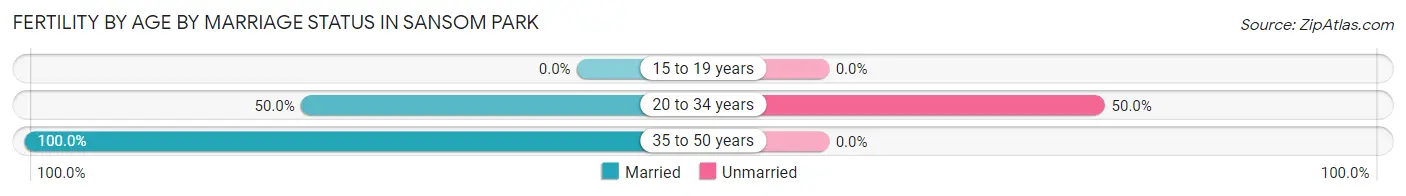
| Age Bracket | Married | Unmarried |
| 15 to 19 years | 0 (0.0%) | 0 (0.0%) |
| 20 to 34 years | 33 (50.0%) | 33 (50.0%) |
| 35 to 50 years | 25 (100.0%) | 0 (0.0%) |
| Total | 58 (63.7%) | 33 (36.3%) |
Fertility by Education in Sansom Park
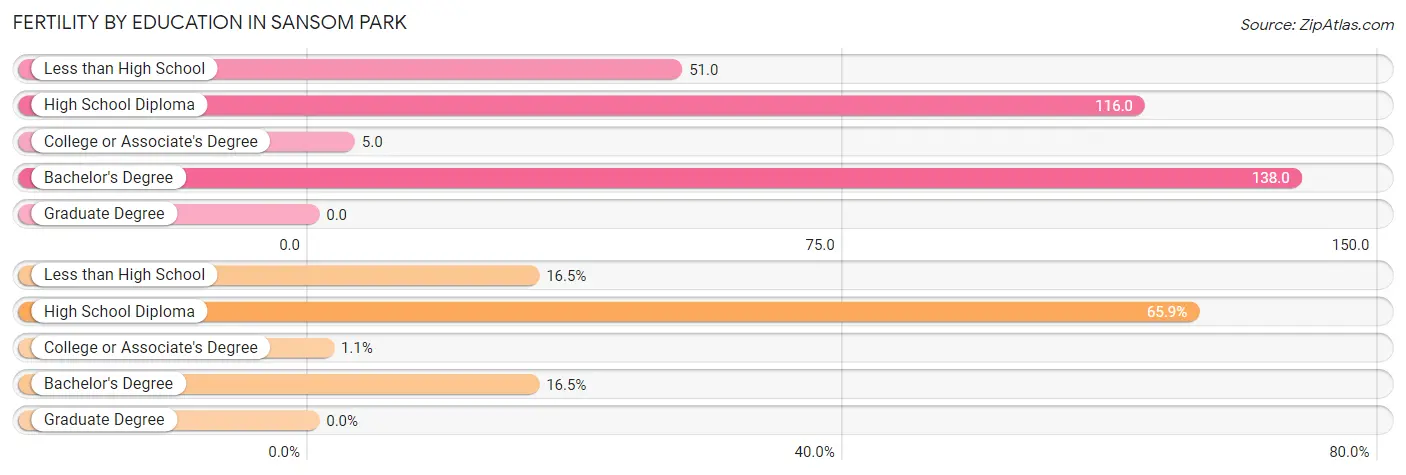
| Educational Attainment | Women with Births | Births / 1,000 Women |
| Less than High School | 15 (16.5%) | 51.0 |
| High School Diploma | 60 (65.9%) | 116.0 |
| College or Associate's Degree | 1 (1.1%) | 5.0 |
| Bachelor's Degree | 15 (16.5%) | 138.0 |
| Graduate Degree | 0 (0.0%) | 0.0 |
| Total | 91 (100.0%) | 80.0 |
Fertility by Education by Marriage Status in Sansom Park
36.3% of women with births in Sansom Park are unmarried. Women with the educational attainment of less than high school are most likely to be married with 100.0% of them married at childbirth, while women with the educational attainment of college or associate's degree are least likely to be married with 100.0% of them unmarried at childbirth.
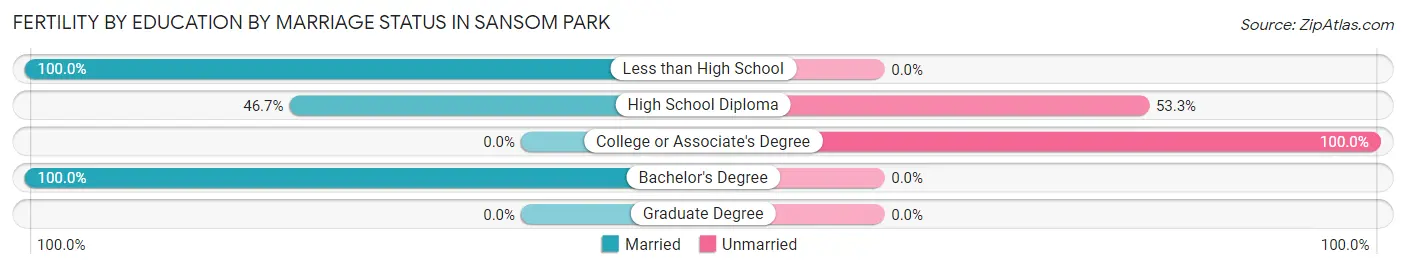
| Educational Attainment | Married | Unmarried |
| Less than High School | 15 (100.0%) | 0 (0.0%) |
| High School Diploma | 28 (46.7%) | 32 (53.3%) |
| College or Associate's Degree | 0 (0.0%) | 1 (100.0%) |
| Bachelor's Degree | 15 (100.0%) | 0 (0.0%) |
| Graduate Degree | 0 (0.0%) | 0 (0.0%) |
| Total | 58 (63.7%) | 33 (36.3%) |
Income in Sansom Park
Income Overview in Sansom Park
Per Capita Income in Sansom Park is $22,263, while median incomes of families and households are $58,796 and $54,909 respectively.
| Characteristic | Number | Measure |
| Per Capita Income | 5,387 | $22,263 |
| Median Family Income | 1,082 | $58,796 |
| Mean Family Income | 1,082 | $63,938 |
| Median Household Income | 1,635 | $54,909 |
| Mean Household Income | 1,635 | $70,413 |
| Income Deficit | 1,082 | $5,328 |
| Wage / Income Gap (%) | 5,387 | 1.69% |
| Wage / Income Gap ($) | 5,387 | 98.31¢ per $1 |
| Gini / Inequality Index | 5,387 | 0.43 |
Earnings by Sex in Sansom Park
Average Earnings in Sansom Park are $33,373, $33,466 for men and $32,902 for women, a difference of 1.7%.
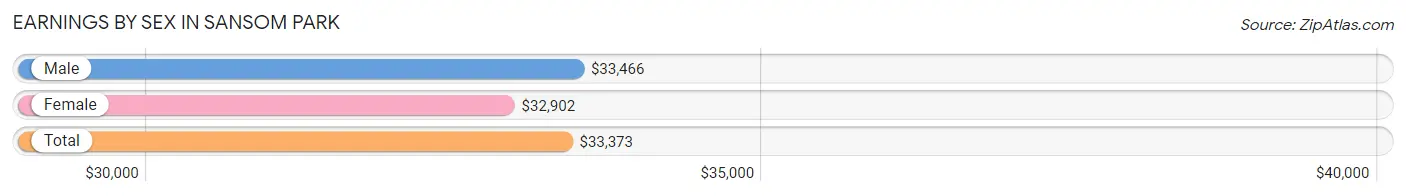
| Sex | Number | Average Earnings |
| Male | 1,337 (55.2%) | $33,466 |
| Female | 1,083 (44.8%) | $32,902 |
| Total | 2,420 (100.0%) | $33,373 |
Earnings by Sex by Income Bracket in Sansom Park
The most common earnings brackets in Sansom Park are $25,000 to $29,999 for men (389 | 29.1%) and $12,500 to $14,999 for women (150 | 13.9%).
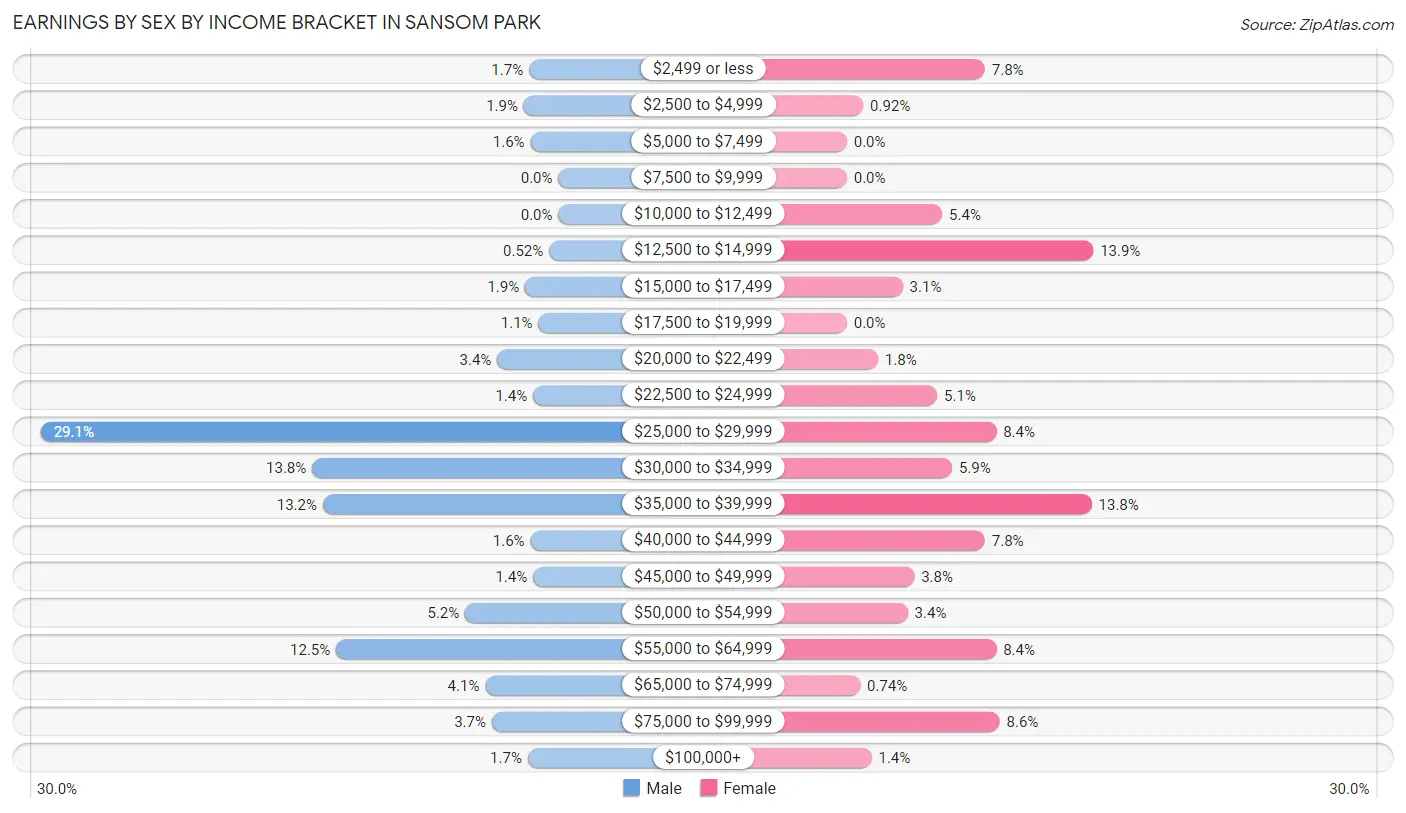
| Income | Male | Female |
| $2,499 or less | 22 (1.7%) | 84 (7.8%) |
| $2,500 to $4,999 | 26 (1.9%) | 10 (0.9%) |
| $5,000 to $7,499 | 21 (1.6%) | 0 (0.0%) |
| $7,500 to $9,999 | 0 (0.0%) | 0 (0.0%) |
| $10,000 to $12,499 | 0 (0.0%) | 58 (5.4%) |
| $12,500 to $14,999 | 7 (0.5%) | 150 (13.9%) |
| $15,000 to $17,499 | 25 (1.9%) | 34 (3.1%) |
| $17,500 to $19,999 | 15 (1.1%) | 0 (0.0%) |
| $20,000 to $22,499 | 46 (3.4%) | 19 (1.8%) |
| $22,500 to $24,999 | 19 (1.4%) | 55 (5.1%) |
| $25,000 to $29,999 | 389 (29.1%) | 91 (8.4%) |
| $30,000 to $34,999 | 185 (13.8%) | 64 (5.9%) |
| $35,000 to $39,999 | 177 (13.2%) | 149 (13.8%) |
| $40,000 to $44,999 | 21 (1.6%) | 84 (7.8%) |
| $45,000 to $49,999 | 19 (1.4%) | 41 (3.8%) |
| $50,000 to $54,999 | 70 (5.2%) | 37 (3.4%) |
| $55,000 to $64,999 | 167 (12.5%) | 91 (8.4%) |
| $65,000 to $74,999 | 55 (4.1%) | 8 (0.7%) |
| $75,000 to $99,999 | 50 (3.7%) | 93 (8.6%) |
| $100,000+ | 23 (1.7%) | 15 (1.4%) |
| Total | 1,337 (100.0%) | 1,083 (100.0%) |
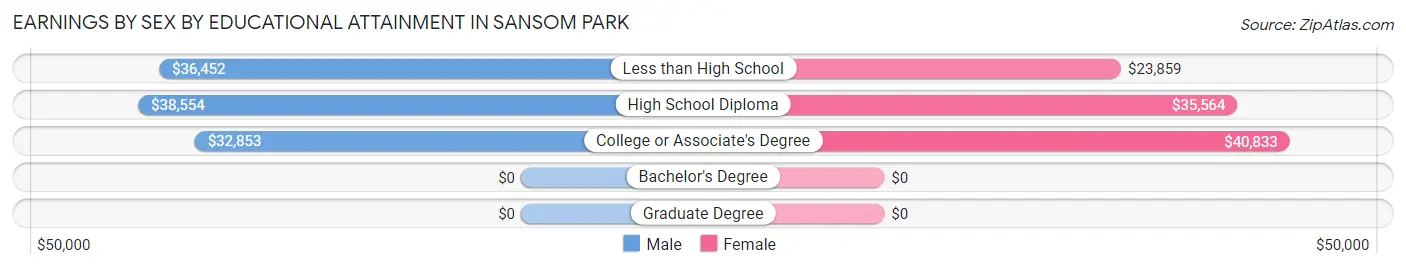
Earnings by Sex by Educational Attainment in Sansom Park
Average earnings in Sansom Park are $37,688 for men and $35,412 for women, a difference of 6.0%. Men with an educational attainment of high school diploma enjoy the highest average annual earnings of $38,554, while those with college or associate's degree education earn the least with $32,853. Women with an educational attainment of college or associate's degree earn the most with the average annual earnings of $40,833, while those with less than high school education have the smallest earnings of $23,859.
| Educational Attainment | Male Income | Female Income |
| Less than High School | $36,452 | $23,859 |
| High School Diploma | $38,554 | $35,564 |
| College or Associate's Degree | $32,853 | $40,833 |
| Bachelor's Degree | - | - |
| Graduate Degree | - | - |
| Total | $37,688 | $35,412 |
Family Income in Sansom Park
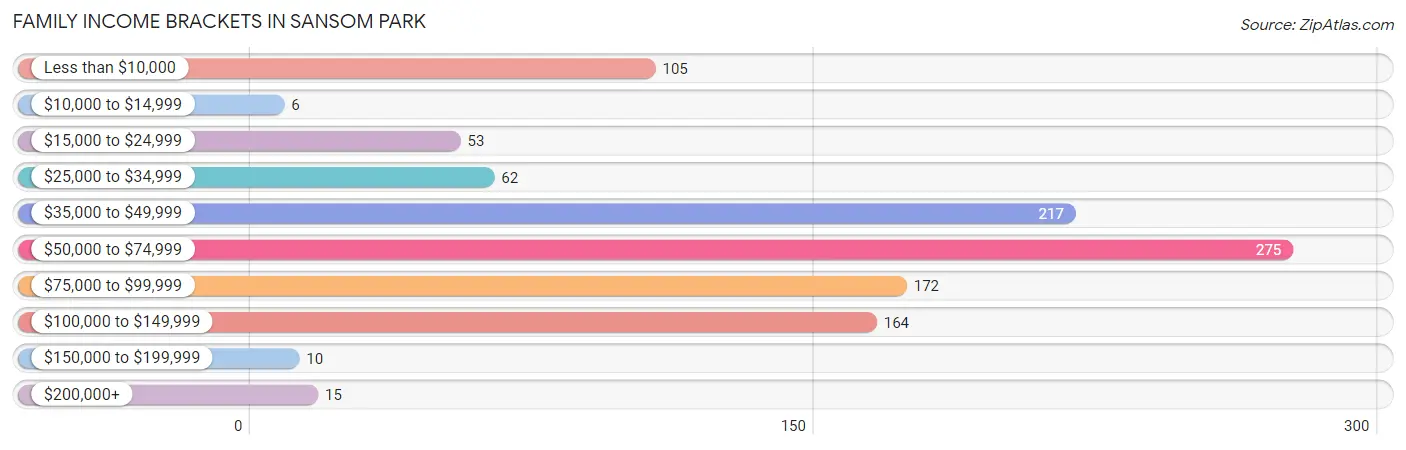
Family Income Brackets in Sansom Park
According to the Sansom Park family income data, there are 275 families falling into the $50,000 to $74,999 income range, which is the most common income bracket and makes up 25.4% of all families. Conversely, the $10,000 to $14,999 income bracket is the least frequent group with only 6 families (0.5%) belonging to this category.
| Income Bracket | # Families | % Families |
| Less than $10,000 | 105 | 9.7% |
| $10,000 to $14,999 | 6 | 0.6% |
| $15,000 to $24,999 | 53 | 4.9% |
| $25,000 to $34,999 | 62 | 5.7% |
| $35,000 to $49,999 | 217 | 20.1% |
| $50,000 to $74,999 | 275 | 25.4% |
| $75,000 to $99,999 | 172 | 15.9% |
| $100,000 to $149,999 | 164 | 15.2% |
| $150,000 to $199,999 | 10 | 0.9% |
| $200,000+ | 15 | 1.4% |
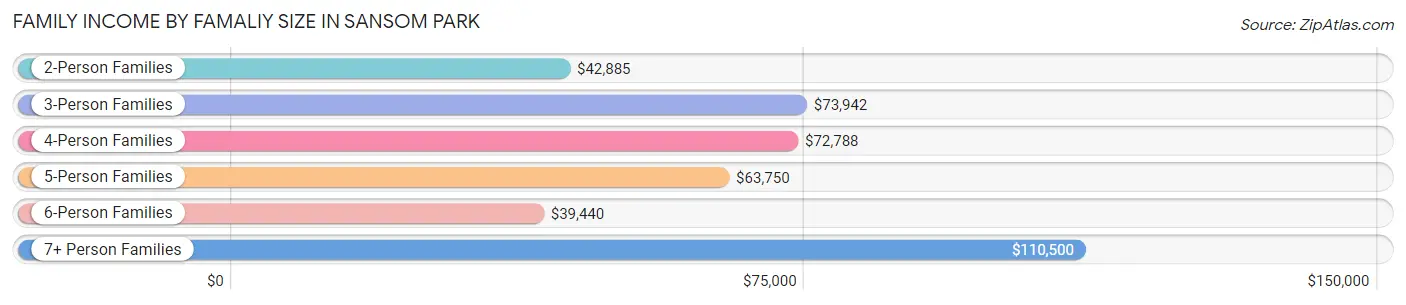
Family Income by Famaliy Size in Sansom Park
7+ person families (20 | 1.8%) account for the highest median family income in Sansom Park with $110,500 per family, while 3-person families (147 | 13.6%) have the highest median income of $24,647 per family member.
| Income Bracket | # Families | Median Income |
| 2-Person Families | 364 (33.6%) | $42,885 |
| 3-Person Families | 147 (13.6%) | $73,942 |
| 4-Person Families | 205 (19.0%) | $72,788 |
| 5-Person Families | 166 (15.3%) | $63,750 |
| 6-Person Families | 180 (16.6%) | $39,440 |
| 7+ Person Families | 20 (1.8%) | $110,500 |
| Total | 1,082 (100.0%) | $58,796 |
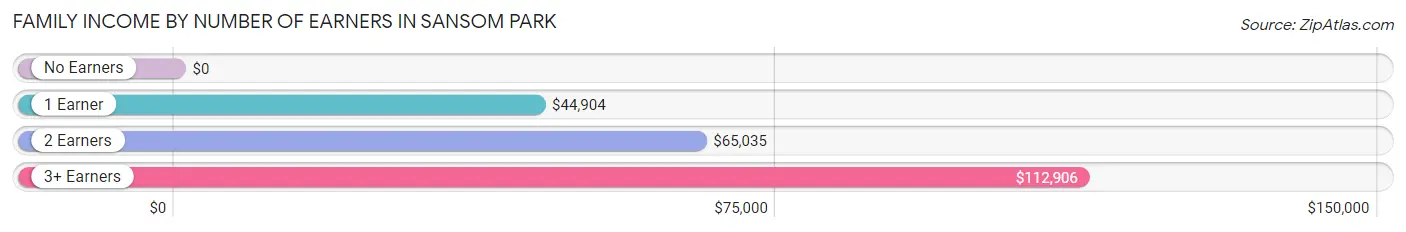
Family Income by Number of Earners in Sansom Park
| Number of Earners | # Families | Median Income |
| No Earners | 155 (14.3%) | $0 |
| 1 Earner | 231 (21.3%) | $44,904 |
| 2 Earners | 609 (56.3%) | $65,035 |
| 3+ Earners | 87 (8.0%) | $112,906 |
| Total | 1,082 (100.0%) | $58,796 |
Household Income in Sansom Park
Household Income Brackets in Sansom Park
With 337 households falling in the category, the $100,000 to $149,999 income range is the most frequent in Sansom Park, accounting for 20.6% of all households. In contrast, only 7 households (0.4%) fall into the $10,000 to $14,999 income bracket, making it the least populous group.
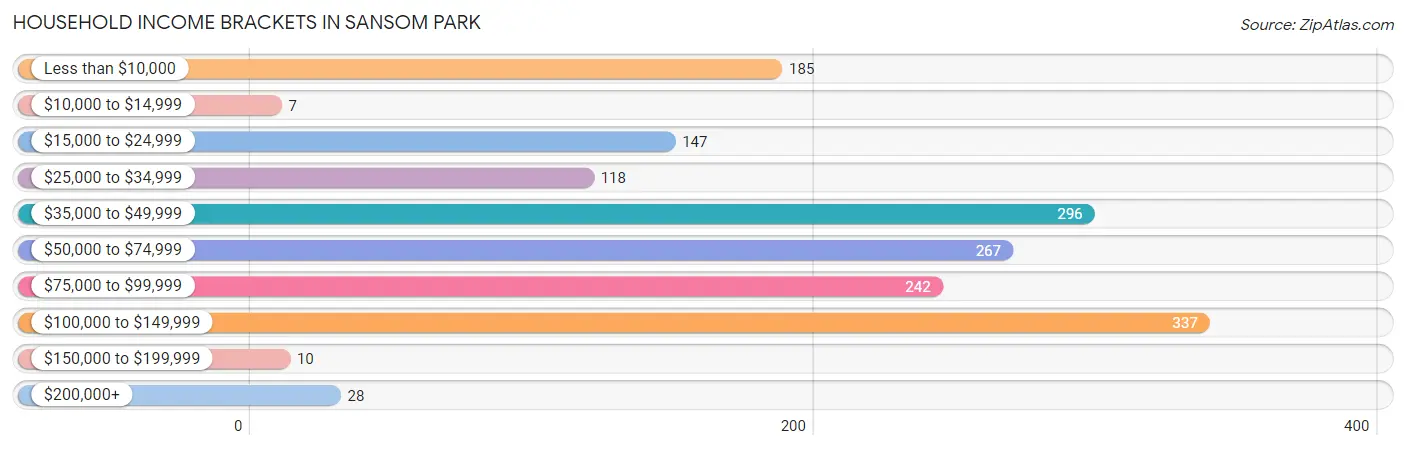
| Income Bracket | # Households | % Households |
| Less than $10,000 | 185 | 11.3% |
| $10,000 to $14,999 | 7 | 0.4% |
| $15,000 to $24,999 | 147 | 9.0% |
| $25,000 to $34,999 | 118 | 7.2% |
| $35,000 to $49,999 | 296 | 18.1% |
| $50,000 to $74,999 | 267 | 16.3% |
| $75,000 to $99,999 | 242 | 14.8% |
| $100,000 to $149,999 | 337 | 20.6% |
| $150,000 to $199,999 | 10 | 0.6% |
| $200,000+ | 28 | 1.7% |
Household Income by Householder Age in Sansom Park
The median household income in Sansom Park is $54,909, with the highest median household income of $81,152 found in the 45 to 64 years age bracket for the primary householder. A total of 553 households (33.8%) fall into this category. Meanwhile, the 15 to 24 years age bracket for the primary householder has the lowest median household income of $0, with 134 households (8.2%) in this group.
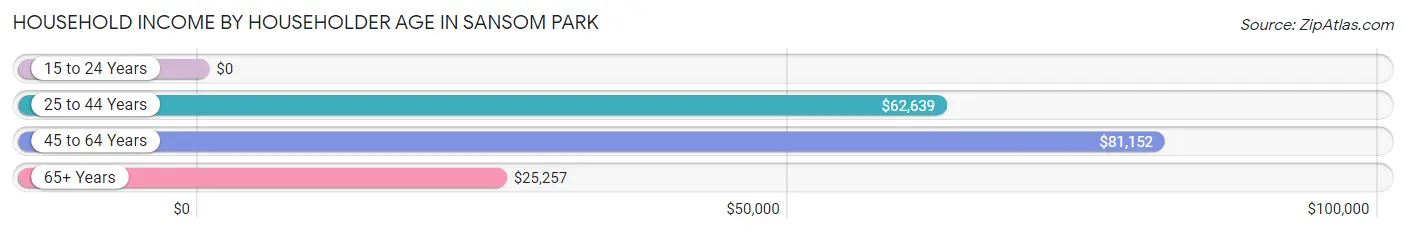
| Income Bracket | # Households | Median Income |
| 15 to 24 Years | 134 (8.2%) | $0 |
| 25 to 44 Years | 515 (31.5%) | $62,639 |
| 45 to 64 Years | 553 (33.8%) | $81,152 |
| 65+ Years | 433 (26.5%) | $25,257 |
| Total | 1,635 (100.0%) | $54,909 |
Poverty in Sansom Park
Income Below Poverty by Sex and Age in Sansom Park
With 30.0% poverty level for males and 18.2% for females among the residents of Sansom Park, 5 year old males and under 5 year old females are the most vulnerable to poverty, with 141 males (100.0%) and 76 females (77.5%) in their respective age groups living below the poverty level.
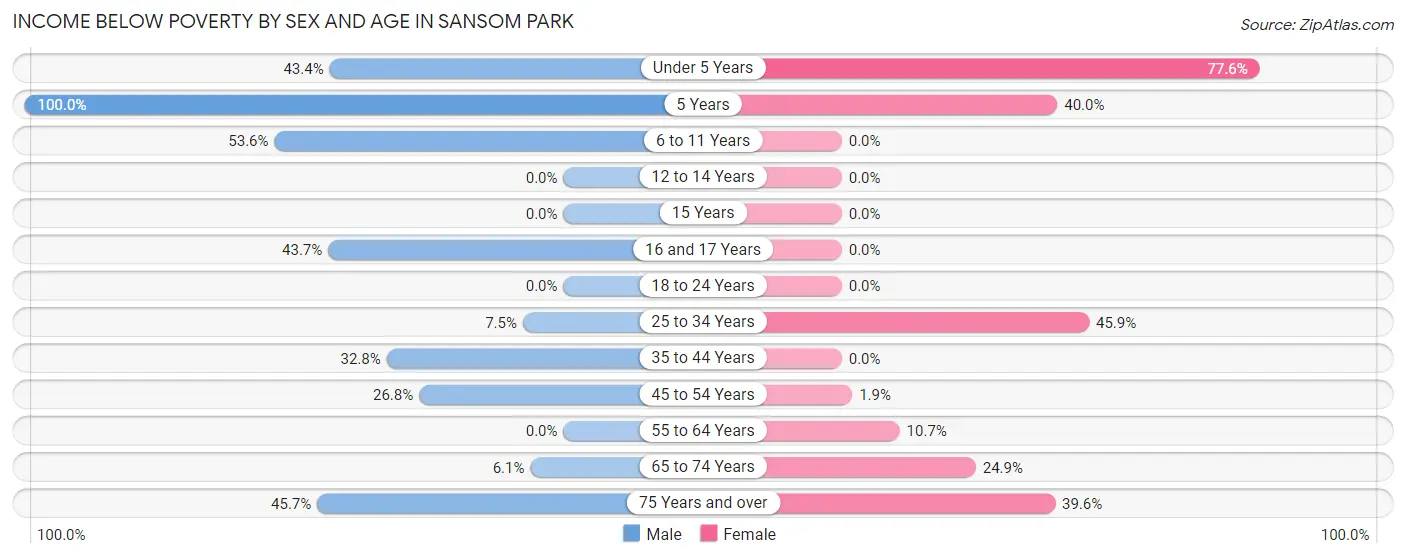
| Age Bracket | Male | Female |
| Under 5 Years | 168 (43.4%) | 76 (77.5%) |
| 5 Years | 141 (100.0%) | 32 (40.0%) |
| 6 to 11 Years | 280 (53.6%) | 0 (0.0%) |
| 12 to 14 Years | 0 (0.0%) | 0 (0.0%) |
| 15 Years | 0 (0.0%) | 0 (0.0%) |
| 16 and 17 Years | 31 (43.7%) | 0 (0.0%) |
| 18 to 24 Years | 0 (0.0%) | 0 (0.0%) |
| 25 to 34 Years | 20 (7.5%) | 145 (45.9%) |
| 35 to 44 Years | 125 (32.8%) | 0 (0.0%) |
| 45 to 54 Years | 101 (26.8%) | 7 (1.9%) |
| 55 to 64 Years | 0 (0.0%) | 29 (10.7%) |
| 65 to 74 Years | 7 (6.1%) | 47 (24.9%) |
| 75 Years and over | 32 (45.7%) | 76 (39.6%) |
| Total | 905 (30.0%) | 412 (18.2%) |
Income Above Poverty by Sex and Age in Sansom Park
According to the poverty statistics in Sansom Park, males aged 12 to 14 years and females aged 6 to 11 years are the age groups that are most secure financially, with 100.0% of males and 100.0% of females in these age groups living above the poverty line.
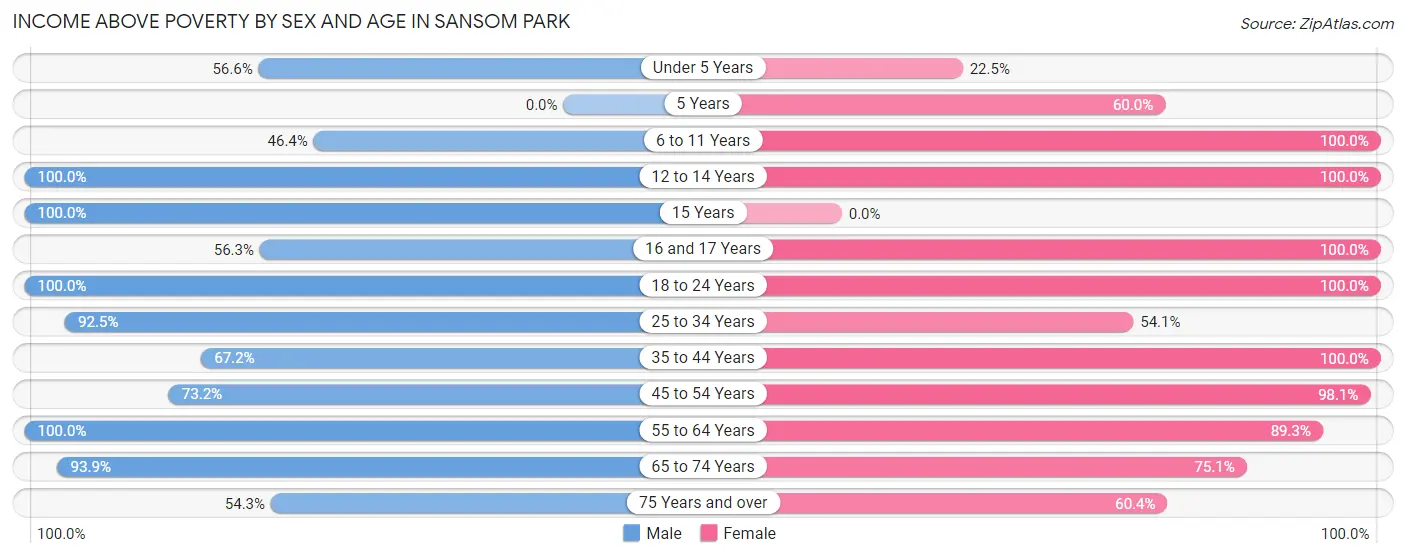
| Age Bracket | Male | Female |
| Under 5 Years | 219 (56.6%) | 22 (22.5%) |
| 5 Years | 0 (0.0%) | 48 (60.0%) |
| 6 to 11 Years | 242 (46.4%) | 153 (100.0%) |
| 12 to 14 Years | 103 (100.0%) | 58 (100.0%) |
| 15 Years | 17 (100.0%) | 0 (0.0%) |
| 16 and 17 Years | 40 (56.3%) | 68 (100.0%) |
| 18 to 24 Years | 331 (100.0%) | 156 (100.0%) |
| 25 to 34 Years | 246 (92.5%) | 171 (54.1%) |
| 35 to 44 Years | 256 (67.2%) | 326 (100.0%) |
| 45 to 54 Years | 276 (73.2%) | 356 (98.1%) |
| 55 to 64 Years | 232 (100.0%) | 241 (89.3%) |
| 65 to 74 Years | 107 (93.9%) | 142 (75.1%) |
| 75 Years and over | 38 (54.3%) | 116 (60.4%) |
| Total | 2,107 (70.0%) | 1,857 (81.8%) |
Income Below Poverty Among Married-Couple Families in Sansom Park
The poverty statistics for married-couple families in Sansom Park show that 19.3% or 141 of the total 732 families live below the poverty line. Families with 3 or 4 children have the highest poverty rate of 58.3%, comprising of 134 families. On the other hand, families with 1 or 2 children have the lowest poverty rate of 0.0%, which includes 0 families.
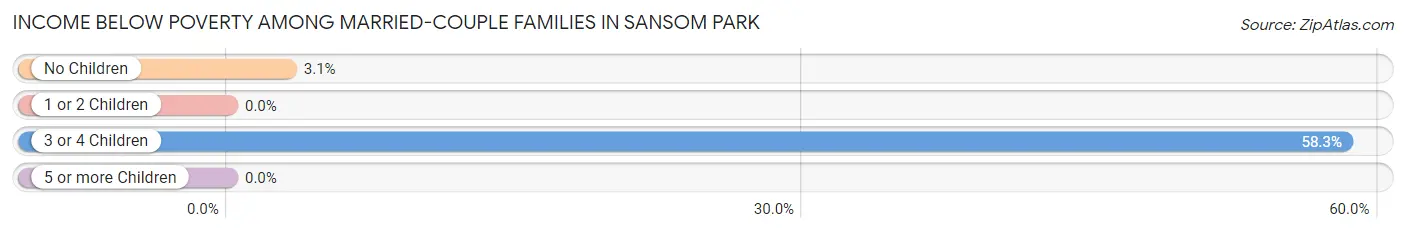
| Children | Above Poverty | Below Poverty |
| No Children | 221 (96.9%) | 7 (3.1%) |
| 1 or 2 Children | 274 (100.0%) | 0 (0.0%) |
| 3 or 4 Children | 96 (41.7%) | 134 (58.3%) |
| 5 or more Children | 0 (0.0%) | 0 (0.0%) |
| Total | 591 (80.7%) | 141 (19.3%) |
Income Below Poverty Among Single-Parent Households in Sansom Park
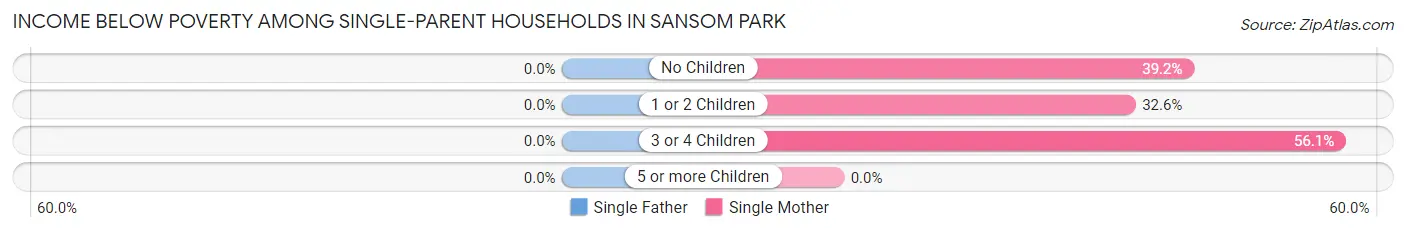
| Children | Single Father | Single Mother |
| No Children | 0 (0.0%) | 76 (39.2%) |
| 1 or 2 Children | 0 (0.0%) | 29 (32.6%) |
| 3 or 4 Children | 0 (0.0%) | 32 (56.1%) |
| 5 or more Children | 0 (0.0%) | 0 (0.0%) |
| Total | 0 (0.0%) | 137 (40.3%) |
Income Below Poverty Among Married-Couple vs Single-Parent Households in Sansom Park
The poverty data for Sansom Park shows that 141 of the married-couple family households (19.3%) and 137 of the single-parent households (39.1%) are living below the poverty level. Within the married-couple family households, those with 3 or 4 children have the highest poverty rate, with 134 households (58.3%) falling below the poverty line. Among the single-parent households, those with 3 or 4 children have the highest poverty rate, with 32 household (47.8%) living below poverty.
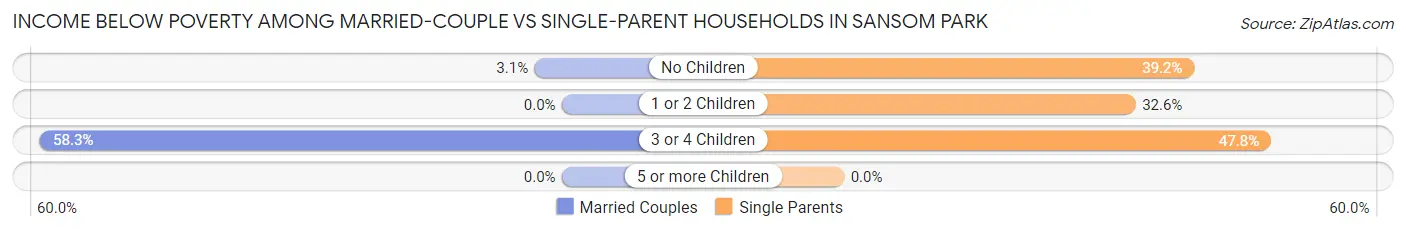
| Children | Married-Couple Families | Single-Parent Households |
| No Children | 7 (3.1%) | 76 (39.2%) |
| 1 or 2 Children | 0 (0.0%) | 29 (32.6%) |
| 3 or 4 Children | 134 (58.3%) | 32 (47.8%) |
| 5 or more Children | 0 (0.0%) | 0 (0.0%) |
| Total | 141 (19.3%) | 137 (39.1%) |
Employment Characteristics in Sansom Park
Employment by Class of Employer in Sansom Park
Among the 2,159 employed individuals in Sansom Park, private company employees (1,599 | 74.1%), self-employed (not incorporated) (207 | 9.6%), and local government employees (173 | 8.0%) make up the most common classes of employment.
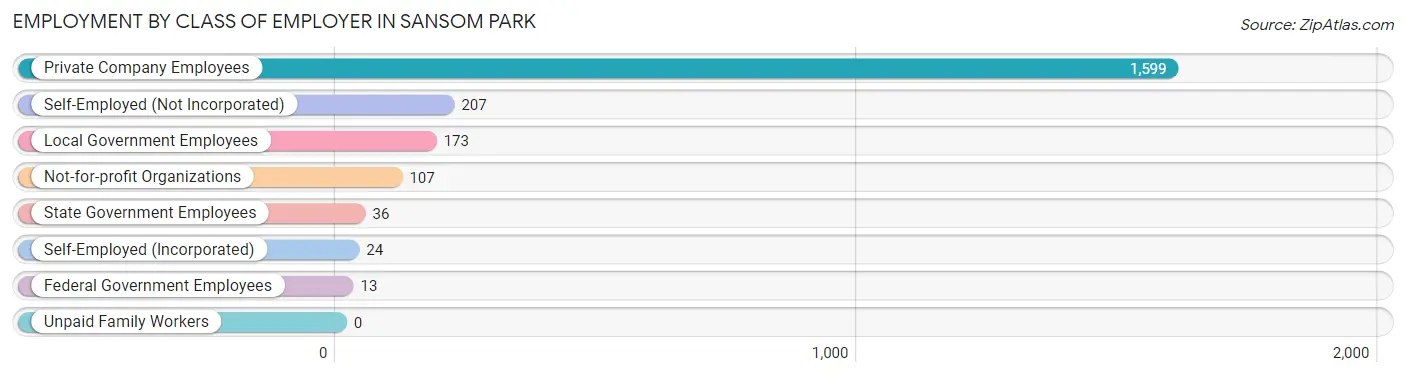
| Employer Class | # Employees | % Employees |
| Private Company Employees | 1,599 | 74.1% |
| Self-Employed (Incorporated) | 24 | 1.1% |
| Self-Employed (Not Incorporated) | 207 | 9.6% |
| Not-for-profit Organizations | 107 | 5.0% |
| Local Government Employees | 173 | 8.0% |
| State Government Employees | 36 | 1.7% |
| Federal Government Employees | 13 | 0.6% |
| Unpaid Family Workers | 0 | 0.0% |
| Total | 2,159 | 100.0% |
Employment Status by Age in Sansom Park
According to the labor force statistics for Sansom Park, out of the total population over 16 years of age (3,828), 62.9% or 2,408 individuals are in the labor force, with 7.4% or 178 of them unemployed. The age group with the highest labor force participation rate is 35 to 44 years, with 91.8% or 649 individuals in the labor force. Within the labor force, the 60 to 64 years age range has the highest percentage of unemployed individuals, with 29.6% or 53 of them being unemployed.
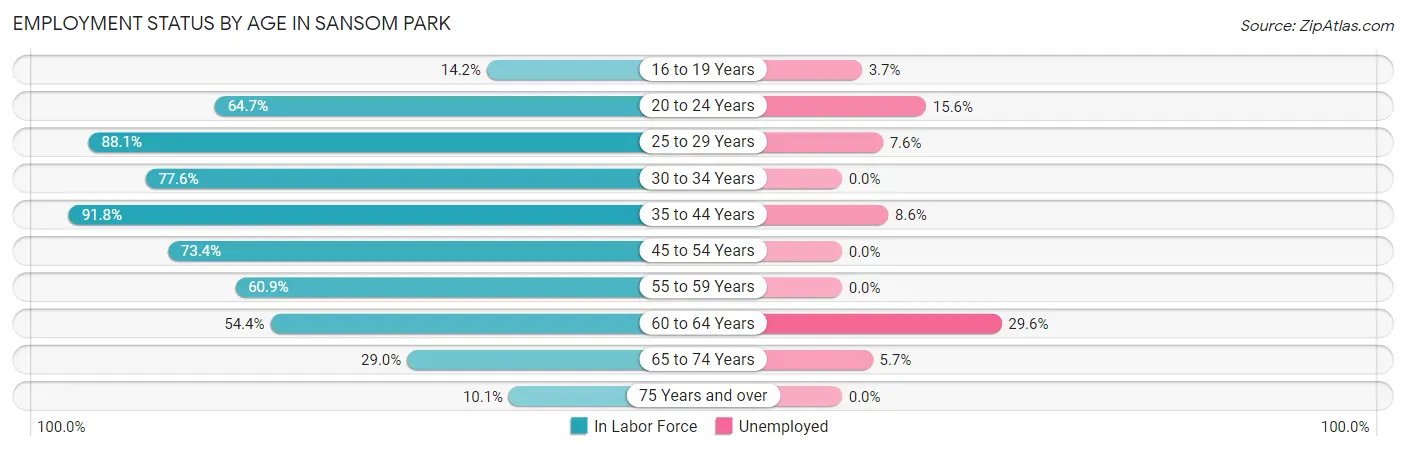
| Age Bracket | In Labor Force | Unemployed |
| 16 to 19 Years | 27 (14.2%) | 1 (3.7%) |
| 20 to 24 Years | 282 (64.7%) | 44 (15.6%) |
| 25 to 29 Years | 238 (88.1%) | 18 (7.6%) |
| 30 to 34 Years | 242 (77.6%) | 0 (0.0%) |
| 35 to 44 Years | 649 (91.8%) | 56 (8.6%) |
| 45 to 54 Years | 549 (73.4%) | 0 (0.0%) |
| 55 to 59 Years | 120 (60.9%) | 0 (0.0%) |
| 60 to 64 Years | 179 (54.4%) | 53 (29.6%) |
| 65 to 74 Years | 88 (29.0%) | 5 (5.7%) |
| 75 Years and over | 34 (10.1%) | 0 (0.0%) |
| Total | 2,408 (62.9%) | 178 (7.4%) |
Employment Status by Educational Attainment in Sansom Park
According to labor force statistics for Sansom Park, 77.1% of individuals (1,976) out of the total population between 25 and 64 years of age (2,563) are in the labor force, with 6.4% or 126 of them being unemployed. The group with the highest labor force participation rate are those with the educational attainment of high school diploma, with 83.4% or 1,213 individuals in the labor force. Within the labor force, individuals with bachelor's degree or higher education have the highest percentage of unemployment, with 29.9% or 26 of them being unemployed.
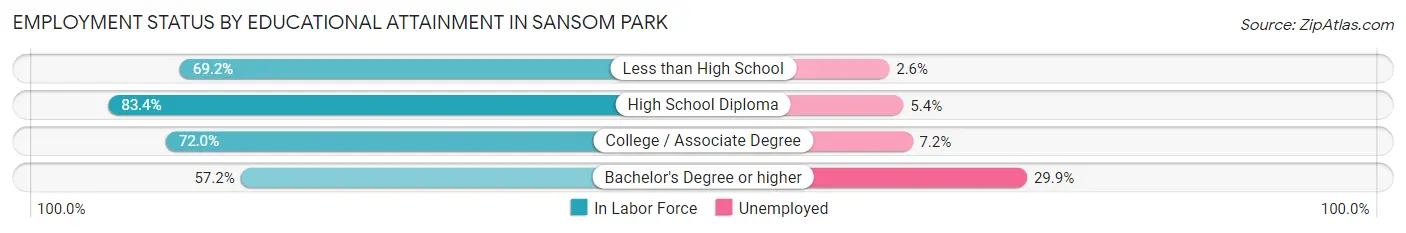
| Educational Attainment | In Labor Force | Unemployed |
| Less than High School | 304 (69.2%) | 11 (2.6%) |
| High School Diploma | 1,213 (83.4%) | 79 (5.4%) |
| College / Associate Degree | 373 (72.0%) | 37 (7.2%) |
| Bachelor's Degree or higher | 87 (57.2%) | 45 (29.9%) |
| Total | 1,976 (77.1%) | 164 (6.4%) |
Employment Occupations by Sex in Sansom Park
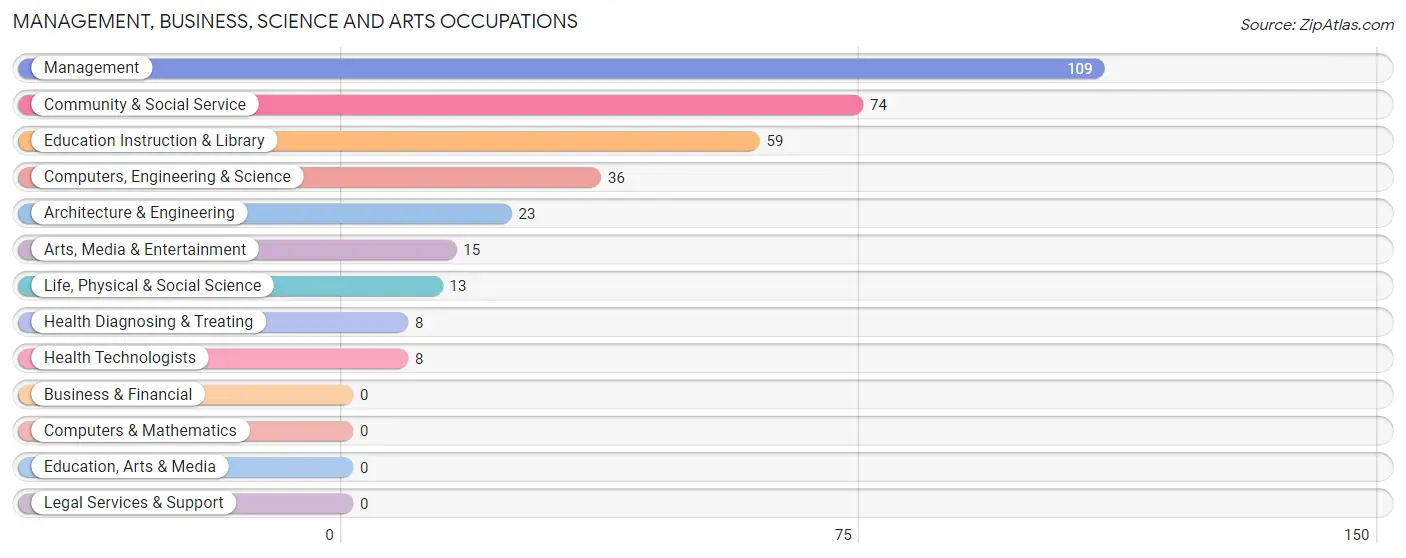
Management, Business, Science and Arts Occupations
The most common Management, Business, Science and Arts occupations in Sansom Park are Management (109 | 4.9%), Community & Social Service (74 | 3.3%), Education Instruction & Library (59 | 2.6%), Computers, Engineering & Science (36 | 1.6%), and Architecture & Engineering (23 | 1.0%).
Management, Business, Science and Arts Occupations by Sex
Within the Management, Business, Science and Arts occupations in Sansom Park, the most male-oriented occupations are Computers, Engineering & Science (100.0%), Architecture & Engineering (100.0%), and Life, Physical & Social Science (100.0%), while the most female-oriented occupations are Health Diagnosing & Treating (100.0%), Health Technologists (100.0%), and Education Instruction & Library (76.3%).
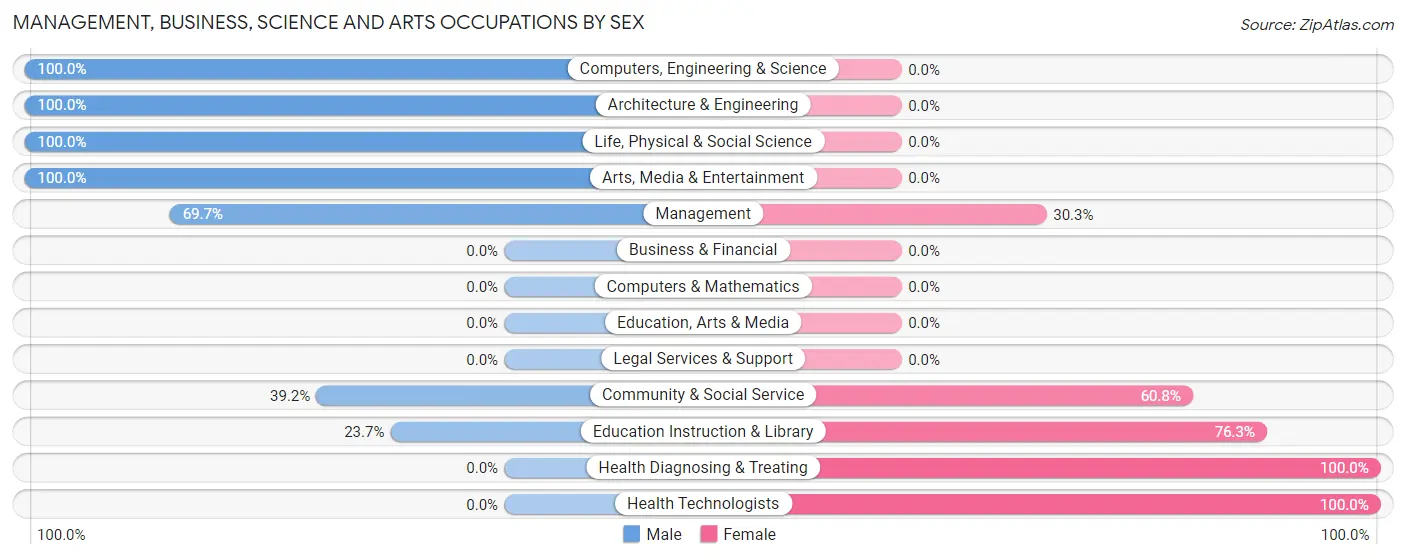
| Occupation | Male | Female |
| Management | 76 (69.7%) | 33 (30.3%) |
| Business & Financial | 0 (0.0%) | 0 (0.0%) |
| Computers, Engineering & Science | 36 (100.0%) | 0 (0.0%) |
| Computers & Mathematics | 0 (0.0%) | 0 (0.0%) |
| Architecture & Engineering | 23 (100.0%) | 0 (0.0%) |
| Life, Physical & Social Science | 13 (100.0%) | 0 (0.0%) |
| Community & Social Service | 29 (39.2%) | 45 (60.8%) |
| Education, Arts & Media | 0 (0.0%) | 0 (0.0%) |
| Legal Services & Support | 0 (0.0%) | 0 (0.0%) |
| Education Instruction & Library | 14 (23.7%) | 45 (76.3%) |
| Arts, Media & Entertainment | 15 (100.0%) | 0 (0.0%) |
| Health Diagnosing & Treating | 0 (0.0%) | 8 (100.0%) |
| Health Technologists | 0 (0.0%) | 8 (100.0%) |
| Total (Category) | 141 (62.1%) | 86 (37.9%) |
| Total (Overall) | 1,290 (57.8%) | 941 (42.2%) |
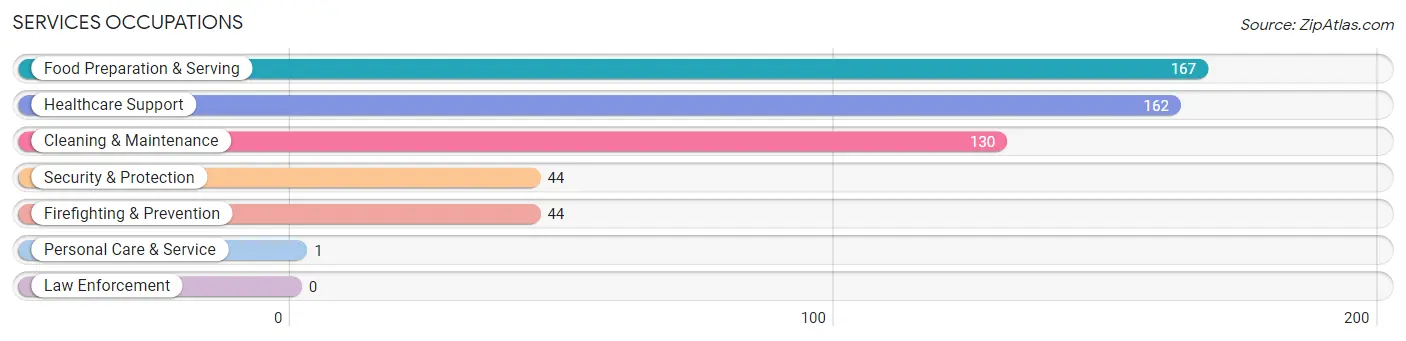
Services Occupations
The most common Services occupations in Sansom Park are Food Preparation & Serving (167 | 7.5%), Healthcare Support (162 | 7.3%), Cleaning & Maintenance (130 | 5.8%), Security & Protection (44 | 2.0%), and Firefighting & Prevention (44 | 2.0%).
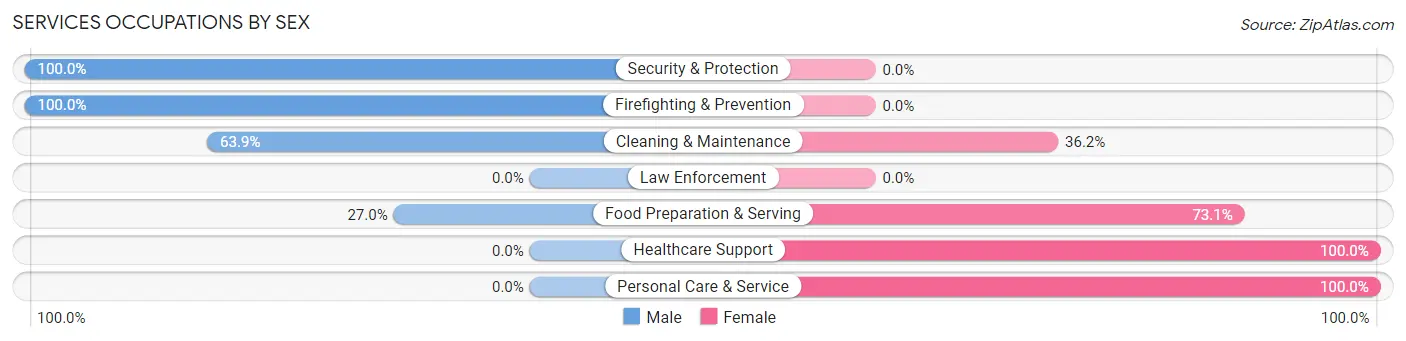
Services Occupations by Sex
Within the Services occupations in Sansom Park, the most male-oriented occupations are Security & Protection (100.0%), Firefighting & Prevention (100.0%), and Cleaning & Maintenance (63.8%), while the most female-oriented occupations are Healthcare Support (100.0%), Personal Care & Service (100.0%), and Food Preparation & Serving (73.1%).
| Occupation | Male | Female |
| Healthcare Support | 0 (0.0%) | 162 (100.0%) |
| Security & Protection | 44 (100.0%) | 0 (0.0%) |
| Firefighting & Prevention | 44 (100.0%) | 0 (0.0%) |
| Law Enforcement | 0 (0.0%) | 0 (0.0%) |
| Food Preparation & Serving | 45 (27.0%) | 122 (73.1%) |
| Cleaning & Maintenance | 83 (63.8%) | 47 (36.1%) |
| Personal Care & Service | 0 (0.0%) | 1 (100.0%) |
| Total (Category) | 172 (34.1%) | 332 (65.9%) |
| Total (Overall) | 1,290 (57.8%) | 941 (42.2%) |
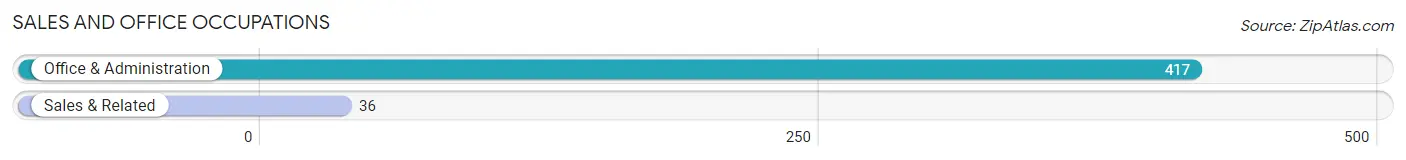
Sales and Office Occupations
The most common Sales and Office occupations in Sansom Park are Office & Administration (417 | 18.7%), and Sales & Related (36 | 1.6%).
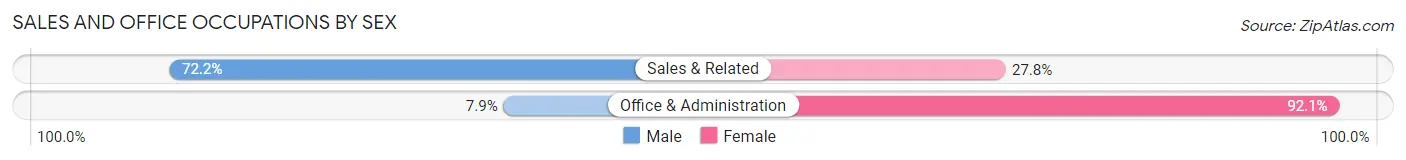
Sales and Office Occupations by Sex
| Occupation | Male | Female |
| Sales & Related | 26 (72.2%) | 10 (27.8%) |
| Office & Administration | 33 (7.9%) | 384 (92.1%) |
| Total (Category) | 59 (13.0%) | 394 (87.0%) |
| Total (Overall) | 1,290 (57.8%) | 941 (42.2%) |
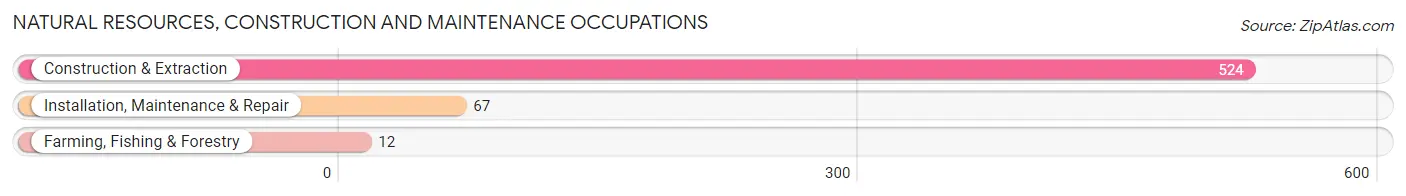
Natural Resources, Construction and Maintenance Occupations
The most common Natural Resources, Construction and Maintenance occupations in Sansom Park are Construction & Extraction (524 | 23.5%), Installation, Maintenance & Repair (67 | 3.0%), and Farming, Fishing & Forestry (12 | 0.5%).
Natural Resources, Construction and Maintenance Occupations by Sex
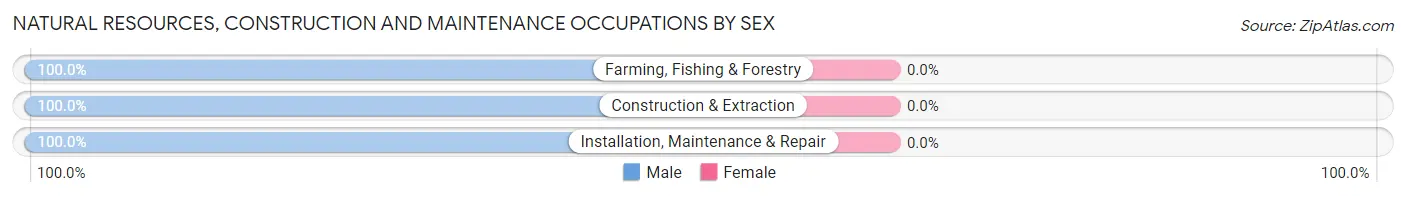
| Occupation | Male | Female |
| Farming, Fishing & Forestry | 12 (100.0%) | 0 (0.0%) |
| Construction & Extraction | 524 (100.0%) | 0 (0.0%) |
| Installation, Maintenance & Repair | 67 (100.0%) | 0 (0.0%) |
| Total (Category) | 603 (100.0%) | 0 (0.0%) |
| Total (Overall) | 1,290 (57.8%) | 941 (42.2%) |
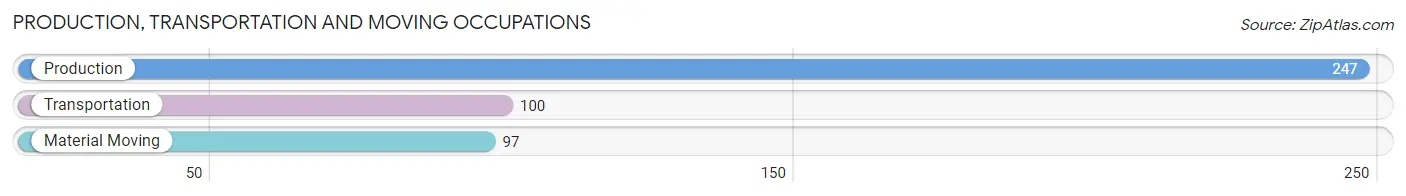
Production, Transportation and Moving Occupations
The most common Production, Transportation and Moving occupations in Sansom Park are Production (247 | 11.1%), Transportation (100 | 4.5%), and Material Moving (97 | 4.3%).
Production, Transportation and Moving Occupations by Sex
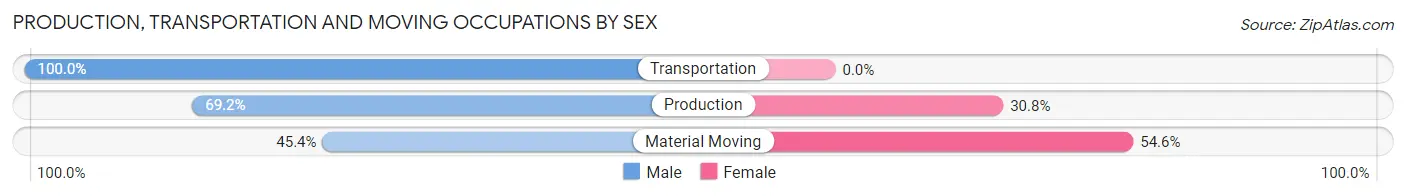
| Occupation | Male | Female |
| Production | 171 (69.2%) | 76 (30.8%) |
| Transportation | 100 (100.0%) | 0 (0.0%) |
| Material Moving | 44 (45.4%) | 53 (54.6%) |
| Total (Category) | 315 (71.0%) | 129 (29.0%) |
| Total (Overall) | 1,290 (57.8%) | 941 (42.2%) |
Employment Industries by Sex in Sansom Park
Employment Industries in Sansom Park
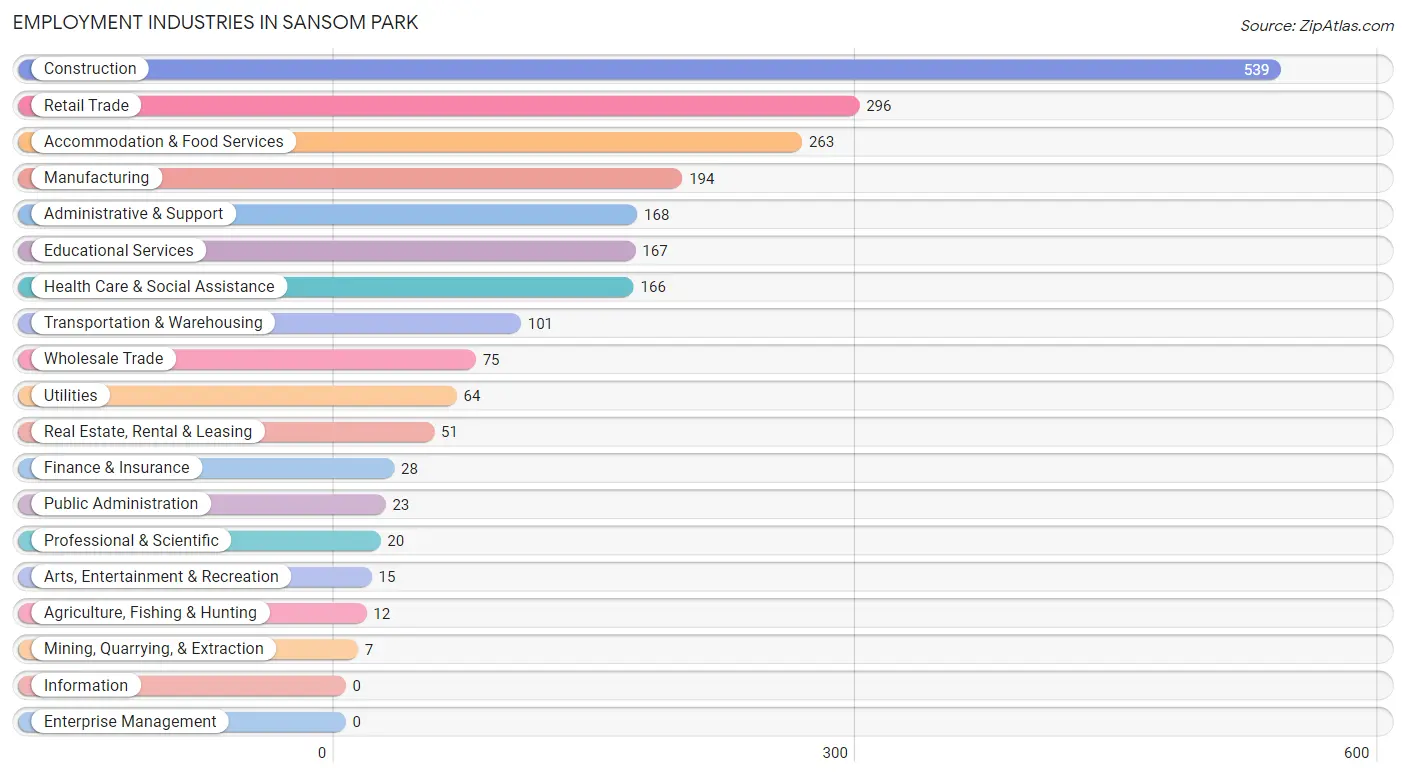
The major employment industries in Sansom Park include Construction (539 | 24.2%), Retail Trade (296 | 13.3%), Accommodation & Food Services (263 | 11.8%), Manufacturing (194 | 8.7%), and Administrative & Support (168 | 7.5%).
Employment Industries by Sex in Sansom Park
The Sansom Park industries that see more men than women are Agriculture, Fishing & Hunting (100.0%), Mining, Quarrying, & Extraction (100.0%), and Arts, Entertainment & Recreation (100.0%), whereas the industries that tend to have a higher number of women are Finance & Insurance (100.0%), Professional & Scientific (100.0%), and Health Care & Social Assistance (100.0%).

| Industry | Male | Female |
| Agriculture, Fishing & Hunting | 12 (100.0%) | 0 (0.0%) |
| Mining, Quarrying, & Extraction | 7 (100.0%) | 0 (0.0%) |
| Construction | 488 (90.5%) | 51 (9.5%) |
| Manufacturing | 79 (40.7%) | 115 (59.3%) |
| Wholesale Trade | 44 (58.7%) | 31 (41.3%) |
| Retail Trade | 254 (85.8%) | 42 (14.2%) |
| Transportation & Warehousing | 88 (87.1%) | 13 (12.9%) |
| Utilities | 13 (20.3%) | 51 (79.7%) |
| Information | 0 (0.0%) | 0 (0.0%) |
| Finance & Insurance | 0 (0.0%) | 28 (100.0%) |
| Real Estate, Rental & Leasing | 19 (37.2%) | 32 (62.7%) |
| Professional & Scientific | 0 (0.0%) | 20 (100.0%) |
| Enterprise Management | 0 (0.0%) | 0 (0.0%) |
| Administrative & Support | 83 (49.4%) | 85 (50.6%) |
| Educational Services | 67 (40.1%) | 100 (59.9%) |
| Health Care & Social Assistance | 0 (0.0%) | 166 (100.0%) |
| Arts, Entertainment & Recreation | 15 (100.0%) | 0 (0.0%) |
| Accommodation & Food Services | 89 (33.8%) | 174 (66.2%) |
| Public Administration | 0 (0.0%) | 23 (100.0%) |
| Total | 1,290 (57.8%) | 941 (42.2%) |
Education in Sansom Park
School Enrollment in Sansom Park
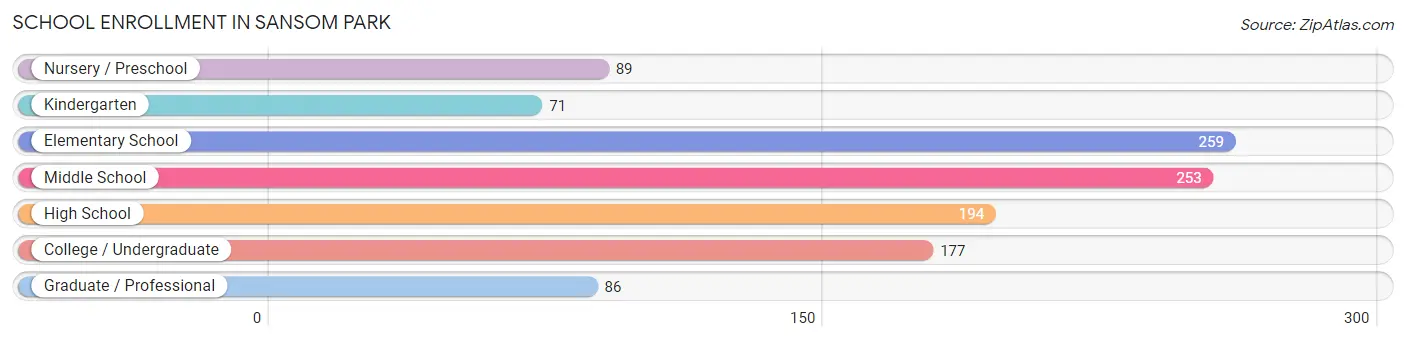
The most common levels of schooling among the 1,129 students in Sansom Park are elementary school (259 | 22.9%), middle school (253 | 22.4%), and high school (194 | 17.2%).
| School Level | # Students | % Students |
| Nursery / Preschool | 89 | 7.9% |
| Kindergarten | 71 | 6.3% |
| Elementary School | 259 | 22.9% |
| Middle School | 253 | 22.4% |
| High School | 194 | 17.2% |
| College / Undergraduate | 177 | 15.7% |
| Graduate / Professional | 86 | 7.6% |
| Total | 1,129 | 100.0% |
School Enrollment by Age by Funding Source in Sansom Park
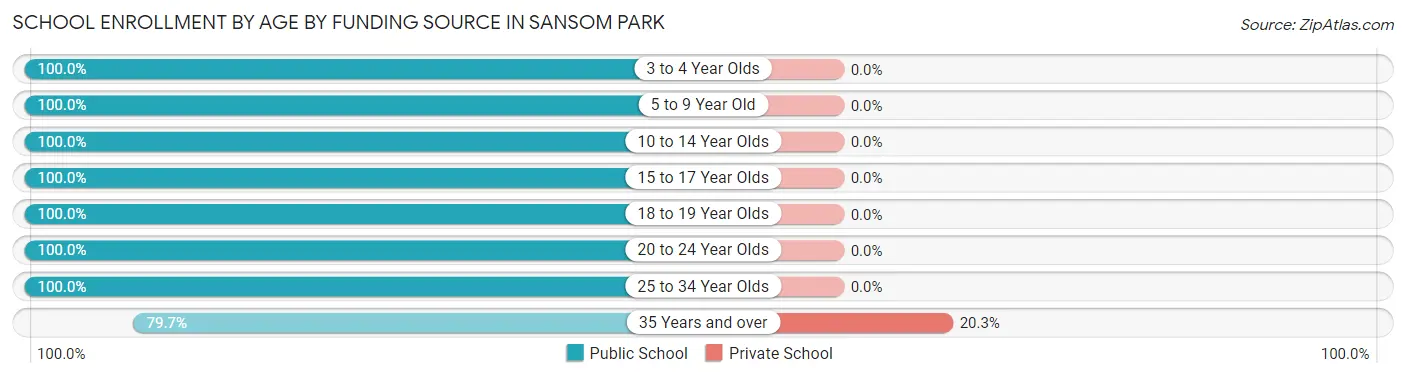
Out of a total of 1,129 students who are enrolled in schools in Sansom Park, 26 (2.3%) attend a private institution, while the remaining 1,103 (97.7%) are enrolled in public schools. The age group of 35 years and over has the highest likelihood of being enrolled in private schools, with 26 (20.3% in the age bracket) enrolled. Conversely, the age group of 3 to 4 year olds has the lowest likelihood of being enrolled in a private school, with 57 (100.0% in the age bracket) attending a public institution.
| Age Bracket | Public School | Private School |
| 3 to 4 Year Olds | 57 (100.0%) | 0 (0.0%) |
| 5 to 9 Year Old | 301 (100.0%) | 0 (0.0%) |
| 10 to 14 Year Olds | 367 (100.0%) | 0 (0.0%) |
| 15 to 17 Year Olds | 141 (100.0%) | 0 (0.0%) |
| 18 to 19 Year Olds | 11 (100.0%) | 0 (0.0%) |
| 20 to 24 Year Olds | 80 (100.0%) | 0 (0.0%) |
| 25 to 34 Year Olds | 44 (100.0%) | 0 (0.0%) |
| 35 Years and over | 102 (79.7%) | 26 (20.3%) |
| Total | 1,103 (97.7%) | 26 (2.3%) |
Educational Attainment by Field of Study in Sansom Park
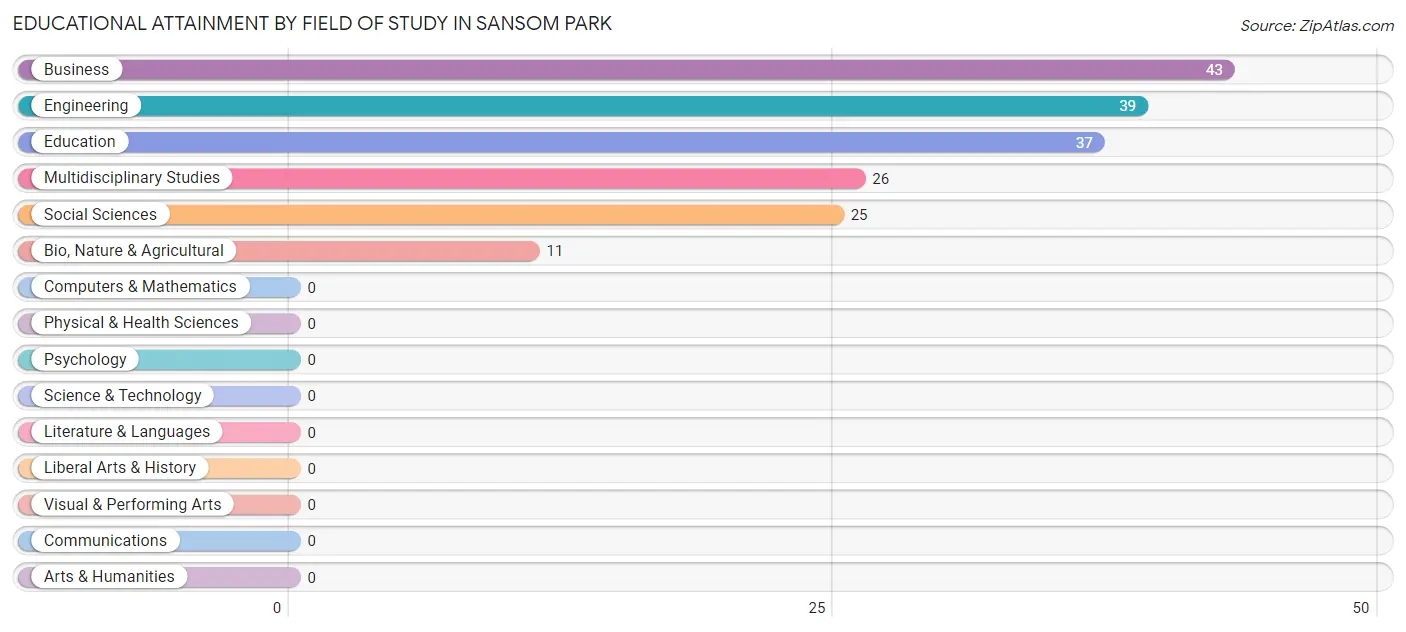
Business (43 | 23.8%), engineering (39 | 21.5%), education (37 | 20.4%), multidisciplinary studies (26 | 14.4%), and social sciences (25 | 13.8%) are the most common fields of study among 181 individuals in Sansom Park who have obtained a bachelor's degree or higher.
| Field of Study | # Graduates | % Graduates |
| Computers & Mathematics | 0 | 0.0% |
| Bio, Nature & Agricultural | 11 | 6.1% |
| Physical & Health Sciences | 0 | 0.0% |
| Psychology | 0 | 0.0% |
| Social Sciences | 25 | 13.8% |
| Engineering | 39 | 21.5% |
| Multidisciplinary Studies | 26 | 14.4% |
| Science & Technology | 0 | 0.0% |
| Business | 43 | 23.8% |
| Education | 37 | 20.4% |
| Literature & Languages | 0 | 0.0% |
| Liberal Arts & History | 0 | 0.0% |
| Visual & Performing Arts | 0 | 0.0% |
| Communications | 0 | 0.0% |
| Arts & Humanities | 0 | 0.0% |
| Total | 181 | 100.0% |
Transportation & Commute in Sansom Park
Vehicle Availability by Sex in Sansom Park
The most prevalent vehicle ownership categories in Sansom Park are males with 3 vehicles (603, accounting for 46.7%) and females with 3 vehicles (345, making up 69.4%).
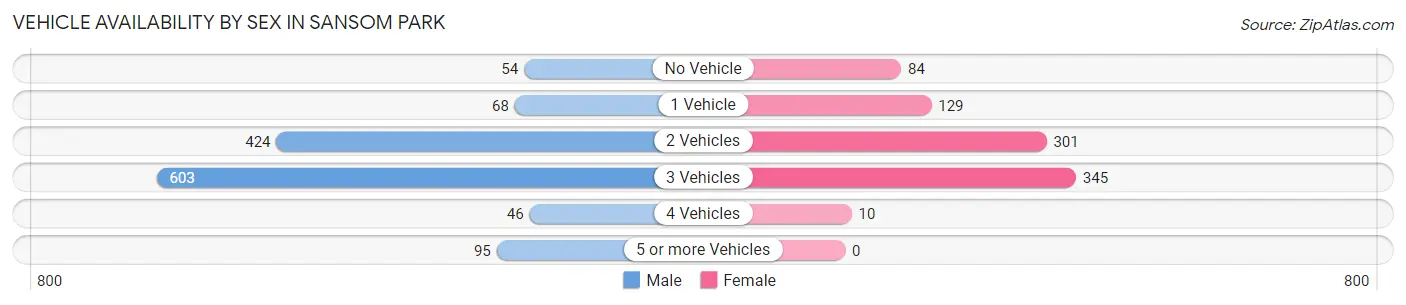
| Vehicles Available | Male | Female |
| No Vehicle | 54 (4.2%) | 84 (9.7%) |
| 1 Vehicle | 68 (5.3%) | 129 (14.8%) |
| 2 Vehicles | 424 (32.9%) | 301 (34.6%) |
| 3 Vehicles | 603 (46.7%) | 345 (39.7%) |
| 4 Vehicles | 46 (3.6%) | 10 (1.1%) |
| 5 or more Vehicles | 95 (7.4%) | 0 (0.0%) |
| Total | 1,290 (100.0%) | 869 (100.0%) |
Commute Time in Sansom Park
The most frequently occuring commute durations in Sansom Park are 20 to 24 minutes (451 commuters, 21.7%), 30 to 34 minutes (386 commuters, 18.6%), and 45 to 59 minutes (337 commuters, 16.3%).
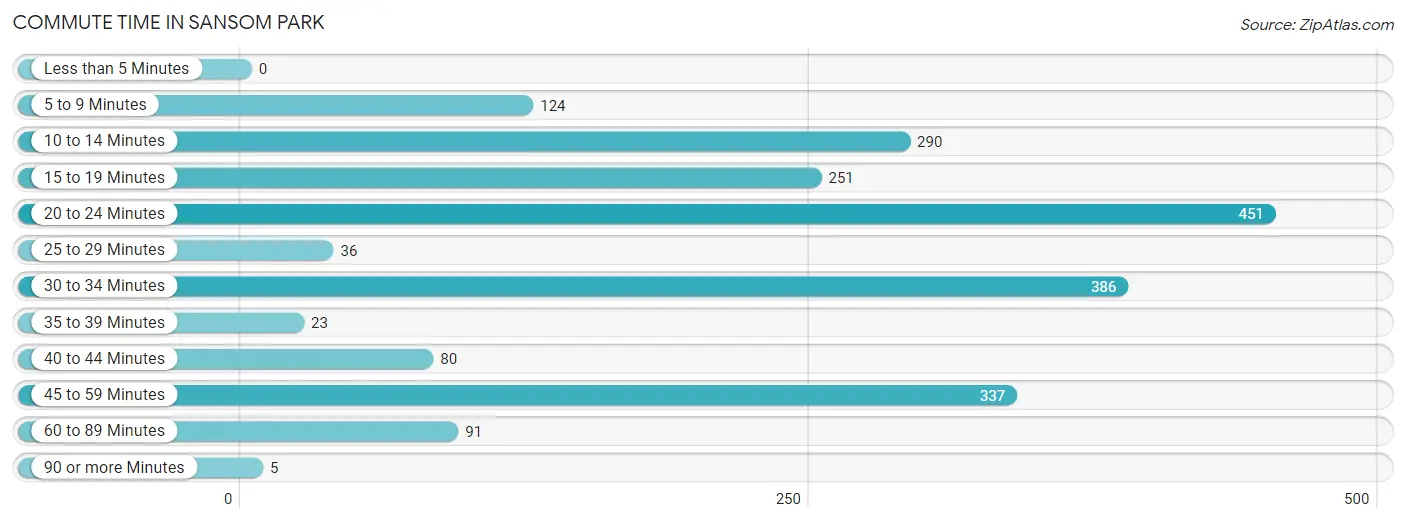
| Commute Time | # Commuters | % Commuters |
| Less than 5 Minutes | 0 | 0.0% |
| 5 to 9 Minutes | 124 | 6.0% |
| 10 to 14 Minutes | 290 | 14.0% |
| 15 to 19 Minutes | 251 | 12.1% |
| 20 to 24 Minutes | 451 | 21.7% |
| 25 to 29 Minutes | 36 | 1.7% |
| 30 to 34 Minutes | 386 | 18.6% |
| 35 to 39 Minutes | 23 | 1.1% |
| 40 to 44 Minutes | 80 | 3.9% |
| 45 to 59 Minutes | 337 | 16.3% |
| 60 to 89 Minutes | 91 | 4.4% |
| 90 or more Minutes | 5 | 0.2% |
Commute Time by Sex in Sansom Park
The most common commute times in Sansom Park are 30 to 34 minutes (335 commuters, 26.8%) for males and 20 to 24 minutes (306 commuters, 37.2%) for females.
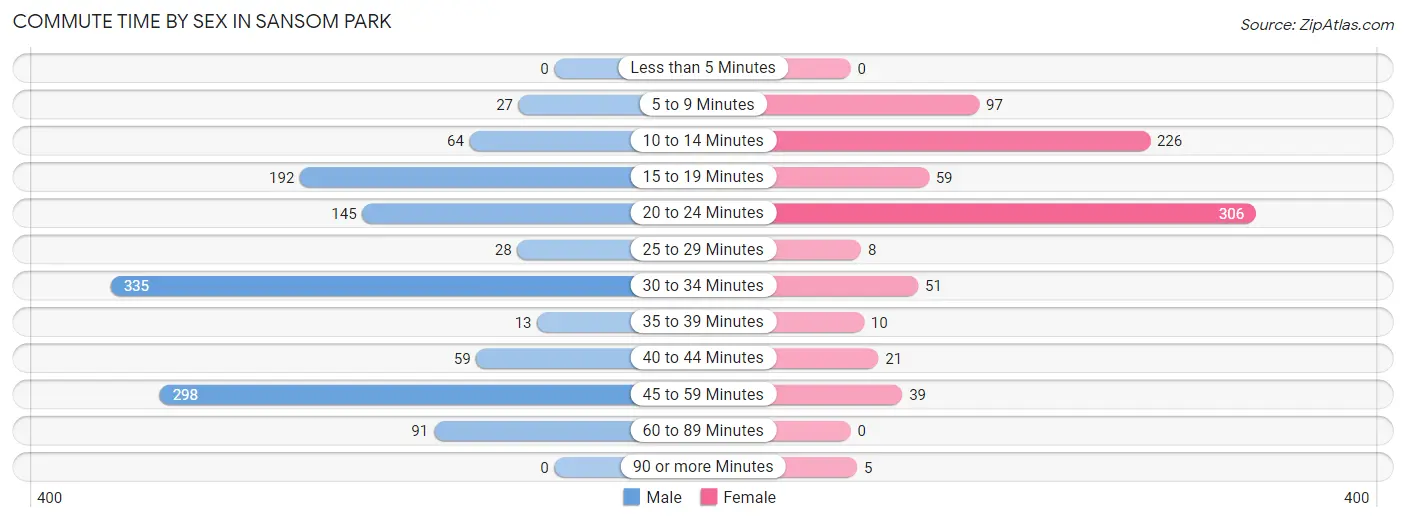
| Commute Time | Male | Female |
| Less than 5 Minutes | 0 (0.0%) | 0 (0.0%) |
| 5 to 9 Minutes | 27 (2.2%) | 97 (11.8%) |
| 10 to 14 Minutes | 64 (5.1%) | 226 (27.5%) |
| 15 to 19 Minutes | 192 (15.3%) | 59 (7.2%) |
| 20 to 24 Minutes | 145 (11.6%) | 306 (37.2%) |
| 25 to 29 Minutes | 28 (2.2%) | 8 (1.0%) |
| 30 to 34 Minutes | 335 (26.8%) | 51 (6.2%) |
| 35 to 39 Minutes | 13 (1.0%) | 10 (1.2%) |
| 40 to 44 Minutes | 59 (4.7%) | 21 (2.5%) |
| 45 to 59 Minutes | 298 (23.8%) | 39 (4.7%) |
| 60 to 89 Minutes | 91 (7.3%) | 0 (0.0%) |
| 90 or more Minutes | 0 (0.0%) | 5 (0.6%) |
Time of Departure to Work by Sex in Sansom Park
The most frequent times of departure to work in Sansom Park are 7:00 AM to 7:29 AM (251, 20.1%) for males and 12:00 PM to 3:59 PM (182, 22.1%) for females.
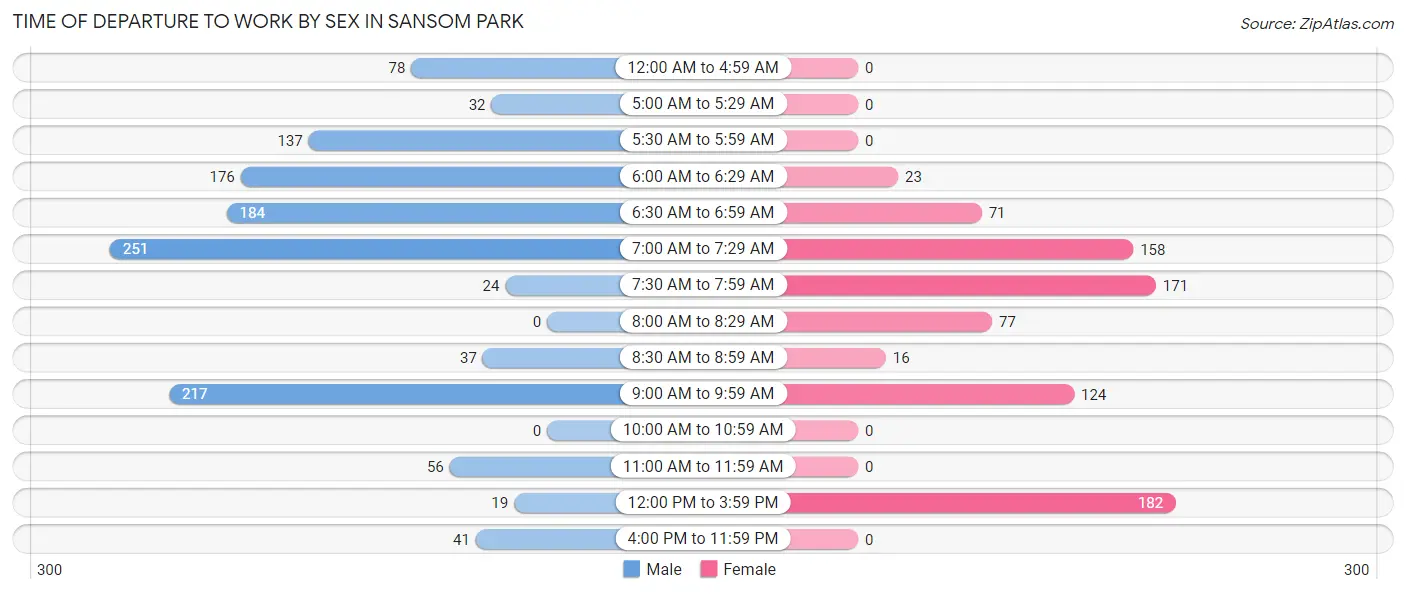
| Time of Departure | Male | Female |
| 12:00 AM to 4:59 AM | 78 (6.2%) | 0 (0.0%) |
| 5:00 AM to 5:29 AM | 32 (2.6%) | 0 (0.0%) |
| 5:30 AM to 5:59 AM | 137 (10.9%) | 0 (0.0%) |
| 6:00 AM to 6:29 AM | 176 (14.1%) | 23 (2.8%) |
| 6:30 AM to 6:59 AM | 184 (14.7%) | 71 (8.6%) |
| 7:00 AM to 7:29 AM | 251 (20.1%) | 158 (19.2%) |
| 7:30 AM to 7:59 AM | 24 (1.9%) | 171 (20.8%) |
| 8:00 AM to 8:29 AM | 0 (0.0%) | 77 (9.4%) |
| 8:30 AM to 8:59 AM | 37 (3.0%) | 16 (1.9%) |
| 9:00 AM to 9:59 AM | 217 (17.3%) | 124 (15.1%) |
| 10:00 AM to 10:59 AM | 0 (0.0%) | 0 (0.0%) |
| 11:00 AM to 11:59 AM | 56 (4.5%) | 0 (0.0%) |
| 12:00 PM to 3:59 PM | 19 (1.5%) | 182 (22.1%) |
| 4:00 PM to 11:59 PM | 41 (3.3%) | 0 (0.0%) |
| Total | 1,252 (100.0%) | 822 (100.0%) |
Housing Occupancy in Sansom Park
Occupancy by Ownership in Sansom Park
Of the total 1,635 dwellings in Sansom Park, owner-occupied units account for 748 (45.8%), while renter-occupied units make up 887 (54.2%).
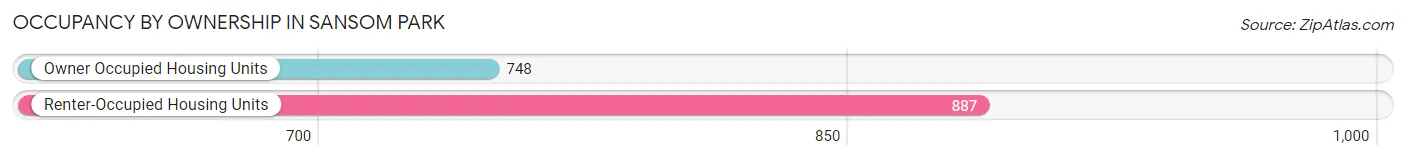
| Occupancy | # Housing Units | % Housing Units |
| Owner Occupied Housing Units | 748 | 45.8% |
| Renter-Occupied Housing Units | 887 | 54.2% |
| Total Occupied Housing Units | 1,635 | 100.0% |
Occupancy by Household Size in Sansom Park
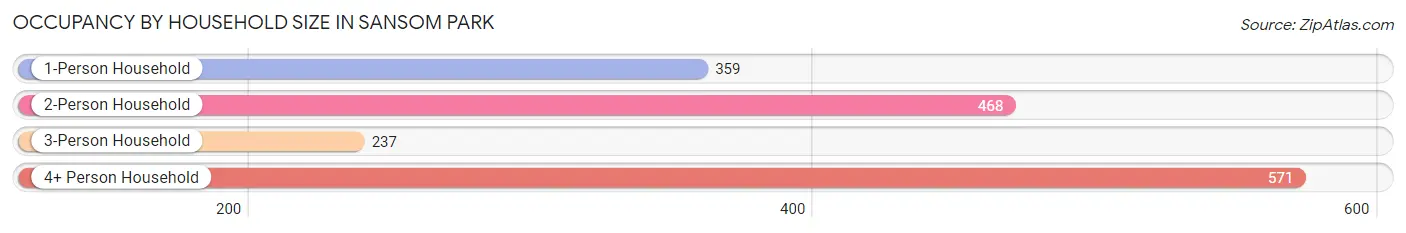
| Household Size | # Housing Units | % Housing Units |
| 1-Person Household | 359 | 22.0% |
| 2-Person Household | 468 | 28.6% |
| 3-Person Household | 237 | 14.5% |
| 4+ Person Household | 571 | 34.9% |
| Total Housing Units | 1,635 | 100.0% |
Occupancy by Ownership by Household Size in Sansom Park
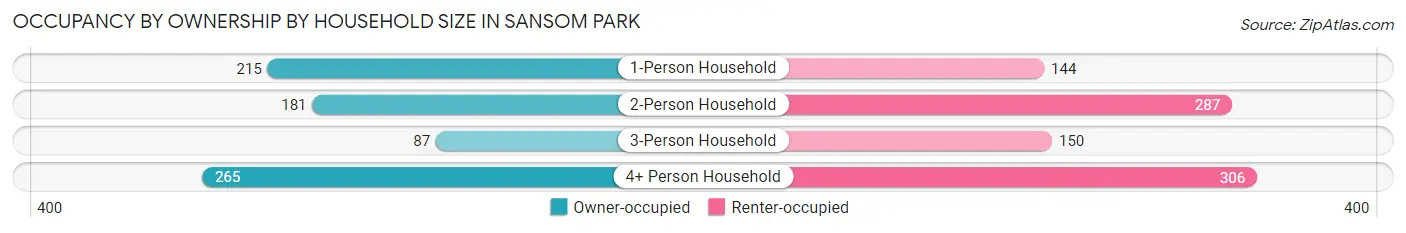
| Household Size | Owner-occupied | Renter-occupied |
| 1-Person Household | 215 (59.9%) | 144 (40.1%) |
| 2-Person Household | 181 (38.7%) | 287 (61.3%) |
| 3-Person Household | 87 (36.7%) | 150 (63.3%) |
| 4+ Person Household | 265 (46.4%) | 306 (53.6%) |
| Total Housing Units | 748 (45.8%) | 887 (54.2%) |
Occupancy by Educational Attainment in Sansom Park
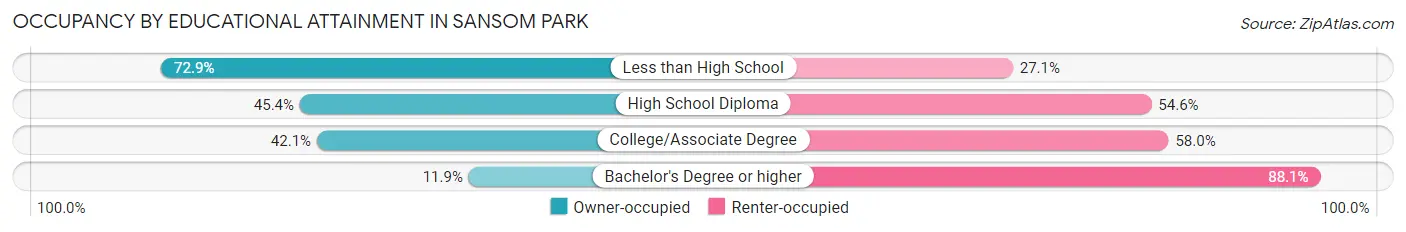
| Household Size | Owner-occupied | Renter-occupied |
| Less than High School | 105 (72.9%) | 39 (27.1%) |
| High School Diploma | 487 (45.4%) | 585 (54.6%) |
| College/Associate Degree | 148 (42.0%) | 204 (58.0%) |
| Bachelor's Degree or higher | 8 (11.9%) | 59 (88.1%) |
Occupancy by Age of Householder in Sansom Park
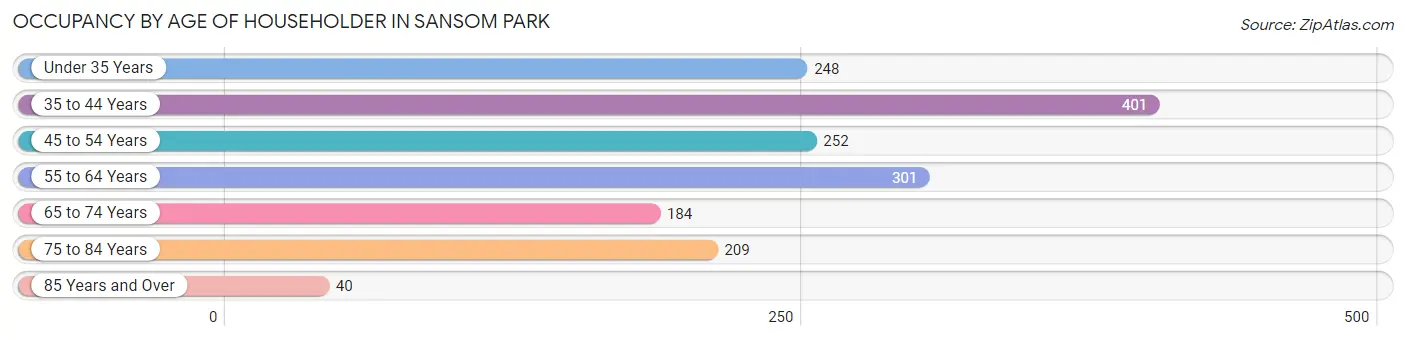
| Age Bracket | # Households | % Households |
| Under 35 Years | 248 | 15.2% |
| 35 to 44 Years | 401 | 24.5% |
| 45 to 54 Years | 252 | 15.4% |
| 55 to 64 Years | 301 | 18.4% |
| 65 to 74 Years | 184 | 11.3% |
| 75 to 84 Years | 209 | 12.8% |
| 85 Years and Over | 40 | 2.5% |
| Total | 1,635 | 100.0% |
Housing Finances in Sansom Park
Median Income by Occupancy in Sansom Park
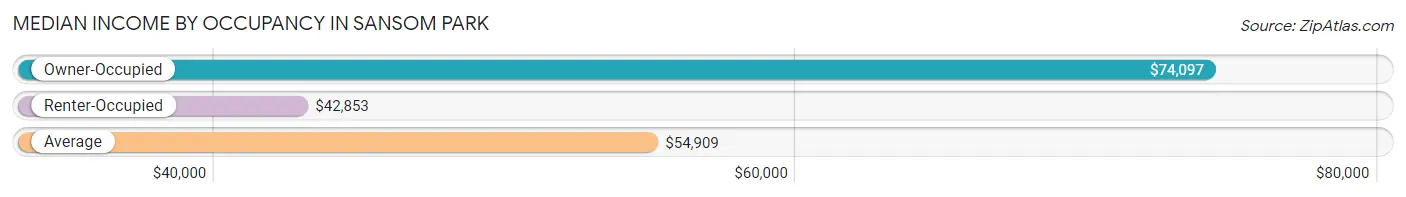
| Occupancy Type | # Households | Median Income |
| Owner-Occupied | 748 (45.8%) | $74,097 |
| Renter-Occupied | 887 (54.2%) | $42,853 |
| Average | 1,635 (100.0%) | $54,909 |
Occupancy by Householder Income Bracket in Sansom Park
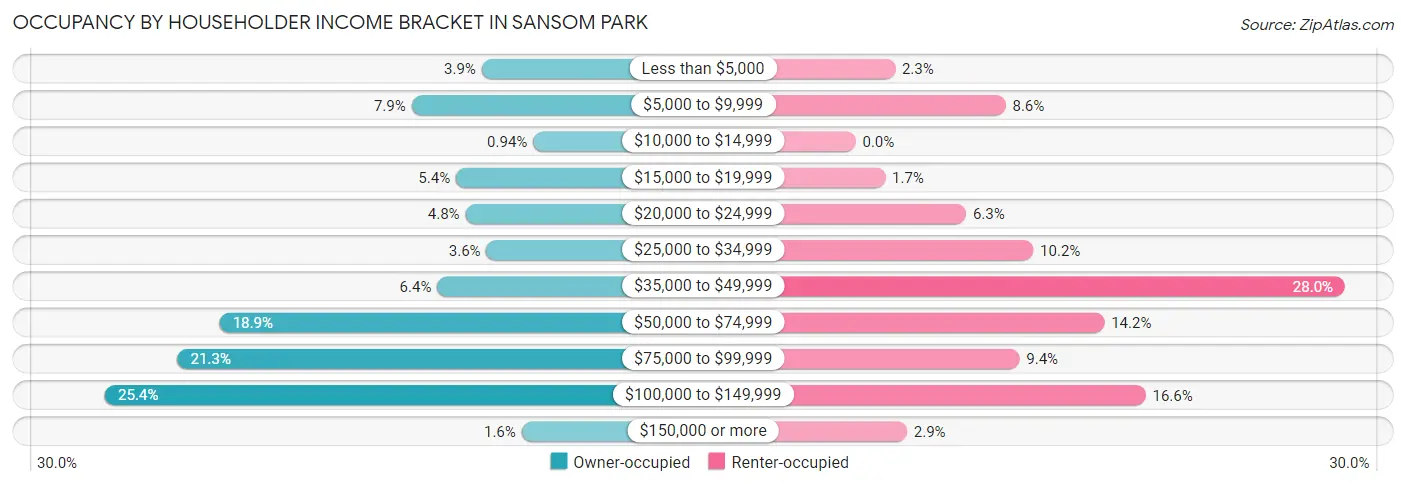
| Income Bracket | Owner-occupied | Renter-occupied |
| Less than $5,000 | 29 (3.9%) | 20 (2.2%) |
| $5,000 to $9,999 | 59 (7.9%) | 76 (8.6%) |
| $10,000 to $14,999 | 7 (0.9%) | 0 (0.0%) |
| $15,000 to $19,999 | 40 (5.3%) | 15 (1.7%) |
| $20,000 to $24,999 | 36 (4.8%) | 56 (6.3%) |
| $25,000 to $34,999 | 27 (3.6%) | 90 (10.2%) |
| $35,000 to $49,999 | 48 (6.4%) | 248 (28.0%) |
| $50,000 to $74,999 | 141 (18.9%) | 126 (14.2%) |
| $75,000 to $99,999 | 159 (21.3%) | 83 (9.4%) |
| $100,000 to $149,999 | 190 (25.4%) | 147 (16.6%) |
| $150,000 or more | 12 (1.6%) | 26 (2.9%) |
| Total | 748 (100.0%) | 887 (100.0%) |
Monthly Housing Cost Tiers in Sansom Park
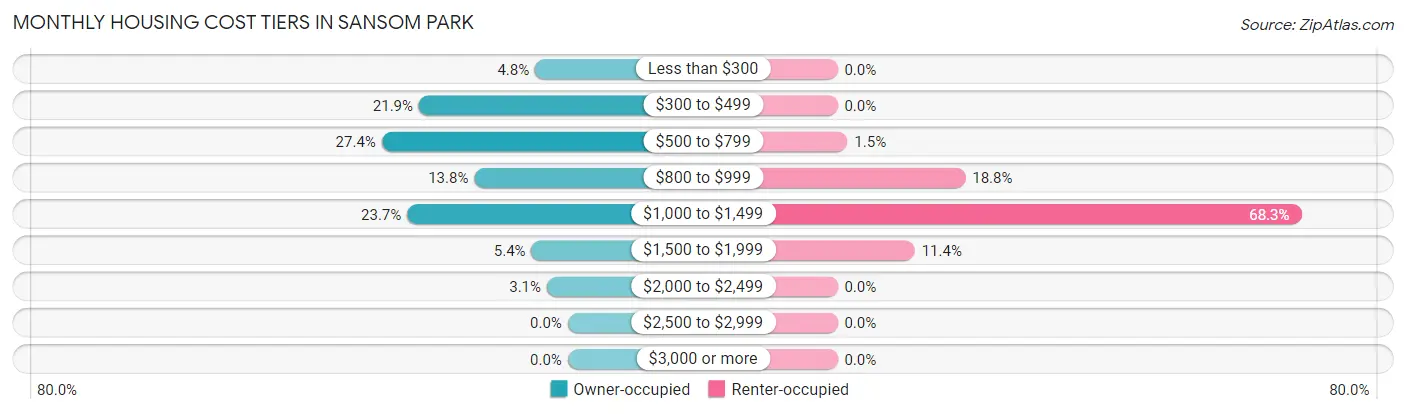
| Monthly Cost | Owner-occupied | Renter-occupied |
| Less than $300 | 36 (4.8%) | 0 (0.0%) |
| $300 to $499 | 164 (21.9%) | 0 (0.0%) |
| $500 to $799 | 205 (27.4%) | 13 (1.5%) |
| $800 to $999 | 103 (13.8%) | 167 (18.8%) |
| $1,000 to $1,499 | 177 (23.7%) | 606 (68.3%) |
| $1,500 to $1,999 | 40 (5.3%) | 101 (11.4%) |
| $2,000 to $2,499 | 23 (3.1%) | 0 (0.0%) |
| $2,500 to $2,999 | 0 (0.0%) | 0 (0.0%) |
| $3,000 or more | 0 (0.0%) | 0 (0.0%) |
| Total | 748 (100.0%) | 887 (100.0%) |
Physical Housing Characteristics in Sansom Park
Housing Structures in Sansom Park
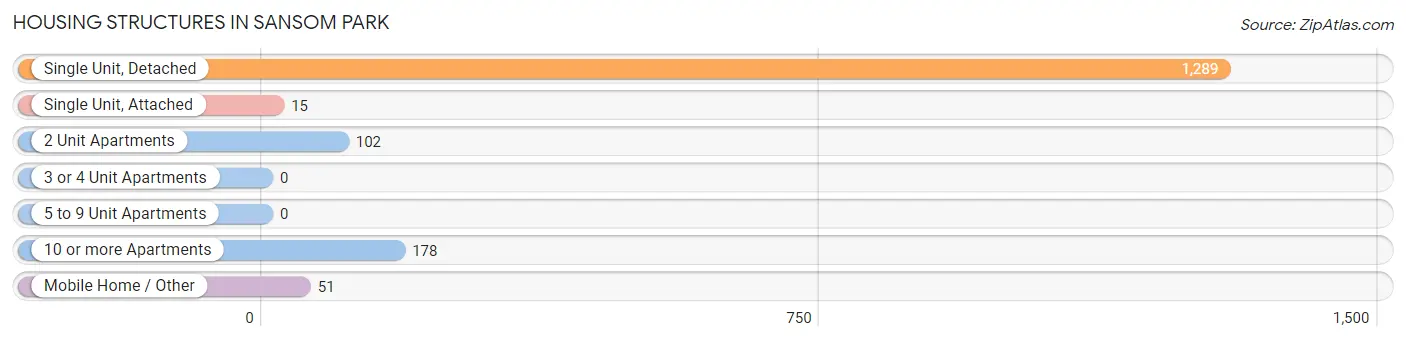
| Structure Type | # Housing Units | % Housing Units |
| Single Unit, Detached | 1,289 | 78.8% |
| Single Unit, Attached | 15 | 0.9% |
| 2 Unit Apartments | 102 | 6.2% |
| 3 or 4 Unit Apartments | 0 | 0.0% |
| 5 to 9 Unit Apartments | 0 | 0.0% |
| 10 or more Apartments | 178 | 10.9% |
| Mobile Home / Other | 51 | 3.1% |
| Total | 1,635 | 100.0% |
Housing Structures by Occupancy in Sansom Park
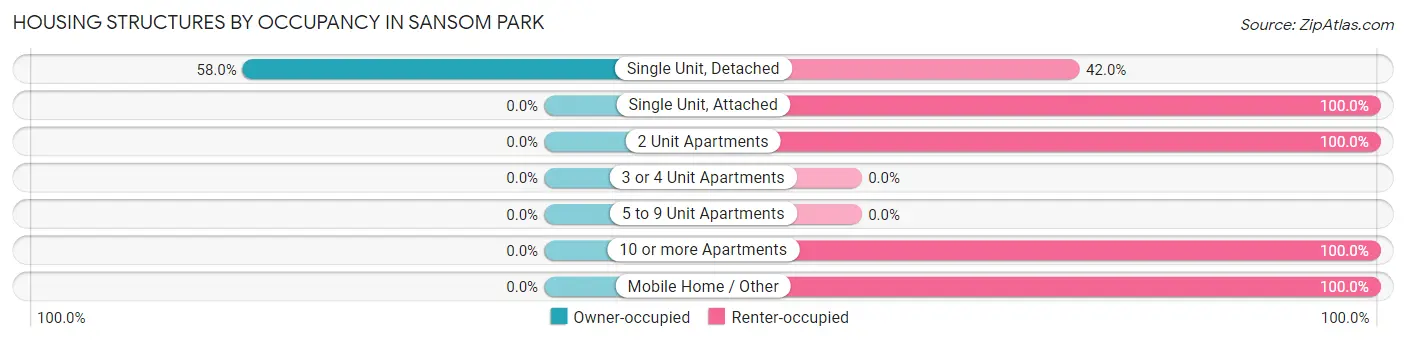
| Structure Type | Owner-occupied | Renter-occupied |
| Single Unit, Detached | 748 (58.0%) | 541 (42.0%) |
| Single Unit, Attached | 0 (0.0%) | 15 (100.0%) |
| 2 Unit Apartments | 0 (0.0%) | 102 (100.0%) |
| 3 or 4 Unit Apartments | 0 (0.0%) | 0 (0.0%) |
| 5 to 9 Unit Apartments | 0 (0.0%) | 0 (0.0%) |
| 10 or more Apartments | 0 (0.0%) | 178 (100.0%) |
| Mobile Home / Other | 0 (0.0%) | 51 (100.0%) |
| Total | 748 (45.8%) | 887 (54.2%) |
Housing Structures by Number of Rooms in Sansom Park
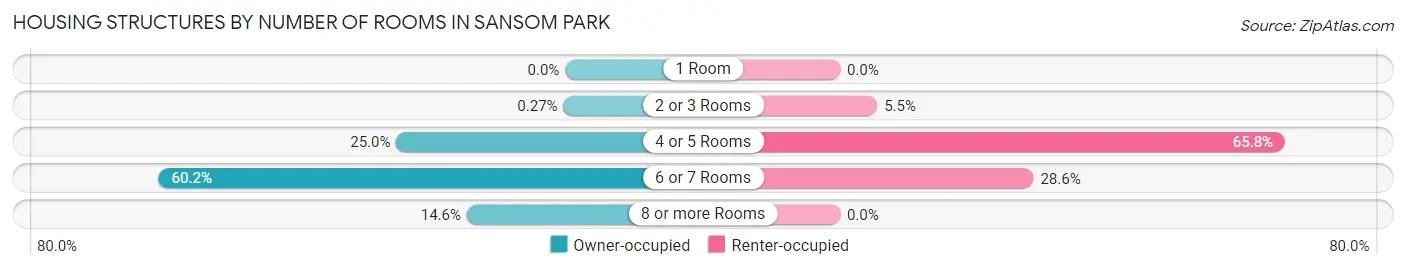
| Number of Rooms | Owner-occupied | Renter-occupied |
| 1 Room | 0 (0.0%) | 0 (0.0%) |
| 2 or 3 Rooms | 2 (0.3%) | 49 (5.5%) |
| 4 or 5 Rooms | 187 (25.0%) | 584 (65.8%) |
| 6 or 7 Rooms | 450 (60.2%) | 254 (28.6%) |
| 8 or more Rooms | 109 (14.6%) | 0 (0.0%) |
| Total | 748 (100.0%) | 887 (100.0%) |
Housing Structure by Heating Type in Sansom Park
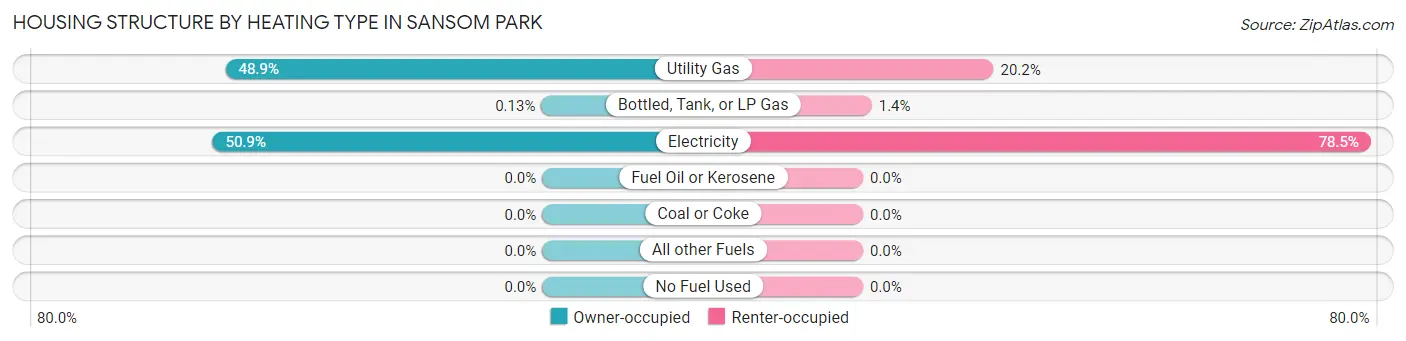
| Heating Type | Owner-occupied | Renter-occupied |
| Utility Gas | 366 (48.9%) | 179 (20.2%) |
| Bottled, Tank, or LP Gas | 1 (0.1%) | 12 (1.3%) |
| Electricity | 381 (50.9%) | 696 (78.5%) |
| Fuel Oil or Kerosene | 0 (0.0%) | 0 (0.0%) |
| Coal or Coke | 0 (0.0%) | 0 (0.0%) |
| All other Fuels | 0 (0.0%) | 0 (0.0%) |
| No Fuel Used | 0 (0.0%) | 0 (0.0%) |
| Total | 748 (100.0%) | 887 (100.0%) |
Household Vehicle Usage in Sansom Park
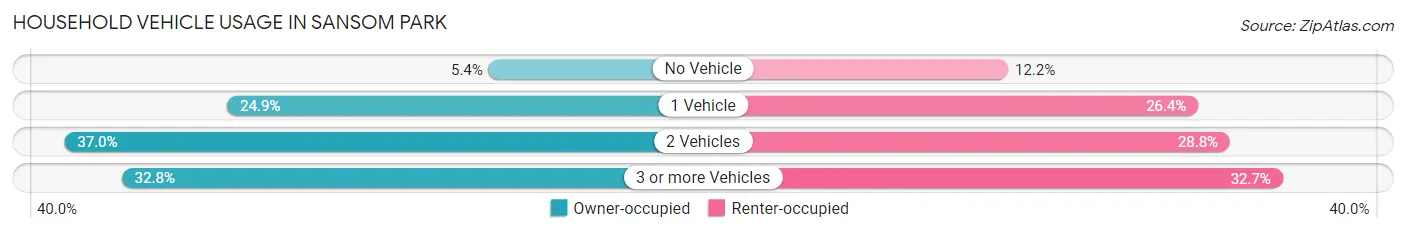
| Vehicles per Household | Owner-occupied | Renter-occupied |
| No Vehicle | 40 (5.3%) | 108 (12.2%) |
| 1 Vehicle | 186 (24.9%) | 234 (26.4%) |
| 2 Vehicles | 277 (37.0%) | 255 (28.7%) |
| 3 or more Vehicles | 245 (32.8%) | 290 (32.7%) |
| Total | 748 (100.0%) | 887 (100.0%) |
Real Estate & Mortgages in Sansom Park
Real Estate and Mortgage Overview in Sansom Park
| Characteristic | Without Mortgage | With Mortgage |
| Housing Units | 443 | 305 |
| Median Property Value | $140,100 | $129,500 |
| Median Household Income | $54,223 | $12 |
| Monthly Housing Costs | $583 | $0 |
| Real Estate Taxes | $1,485 | $0 |
Property Value by Mortgage Status in Sansom Park

| Property Value | Without Mortgage | With Mortgage |
| Less than $50,000 | 9 (2.0%) | 0 (0.0%) |
| $50,000 to $99,999 | 77 (17.4%) | 65 (21.3%) |
| $100,000 to $299,999 | 350 (79.0%) | 230 (75.4%) |
| $300,000 to $499,999 | 0 (0.0%) | 10 (3.3%) |
| $500,000 to $749,999 | 0 (0.0%) | 0 (0.0%) |
| $750,000 to $999,999 | 7 (1.6%) | 0 (0.0%) |
| $1,000,000 or more | 0 (0.0%) | 0 (0.0%) |
| Total | 443 (100.0%) | 305 (100.0%) |
Household Income by Mortgage Status in Sansom Park
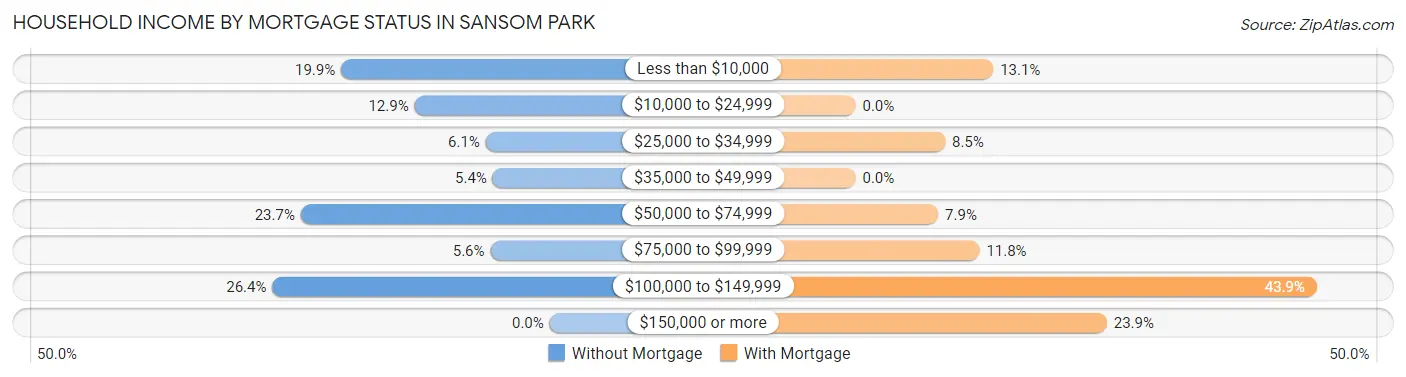
| Household Income | Without Mortgage | With Mortgage |
| Less than $10,000 | 88 (19.9%) | 40 (13.1%) |
| $10,000 to $24,999 | 57 (12.9%) | 0 (0.0%) |
| $25,000 to $34,999 | 27 (6.1%) | 26 (8.5%) |
| $35,000 to $49,999 | 24 (5.4%) | 0 (0.0%) |
| $50,000 to $74,999 | 105 (23.7%) | 24 (7.9%) |
| $75,000 to $99,999 | 25 (5.6%) | 36 (11.8%) |
| $100,000 to $149,999 | 117 (26.4%) | 134 (43.9%) |
| $150,000 or more | 0 (0.0%) | 73 (23.9%) |
| Total | 443 (100.0%) | 305 (100.0%) |
Property Value to Household Income Ratio in Sansom Park
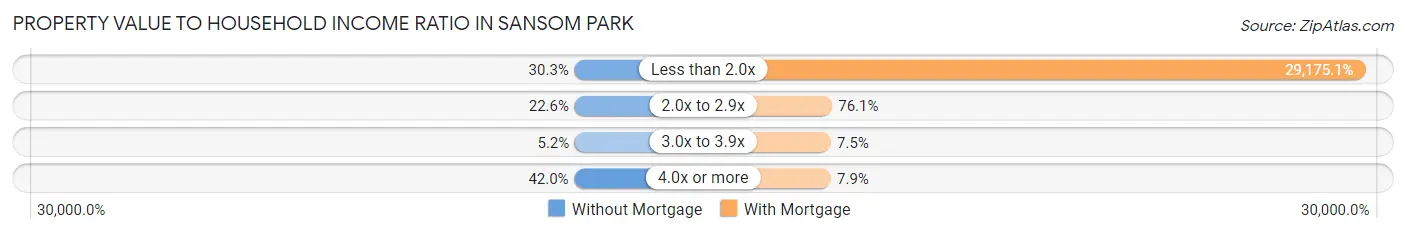
| Value-to-Income Ratio | Without Mortgage | With Mortgage |
| Less than 2.0x | 134 (30.2%) | 88,984 (29,175.1%) |
| 2.0x to 2.9x | 100 (22.6%) | 232 (76.1%) |
| 3.0x to 3.9x | 23 (5.2%) | 23 (7.5%) |
| 4.0x or more | 186 (42.0%) | 24 (7.9%) |
| Total | 443 (100.0%) | 305 (100.0%) |
Real Estate Taxes by Mortgage Status in Sansom Park
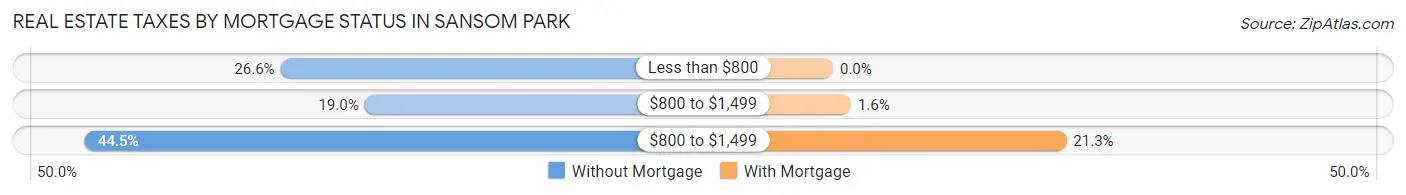
| Property Taxes | Without Mortgage | With Mortgage |
| Less than $800 | 118 (26.6%) | 0 (0.0%) |
| $800 to $1,499 | 84 (19.0%) | 5 (1.6%) |
| $800 to $1,499 | 197 (44.5%) | 65 (21.3%) |
| Total | 443 (100.0%) | 305 (100.0%) |
Health & Disability in Sansom Park
Health Insurance Coverage by Age in Sansom Park
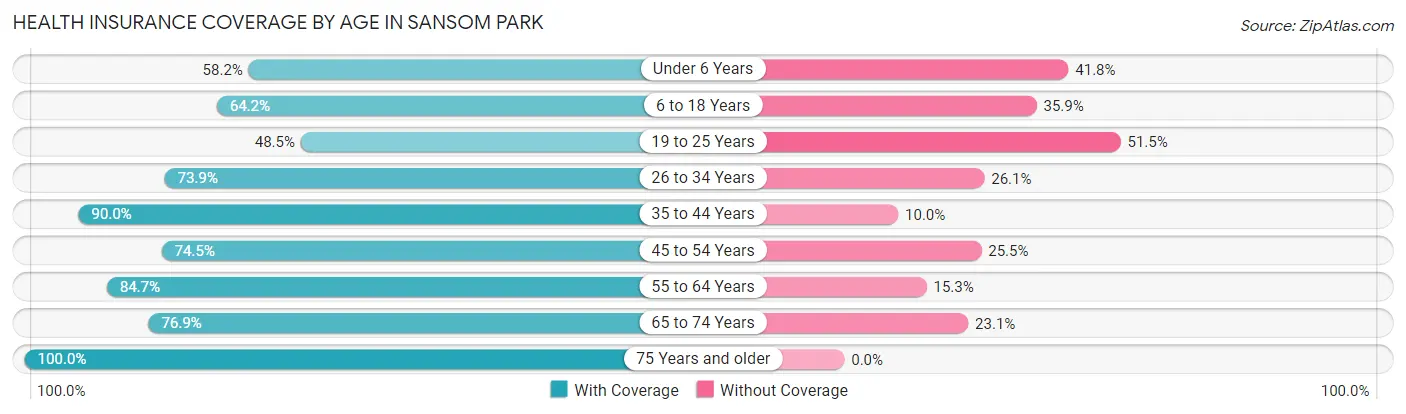
| Age Bracket | With Coverage | Without Coverage |
| Under 6 Years | 411 (58.2%) | 295 (41.8%) |
| 6 to 18 Years | 646 (64.1%) | 361 (35.8%) |
| 19 to 25 Years | 290 (48.5%) | 308 (51.5%) |
| 26 to 34 Years | 337 (73.9%) | 119 (26.1%) |
| 35 to 44 Years | 636 (90.0%) | 71 (10.0%) |
| 45 to 54 Years | 551 (74.5%) | 189 (25.5%) |
| 55 to 64 Years | 425 (84.7%) | 77 (15.3%) |
| 65 to 74 Years | 233 (76.9%) | 70 (23.1%) |
| 75 Years and older | 262 (100.0%) | 0 (0.0%) |
| Total | 3,791 (71.8%) | 1,490 (28.2%) |
Health Insurance Coverage by Citizenship Status in Sansom Park
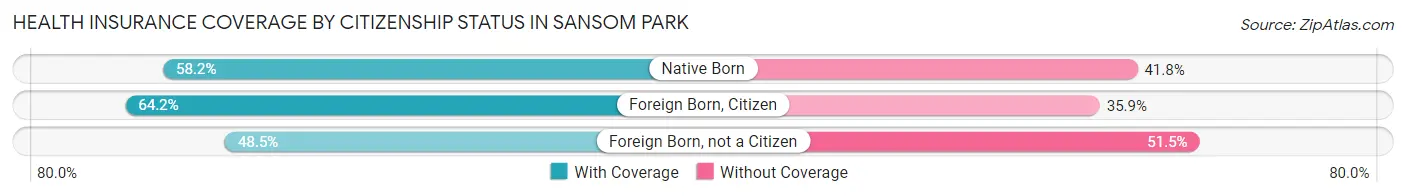
| Citizenship Status | With Coverage | Without Coverage |
| Native Born | 411 (58.2%) | 295 (41.8%) |
| Foreign Born, Citizen | 646 (64.1%) | 361 (35.8%) |
| Foreign Born, not a Citizen | 290 (48.5%) | 308 (51.5%) |
Health Insurance Coverage by Household Income in Sansom Park

| Household Income | With Coverage | Without Coverage |
| Under $25,000 | 485 (80.6%) | 117 (19.4%) |
| $25,000 to $49,999 | 805 (55.3%) | 650 (44.7%) |
| $50,000 to $74,999 | 866 (75.1%) | 287 (24.9%) |
| $75,000 to $99,999 | 738 (89.4%) | 87 (10.5%) |
| $100,000 and over | 897 (72.0%) | 349 (28.0%) |
Public vs Private Health Insurance Coverage by Age in Sansom Park
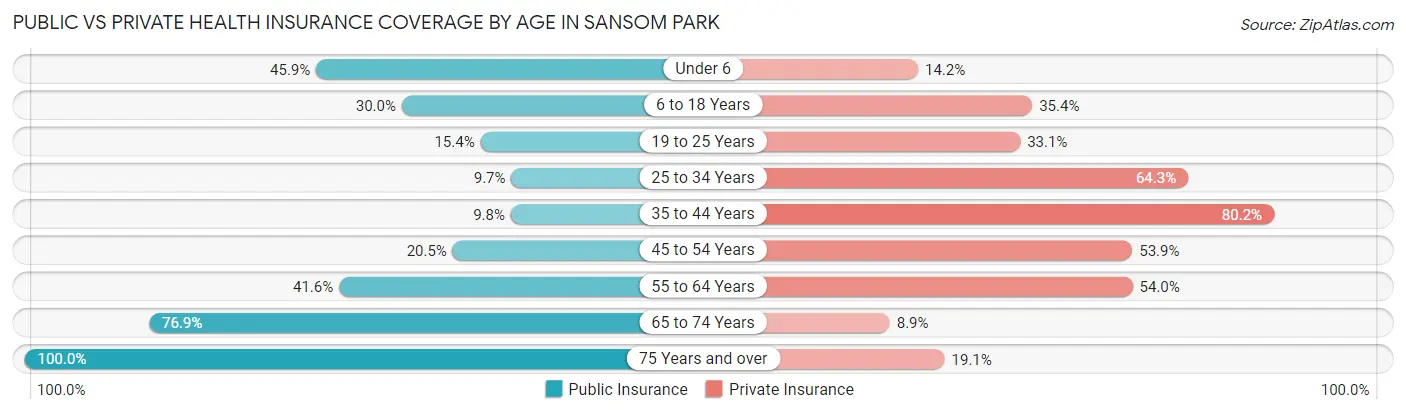
| Age Bracket | Public Insurance | Private Insurance |
| Under 6 | 324 (45.9%) | 100 (14.2%) |
| 6 to 18 Years | 302 (30.0%) | 356 (35.3%) |
| 19 to 25 Years | 92 (15.4%) | 198 (33.1%) |
| 25 to 34 Years | 44 (9.7%) | 293 (64.2%) |
| 35 to 44 Years | 69 (9.8%) | 567 (80.2%) |
| 45 to 54 Years | 152 (20.5%) | 399 (53.9%) |
| 55 to 64 Years | 209 (41.6%) | 271 (54.0%) |
| 65 to 74 Years | 233 (76.9%) | 27 (8.9%) |
| 75 Years and over | 262 (100.0%) | 50 (19.1%) |
| Total | 1,687 (31.9%) | 2,261 (42.8%) |
Disability Status by Sex by Age in Sansom Park
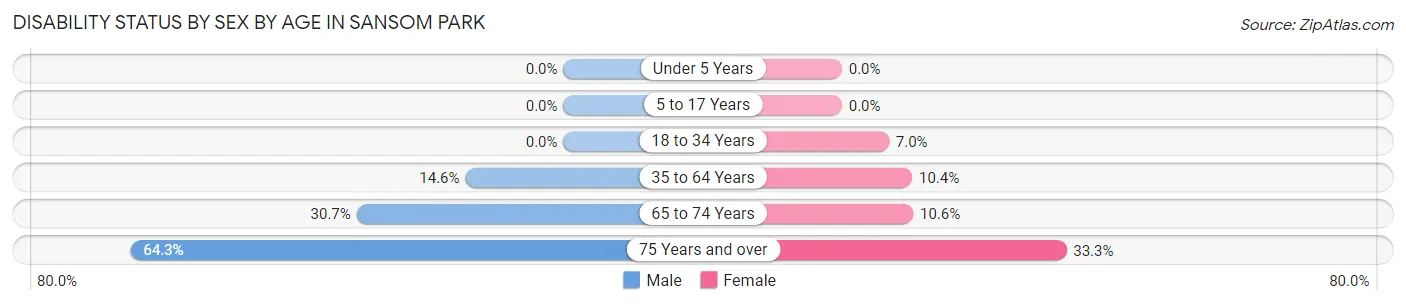
| Age Bracket | Male | Female |
| Under 5 Years | 0 (0.0%) | 0 (0.0%) |
| 5 to 17 Years | 0 (0.0%) | 0 (0.0%) |
| 18 to 34 Years | 0 (0.0%) | 33 (7.0%) |
| 35 to 64 Years | 144 (14.5%) | 100 (10.4%) |
| 65 to 74 Years | 35 (30.7%) | 20 (10.6%) |
| 75 Years and over | 45 (64.3%) | 64 (33.3%) |
Disability Class by Sex by Age in Sansom Park
Disability Class: Hearing Difficulty
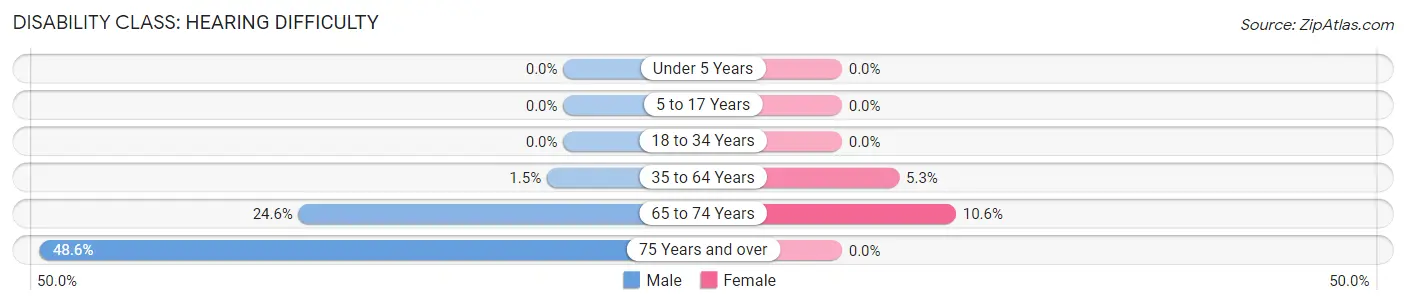
| Age Bracket | Male | Female |
| Under 5 Years | 0 (0.0%) | 0 (0.0%) |
| 5 to 17 Years | 0 (0.0%) | 0 (0.0%) |
| 18 to 34 Years | 0 (0.0%) | 0 (0.0%) |
| 35 to 64 Years | 15 (1.5%) | 51 (5.3%) |
| 65 to 74 Years | 28 (24.6%) | 20 (10.6%) |
| 75 Years and over | 34 (48.6%) | 0 (0.0%) |
Disability Class: Vision Difficulty
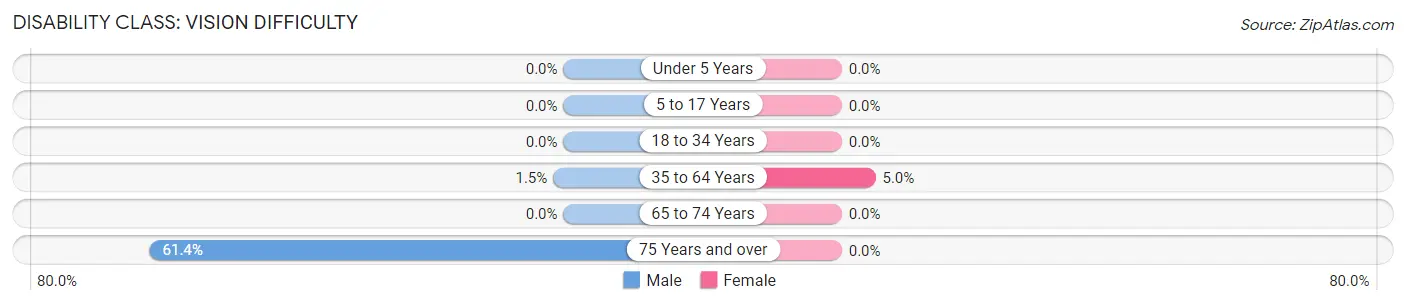
| Age Bracket | Male | Female |
| Under 5 Years | 0 (0.0%) | 0 (0.0%) |
| 5 to 17 Years | 0 (0.0%) | 0 (0.0%) |
| 18 to 34 Years | 0 (0.0%) | 0 (0.0%) |
| 35 to 64 Years | 15 (1.5%) | 48 (5.0%) |
| 65 to 74 Years | 0 (0.0%) | 0 (0.0%) |
| 75 Years and over | 43 (61.4%) | 0 (0.0%) |
Disability Class: Cognitive Difficulty
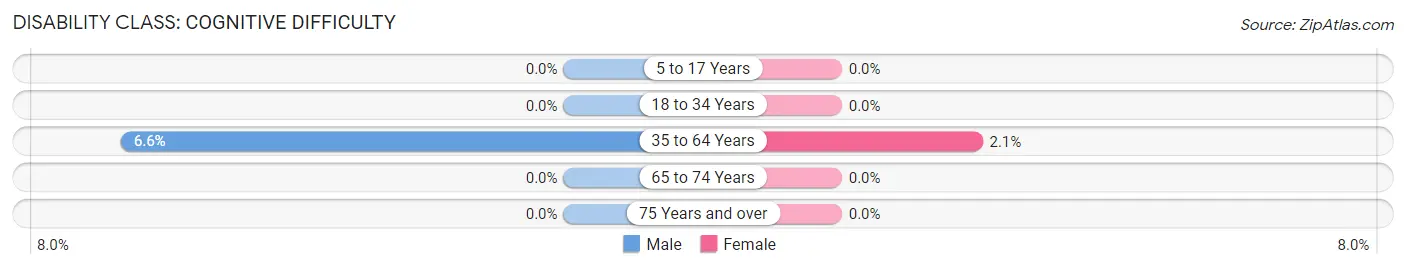
| Age Bracket | Male | Female |
| 5 to 17 Years | 0 (0.0%) | 0 (0.0%) |
| 18 to 34 Years | 0 (0.0%) | 0 (0.0%) |
| 35 to 64 Years | 65 (6.6%) | 20 (2.1%) |
| 65 to 74 Years | 0 (0.0%) | 0 (0.0%) |
| 75 Years and over | 0 (0.0%) | 0 (0.0%) |
Disability Class: Ambulatory Difficulty
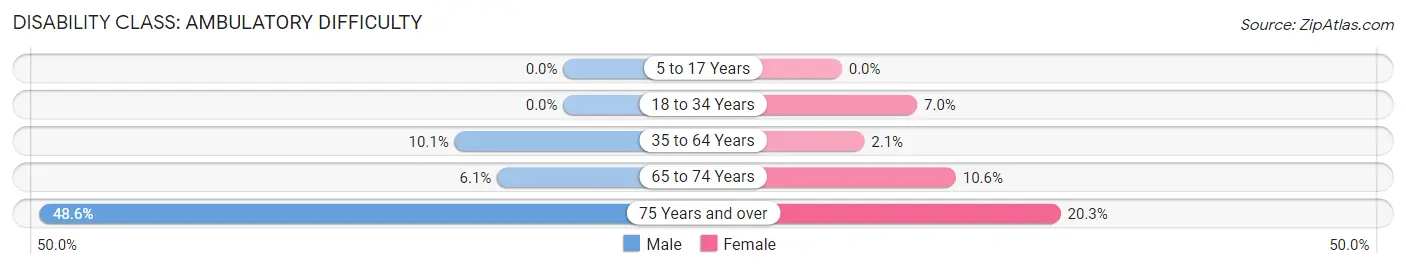
| Age Bracket | Male | Female |
| 5 to 17 Years | 0 (0.0%) | 0 (0.0%) |
| 18 to 34 Years | 0 (0.0%) | 33 (7.0%) |
| 35 to 64 Years | 100 (10.1%) | 20 (2.1%) |
| 65 to 74 Years | 7 (6.1%) | 20 (10.6%) |
| 75 Years and over | 34 (48.6%) | 39 (20.3%) |
Disability Class: Self-Care Difficulty
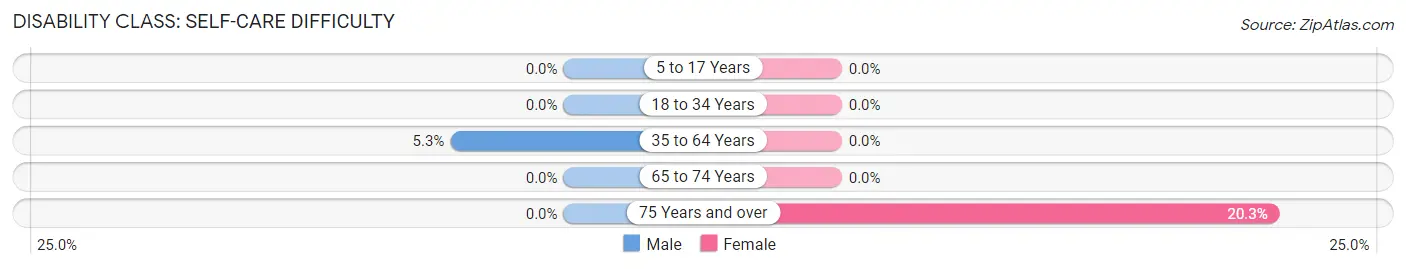
| Age Bracket | Male | Female |
| 5 to 17 Years | 0 (0.0%) | 0 (0.0%) |
| 18 to 34 Years | 0 (0.0%) | 0 (0.0%) |
| 35 to 64 Years | 52 (5.2%) | 0 (0.0%) |
| 65 to 74 Years | 0 (0.0%) | 0 (0.0%) |
| 75 Years and over | 0 (0.0%) | 39 (20.3%) |
Technology Access in Sansom Park
Computing Device Access in Sansom Park
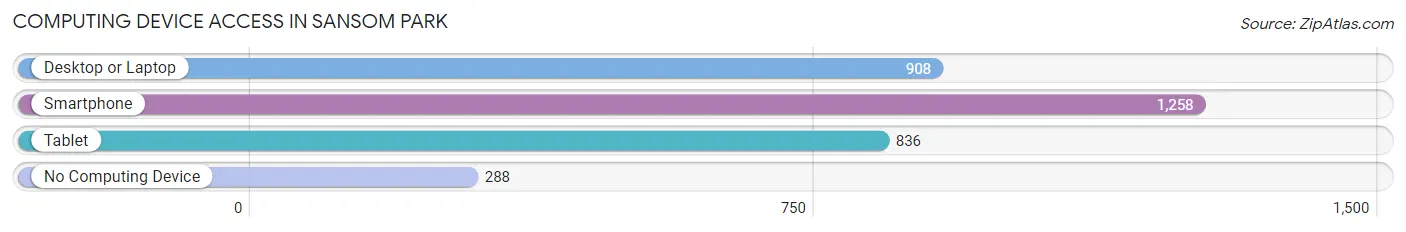
| Device Type | # Households | % Households |
| Desktop or Laptop | 908 | 55.5% |
| Smartphone | 1,258 | 76.9% |
| Tablet | 836 | 51.1% |
| No Computing Device | 288 | 17.6% |
| Total | 1,635 | 100.0% |
Internet Access in Sansom Park
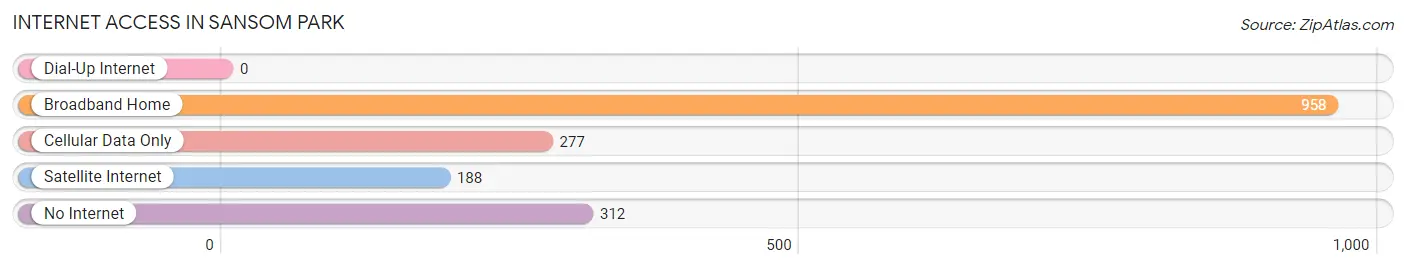
| Internet Type | # Households | % Households |
| Dial-Up Internet | 0 | 0.0% |
| Broadband Home | 958 | 58.6% |
| Cellular Data Only | 277 | 16.9% |
| Satellite Internet | 188 | 11.5% |
| No Internet | 312 | 19.1% |
| Total | 1,635 | 100.0% |
Sansom Park Summary
Sansom Park is a small city located in Tarrant County, Texas, United States. It is part of the Dallas-Fort Worth-Arlington metropolitan area. The population was 2,845 at the 2010 census.
History
Sansom Park was founded in the early 1900s by the Sansom family, who were among the first settlers in the area. The family owned a large tract of land that was used for farming and ranching. The town was named after the Sansom family.
In the early 1920s, the town began to grow as a result of the oil boom in the area. The town was incorporated in 1925 and the first mayor was elected in 1926.
In the 1950s, the town began to experience rapid growth as a result of the post-World War II housing boom. The population of Sansom Park increased from 1,000 in 1950 to over 5,000 by 1960.
Geography
Sansom Park is located at 32°45'17" North, 97°17'45" West (32.754722, -97.295833). It is situated on the western edge of Tarrant County, just south of the city of Fort Worth.
The city has a total area of 1 3 square miles all of which is land
Economy
The economy of Sansom Park is largely based on the oil and gas industry. The city is home to several oil and gas companies, including ExxonMobil, Chevron, and Shell.
In addition to the oil and gas industry, Sansom Park is also home to several manufacturing companies, including a plastics manufacturer and a metal fabrication company.
Demographics
As of the 2010 census, there were 2,845 people, 1,093 households, and 745 families residing in the city. The population density was 2,179.2 people per square mile. The racial makeup of the city was 79.2% White, 8.2% African American, 0.3% Native American, 0.7% Asian, 0.1% Pacific Islander, 8.7% from other races, and 2.8% from two or more races. Hispanic or Latino of any race were 18.2% of the population.
The median income for a household in the city was $41,944, and the median income for a family was $50,000. Males had a median income of $35,000 versus $27,500 for females. The per capita income for the city was $19,945. About 8.2% of families and 10.2% of the population were below the poverty line, including 14.2% of those under age 18 and 8.3% of those age 65 or over.
Common Questions
What is the Total Population of Sansom Park?
Total Population of Sansom Park is 5,387.
What is the Total Male Population of Sansom Park?
Total Male Population of Sansom Park is 3,044.
What is the Total Female Population of Sansom Park?
Total Female Population of Sansom Park is 2,343.
What is the Ratio of Males per 100 Females in Sansom Park?
There are 129.92 Males per 100 Females in Sansom Park.
What is the Ratio of Females per 100 Males in Sansom Park?
There are 76.97 Females per 100 Males in Sansom Park.
What is the Median Population Age in Sansom Park?
Median Population Age in Sansom Park is 34.4 Years.
What is the Average Family Size in Sansom Park
Average Family Size in Sansom Park is 4.0 People.
What is the Average Household Size in Sansom Park
Average Household Size in Sansom Park is 3.2 People.
What is Per Capita Income in Sansom Park?
Per Capita income in Sansom Park is $22,263.
What is the Median Family Income in Sansom Park?
Median Family Income in Sansom Park is $58,796.
What is the Median Household income in Sansom Park?
Median Household Income in Sansom Park is $54,909.
What is Income or Wage Gap in Sansom Park?
Income or Wage Gap in Sansom Park is 1.7%.
Women in Sansom Park earn 98.3 cents for every dollar earned by a man.
What is Family Income Deficit in Sansom Park?
Family Income Deficit in Sansom Park is $5,328.
Families that are below poverty line in Sansom Park earn $5,328 less on average than the poverty threshold level.
What is Inequality or Gini Index in Sansom Park?
Inequality or Gini Index in Sansom Park is 0.43.
How Large is the Labor Force in Sansom Park?
There are 2,408 People in the Labor Forcein in Sansom Park.
What is the Percentage of People in the Labor Force in Sansom Park?
62.9% of People are in the Labor Force in Sansom Park.
What is the Unemployment Rate in Sansom Park?
Unemployment Rate in Sansom Park is 7.4%.