Zip Codes with the Highest Percentage of Population with a Degree in Engineering in Terrell, TX
RELATED REPORTS & OPTIONS
Engineering
Terrell
Compare Zip Codes
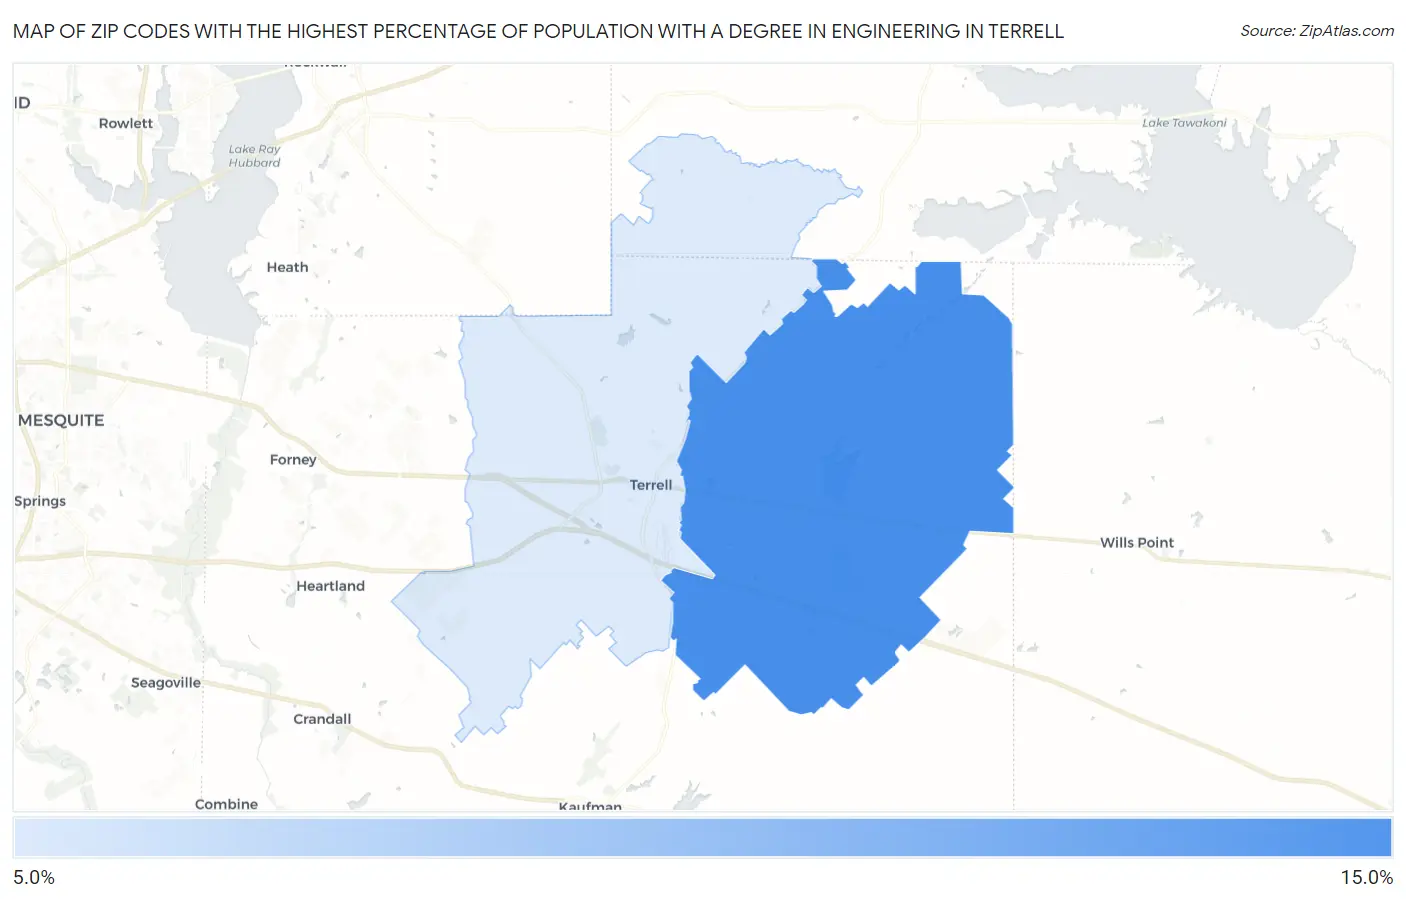
Map of Zip Codes with the Highest Percentage of Population with a Degree in Engineering in Terrell
0.0%
15.0%
Zip Codes with the Highest Percentage of Population with a Degree in Engineering in Terrell, TX
| Zip Code | % Graduates | vs State | vs National | |
| 1. | 75161 | 10.7% | 9.5%(+1.17)#305 | 7.6%(+3.06)#3,776 |
| 2. | 75160 | 6.3% | 9.5%(-3.23)#735 | 7.6%(-1.34)#10,442 |
1
Common Questions
What are the Top Zip Codes with the Highest Percentage of Population with a Degree in Engineering in Terrell, TX?
Top Zip Codes with the Highest Percentage of Population with a Degree in Engineering in Terrell, TX are:
What zip code has the Highest Percentage of Population with a Degree in Engineering in Terrell, TX?
75161 has the Highest Percentage of Population with a Degree in Engineering in Terrell, TX with 10.7%.
What is the Percentage of Population with a Degree in Engineering in Terrell, TX?
Percentage of Population with a Degree in Engineering in Terrell is 8.2%.
What is the Percentage of Population with a Degree in Engineering in Texas?
Percentage of Population with a Degree in Engineering in Texas is 9.5%.
What is the Percentage of Population with a Degree in Engineering in the United States?
Percentage of Population with a Degree in Engineering in the United States is 7.6%.