Zip Codes with the Highest Percentage of Population with a Degree in Engineering in Fort Worth, TX
RELATED REPORTS & OPTIONS
Engineering
Fort Worth
Compare Zip Codes
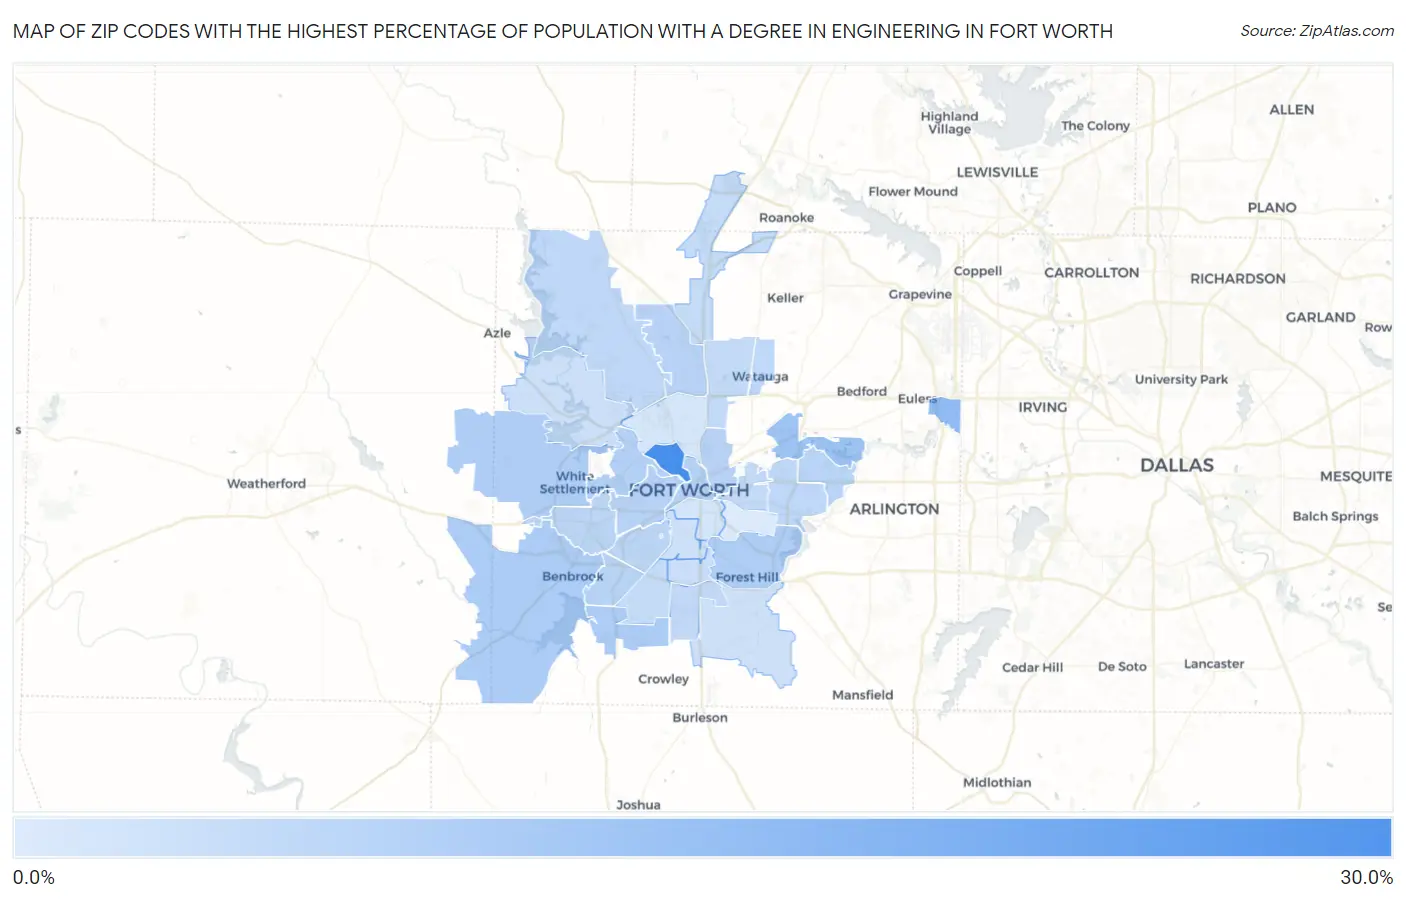
Map of Zip Codes with the Highest Percentage of Population with a Degree in Engineering in Fort Worth
0.0%
30.0%
Zip Codes with the Highest Percentage of Population with a Degree in Engineering in Fort Worth, TX
| Zip Code | % Graduates | vs State | vs National | |
| 1. | 76164 | 26.2% | 9.5%(+16.7)#30 | 7.6%(+18.6)#490 |
| 2. | 76155 | 14.2% | 9.5%(+4.65)#160 | 7.6%(+6.54)#1,967 |
| 3. | 76118 | 12.0% | 9.5%(+2.46)#233 | 7.6%(+4.35)#2,899 |
| 4. | 76123 | 10.1% | 9.5%(+0.519)#359 | 7.6%(+2.41)#4,391 |
| 5. | 76126 | 10.0% | 9.5%(+0.471)#363 | 7.6%(+2.36)#4,428 |
| 6. | 76119 | 9.7% | 9.5%(+0.173)#390 | 7.6%(+2.07)#4,730 |
| 7. | 76108 | 9.6% | 9.5%(+0.041)#408 | 7.6%(+1.93)#4,888 |
| 8. | 76114 | 8.8% | 9.5%(-0.758)#459 | 7.6%(+1.13)#5,902 |
| 9. | 76102 | 8.6% | 9.5%(-0.961)#472 | 7.6%(+0.931)#6,173 |
| 10. | 76111 | 8.3% | 9.5%(-1.28)#507 | 7.6%(+0.612)#6,653 |
| 11. | 76131 | 8.1% | 9.5%(-1.40)#516 | 7.6%(+0.496)#6,855 |
| 12. | 76107 | 8.1% | 9.5%(-1.41)#518 | 7.6%(+0.478)#6,886 |
| 13. | 76120 | 8.0% | 9.5%(-1.57)#536 | 7.6%(+0.326)#7,137 |
| 14. | 76132 | 7.9% | 9.5%(-1.60)#538 | 7.6%(+0.293)#7,198 |
| 15. | 76109 | 7.7% | 9.5%(-1.81)#558 | 7.6%(+0.081)#7,572 |
| 16. | 76116 | 7.6% | 9.5%(-1.92)#575 | 7.6%(-0.024)#7,785 |
| 17. | 76179 | 7.2% | 9.5%(-2.30)#608 | 7.6%(-0.403)#8,500 |
| 18. | 76148 | 7.2% | 9.5%(-2.33)#610 | 7.6%(-0.437)#8,562 |
| 19. | 76112 | 7.1% | 9.5%(-2.46)#636 | 7.6%(-0.566)#8,807 |
| 20. | 76134 | 6.8% | 9.5%(-2.77)#666 | 7.6%(-0.877)#9,464 |
| 21. | 76103 | 6.5% | 9.5%(-3.09)#706 | 7.6%(-1.19)#10,100 |
| 22. | 76137 | 6.4% | 9.5%(-3.11)#714 | 7.6%(-1.22)#10,160 |
| 23. | 76177 | 6.3% | 9.5%(-3.20)#725 | 7.6%(-1.30)#10,356 |
| 24. | 76133 | 6.2% | 9.5%(-3.29)#741 | 7.6%(-1.40)#10,603 |
| 25. | 76115 | 5.4% | 9.5%(-4.10)#853 | 7.6%(-2.21)#12,574 |
| 26. | 76135 | 5.3% | 9.5%(-4.26)#880 | 7.6%(-2.37)#12,997 |
| 27. | 76110 | 5.0% | 9.5%(-4.59)#929 | 7.6%(-2.69)#13,820 |
| 28. | 76140 | 4.8% | 9.5%(-4.78)#952 | 7.6%(-2.89)#14,372 |
| 29. | 76104 | 4.2% | 9.5%(-5.38)#1,022 | 7.6%(-3.49)#15,920 |
| 30. | 76106 | 3.9% | 9.5%(-5.68)#1,059 | 7.6%(-3.79)#16,723 |
| 31. | 76105 | 3.0% | 9.5%(-6.58)#1,176 | 7.6%(-4.69)#18,992 |
1
Common Questions
What are the Top 10 Zip Codes with the Highest Percentage of Population with a Degree in Engineering in Fort Worth, TX?
Top 10 Zip Codes with the Highest Percentage of Population with a Degree in Engineering in Fort Worth, TX are:
What zip code has the Highest Percentage of Population with a Degree in Engineering in Fort Worth, TX?
76164 has the Highest Percentage of Population with a Degree in Engineering in Fort Worth, TX with 26.2%.
What is the Percentage of Population with a Degree in Engineering in Fort Worth, TX?
Percentage of Population with a Degree in Engineering in Fort Worth is 7.7%.
What is the Percentage of Population with a Degree in Engineering in Texas?
Percentage of Population with a Degree in Engineering in Texas is 9.5%.
What is the Percentage of Population with a Degree in Engineering in the United States?
Percentage of Population with a Degree in Engineering in the United States is 7.6%.