Cities with the Highest Percentage of Immigrants from Trinidad and Tobago in New York
RELATED REPORTS & OPTIONS
Trinidad and Tobago
New York
Compare Cities
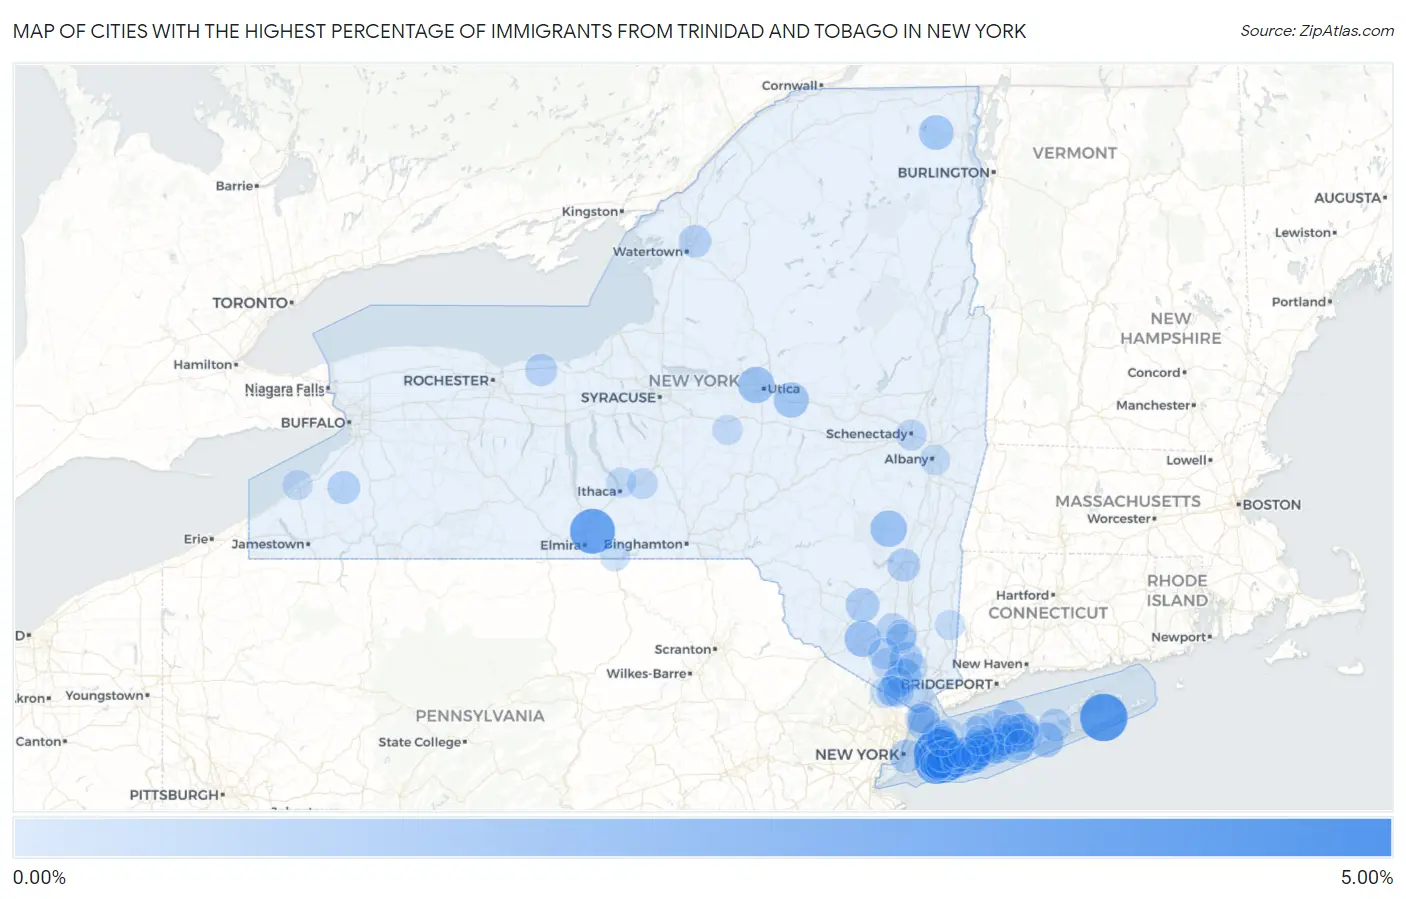
Map of Cities with the Highest Percentage of Immigrants from Trinidad and Tobago in New York
0.00%
5.00%
Cities with the Highest Percentage of Immigrants from Trinidad and Tobago in New York
| City | Trinidad and Tobago | vs State | vs National | |
| 1. | South Floral Park | 4.20% | 0.46%(+3.74)#5 | 0.070%(+4.13)#120 |
| 2. | Lakeview | 3.84% | 0.46%(+3.38)#6 | 0.070%(+3.77)#121 |
| 3. | Wainscott | 3.76% | 0.46%(+3.30)#7 | 0.070%(+3.69)#122 |
| 4. | Breesport | 3.24% | 0.46%(+2.78)#8 | 0.070%(+3.17)#123 |
| 5. | South Valley Stream | 2.85% | 0.46%(+2.39)#9 | 0.070%(+2.78)#124 |
| 6. | North Valley Stream | 2.75% | 0.46%(+2.29)#10 | 0.070%(+2.68)#125 |
| 7. | North Amityville | 1.80% | 0.46%(+1.35)#11 | 0.070%(+1.73)#126 |
| 8. | Elmont | 1.77% | 0.46%(+1.31)#12 | 0.070%(+1.70)#127 |
| 9. | Roosevelt | 1.76% | 0.46%(+1.30)#13 | 0.070%(+1.69)#128 |
| 10. | Tannersville | 1.50% | 0.46%(+1.04)#14 | 0.070%(+1.43)#129 |
| 11. | Whitesboro | 1.50% | 0.46%(+1.04)#15 | 0.070%(+1.43)#130 |
| 12. | Scotchtown | 1.46% | 0.46%(+1.00)#16 | 0.070%(+1.39)#131 |
| 13. | Valley Stream | 1.36% | 0.46%(+0.905)#17 | 0.070%(+1.29)#132 |
| 14. | Herkimer | 1.25% | 0.46%(+0.797)#18 | 0.070%(+1.18)#133 |
| 15. | Baldwin | 1.23% | 0.46%(+0.771)#19 | 0.070%(+1.16)#134 |
| 16. | Stony Point | 1.20% | 0.46%(+0.748)#20 | 0.070%(+1.13)#135 |
| 17. | East Moriches | 1.18% | 0.46%(+0.725)#21 | 0.070%(+1.11)#136 |
| 18. | Dannemora | 1.16% | 0.46%(+0.699)#22 | 0.070%(+1.09)#137 |
| 19. | Tuxedo | 1.14% | 0.46%(+0.682)#23 | 0.070%(+1.07)#138 |
| 20. | Springfield Center | 1.00% | 0.46%(+0.543)#24 | 0.070%(+0.930)#139 |
| 21. | Ellenville | 1.00% | 0.46%(+0.540)#25 | 0.070%(+0.927)#140 |
| 22. | Islandia | 0.98% | 0.46%(+0.524)#26 | 0.070%(+0.911)#141 |
| 23. | East Massapequa | 0.97% | 0.46%(+0.512)#27 | 0.070%(+0.899)#142 |
| 24. | Patchogue | 0.92% | 0.46%(+0.458)#28 | 0.070%(+0.846)#143 |
| 25. | North Great River | 0.90% | 0.46%(+0.439)#29 | 0.070%(+0.827)#144 |
| 26. | Gordon Heights | 0.90% | 0.46%(+0.438)#30 | 0.070%(+0.826)#145 |
| 27. | New York | 0.89% | 0.46%(+0.429)#31 | 0.070%(+0.816)#422 |
| 28. | Baxter Estates | 0.87% | 0.46%(+0.414)#32 | 0.070%(+0.801)#423 |
| 29. | Mount Vernon | 0.87% | 0.46%(+0.412)#33 | 0.070%(+0.799)#424 |
| 30. | Hempstead | 0.85% | 0.46%(+0.390)#34 | 0.070%(+0.777)#425 |
| 31. | Lincoln Park | 0.84% | 0.46%(+0.385)#35 | 0.070%(+0.772)#426 |
| 32. | Fort Montgomery | 0.82% | 0.46%(+0.358)#36 | 0.070%(+0.745)#427 |
| 33. | Freeport | 0.78% | 0.46%(+0.325)#37 | 0.070%(+0.713)#428 |
| 34. | Gowanda | 0.78% | 0.46%(+0.321)#38 | 0.070%(+0.709)#429 |
| 35. | Riverside | 0.75% | 0.46%(+0.290)#39 | 0.070%(+0.677)#430 |
| 36. | Belle Terre | 0.74% | 0.46%(+0.283)#40 | 0.070%(+0.670)#431 |
| 37. | Calcium | 0.72% | 0.46%(+0.261)#41 | 0.070%(+0.648)#432 |
| 38. | Wheatley Heights | 0.71% | 0.46%(+0.255)#42 | 0.070%(+0.642)#433 |
| 39. | East Rockaway | 0.70% | 0.46%(+0.238)#43 | 0.070%(+0.625)#434 |
| 40. | Central Islip | 0.68% | 0.46%(+0.225)#44 | 0.070%(+0.612)#435 |
| 41. | Williamson | 0.66% | 0.46%(+0.207)#45 | 0.070%(+0.594)#436 |
| 42. | Woodmere | 0.65% | 0.46%(+0.195)#46 | 0.070%(+0.582)#437 |
| 43. | Yaphank | 0.64% | 0.46%(+0.185)#47 | 0.070%(+0.572)#438 |
| 44. | Greenville Cdp Westchester County | 0.57% | 0.46%(+0.117)#48 | 0.070%(+0.504)#439 |
| 45. | Tuckahoe | 0.56% | 0.46%(+0.100)#49 | 0.070%(+0.488)#440 |
| 46. | Holtsville | 0.56% | 0.46%(+0.099)#50 | 0.070%(+0.486)#441 |
| 47. | Wyandanch | 0.55% | 0.46%(+0.094)#51 | 0.070%(+0.482)#442 |
| 48. | Flower Hill | 0.54% | 0.46%(+0.086)#52 | 0.070%(+0.473)#443 |
| 49. | Harriman | 0.54% | 0.46%(+0.084)#53 | 0.070%(+0.472)#444 |
| 50. | Middle Island | 0.54% | 0.46%(+0.083)#54 | 0.070%(+0.471)#445 |
| 51. | Orange Lake | 0.54% | 0.46%(+0.080)#55 | 0.070%(+0.467)#446 |
| 52. | Brentwood | 0.54% | 0.46%(+0.078)#56 | 0.070%(+0.465)#447 |
| 53. | Bay Shore | 0.52% | 0.46%(+0.063)#57 | 0.070%(+0.451)#448 |
| 54. | Ronkonkoma | 0.51% | 0.46%(+0.058)#58 | 0.070%(+0.445)#449 |
| 55. | North Lindenhurst | 0.51% | 0.46%(+0.054)#59 | 0.070%(+0.441)#450 |
| 56. | Lindenhurst | 0.50% | 0.46%(+0.044)#60 | 0.070%(+0.431)#451 |
| 57. | Deer Park | 0.49% | 0.46%(+0.037)#61 | 0.070%(+0.425)#452 |
| 58. | Newburgh | 0.49% | 0.46%(+0.033)#62 | 0.070%(+0.421)#453 |
| 59. | Lynbrook | 0.48% | 0.46%(+0.026)#63 | 0.070%(+0.413)#454 |
| 60. | Viola | 0.47% | 0.46%(+0.017)#64 | 0.070%(+0.404)#455 |
| 61. | South Blooming Grove | 0.47% | 0.46%(+0.009)#65 | 0.070%(+0.397)#456 |
| 62. | Uniondale | 0.46% | 0.46%(+0.007)#66 | 0.070%(+0.394)#457 |
| 63. | East Northport | 0.46% | 0.46%(+0.006)#67 | 0.070%(+0.394)#458 |
| 64. | Sleepy Hollow | 0.46% | 0.46%(+0.004)#68 | 0.070%(+0.392)#459 |
| 65. | West Hempstead | 0.46% | 0.46%(+0.004)#69 | 0.070%(+0.391)#460 |
| 66. | Nissequogue | 0.46% | 0.46%(+0.002)#70 | 0.070%(+0.390)#461 |
| 67. | Schenectady | 0.41% | 0.46%(-0.047)#71 | 0.070%(+0.341)#462 |
| 68. | Franklin Square | 0.39% | 0.46%(-0.063)#72 | 0.070%(+0.324)#463 |
| 69. | North Babylon | 0.39% | 0.46%(-0.066)#73 | 0.070%(+0.322)#464 |
| 70. | Pomona | 0.39% | 0.46%(-0.066)#74 | 0.070%(+0.321)#465 |
| 71. | North Wantagh | 0.38% | 0.46%(-0.073)#75 | 0.070%(+0.315)#466 |
| 72. | Bellmore | 0.38% | 0.46%(-0.075)#76 | 0.070%(+0.313)#467 |
| 73. | North Bellmore | 0.37% | 0.46%(-0.092)#77 | 0.070%(+0.296)#468 |
| 74. | Vassar College | 0.37% | 0.46%(-0.092)#78 | 0.070%(+0.295)#469 |
| 75. | Hillburn | 0.35% | 0.46%(-0.104)#79 | 0.070%(+0.284)#470 |
| 76. | East Meadow | 0.35% | 0.46%(-0.107)#80 | 0.070%(+0.280)#471 |
| 77. | Medford | 0.35% | 0.46%(-0.110)#81 | 0.070%(+0.278)#472 |
| 78. | Coram | 0.33% | 0.46%(-0.123)#82 | 0.070%(+0.265)#473 |
| 79. | West Babylon | 0.33% | 0.46%(-0.125)#83 | 0.070%(+0.262)#474 |
| 80. | Hewlett | 0.33% | 0.46%(-0.128)#84 | 0.070%(+0.260)#475 |
| 81. | Dryden | 0.33% | 0.46%(-0.131)#85 | 0.070%(+0.257)#476 |
| 82. | Plainedge | 0.32% | 0.46%(-0.134)#86 | 0.070%(+0.254)#477 |
| 83. | Greenlawn | 0.32% | 0.46%(-0.141)#87 | 0.070%(+0.247)#478 |
| 84. | Peekskill | 0.31% | 0.46%(-0.142)#88 | 0.070%(+0.245)#479 |
| 85. | Lansing | 0.31% | 0.46%(-0.143)#89 | 0.070%(+0.245)#480 |
| 86. | Islip Terrace | 0.30% | 0.46%(-0.156)#90 | 0.070%(+0.231)#481 |
| 87. | Roslyn Estates | 0.30% | 0.46%(-0.161)#91 | 0.070%(+0.226)#482 |
| 88. | Rensselaer | 0.29% | 0.46%(-0.165)#92 | 0.070%(+0.222)#483 |
| 89. | Centereach | 0.29% | 0.46%(-0.166)#93 | 0.070%(+0.222)#484 |
| 90. | Spring Valley | 0.29% | 0.46%(-0.172)#94 | 0.070%(+0.215)#485 |
| 91. | New Windsor | 0.28% | 0.46%(-0.173)#95 | 0.070%(+0.215)#486 |
| 92. | East Patchogue | 0.28% | 0.46%(-0.173)#96 | 0.070%(+0.215)#487 |
| 93. | Dunkirk | 0.28% | 0.46%(-0.181)#97 | 0.070%(+0.206)#488 |
| 94. | Montebello | 0.26% | 0.46%(-0.199)#98 | 0.070%(+0.189)#489 |
| 95. | Hamilton | 0.26% | 0.46%(-0.200)#99 | 0.070%(+0.188)#490 |
| 96. | Dix Hills | 0.26% | 0.46%(-0.202)#100 | 0.070%(+0.186)#491 |
| 97. | Waverly | 0.25% | 0.46%(-0.205)#101 | 0.070%(+0.182)#492 |
| 98. | Glen Head | 0.25% | 0.46%(-0.207)#102 | 0.070%(+0.180)#493 |
| 99. | Yonkers | 0.25% | 0.46%(-0.210)#103 | 0.070%(+0.178)#494 |
| 100. | Pawling | 0.25% | 0.46%(-0.210)#104 | 0.070%(+0.178)#495 |
Common Questions
What are the Top 10 Cities with the Highest Percentage of Immigrants from Trinidad and Tobago in New York?
Top 10 Cities with the Highest Percentage of Immigrants from Trinidad and Tobago in New York are:
#1
4.20%
#2
3.84%
#3
3.76%
#4
3.24%
#5
2.85%
#6
2.75%
#7
1.80%
#8
1.77%
#9
1.76%
#10
1.50%
What city has the Highest Percentage of Immigrants from Trinidad and Tobago in New York?
South Floral Park has the Highest Percentage of Immigrants from Trinidad and Tobago in New York with 4.20%.
What is the Percentage of Immigrants from Trinidad and Tobago in the State of New York?
Percentage of Immigrants from Trinidad and Tobago in New York is 0.46%.
What is the Percentage of Immigrants from Trinidad and Tobago in the United States?
Percentage of Immigrants from Trinidad and Tobago in the United States is 0.070%.