Cities with the Highest Percentage of Immigrants from Hungary in New York
RELATED REPORTS & OPTIONS
Hungary
New York
Compare Cities
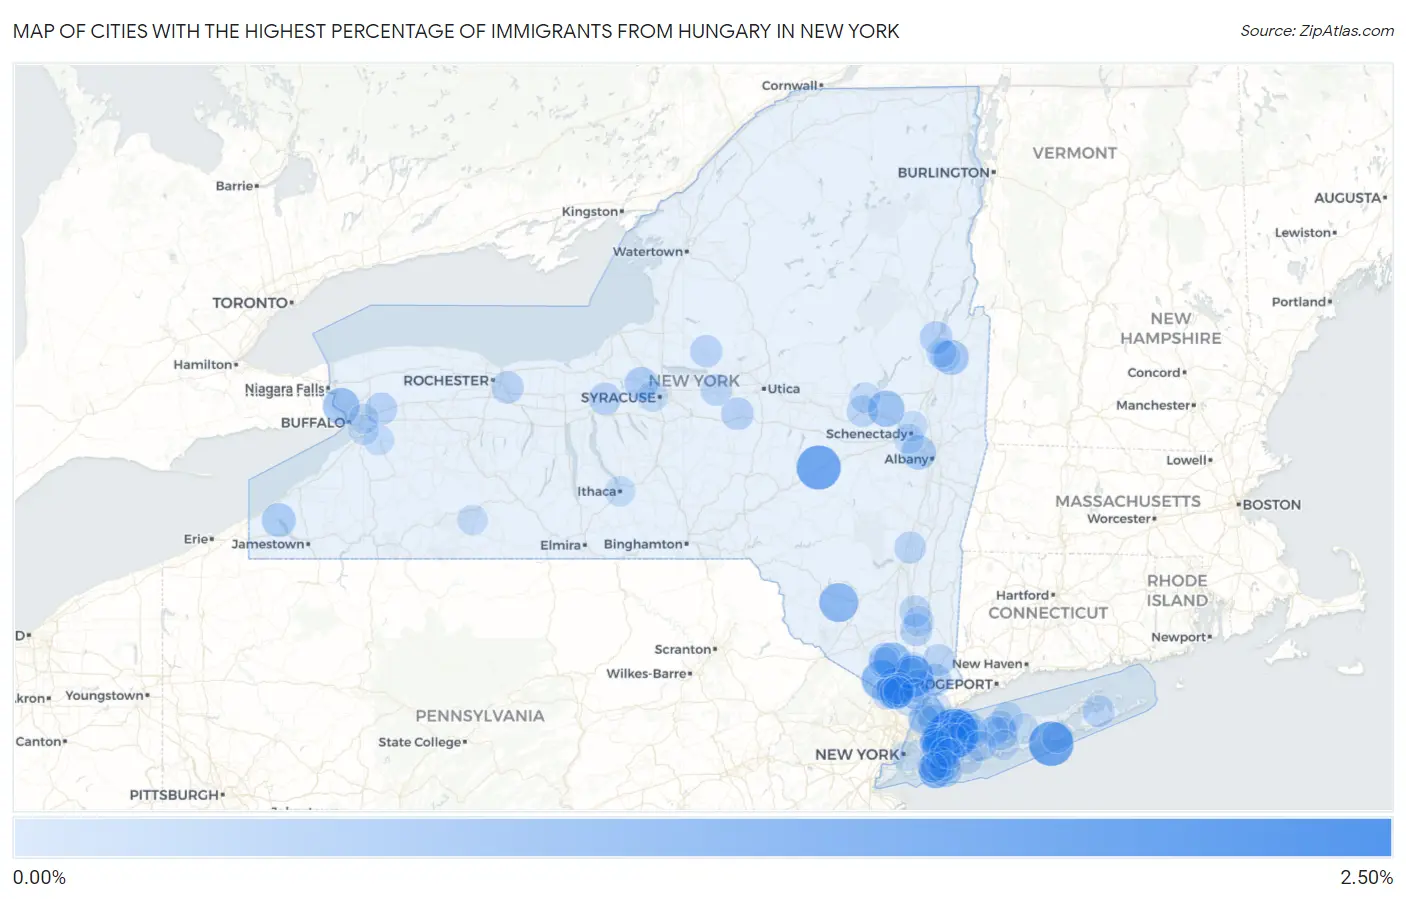
Map of Cities with the Highest Percentage of Immigrants from Hungary in New York
0.00%
2.50%
Cities with the Highest Percentage of Immigrants from Hungary in New York
| City | Hungary | vs State | vs National | |
| 1. | Upper Brookville | 2.07% | 0.044%(+2.03)#1 | 0.020%(+2.05)#17 |
| 2. | West Hampton Dunes | 1.54% | 0.044%(+1.49)#2 | 0.020%(+1.52)#29 |
| 3. | Worcester | 1.50% | 0.044%(+1.46)#3 | 0.020%(+1.48)#30 |
| 4. | Glenwood Landing | 1.27% | 0.044%(+1.23)#4 | 0.020%(+1.25)#36 |
| 5. | Crugers | 1.23% | 0.044%(+1.18)#5 | 0.020%(+1.21)#38 |
| 6. | Tuxedo Park | 1.00% | 0.044%(+0.956)#6 | 0.020%(+0.980)#48 |
| 7. | Woodridge | 0.96% | 0.044%(+0.917)#7 | 0.020%(+0.942)#55 |
| 8. | Woodbury | 0.80% | 0.044%(+0.756)#8 | 0.020%(+0.781)#68 |
| 9. | Grandyle Village | 0.73% | 0.044%(+0.688)#9 | 0.020%(+0.713)#74 |
| 10. | Hagaman | 0.69% | 0.044%(+0.648)#10 | 0.020%(+0.672)#81 |
| 11. | Wesley Hills | 0.69% | 0.044%(+0.642)#11 | 0.020%(+0.666)#82 |
| 12. | Lawrence | 0.66% | 0.044%(+0.620)#12 | 0.020%(+0.645)#87 |
| 13. | Greenville Cdp Westchester County | 0.62% | 0.044%(+0.571)#13 | 0.020%(+0.596)#99 |
| 14. | Viola | 0.58% | 0.044%(+0.538)#14 | 0.020%(+0.563)#110 |
| 15. | Hudson Falls | 0.55% | 0.044%(+0.508)#15 | 0.020%(+0.533)#115 |
| 16. | New Hamburg | 0.54% | 0.044%(+0.499)#16 | 0.020%(+0.523)#116 |
| 17. | Westmere | 0.50% | 0.044%(+0.456)#17 | 0.020%(+0.481)#130 |
| 18. | Barnum Island | 0.47% | 0.044%(+0.423)#18 | 0.020%(+0.448)#142 |
| 19. | Mayville | 0.44% | 0.044%(+0.399)#19 | 0.020%(+0.423)#157 |
| 20. | Mineola | 0.44% | 0.044%(+0.395)#20 | 0.020%(+0.420)#161 |
| 21. | Village Green | 0.40% | 0.044%(+0.356)#21 | 0.020%(+0.381)#180 |
| 22. | Monsey | 0.39% | 0.044%(+0.341)#22 | 0.020%(+0.366)#189 |
| 23. | Kaser | 0.36% | 0.044%(+0.320)#23 | 0.020%(+0.344)#199 |
| 24. | Nesconset | 0.33% | 0.044%(+0.288)#24 | 0.020%(+0.313)#226 |
| 25. | Ossining | 0.33% | 0.044%(+0.285)#25 | 0.020%(+0.309)#231 |
| 26. | Port Washington | 0.32% | 0.044%(+0.279)#26 | 0.020%(+0.304)#237 |
| 27. | Lake George | 0.32% | 0.044%(+0.274)#27 | 0.020%(+0.299)#240 |
| 28. | Mamaroneck | 0.32% | 0.044%(+0.272)#28 | 0.020%(+0.297)#242 |
| 29. | Floral Park | 0.31% | 0.044%(+0.271)#29 | 0.020%(+0.295)#244 |
| 30. | Oriskany Falls | 0.31% | 0.044%(+0.261)#30 | 0.020%(+0.286)#251 |
| 31. | Bellerose | 0.30% | 0.044%(+0.256)#31 | 0.020%(+0.281)#257 |
| 32. | Mount Kisco | 0.30% | 0.044%(+0.251)#32 | 0.020%(+0.276)#261 |
| 33. | Plandome | 0.29% | 0.044%(+0.249)#33 | 0.020%(+0.273)#265 |
| 34. | Port Byron | 0.29% | 0.044%(+0.242)#34 | 0.020%(+0.266)#270 |
| 35. | Kiryas Joel | 0.28% | 0.044%(+0.235)#35 | 0.020%(+0.260)#278 |
| 36. | Clarence | 0.28% | 0.044%(+0.233)#36 | 0.020%(+0.258)#281 |
| 37. | Centre Island | 0.28% | 0.044%(+0.232)#37 | 0.020%(+0.257)#284 |
| 38. | Fishkill | 0.28% | 0.044%(+0.232)#38 | 0.020%(+0.256)#286 |
| 39. | Camden | 0.27% | 0.044%(+0.227)#39 | 0.020%(+0.252)#290 |
| 40. | Mill Neck | 0.27% | 0.044%(+0.227)#40 | 0.020%(+0.251)#292 |
| 41. | East Rochester | 0.27% | 0.044%(+0.225)#41 | 0.020%(+0.249)#295 |
| 42. | Cedarhurst | 0.26% | 0.044%(+0.216)#42 | 0.020%(+0.240)#303 |
| 43. | Oyster Bay Cove | 0.26% | 0.044%(+0.213)#43 | 0.020%(+0.238)#307 |
| 44. | Heritage Hills | 0.25% | 0.044%(+0.211)#44 | 0.020%(+0.235)#310 |
| 45. | Franklin Square | 0.25% | 0.044%(+0.203)#45 | 0.020%(+0.228)#318 |
| 46. | Sag Harbor | 0.23% | 0.044%(+0.188)#46 | 0.020%(+0.212)#349 |
| 47. | Saugerties | 0.23% | 0.044%(+0.187)#47 | 0.020%(+0.212)#350 |
| 48. | Atlantic Beach | 0.23% | 0.044%(+0.183)#48 | 0.020%(+0.208)#356 |
| 49. | Blauvelt | 0.21% | 0.044%(+0.169)#49 | 0.020%(+0.194)#383 |
| 50. | Oneida | 0.21% | 0.044%(+0.169)#50 | 0.020%(+0.193)#385 |
| 51. | Suffern | 0.21% | 0.044%(+0.167)#51 | 0.020%(+0.191)#393 |
| 52. | Woodmere | 0.21% | 0.044%(+0.166)#52 | 0.020%(+0.190)#394 |
| 53. | Spackenkill | 0.21% | 0.044%(+0.164)#53 | 0.020%(+0.188)#398 |
| 54. | Fonda | 0.20% | 0.044%(+0.158)#54 | 0.020%(+0.182)#407 |
| 55. | Head Of The Harbor | 0.20% | 0.044%(+0.156)#55 | 0.020%(+0.180)#411 |
| 56. | Montrose | 0.19% | 0.044%(+0.144)#56 | 0.020%(+0.168)#431 |
| 57. | Peekskill | 0.19% | 0.044%(+0.141)#57 | 0.020%(+0.165)#438 |
| 58. | New Hempstead | 0.18% | 0.044%(+0.139)#58 | 0.020%(+0.164)#440 |
| 59. | Thomaston | 0.18% | 0.044%(+0.138)#59 | 0.020%(+0.162)#445 |
| 60. | Russell Gardens | 0.18% | 0.044%(+0.138)#60 | 0.020%(+0.162)#446 |
| 61. | Poquott | 0.18% | 0.044%(+0.137)#61 | 0.020%(+0.161)#451 |
| 62. | Lloyd Harbor | 0.17% | 0.044%(+0.124)#62 | 0.020%(+0.148)#477 |
| 63. | Westhampton | 0.16% | 0.044%(+0.115)#63 | 0.020%(+0.140)#499 |
| 64. | Glens Falls | 0.15% | 0.044%(+0.105)#64 | 0.020%(+0.130)#517 |
| 65. | Huntington | 0.15% | 0.044%(+0.104)#65 | 0.020%(+0.128)#525 |
| 66. | Tuckahoe | 0.14% | 0.044%(+0.099)#66 | 0.020%(+0.123)#537 |
| 67. | Lake Success | 0.14% | 0.044%(+0.098)#67 | 0.020%(+0.122)#542 |
| 68. | Syosset | 0.13% | 0.044%(+0.084)#68 | 0.020%(+0.108)#578 |
| 69. | Myers Corner | 0.12% | 0.044%(+0.078)#69 | 0.020%(+0.102)#598 |
| 70. | Solvay | 0.12% | 0.044%(+0.077)#70 | 0.020%(+0.101)#600 |
| 71. | East Aurora | 0.12% | 0.044%(+0.073)#71 | 0.020%(+0.097)#610 |
| 72. | Scarsdale | 0.12% | 0.044%(+0.072)#72 | 0.020%(+0.097)#612 |
| 73. | Wheatley Heights | 0.11% | 0.044%(+0.068)#73 | 0.020%(+0.093)#628 |
| 74. | Great Neck | 0.11% | 0.044%(+0.064)#74 | 0.020%(+0.089)#640 |
| 75. | Ithaca | 0.11% | 0.044%(+0.064)#75 | 0.020%(+0.089)#641 |
| 76. | Bronxville | 0.11% | 0.044%(+0.062)#76 | 0.020%(+0.087)#650 |
| 77. | Monroe | 0.11% | 0.044%(+0.062)#77 | 0.020%(+0.087)#655 |
| 78. | Smithtown | 0.11% | 0.044%(+0.061)#78 | 0.020%(+0.086)#657 |
| 79. | Brookville | 0.10% | 0.044%(+0.056)#79 | 0.020%(+0.081)#677 |
| 80. | Gloversville | 0.099% | 0.044%(+0.055)#80 | 0.020%(+0.080)#682 |
| 81. | Lynbrook | 0.099% | 0.044%(+0.054)#81 | 0.020%(+0.079)#683 |
| 82. | East Glenville | 0.096% | 0.044%(+0.052)#82 | 0.020%(+0.076)#691 |
| 83. | Upper Nyack | 0.093% | 0.044%(+0.049)#83 | 0.020%(+0.074)#703 |
| 84. | Middle Island | 0.093% | 0.044%(+0.049)#84 | 0.020%(+0.074)#705 |
| 85. | Huntington Station | 0.093% | 0.044%(+0.048)#85 | 0.020%(+0.073)#706 |
| 86. | Rotterdam | 0.088% | 0.044%(+0.044)#86 | 0.020%(+0.069)#725 |
| 87. | Garden City | 0.087% | 0.044%(+0.043)#87 | 0.020%(+0.068)#727 |
| 88. | Alfred | 0.087% | 0.044%(+0.043)#88 | 0.020%(+0.068)#728 |
| 89. | Spring Valley | 0.082% | 0.044%(+0.038)#89 | 0.020%(+0.062)#751 |
| 90. | West Seneca | 0.077% | 0.044%(+0.033)#90 | 0.020%(+0.058)#772 |
| 91. | Bohemia | 0.073% | 0.044%(+0.029)#91 | 0.020%(+0.054)#795 |
| 92. | East Massapequa | 0.072% | 0.044%(+0.028)#92 | 0.020%(+0.052)#807 |
| 93. | Oceanside | 0.070% | 0.044%(+0.026)#93 | 0.020%(+0.050)#815 |
| 94. | Glens Falls North | 0.067% | 0.044%(+0.023)#94 | 0.020%(+0.047)#833 |
| 95. | Uniondale | 0.063% | 0.044%(+0.019)#95 | 0.020%(+0.044)#852 |
| 96. | Inwood | 0.063% | 0.044%(+0.019)#96 | 0.020%(+0.043)#855 |
| 97. | Harrison | 0.063% | 0.044%(+0.019)#97 | 0.020%(+0.043)#856 |
| 98. | New York | 0.060% | 0.044%(+0.016)#98 | 0.020%(+0.041)#872 |
| 99. | Cheektowaga | 0.059% | 0.044%(+0.015)#99 | 0.020%(+0.039)#883 |
| 100. | Deer Park | 0.059% | 0.044%(+0.015)#100 | 0.020%(+0.039)#887 |
Common Questions
What are the Top 10 Cities with the Highest Percentage of Immigrants from Hungary in New York?
Top 10 Cities with the Highest Percentage of Immigrants from Hungary in New York are:
#1
2.07%
#2
1.54%
#3
1.50%
#4
1.27%
#5
1.23%
#6
1.00%
#7
0.96%
#8
0.80%
#9
0.73%
#10
0.69%
What city has the Highest Percentage of Immigrants from Hungary in New York?
Upper Brookville has the Highest Percentage of Immigrants from Hungary in New York with 2.07%.
What is the Percentage of Immigrants from Hungary in the State of New York?
Percentage of Immigrants from Hungary in New York is 0.044%.
What is the Percentage of Immigrants from Hungary in the United States?
Percentage of Immigrants from Hungary in the United States is 0.020%.