Herkimer, NY
Herkimer Map
Herkimer Overview
6,858
TOTAL POPULATION
3,227
MALE POPULATION
3,631
FEMALE POPULATION
88.87
MALES / 100 FEMALES
112.52
FEMALES / 100 MALES
48.1
MEDIAN AGE
2.9
AVG FAMILY SIZE
2.0
AVG HOUSEHOLD SIZE
$32,762
PER CAPITA INCOME
$91,547
AVG FAMILY INCOME
$56,607
AVG HOUSEHOLD INCOME
3.4%
WAGE / INCOME GAP [ % ]
96.6¢/ $1
WAGE / INCOME GAP [ $ ]
0.43
INEQUALITY / GINI INDEX
3,587
LABOR FORCE [ PEOPLE ]
58.7%
PERCENT IN LABOR FORCE
6.1%
UNEMPLOYMENT RATE
Herkimer Zip Codes
Herkimer Area Codes
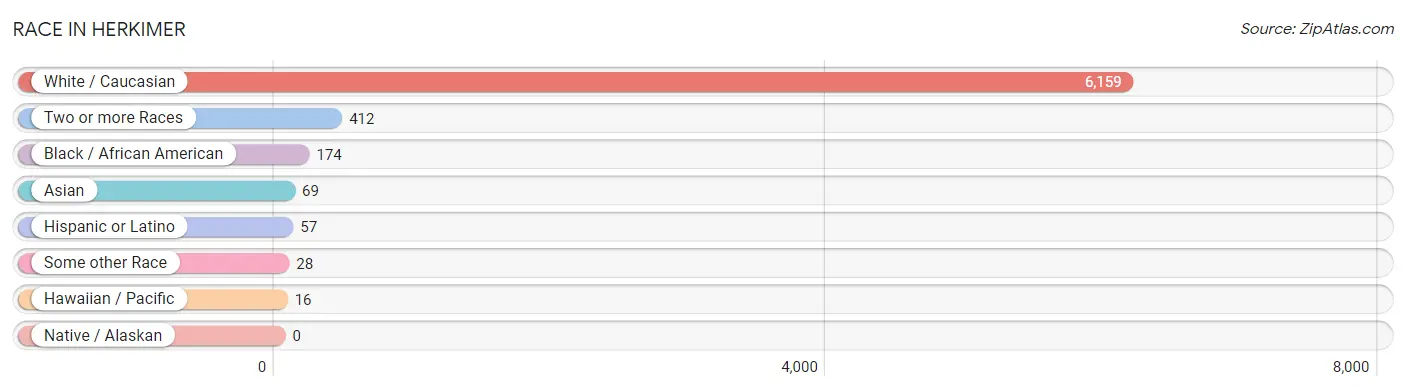
Race in Herkimer
The most populous races in Herkimer are White / Caucasian (6,159 | 89.8%), Two or more Races (412 | 6.0%), and Black / African American (174 | 2.5%).
| Race | # Population | % Population |
| Asian | 69 | 1.0% |
| Black / African American | 174 | 2.5% |
| Hawaiian / Pacific | 16 | 0.2% |
| Hispanic or Latino | 57 | 0.8% |
| Native / Alaskan | 0 | 0.0% |
| White / Caucasian | 6,159 | 89.8% |
| Two or more Races | 412 | 6.0% |
| Some other Race | 28 | 0.4% |
| Total | 6,858 | 100.0% |
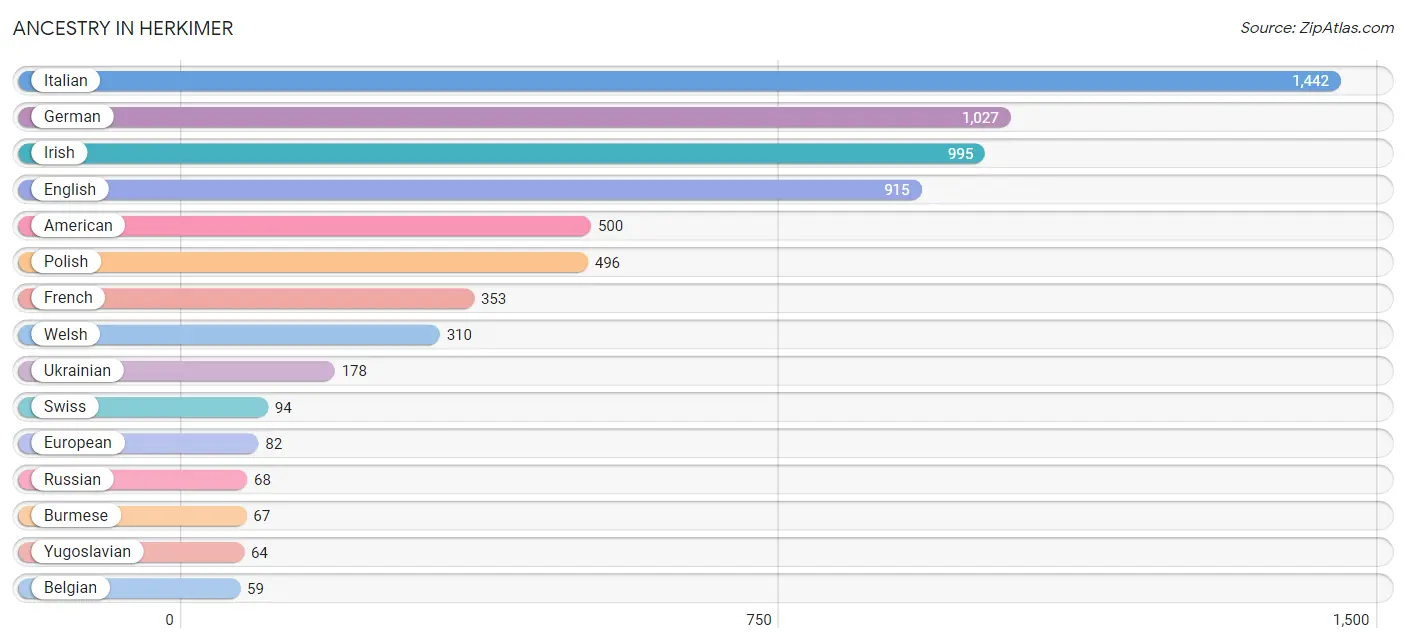
Ancestry in Herkimer
The most populous ancestries reported in Herkimer are Italian (1,442 | 21.0%), German (1,027 | 15.0%), Irish (995 | 14.5%), English (915 | 13.3%), and American (500 | 7.3%), together accounting for 71.1% of all Herkimer residents.
| Ancestry | # Population | % Population |
| American | 500 | 7.3% |
| Arab | 5 | 0.1% |
| Barbadian | 9 | 0.1% |
| Belgian | 59 | 0.9% |
| Bhutanese | 8 | 0.1% |
| Burmese | 67 | 1.0% |
| Canadian | 9 | 0.1% |
| Czechoslovakian | 6 | 0.1% |
| Dutch | 50 | 0.7% |
| English | 915 | 13.3% |
| Ethiopian | 9 | 0.1% |
| European | 82 | 1.2% |
| French | 353 | 5.1% |
| French Canadian | 30 | 0.4% |
| German | 1,027 | 15.0% |
| Greek | 1 | 0.0% |
| Indian (Asian) | 20 | 0.3% |
| Irish | 995 | 14.5% |
| Italian | 1,442 | 21.0% |
| Jamaican | 2 | 0.0% |
| Korean | 41 | 0.6% |
| Lebanese | 3 | 0.0% |
| Mexican | 1 | 0.0% |
| Moroccan | 2 | 0.0% |
| Northern European | 31 | 0.4% |
| Norwegian | 33 | 0.5% |
| Pennsylvania German | 18 | 0.3% |
| Polish | 496 | 7.2% |
| Portuguese | 1 | 0.0% |
| Puerto Rican | 56 | 0.8% |
| Russian | 68 | 1.0% |
| Scotch-Irish | 20 | 0.3% |
| Scottish | 8 | 0.1% |
| Sri Lankan | 38 | 0.5% |
| Subsaharan African | 9 | 0.1% |
| Swedish | 46 | 0.7% |
| Swiss | 94 | 1.4% |
| Thai | 9 | 0.1% |
| Ukrainian | 178 | 2.6% |
| Welsh | 310 | 4.5% |
| Yugoslavian | 64 | 0.9% | View All 41 Rows |
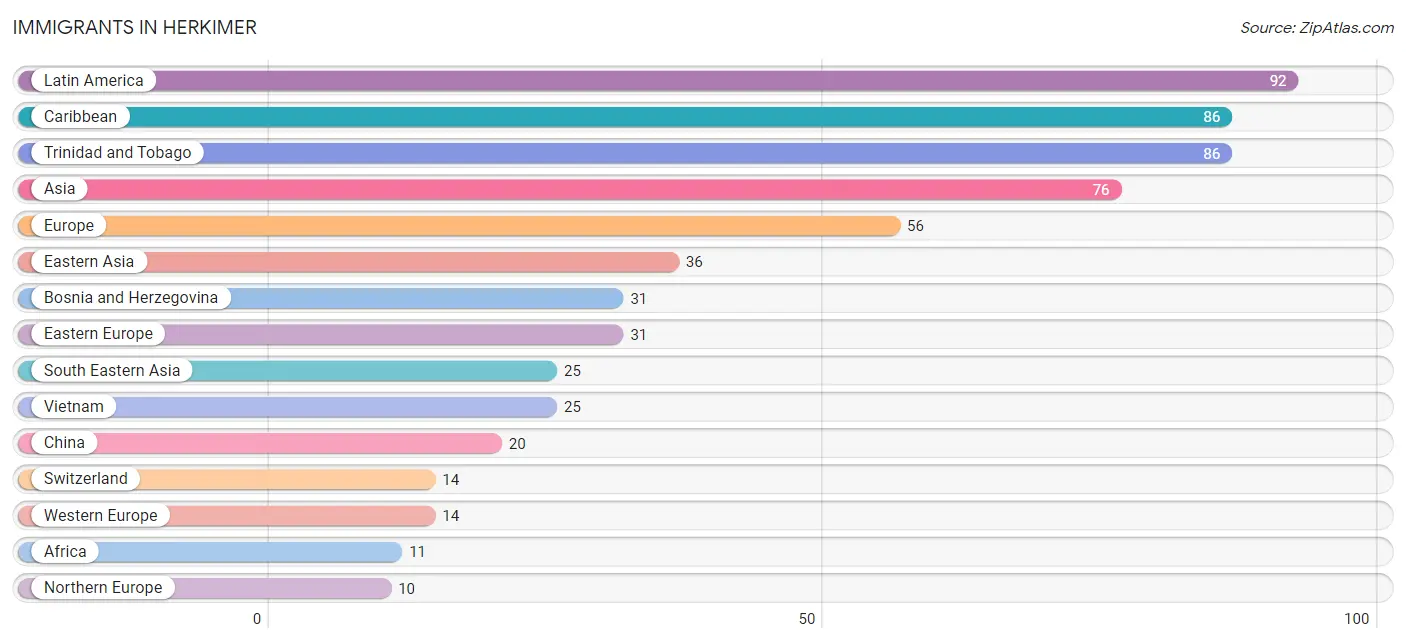
Immigrants in Herkimer
The most numerous immigrant groups reported in Herkimer came from Latin America (92 | 1.3%), Caribbean (86 | 1.3%), Trinidad and Tobago (86 | 1.3%), Asia (76 | 1.1%), and Europe (56 | 0.8%), together accounting for 5.8% of all Herkimer residents.
| Immigration Origin | # Population | % Population |
| Africa | 11 | 0.2% |
| Asia | 76 | 1.1% |
| Bosnia and Herzegovina | 31 | 0.4% |
| Brazil | 6 | 0.1% |
| Caribbean | 86 | 1.3% |
| China | 20 | 0.3% |
| Eastern Africa | 9 | 0.1% |
| Eastern Asia | 36 | 0.5% |
| Eastern Europe | 31 | 0.4% |
| England | 7 | 0.1% |
| Ethiopia | 9 | 0.1% |
| Europe | 56 | 0.8% |
| India | 6 | 0.1% |
| Ireland | 1 | 0.0% |
| Japan | 8 | 0.1% |
| Korea | 8 | 0.1% |
| Latin America | 92 | 1.3% |
| Morocco | 2 | 0.0% |
| Northern Africa | 2 | 0.0% |
| Northern Europe | 10 | 0.2% |
| Norway | 2 | 0.0% |
| Portugal | 1 | 0.0% |
| South America | 6 | 0.1% |
| South Central Asia | 6 | 0.1% |
| South Eastern Asia | 25 | 0.4% |
| Southern Europe | 1 | 0.0% |
| Switzerland | 14 | 0.2% |
| Trinidad and Tobago | 86 | 1.3% |
| Turkey | 9 | 0.1% |
| Vietnam | 25 | 0.4% |
| Western Asia | 9 | 0.1% |
| Western Europe | 14 | 0.2% | View All 32 Rows |
Sex and Age in Herkimer
Sex and Age in Herkimer
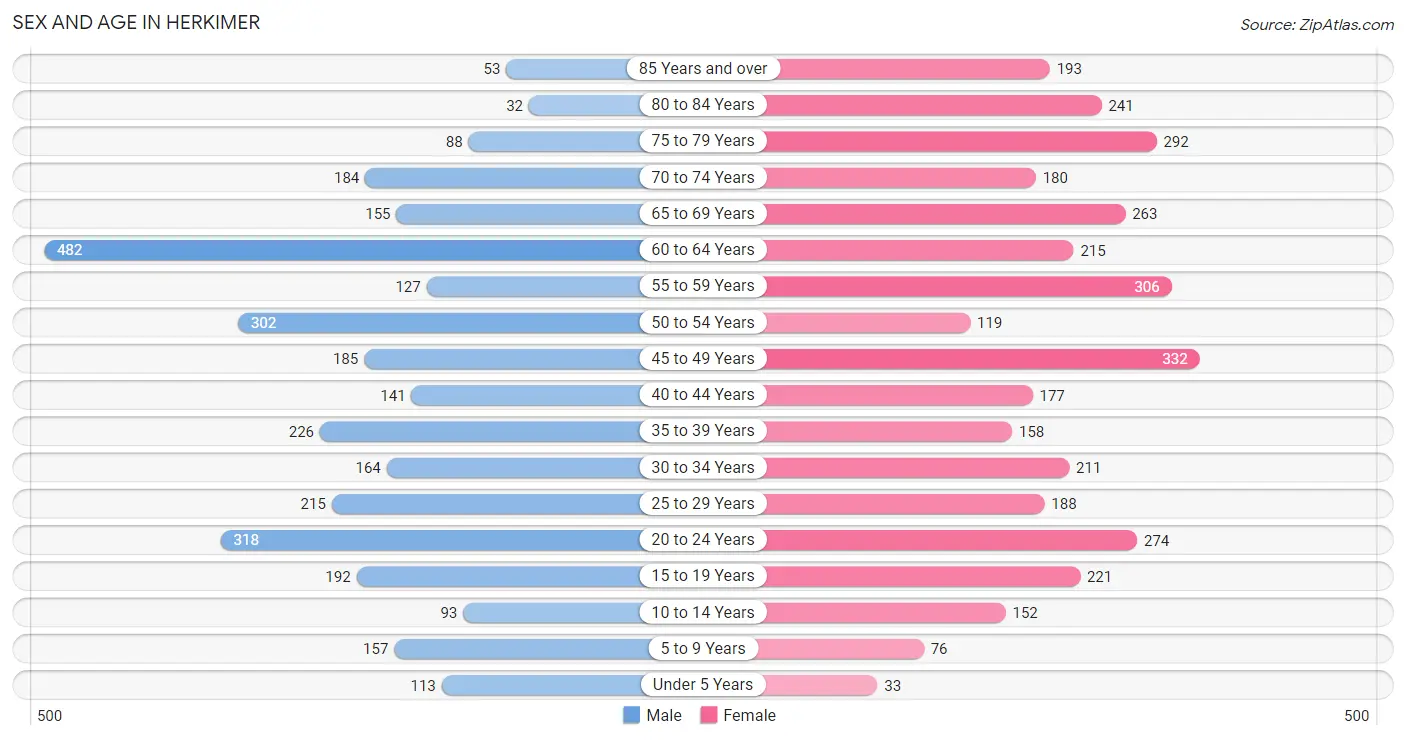
The most populous age groups in Herkimer are 60 to 64 Years (482 | 14.9%) for men and 45 to 49 Years (332 | 9.1%) for women.
| Age Bracket | Male | Female |
| Under 5 Years | 113 (3.5%) | 33 (0.9%) |
| 5 to 9 Years | 157 (4.9%) | 76 (2.1%) |
| 10 to 14 Years | 93 (2.9%) | 152 (4.2%) |
| 15 to 19 Years | 192 (5.9%) | 221 (6.1%) |
| 20 to 24 Years | 318 (9.9%) | 274 (7.5%) |
| 25 to 29 Years | 215 (6.7%) | 188 (5.2%) |
| 30 to 34 Years | 164 (5.1%) | 211 (5.8%) |
| 35 to 39 Years | 226 (7.0%) | 158 (4.3%) |
| 40 to 44 Years | 141 (4.4%) | 177 (4.9%) |
| 45 to 49 Years | 185 (5.7%) | 332 (9.1%) |
| 50 to 54 Years | 302 (9.4%) | 119 (3.3%) |
| 55 to 59 Years | 127 (3.9%) | 306 (8.4%) |
| 60 to 64 Years | 482 (14.9%) | 215 (5.9%) |
| 65 to 69 Years | 155 (4.8%) | 263 (7.2%) |
| 70 to 74 Years | 184 (5.7%) | 180 (5.0%) |
| 75 to 79 Years | 88 (2.7%) | 292 (8.0%) |
| 80 to 84 Years | 32 (1.0%) | 241 (6.6%) |
| 85 Years and over | 53 (1.6%) | 193 (5.3%) |
| Total | 3,227 (100.0%) | 3,631 (100.0%) |
Families and Households in Herkimer
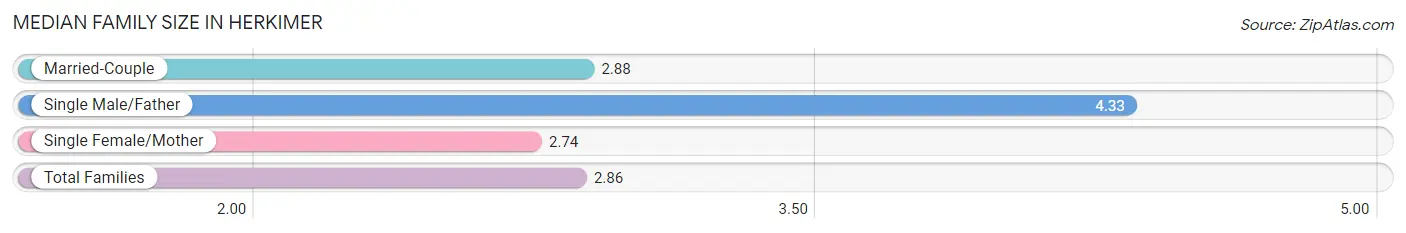
Median Family Size in Herkimer
The median family size in Herkimer is 2.86 persons per family, with single male/father families (6 | 0.4%) accounting for the largest median family size of 4.33 persons per family. On the other hand, single female/mother families (337 | 21.4%) represent the smallest median family size with 2.74 persons per family.
| Family Type | # Families | Family Size |
| Married-Couple | 1,233 (78.2%) | 2.88 |
| Single Male/Father | 6 (0.4%) | 4.33 |
| Single Female/Mother | 337 (21.4%) | 2.74 |
| Total Families | 1,576 (100.0%) | 2.86 |
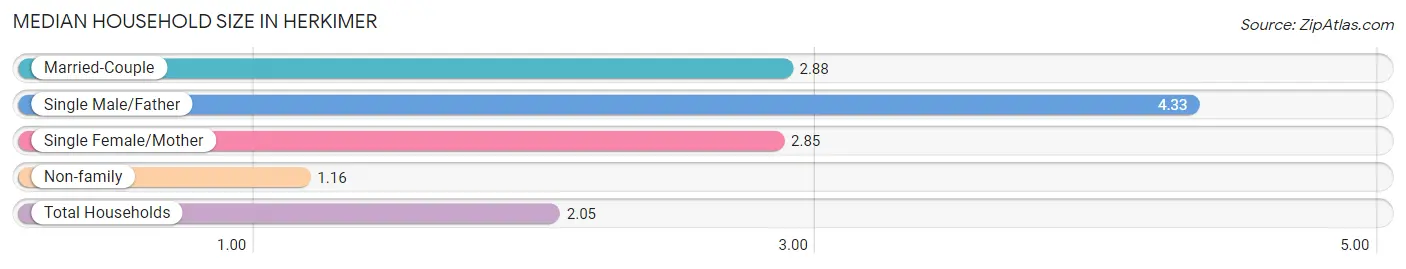
Median Household Size in Herkimer
The median household size in Herkimer is 2.05 persons per household, with single male/father households (6 | 0.2%) accounting for the largest median household size of 4.33 persons per household. non-family households (1,466 | 48.2%) represent the smallest median household size with 1.16 persons per household.
| Household Type | # Households | Household Size |
| Married-Couple | 1,233 (40.5%) | 2.88 |
| Single Male/Father | 6 (0.2%) | 4.33 |
| Single Female/Mother | 337 (11.1%) | 2.85 |
| Non-family | 1,466 (48.2%) | 1.16 |
| Total Households | 3,042 (100.0%) | 2.05 |
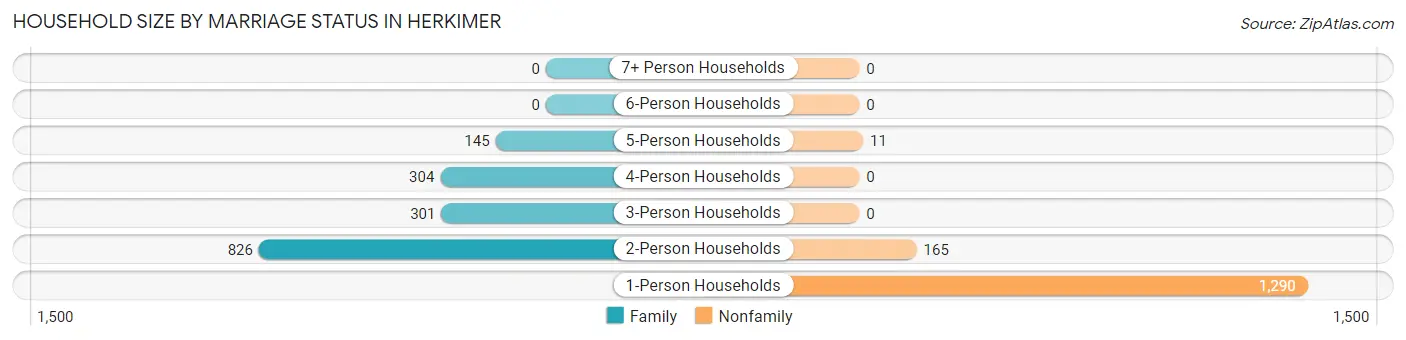
Household Size by Marriage Status in Herkimer
Out of a total of 3,042 households in Herkimer, 1,576 (51.8%) are family households, while 1,466 (48.2%) are nonfamily households. The most numerous type of family households are 2-person households, comprising 826, and the most common type of nonfamily households are 1-person households, comprising 1,290.
| Household Size | Family Households | Nonfamily Households |
| 1-Person Households | - | 1,290 (42.4%) |
| 2-Person Households | 826 (27.2%) | 165 (5.4%) |
| 3-Person Households | 301 (9.9%) | 0 (0.0%) |
| 4-Person Households | 304 (10.0%) | 0 (0.0%) |
| 5-Person Households | 145 (4.8%) | 11 (0.4%) |
| 6-Person Households | 0 (0.0%) | 0 (0.0%) |
| 7+ Person Households | 0 (0.0%) | 0 (0.0%) |
| Total | 1,576 (51.8%) | 1,466 (48.2%) |
Female Fertility in Herkimer
Fertility by Age in Herkimer
Average fertility rate in Herkimer is 21.0 births per 1,000 women. Women in the age bracket of 20 to 34 years have the highest fertility rate with 49.0 births per 1,000 women. Women in the age bracket of 20 to 34 years acount for 100.0% of all women with births.
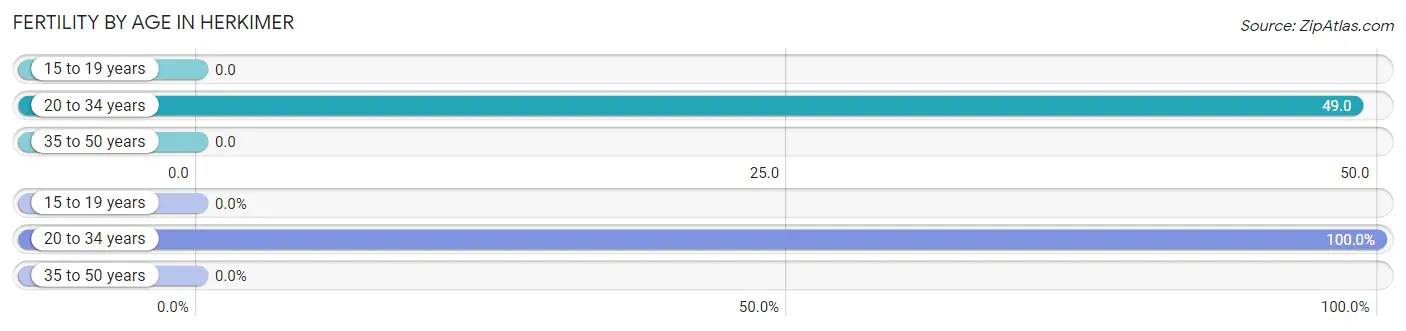
| Age Bracket | Women with Births | Births / 1,000 Women |
| 15 to 19 years | 0 (0.0%) | 0.0 |
| 20 to 34 years | 33 (100.0%) | 49.0 |
| 35 to 50 years | 0 (0.0%) | 0.0 |
| Total | 33 (100.0%) | 21.0 |
Fertility by Age by Marriage Status in Herkimer
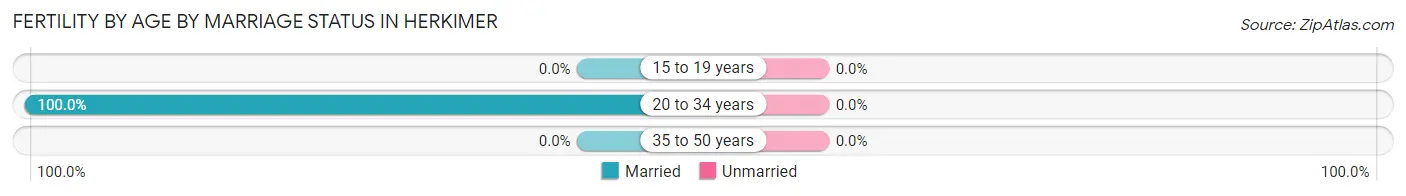
| Age Bracket | Married | Unmarried |
| 15 to 19 years | 0 (0.0%) | 0 (0.0%) |
| 20 to 34 years | 33 (100.0%) | 0 (0.0%) |
| 35 to 50 years | 0 (0.0%) | 0 (0.0%) |
| Total | 33 (100.0%) | 0 (0.0%) |
Fertility by Education in Herkimer
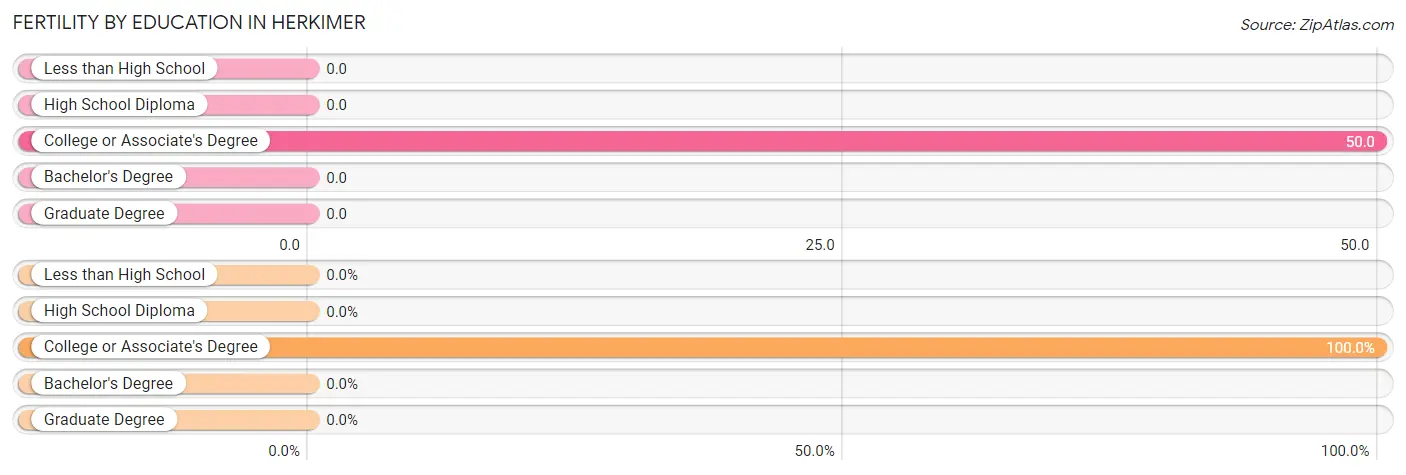
| Educational Attainment | Women with Births | Births / 1,000 Women |
| Less than High School | 0 (0.0%) | 0.0 |
| High School Diploma | 0 (0.0%) | 0.0 |
| College or Associate's Degree | 33 (100.0%) | 50.0 |
| Bachelor's Degree | 0 (0.0%) | 0.0 |
| Graduate Degree | 0 (0.0%) | 0.0 |
| Total | 33 (100.0%) | 21.0 |
Fertility by Education by Marriage Status in Herkimer
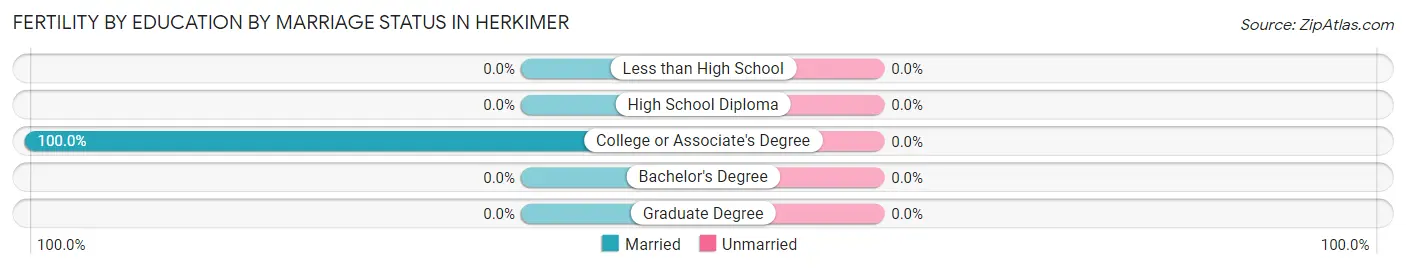
| Educational Attainment | Married | Unmarried |
| Less than High School | 0 (0.0%) | 0 (0.0%) |
| High School Diploma | 0 (0.0%) | 0 (0.0%) |
| College or Associate's Degree | 33 (100.0%) | 0 (0.0%) |
| Bachelor's Degree | 0 (0.0%) | 0 (0.0%) |
| Graduate Degree | 0 (0.0%) | 0 (0.0%) |
| Total | 33 (100.0%) | 0 (0.0%) |
Income in Herkimer
Income Overview in Herkimer
Per Capita Income in Herkimer is $32,762, while median incomes of families and households are $91,547 and $56,607 respectively.
| Characteristic | Number | Measure |
| Per Capita Income | 6,858 | $32,762 |
| Median Family Income | 1,576 | $91,547 |
| Mean Family Income | 1,576 | $96,763 |
| Median Household Income | 3,042 | $56,607 |
| Mean Household Income | 3,042 | $71,122 |
| Income Deficit | 1,576 | $0 |
| Wage / Income Gap (%) | 6,858 | 3.42% |
| Wage / Income Gap ($) | 6,858 | 96.58¢ per $1 |
| Gini / Inequality Index | 6,858 | 0.43 |
Earnings by Sex in Herkimer
Average Earnings in Herkimer are $36,597, $35,556 for men and $36,816 for women, a difference of 3.4%.
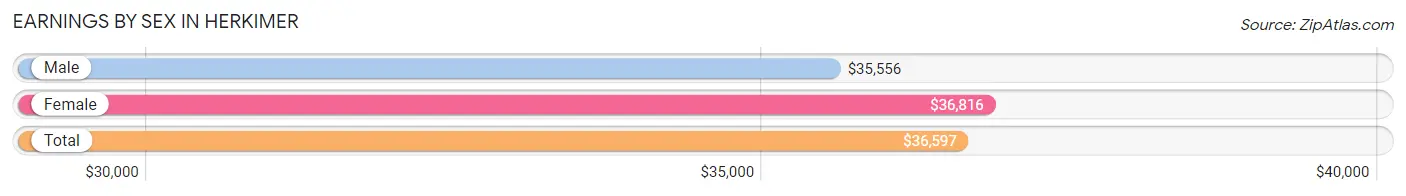
| Sex | Number | Average Earnings |
| Male | 1,910 (53.1%) | $35,556 |
| Female | 1,688 (46.9%) | $36,816 |
| Total | 3,598 (100.0%) | $36,597 |
Earnings by Sex by Income Bracket in Herkimer
The most common earnings brackets in Herkimer are $55,000 to $64,999 for men (225 | 11.8%) and $35,000 to $39,999 for women (253 | 15.0%).
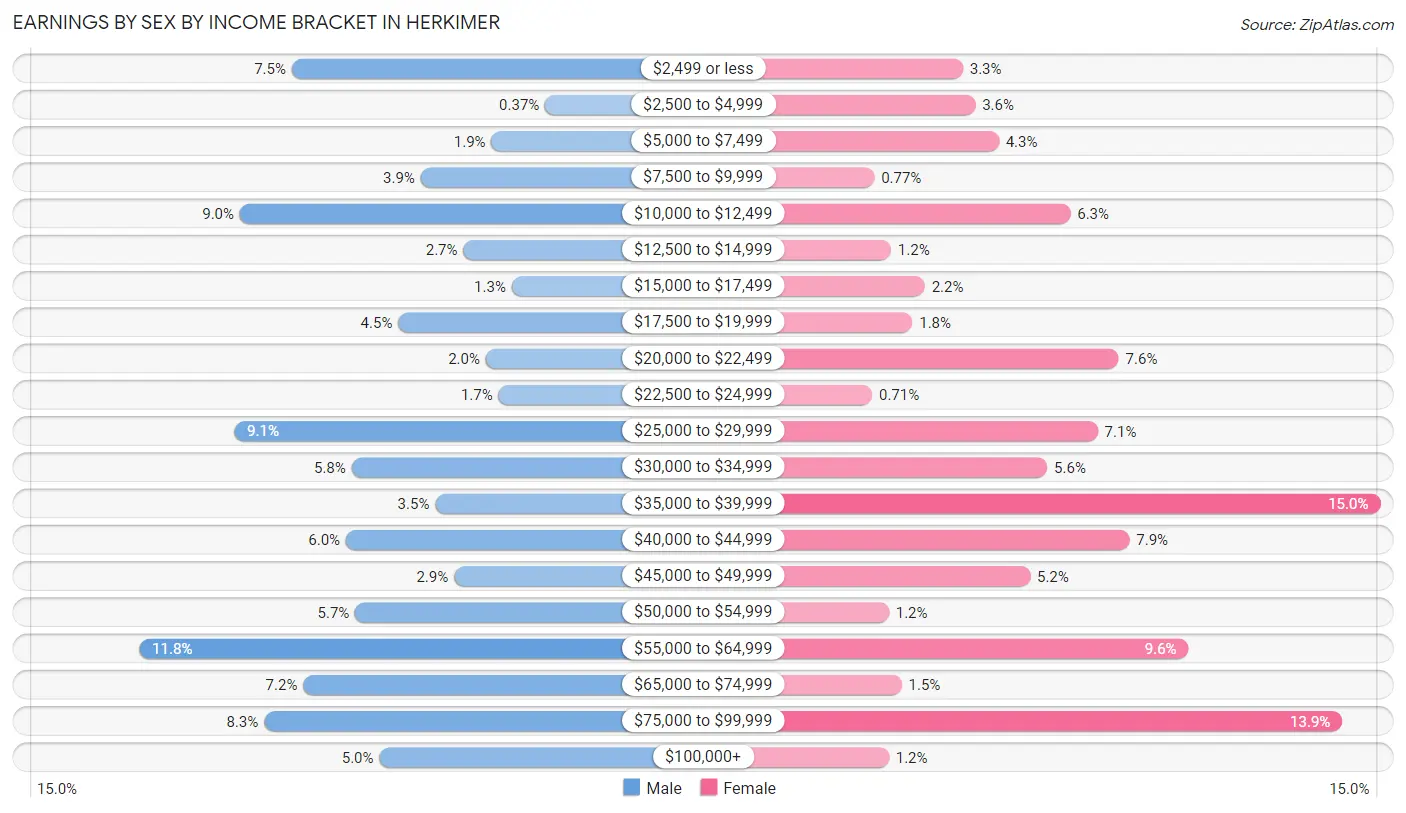
| Income | Male | Female |
| $2,499 or less | 143 (7.5%) | 55 (3.3%) |
| $2,500 to $4,999 | 7 (0.4%) | 61 (3.6%) |
| $5,000 to $7,499 | 36 (1.9%) | 72 (4.3%) |
| $7,500 to $9,999 | 74 (3.9%) | 13 (0.8%) |
| $10,000 to $12,499 | 171 (8.9%) | 106 (6.3%) |
| $12,500 to $14,999 | 51 (2.7%) | 21 (1.2%) |
| $15,000 to $17,499 | 25 (1.3%) | 37 (2.2%) |
| $17,500 to $19,999 | 86 (4.5%) | 31 (1.8%) |
| $20,000 to $22,499 | 39 (2.0%) | 129 (7.6%) |
| $22,500 to $24,999 | 32 (1.7%) | 12 (0.7%) |
| $25,000 to $29,999 | 174 (9.1%) | 119 (7.0%) |
| $30,000 to $34,999 | 111 (5.8%) | 95 (5.6%) |
| $35,000 to $39,999 | 66 (3.5%) | 253 (15.0%) |
| $40,000 to $44,999 | 114 (6.0%) | 134 (7.9%) |
| $45,000 to $49,999 | 56 (2.9%) | 87 (5.1%) |
| $50,000 to $54,999 | 109 (5.7%) | 20 (1.2%) |
| $55,000 to $64,999 | 225 (11.8%) | 162 (9.6%) |
| $65,000 to $74,999 | 137 (7.2%) | 26 (1.5%) |
| $75,000 to $99,999 | 158 (8.3%) | 235 (13.9%) |
| $100,000+ | 96 (5.0%) | 20 (1.2%) |
| Total | 1,910 (100.0%) | 1,688 (100.0%) |
Earnings by Sex by Educational Attainment in Herkimer
Average earnings in Herkimer are $42,375 for men and $38,420 for women, a difference of 9.3%. Men with an educational attainment of bachelor's degree enjoy the highest average annual earnings of $59,349, while those with high school diploma education earn the least with $34,479. Women with an educational attainment of graduate degree earn the most with the average annual earnings of $60,815, while those with less than high school education have the smallest earnings of $13,958.
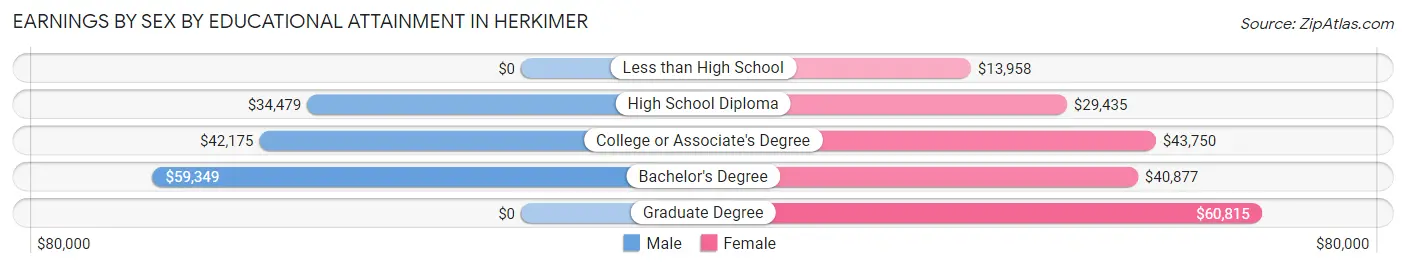
| Educational Attainment | Male Income | Female Income |
| Less than High School | - | - |
| High School Diploma | $34,479 | $29,435 |
| College or Associate's Degree | $42,175 | $43,750 |
| Bachelor's Degree | $59,349 | $40,877 |
| Graduate Degree | - | - |
| Total | $42,375 | $38,420 |
Family Income in Herkimer
Family Income Brackets in Herkimer
According to the Herkimer family income data, there are 422 families falling into the $100,000 to $149,999 income range, which is the most common income bracket and makes up 26.8% of all families. Conversely, the less than $10,000 income bracket is the least frequent group with only 36 families (2.3%) belonging to this category.
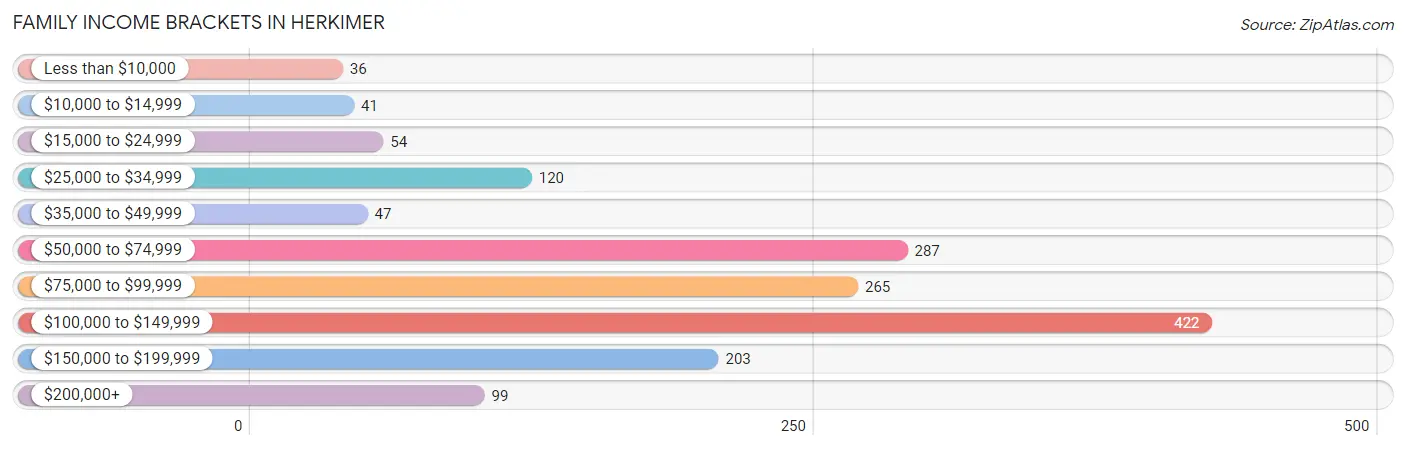
| Income Bracket | # Families | % Families |
| Less than $10,000 | 36 | 2.3% |
| $10,000 to $14,999 | 41 | 2.6% |
| $15,000 to $24,999 | 54 | 3.4% |
| $25,000 to $34,999 | 120 | 7.6% |
| $35,000 to $49,999 | 47 | 3.0% |
| $50,000 to $74,999 | 287 | 18.2% |
| $75,000 to $99,999 | 265 | 16.8% |
| $100,000 to $149,999 | 422 | 26.8% |
| $150,000 to $199,999 | 203 | 12.9% |
| $200,000+ | 99 | 6.3% |
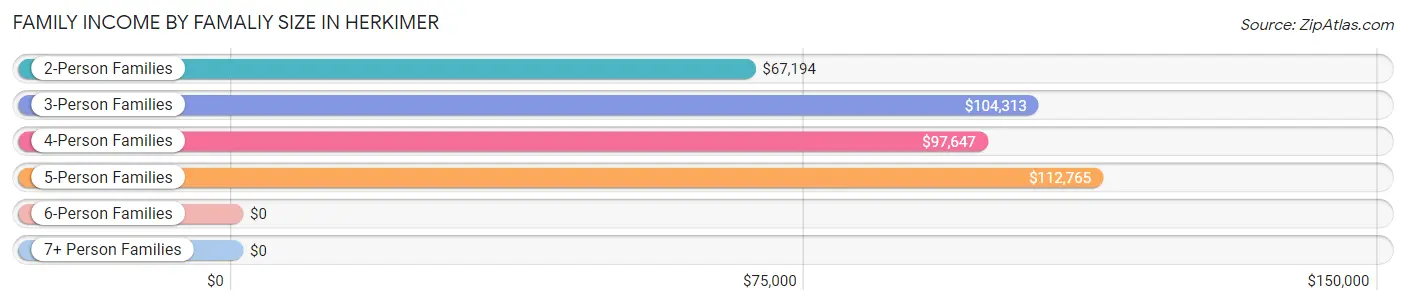
Family Income by Famaliy Size in Herkimer
5-person families (145 | 9.2%) account for the highest median family income in Herkimer with $112,765 per family, while 3-person families (265 | 16.8%) have the highest median income of $34,771 per family member.
| Income Bracket | # Families | Median Income |
| 2-Person Families | 862 (54.7%) | $67,194 |
| 3-Person Families | 265 (16.8%) | $104,313 |
| 4-Person Families | 304 (19.3%) | $97,647 |
| 5-Person Families | 145 (9.2%) | $112,765 |
| 6-Person Families | 0 (0.0%) | $0 |
| 7+ Person Families | 0 (0.0%) | $0 |
| Total | 1,576 (100.0%) | $91,547 |
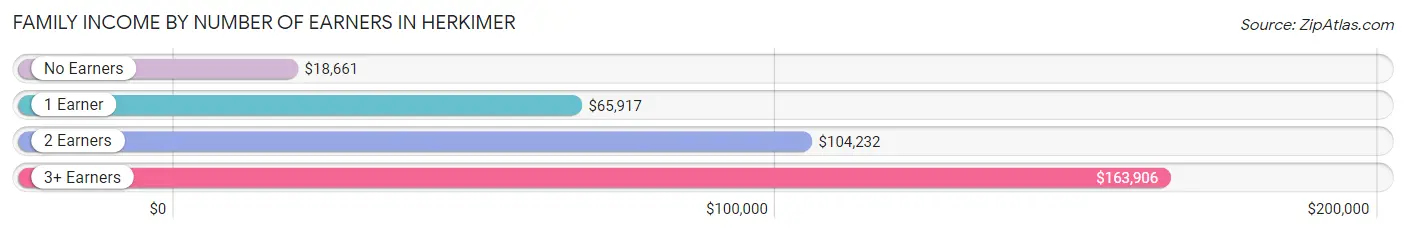
Family Income by Number of Earners in Herkimer
The median family income in Herkimer is $91,547, with families comprising 3+ earners (212) having the highest median family income of $163,906, while families with no earners (145) have the lowest median family income of $18,661, accounting for 13.5% and 9.2% of families, respectively.
| Number of Earners | # Families | Median Income |
| No Earners | 145 (9.2%) | $18,661 |
| 1 Earner | 636 (40.4%) | $65,917 |
| 2 Earners | 583 (37.0%) | $104,232 |
| 3+ Earners | 212 (13.5%) | $163,906 |
| Total | 1,576 (100.0%) | $91,547 |
Household Income in Herkimer
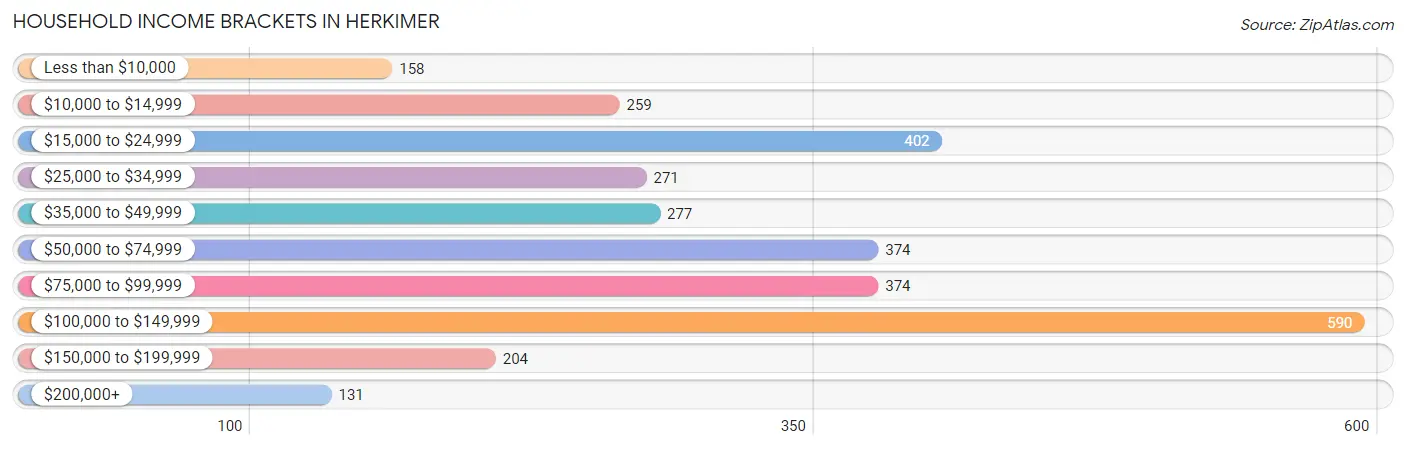
Household Income Brackets in Herkimer
With 590 households falling in the category, the $100,000 to $149,999 income range is the most frequent in Herkimer, accounting for 19.4% of all households. In contrast, only 131 households (4.3%) fall into the $200,000+ income bracket, making it the least populous group.
| Income Bracket | # Households | % Households |
| Less than $10,000 | 158 | 5.2% |
| $10,000 to $14,999 | 259 | 8.5% |
| $15,000 to $24,999 | 402 | 13.2% |
| $25,000 to $34,999 | 271 | 8.9% |
| $35,000 to $49,999 | 277 | 9.1% |
| $50,000 to $74,999 | 374 | 12.3% |
| $75,000 to $99,999 | 374 | 12.3% |
| $100,000 to $149,999 | 590 | 19.4% |
| $150,000 to $199,999 | 204 | 6.7% |
| $200,000+ | 131 | 4.3% |
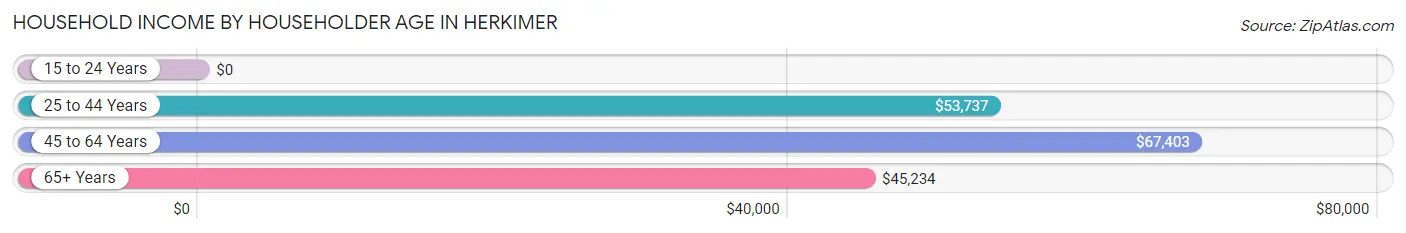
Household Income by Householder Age in Herkimer
The median household income in Herkimer is $56,607, with the highest median household income of $67,403 found in the 45 to 64 years age bracket for the primary householder. A total of 1,275 households (41.9%) fall into this category. Meanwhile, the 15 to 24 years age bracket for the primary householder has the lowest median household income of $0, with 118 households (3.9%) in this group.
| Income Bracket | # Households | Median Income |
| 15 to 24 Years | 118 (3.9%) | $0 |
| 25 to 44 Years | 650 (21.4%) | $53,737 |
| 45 to 64 Years | 1,275 (41.9%) | $67,403 |
| 65+ Years | 999 (32.8%) | $45,234 |
| Total | 3,042 (100.0%) | $56,607 |
Poverty in Herkimer
Income Below Poverty by Sex and Age in Herkimer
With 11.6% poverty level for males and 13.5% for females among the residents of Herkimer, under 5 year old males and 12 to 14 year old females are the most vulnerable to poverty, with 47 males (41.6%) and 23 females (28.7%) in their respective age groups living below the poverty level.
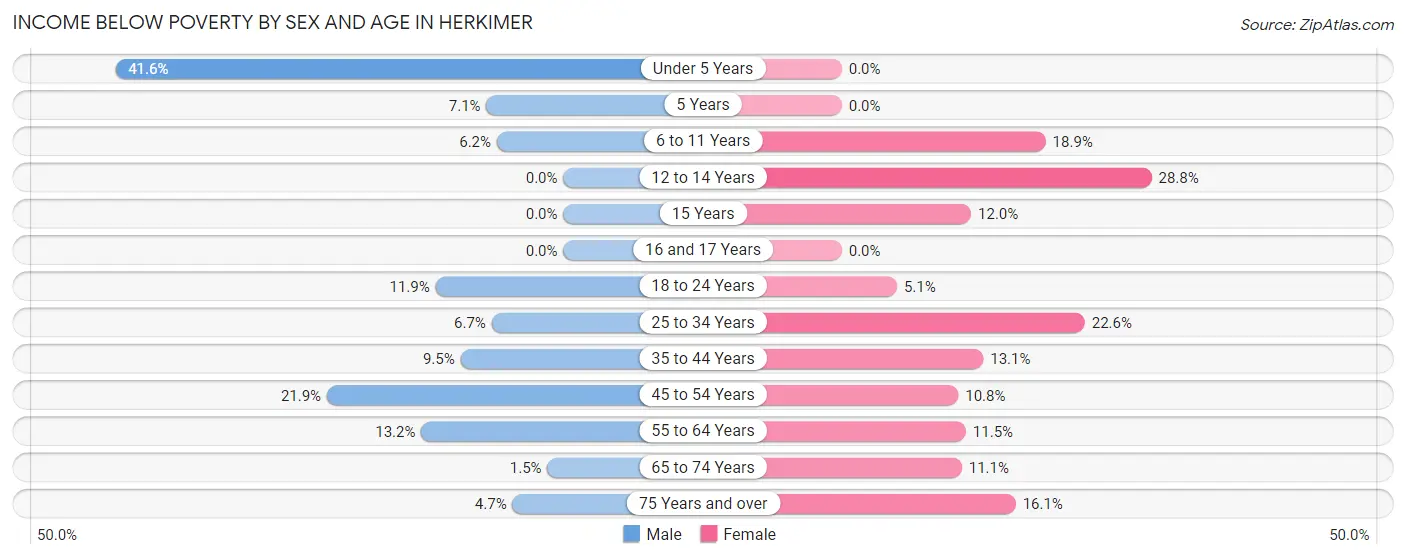
| Age Bracket | Male | Female |
| Under 5 Years | 47 (41.6%) | 0 (0.0%) |
| 5 Years | 5 (7.1%) | 0 (0.0%) |
| 6 to 11 Years | 10 (6.2%) | 28 (18.9%) |
| 12 to 14 Years | 0 (0.0%) | 23 (28.7%) |
| 15 Years | 0 (0.0%) | 12 (12.0%) |
| 16 and 17 Years | 0 (0.0%) | 0 (0.0%) |
| 18 to 24 Years | 37 (11.9%) | 15 (5.1%) |
| 25 to 34 Years | 25 (6.7%) | 85 (22.6%) |
| 35 to 44 Years | 35 (9.5%) | 44 (13.1%) |
| 45 to 54 Years | 102 (21.9%) | 48 (10.8%) |
| 55 to 64 Years | 78 (13.2%) | 60 (11.5%) |
| 65 to 74 Years | 5 (1.5%) | 47 (11.1%) |
| 75 Years and over | 6 (4.7%) | 87 (16.1%) |
| Total | 350 (11.6%) | 449 (13.5%) |
Income Above Poverty by Sex and Age in Herkimer
According to the poverty statistics in Herkimer, males aged 12 to 14 years and females aged under 5 years are the age groups that are most secure financially, with 100.0% of males and 100.0% of females in these age groups living above the poverty line.
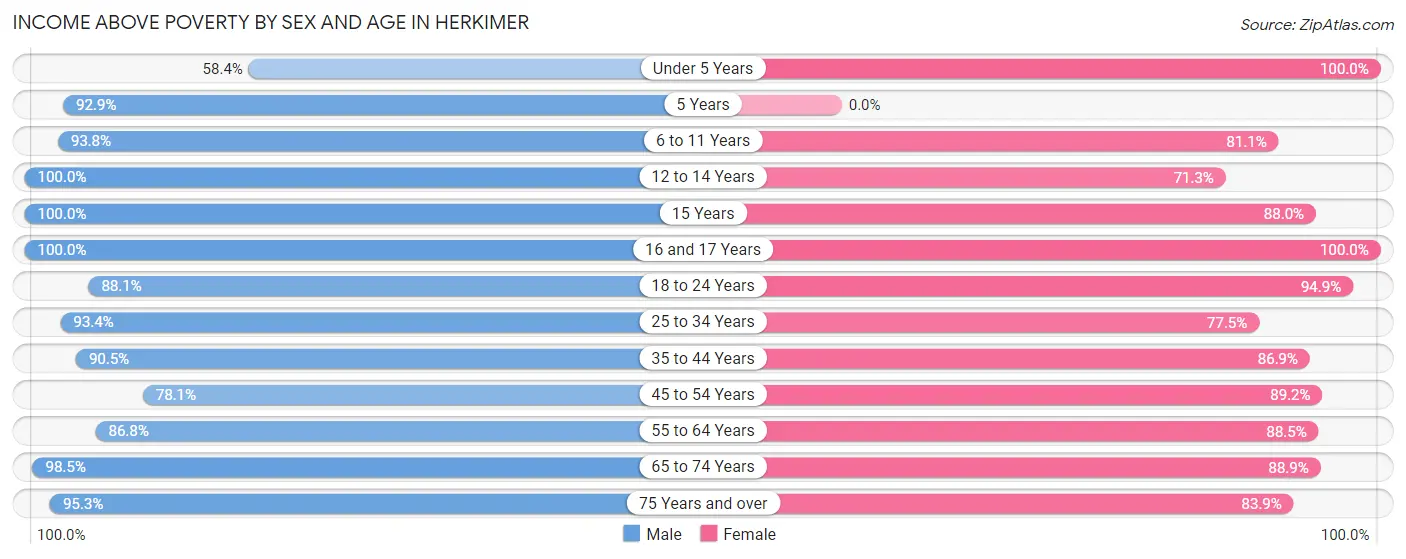
| Age Bracket | Male | Female |
| Under 5 Years | 66 (58.4%) | 33 (100.0%) |
| 5 Years | 65 (92.9%) | 0 (0.0%) |
| 6 to 11 Years | 152 (93.8%) | 120 (81.1%) |
| 12 to 14 Years | 18 (100.0%) | 57 (71.3%) |
| 15 Years | 23 (100.0%) | 88 (88.0%) |
| 16 and 17 Years | 55 (100.0%) | 24 (100.0%) |
| 18 to 24 Years | 275 (88.1%) | 278 (94.9%) |
| 25 to 34 Years | 351 (93.3%) | 292 (77.4%) |
| 35 to 44 Years | 332 (90.5%) | 291 (86.9%) |
| 45 to 54 Years | 363 (78.1%) | 396 (89.2%) |
| 55 to 64 Years | 514 (86.8%) | 461 (88.5%) |
| 65 to 74 Years | 333 (98.5%) | 375 (88.9%) |
| 75 Years and over | 121 (95.3%) | 452 (83.9%) |
| Total | 2,668 (88.4%) | 2,867 (86.5%) |
Income Below Poverty Among Married-Couple Families in Herkimer
The poverty statistics for married-couple families in Herkimer show that 5.0% or 61 of the total 1,233 families live below the poverty line. Families with 1 or 2 children have the highest poverty rate of 17.5%, comprising of 50 families. On the other hand, families with no children have the lowest poverty rate of 0.7%, which includes 6 families.
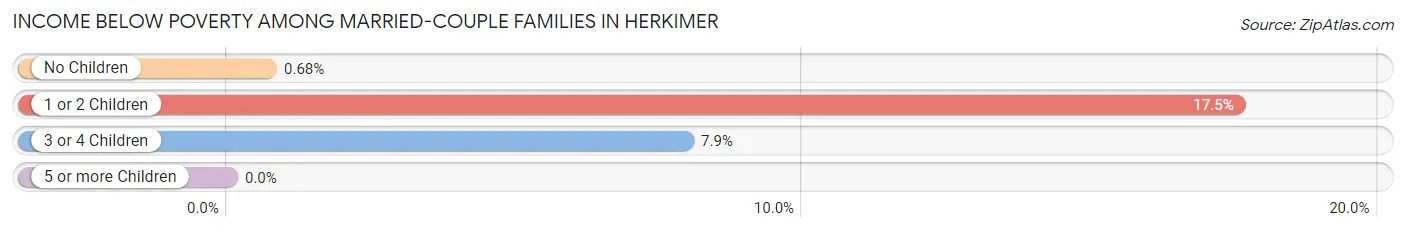
| Children | Above Poverty | Below Poverty |
| No Children | 879 (99.3%) | 6 (0.7%) |
| 1 or 2 Children | 235 (82.5%) | 50 (17.5%) |
| 3 or 4 Children | 58 (92.1%) | 5 (7.9%) |
| 5 or more Children | 0 (0.0%) | 0 (0.0%) |
| Total | 1,172 (95.1%) | 61 (5.0%) |
Income Below Poverty Among Single-Parent Households in Herkimer
According to the poverty data in Herkimer, 100.0% or 6 single-father households and 11.3% or 38 single-mother households are living below the poverty line. Among single-father households, those with 3 or 4 children have the highest poverty rate, with 6 households (100.0%) experiencing poverty. Likewise, among single-mother households, those with 1 or 2 children have the highest poverty rate, with 31 households (13.6%) falling below the poverty line.
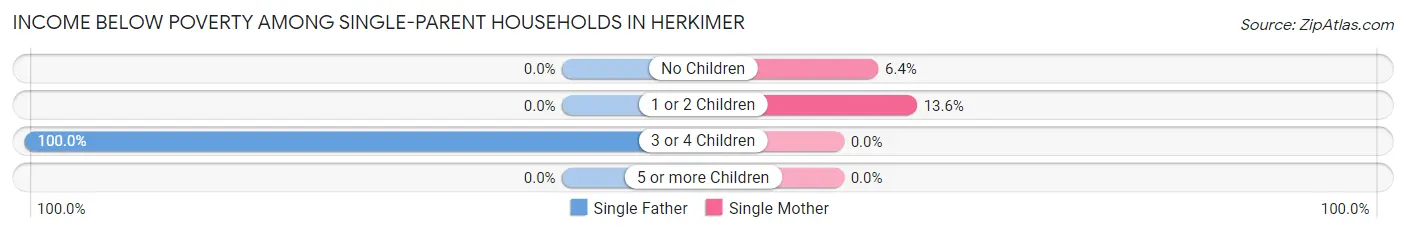
| Children | Single Father | Single Mother |
| No Children | 0 (0.0%) | 7 (6.4%) |
| 1 or 2 Children | 0 (0.0%) | 31 (13.6%) |
| 3 or 4 Children | 6 (100.0%) | 0 (0.0%) |
| 5 or more Children | 0 (0.0%) | 0 (0.0%) |
| Total | 6 (100.0%) | 38 (11.3%) |
Income Below Poverty Among Married-Couple vs Single-Parent Households in Herkimer
The poverty data for Herkimer shows that 61 of the married-couple family households (5.0%) and 44 of the single-parent households (12.8%) are living below the poverty level. Within the married-couple family households, those with 1 or 2 children have the highest poverty rate, with 50 households (17.5%) falling below the poverty line. Among the single-parent households, those with 3 or 4 children have the highest poverty rate, with 6 household (100.0%) living below poverty.
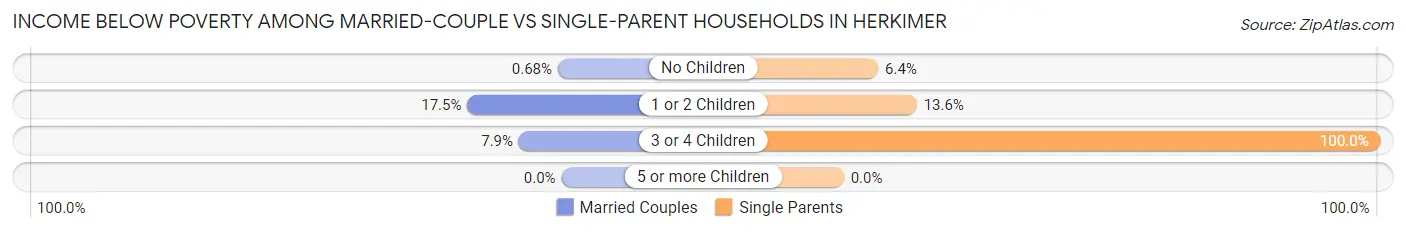
| Children | Married-Couple Families | Single-Parent Households |
| No Children | 6 (0.7%) | 7 (6.4%) |
| 1 or 2 Children | 50 (17.5%) | 31 (13.6%) |
| 3 or 4 Children | 5 (7.9%) | 6 (100.0%) |
| 5 or more Children | 0 (0.0%) | 0 (0.0%) |
| Total | 61 (5.0%) | 44 (12.8%) |
Employment Characteristics in Herkimer
Employment by Class of Employer in Herkimer
Among the 3,319 employed individuals in Herkimer, private company employees (2,124 | 64.0%), not-for-profit organizations (442 | 13.3%), and local government employees (325 | 9.8%) make up the most common classes of employment.
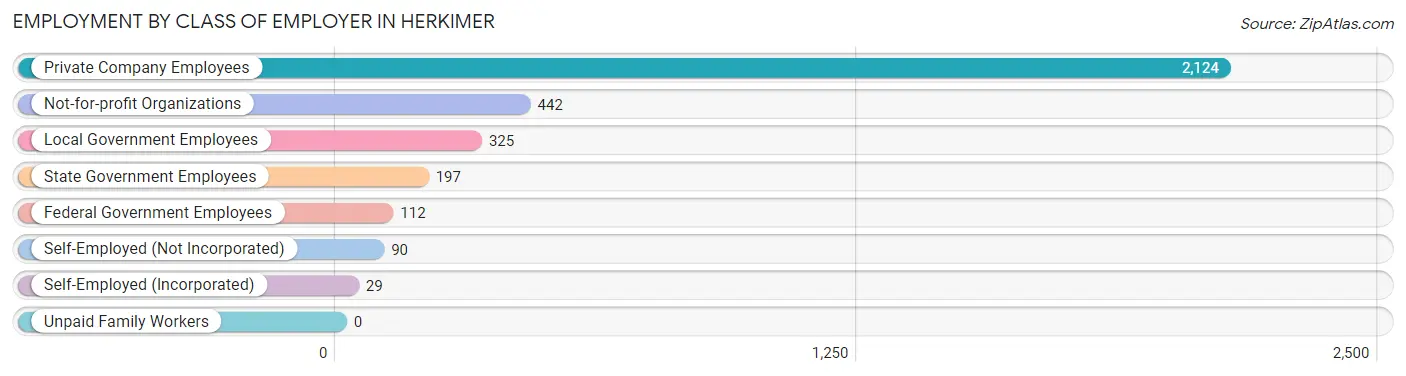
| Employer Class | # Employees | % Employees |
| Private Company Employees | 2,124 | 64.0% |
| Self-Employed (Incorporated) | 29 | 0.9% |
| Self-Employed (Not Incorporated) | 90 | 2.7% |
| Not-for-profit Organizations | 442 | 13.3% |
| Local Government Employees | 325 | 9.8% |
| State Government Employees | 197 | 5.9% |
| Federal Government Employees | 112 | 3.4% |
| Unpaid Family Workers | 0 | 0.0% |
| Total | 3,319 | 100.0% |
Employment Status by Age in Herkimer
According to the labor force statistics for Herkimer, out of the total population over 16 years of age (6,111), 58.7% or 3,587 individuals are in the labor force, with 6.1% or 219 of them unemployed. The age group with the highest labor force participation rate is 20 to 24 years, with 87.0% or 515 individuals in the labor force. Within the labor force, the 16 to 19 years age range has the highest percentage of unemployed individuals, with 55.1% or 59 of them being unemployed.
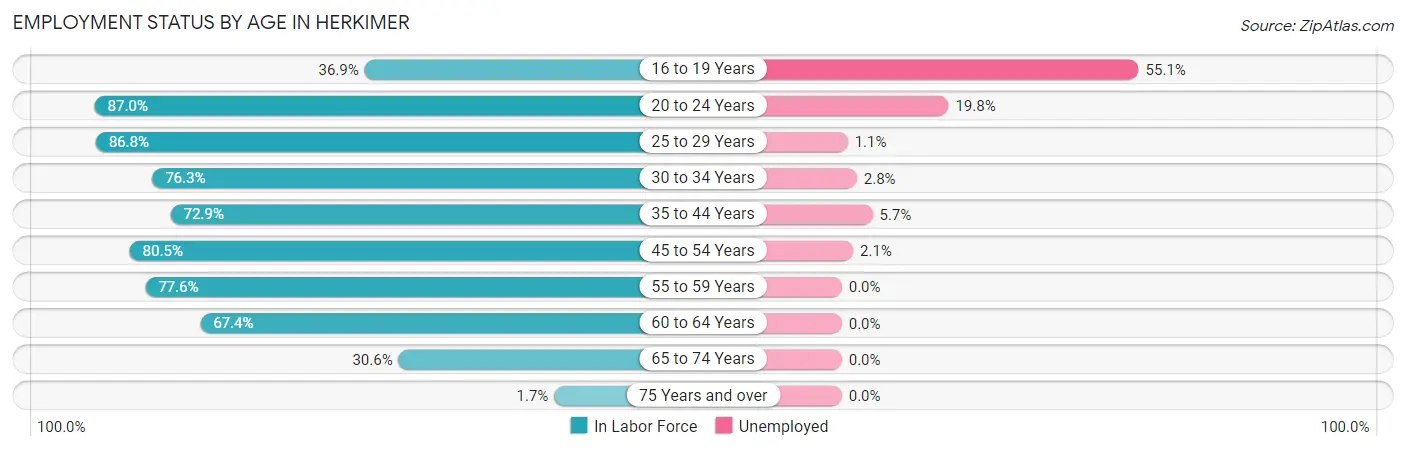
| Age Bracket | In Labor Force | Unemployed |
| 16 to 19 Years | 107 (36.9%) | 59 (55.1%) |
| 20 to 24 Years | 515 (87.0%) | 102 (19.8%) |
| 25 to 29 Years | 350 (86.8%) | 4 (1.1%) |
| 30 to 34 Years | 286 (76.3%) | 8 (2.8%) |
| 35 to 44 Years | 512 (72.9%) | 29 (5.7%) |
| 45 to 54 Years | 755 (80.5%) | 16 (2.1%) |
| 55 to 59 Years | 336 (77.6%) | 0 (0.0%) |
| 60 to 64 Years | 470 (67.4%) | 0 (0.0%) |
| 65 to 74 Years | 239 (30.6%) | 0 (0.0%) |
| 75 Years and over | 15 (1.7%) | 0 (0.0%) |
| Total | 3,587 (58.7%) | 219 (6.1%) |
Employment Status by Educational Attainment in Herkimer
According to labor force statistics for Herkimer, 76.4% of individuals (2,711) out of the total population between 25 and 64 years of age (3,548) are in the labor force, with 2.1% or 57 of them being unemployed. The group with the highest labor force participation rate are those with the educational attainment of bachelor's degree or higher, with 91.5% or 592 individuals in the labor force. Within the labor force, individuals with high school diploma education have the highest percentage of unemployment, with 6.1% or 53 of them being unemployed.
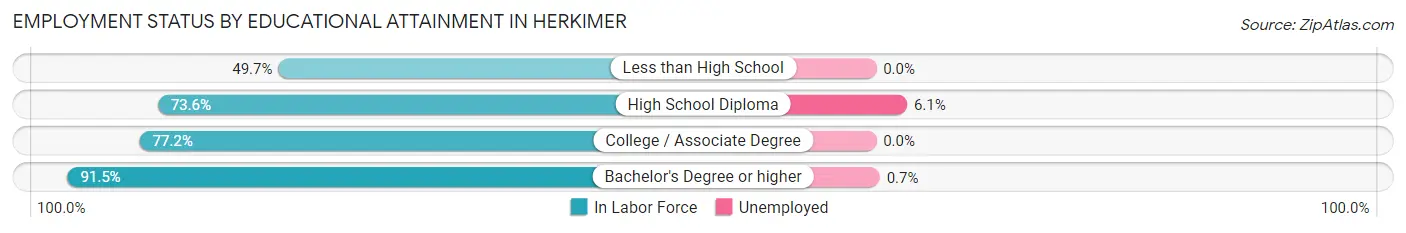
| Educational Attainment | In Labor Force | Unemployed |
| Less than High School | 146 (49.7%) | 0 (0.0%) |
| High School Diploma | 862 (73.6%) | 71 (6.1%) |
| College / Associate Degree | 1,109 (77.2%) | 0 (0.0%) |
| Bachelor's Degree or higher | 592 (91.5%) | 5 (0.7%) |
| Total | 2,711 (76.4%) | 75 (2.1%) |
Employment Occupations by Sex in Herkimer
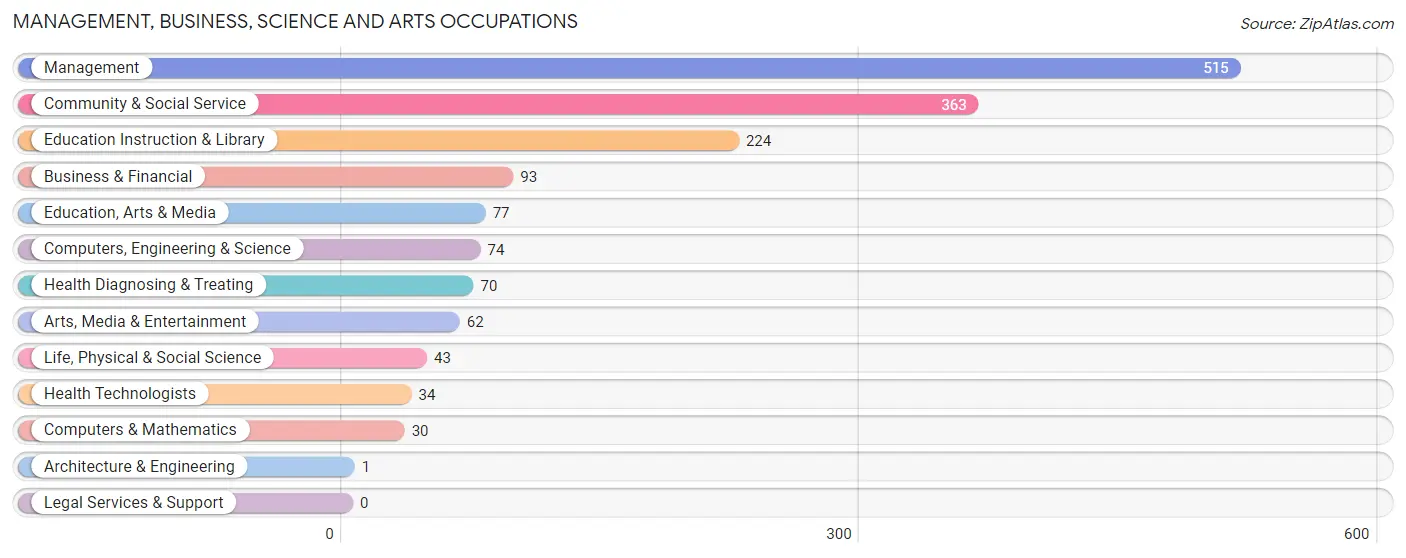
Management, Business, Science and Arts Occupations
The most common Management, Business, Science and Arts occupations in Herkimer are Management (515 | 15.3%), Community & Social Service (363 | 10.8%), Education Instruction & Library (224 | 6.7%), Business & Financial (93 | 2.8%), and Education, Arts & Media (77 | 2.3%).
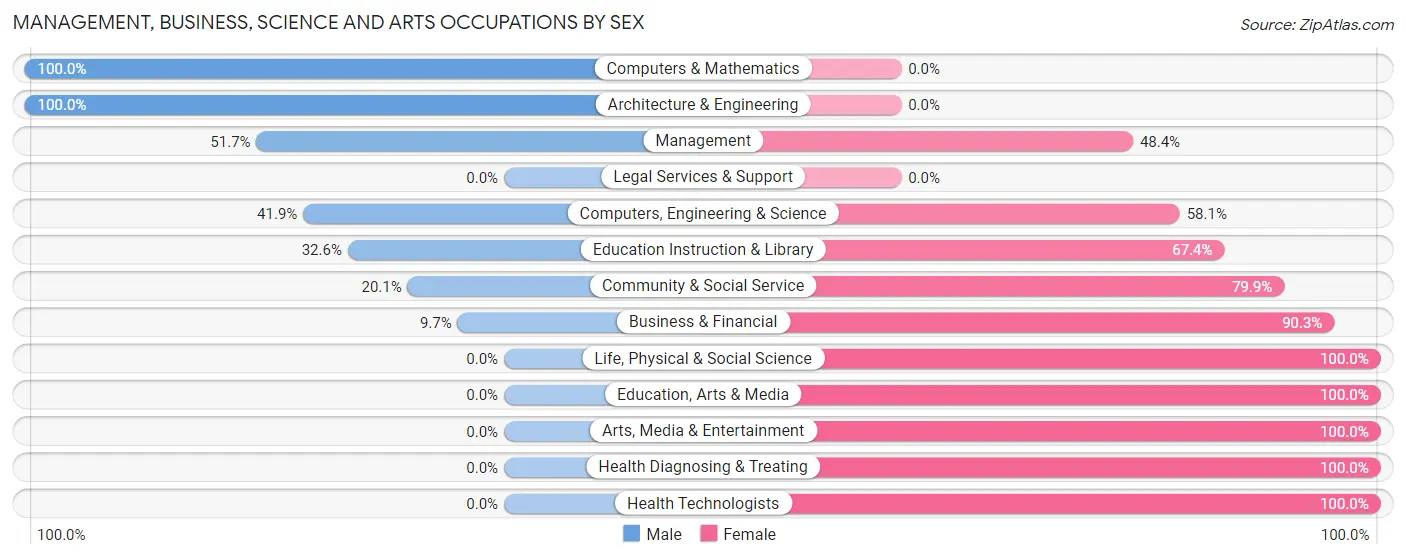
Management, Business, Science and Arts Occupations by Sex
Within the Management, Business, Science and Arts occupations in Herkimer, the most male-oriented occupations are Computers & Mathematics (100.0%), Architecture & Engineering (100.0%), and Management (51.6%), while the most female-oriented occupations are Life, Physical & Social Science (100.0%), Education, Arts & Media (100.0%), and Arts, Media & Entertainment (100.0%).
| Occupation | Male | Female |
| Management | 266 (51.6%) | 249 (48.3%) |
| Business & Financial | 9 (9.7%) | 84 (90.3%) |
| Computers, Engineering & Science | 31 (41.9%) | 43 (58.1%) |
| Computers & Mathematics | 30 (100.0%) | 0 (0.0%) |
| Architecture & Engineering | 1 (100.0%) | 0 (0.0%) |
| Life, Physical & Social Science | 0 (0.0%) | 43 (100.0%) |
| Community & Social Service | 73 (20.1%) | 290 (79.9%) |
| Education, Arts & Media | 0 (0.0%) | 77 (100.0%) |
| Legal Services & Support | 0 (0.0%) | 0 (0.0%) |
| Education Instruction & Library | 73 (32.6%) | 151 (67.4%) |
| Arts, Media & Entertainment | 0 (0.0%) | 62 (100.0%) |
| Health Diagnosing & Treating | 0 (0.0%) | 70 (100.0%) |
| Health Technologists | 0 (0.0%) | 34 (100.0%) |
| Total (Category) | 379 (34.0%) | 736 (66.0%) |
| Total (Overall) | 1,804 (53.6%) | 1,563 (46.4%) |
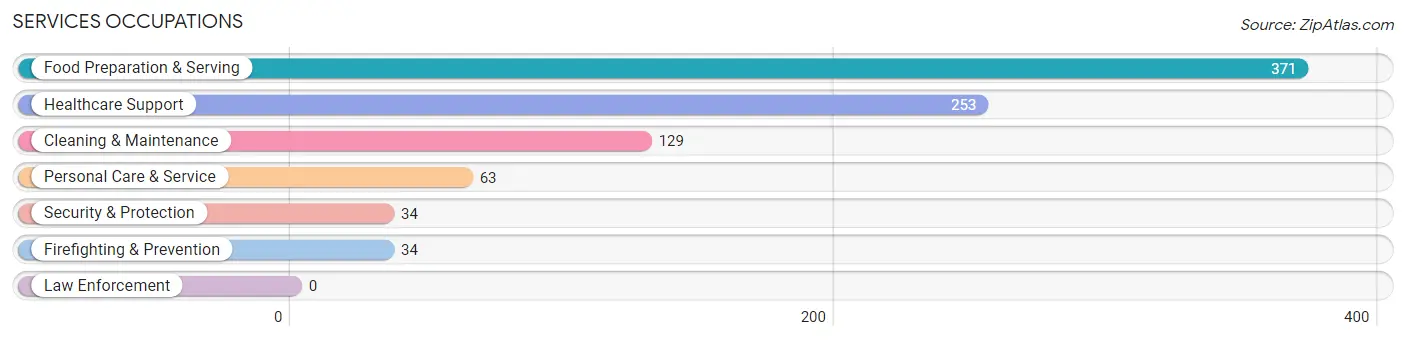
Services Occupations
The most common Services occupations in Herkimer are Food Preparation & Serving (371 | 11.0%), Healthcare Support (253 | 7.5%), Cleaning & Maintenance (129 | 3.8%), Personal Care & Service (63 | 1.9%), and Security & Protection (34 | 1.0%).
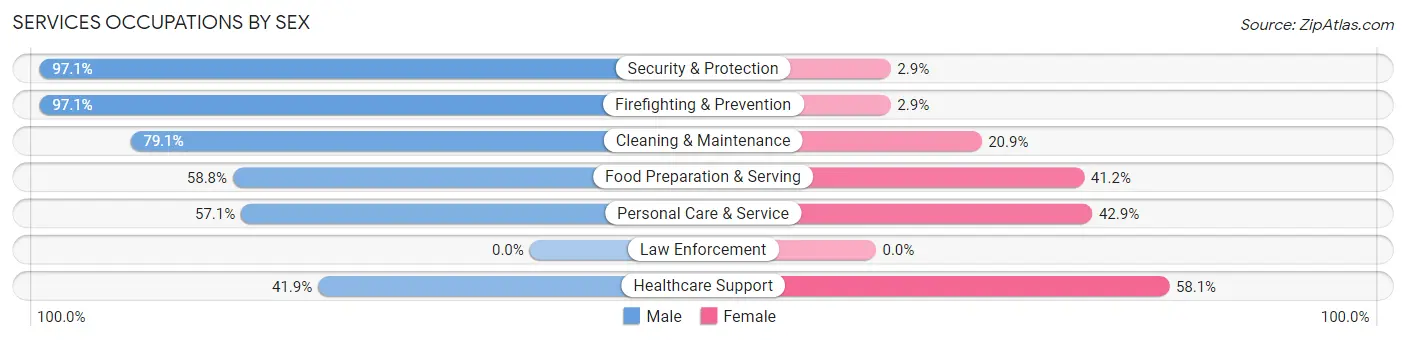
Services Occupations by Sex
Within the Services occupations in Herkimer, the most male-oriented occupations are Security & Protection (97.1%), Firefighting & Prevention (97.1%), and Cleaning & Maintenance (79.1%), while the most female-oriented occupations are Healthcare Support (58.1%), Personal Care & Service (42.9%), and Food Preparation & Serving (41.2%).
| Occupation | Male | Female |
| Healthcare Support | 106 (41.9%) | 147 (58.1%) |
| Security & Protection | 33 (97.1%) | 1 (2.9%) |
| Firefighting & Prevention | 33 (97.1%) | 1 (2.9%) |
| Law Enforcement | 0 (0.0%) | 0 (0.0%) |
| Food Preparation & Serving | 218 (58.8%) | 153 (41.2%) |
| Cleaning & Maintenance | 102 (79.1%) | 27 (20.9%) |
| Personal Care & Service | 36 (57.1%) | 27 (42.9%) |
| Total (Category) | 495 (58.2%) | 355 (41.8%) |
| Total (Overall) | 1,804 (53.6%) | 1,563 (46.4%) |
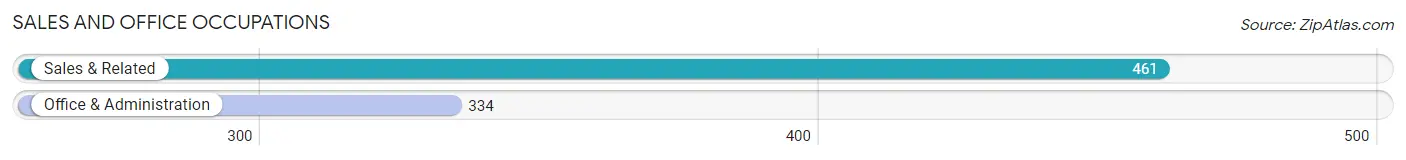
Sales and Office Occupations
The most common Sales and Office occupations in Herkimer are Sales & Related (461 | 13.7%), and Office & Administration (334 | 9.9%).
Sales and Office Occupations by Sex
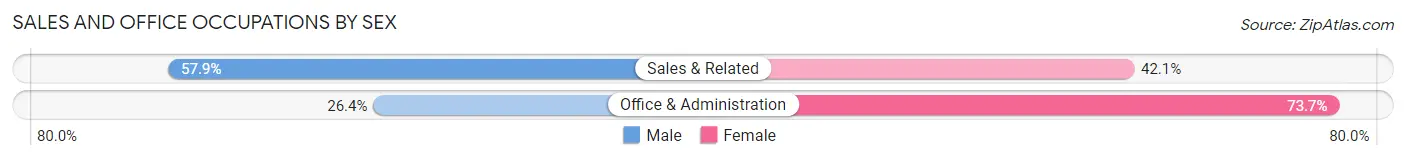
| Occupation | Male | Female |
| Sales & Related | 267 (57.9%) | 194 (42.1%) |
| Office & Administration | 88 (26.4%) | 246 (73.7%) |
| Total (Category) | 355 (44.7%) | 440 (55.3%) |
| Total (Overall) | 1,804 (53.6%) | 1,563 (46.4%) |
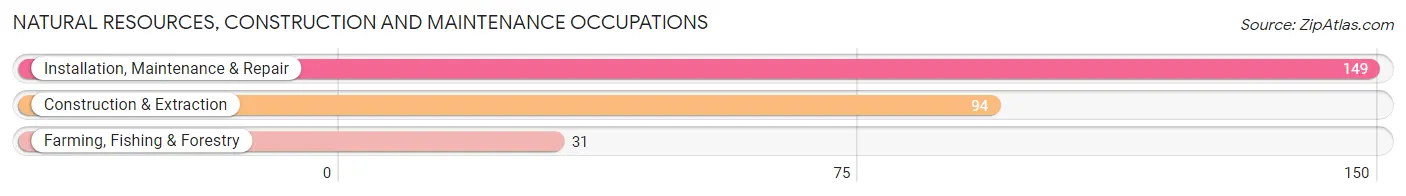
Natural Resources, Construction and Maintenance Occupations
The most common Natural Resources, Construction and Maintenance occupations in Herkimer are Installation, Maintenance & Repair (149 | 4.4%), Construction & Extraction (94 | 2.8%), and Farming, Fishing & Forestry (31 | 0.9%).
Natural Resources, Construction and Maintenance Occupations by Sex
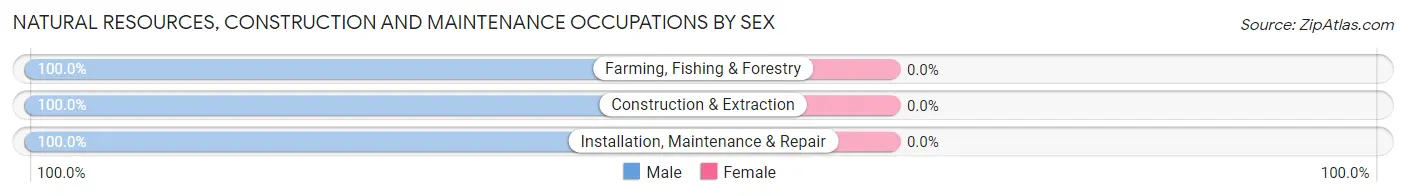
| Occupation | Male | Female |
| Farming, Fishing & Forestry | 31 (100.0%) | 0 (0.0%) |
| Construction & Extraction | 94 (100.0%) | 0 (0.0%) |
| Installation, Maintenance & Repair | 149 (100.0%) | 0 (0.0%) |
| Total (Category) | 274 (100.0%) | 0 (0.0%) |
| Total (Overall) | 1,804 (53.6%) | 1,563 (46.4%) |
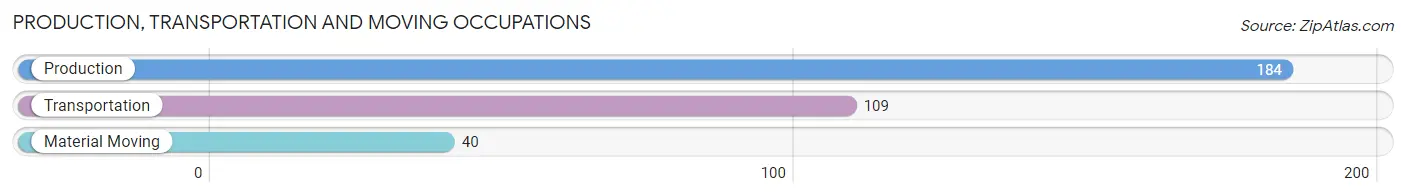
Production, Transportation and Moving Occupations
The most common Production, Transportation and Moving occupations in Herkimer are Production (184 | 5.5%), Transportation (109 | 3.2%), and Material Moving (40 | 1.2%).
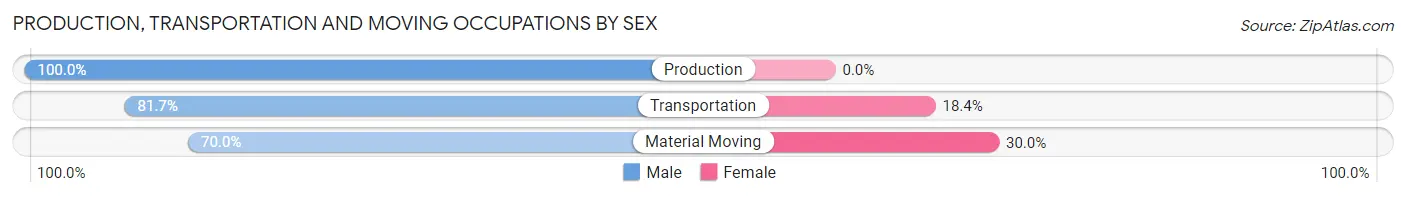
Production, Transportation and Moving Occupations by Sex
| Occupation | Male | Female |
| Production | 184 (100.0%) | 0 (0.0%) |
| Transportation | 89 (81.7%) | 20 (18.3%) |
| Material Moving | 28 (70.0%) | 12 (30.0%) |
| Total (Category) | 301 (90.4%) | 32 (9.6%) |
| Total (Overall) | 1,804 (53.6%) | 1,563 (46.4%) |
Employment Industries by Sex in Herkimer
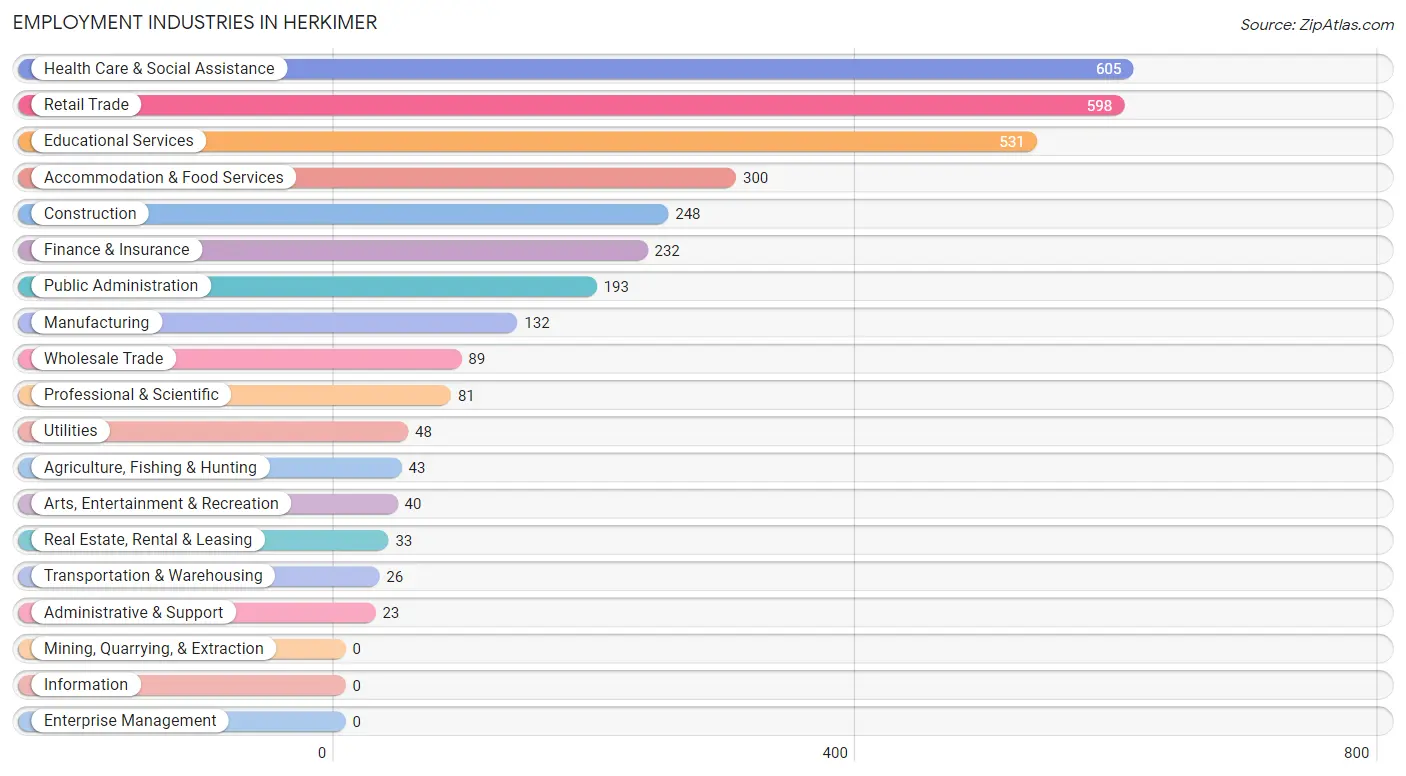
Employment Industries in Herkimer
The major employment industries in Herkimer include Health Care & Social Assistance (605 | 18.0%), Retail Trade (598 | 17.8%), Educational Services (531 | 15.8%), Accommodation & Food Services (300 | 8.9%), and Construction (248 | 7.4%).
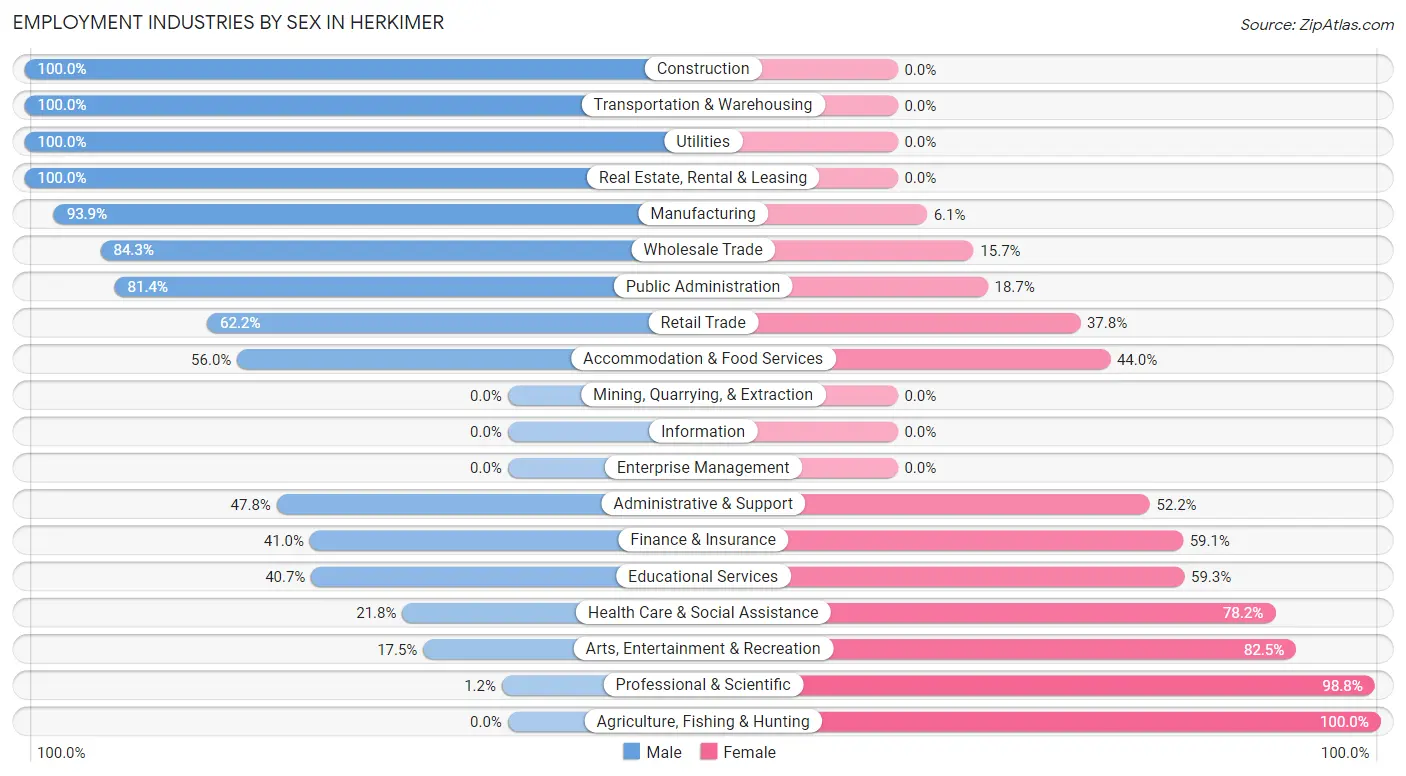
Employment Industries by Sex in Herkimer
The Herkimer industries that see more men than women are Construction (100.0%), Transportation & Warehousing (100.0%), and Utilities (100.0%), whereas the industries that tend to have a higher number of women are Agriculture, Fishing & Hunting (100.0%), Professional & Scientific (98.8%), and Arts, Entertainment & Recreation (82.5%).
| Industry | Male | Female |
| Agriculture, Fishing & Hunting | 0 (0.0%) | 43 (100.0%) |
| Mining, Quarrying, & Extraction | 0 (0.0%) | 0 (0.0%) |
| Construction | 248 (100.0%) | 0 (0.0%) |
| Manufacturing | 124 (93.9%) | 8 (6.1%) |
| Wholesale Trade | 75 (84.3%) | 14 (15.7%) |
| Retail Trade | 372 (62.2%) | 226 (37.8%) |
| Transportation & Warehousing | 26 (100.0%) | 0 (0.0%) |
| Utilities | 48 (100.0%) | 0 (0.0%) |
| Information | 0 (0.0%) | 0 (0.0%) |
| Finance & Insurance | 95 (40.9%) | 137 (59.1%) |
| Real Estate, Rental & Leasing | 33 (100.0%) | 0 (0.0%) |
| Professional & Scientific | 1 (1.2%) | 80 (98.8%) |
| Enterprise Management | 0 (0.0%) | 0 (0.0%) |
| Administrative & Support | 11 (47.8%) | 12 (52.2%) |
| Educational Services | 216 (40.7%) | 315 (59.3%) |
| Health Care & Social Assistance | 132 (21.8%) | 473 (78.2%) |
| Arts, Entertainment & Recreation | 7 (17.5%) | 33 (82.5%) |
| Accommodation & Food Services | 168 (56.0%) | 132 (44.0%) |
| Public Administration | 157 (81.4%) | 36 (18.6%) |
| Total | 1,804 (53.6%) | 1,563 (46.4%) |
Education in Herkimer
School Enrollment in Herkimer
The most common levels of schooling among the 1,253 students in Herkimer are college / undergraduate (486 | 38.8%), elementary school (210 | 16.8%), and high school (204 | 16.3%).
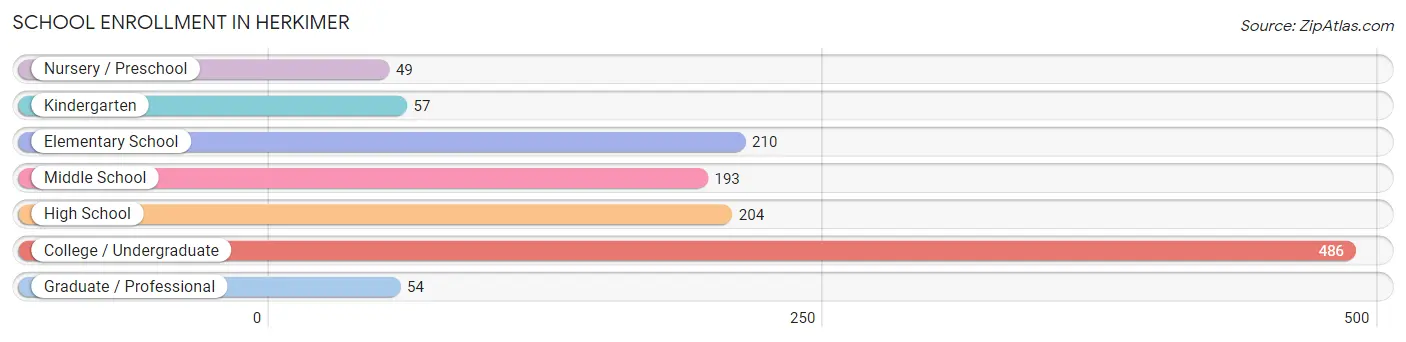
| School Level | # Students | % Students |
| Nursery / Preschool | 49 | 3.9% |
| Kindergarten | 57 | 4.5% |
| Elementary School | 210 | 16.8% |
| Middle School | 193 | 15.4% |
| High School | 204 | 16.3% |
| College / Undergraduate | 486 | 38.8% |
| Graduate / Professional | 54 | 4.3% |
| Total | 1,253 | 100.0% |
School Enrollment by Age by Funding Source in Herkimer
Out of a total of 1,253 students who are enrolled in schools in Herkimer, 288 (23.0%) attend a private institution, while the remaining 965 (77.0%) are enrolled in public schools. The age group of 20 to 24 year olds has the highest likelihood of being enrolled in private schools, with 81 (65.8% in the age bracket) enrolled. Conversely, the age group of 3 to 4 year olds has the lowest likelihood of being enrolled in a private school, with 36 (100.0% in the age bracket) attending a public institution.
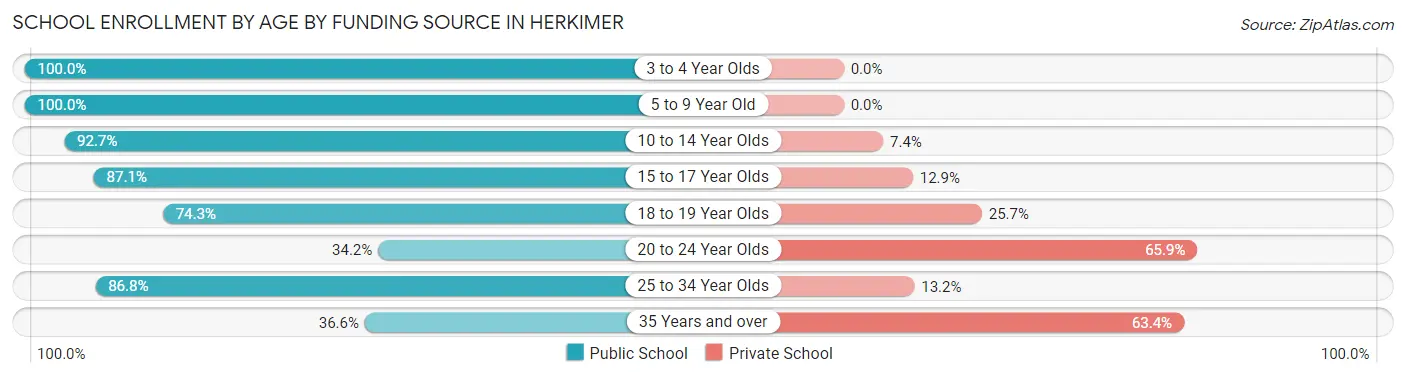
| Age Bracket | Public School | Private School |
| 3 to 4 Year Olds | 36 (100.0%) | 0 (0.0%) |
| 5 to 9 Year Old | 228 (100.0%) | 0 (0.0%) |
| 10 to 14 Year Olds | 227 (92.6%) | 18 (7.3%) |
| 15 to 17 Year Olds | 176 (87.1%) | 26 (12.9%) |
| 18 to 19 Year Olds | 127 (74.3%) | 44 (25.7%) |
| 20 to 24 Year Olds | 42 (34.2%) | 81 (65.8%) |
| 25 to 34 Year Olds | 66 (86.8%) | 10 (13.2%) |
| 35 Years and over | 63 (36.6%) | 109 (63.4%) |
| Total | 965 (77.0%) | 288 (23.0%) |
Educational Attainment by Field of Study in Herkimer
Business (218 | 20.6%), education (186 | 17.6%), literature & languages (158 | 14.9%), bio, nature & agricultural (106 | 10.0%), and science & technology (77 | 7.3%) are the most common fields of study among 1,058 individuals in Herkimer who have obtained a bachelor's degree or higher.
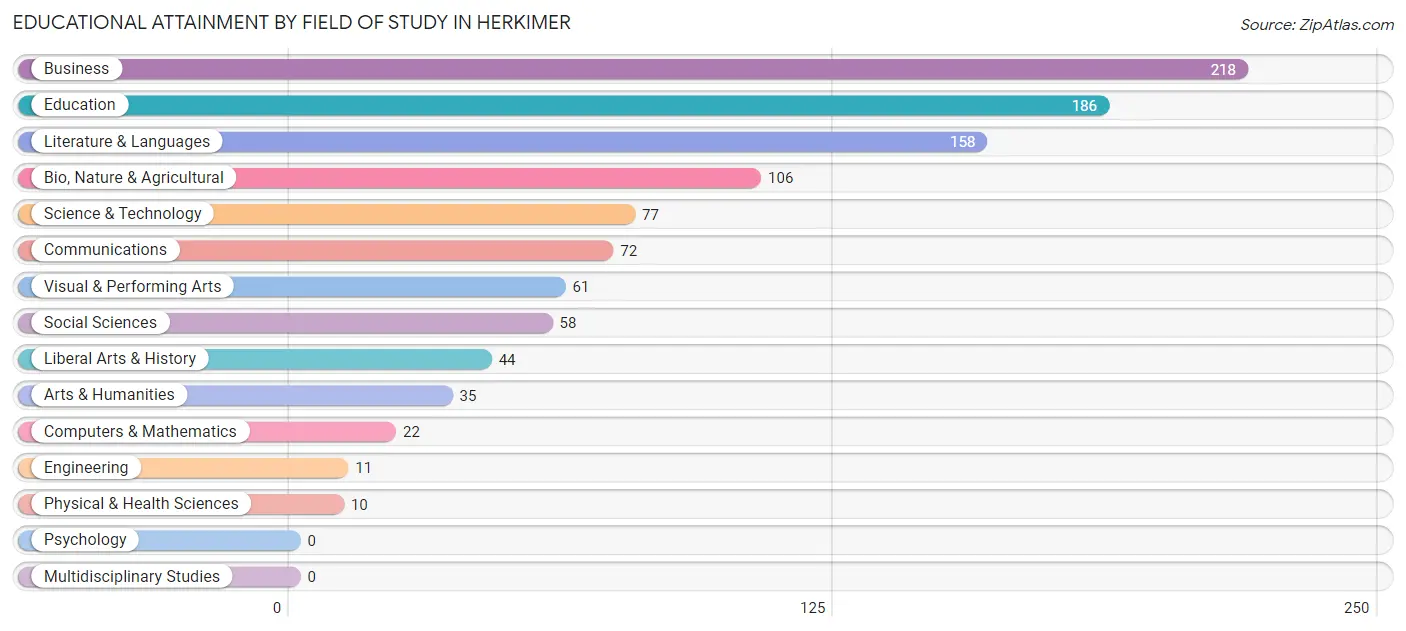
| Field of Study | # Graduates | % Graduates |
| Computers & Mathematics | 22 | 2.1% |
| Bio, Nature & Agricultural | 106 | 10.0% |
| Physical & Health Sciences | 10 | 0.9% |
| Psychology | 0 | 0.0% |
| Social Sciences | 58 | 5.5% |
| Engineering | 11 | 1.0% |
| Multidisciplinary Studies | 0 | 0.0% |
| Science & Technology | 77 | 7.3% |
| Business | 218 | 20.6% |
| Education | 186 | 17.6% |
| Literature & Languages | 158 | 14.9% |
| Liberal Arts & History | 44 | 4.2% |
| Visual & Performing Arts | 61 | 5.8% |
| Communications | 72 | 6.8% |
| Arts & Humanities | 35 | 3.3% |
| Total | 1,058 | 100.0% |
Transportation & Commute in Herkimer
Vehicle Availability by Sex in Herkimer
The most prevalent vehicle ownership categories in Herkimer are males with 2 vehicles (805, accounting for 46.0%) and females with 2 vehicles (601, making up 53.0%).
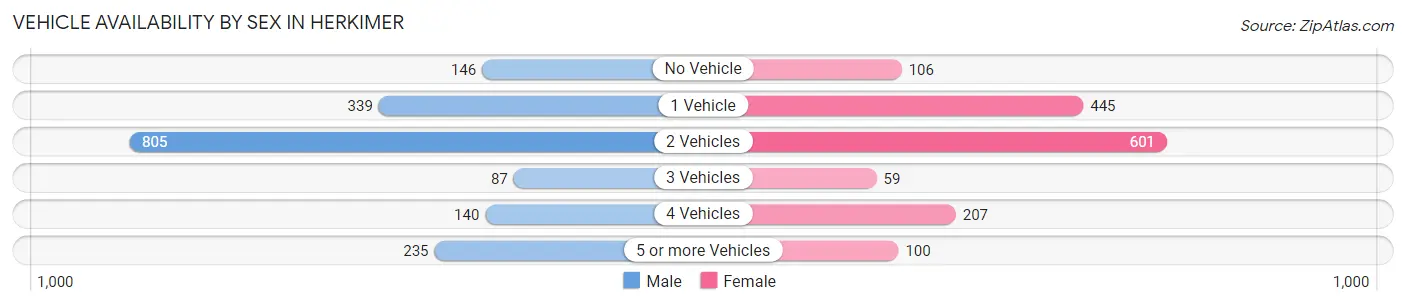
| Vehicles Available | Male | Female |
| No Vehicle | 146 (8.3%) | 106 (7.0%) |
| 1 Vehicle | 339 (19.4%) | 445 (29.3%) |
| 2 Vehicles | 805 (46.0%) | 601 (39.6%) |
| 3 Vehicles | 87 (5.0%) | 59 (3.9%) |
| 4 Vehicles | 140 (8.0%) | 207 (13.6%) |
| 5 or more Vehicles | 235 (13.4%) | 100 (6.6%) |
| Total | 1,752 (100.0%) | 1,518 (100.0%) |
Commute Time in Herkimer
The most frequently occuring commute durations in Herkimer are 5 to 9 minutes (779 commuters, 25.5%), 10 to 14 minutes (371 commuters, 12.1%), and less than 5 minutes (340 commuters, 11.1%).
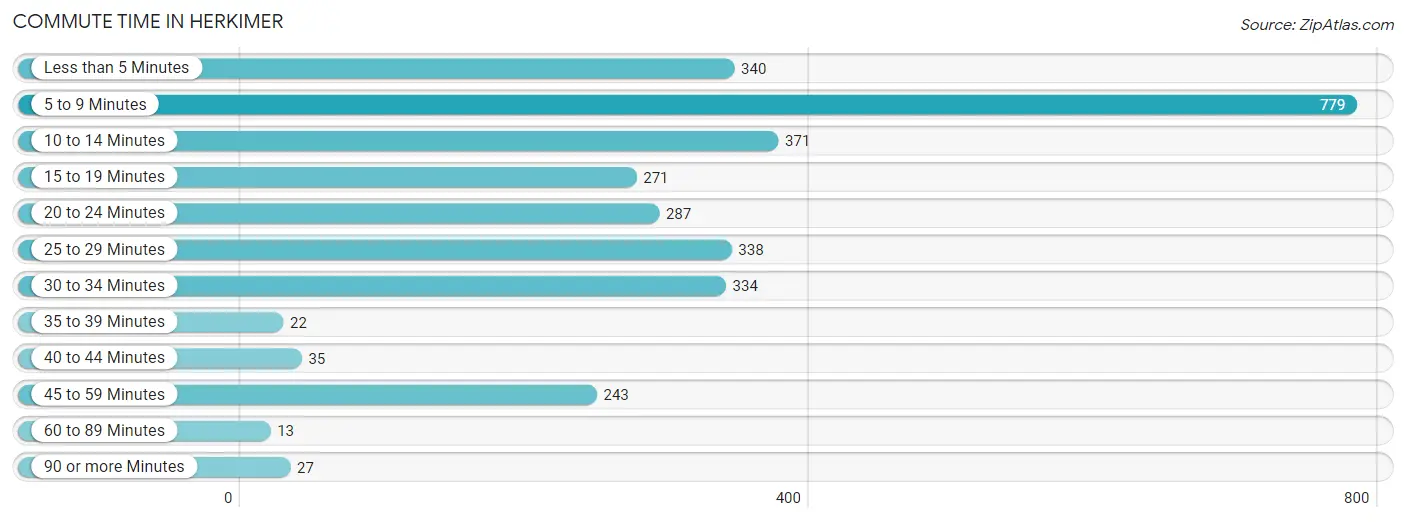
| Commute Time | # Commuters | % Commuters |
| Less than 5 Minutes | 340 | 11.1% |
| 5 to 9 Minutes | 779 | 25.5% |
| 10 to 14 Minutes | 371 | 12.1% |
| 15 to 19 Minutes | 271 | 8.9% |
| 20 to 24 Minutes | 287 | 9.4% |
| 25 to 29 Minutes | 338 | 11.1% |
| 30 to 34 Minutes | 334 | 10.9% |
| 35 to 39 Minutes | 22 | 0.7% |
| 40 to 44 Minutes | 35 | 1.1% |
| 45 to 59 Minutes | 243 | 7.9% |
| 60 to 89 Minutes | 13 | 0.4% |
| 90 or more Minutes | 27 | 0.9% |
Commute Time by Sex in Herkimer
The most common commute times in Herkimer are 5 to 9 minutes (290 commuters, 18.1%) for males and 5 to 9 minutes (489 commuters, 33.5%) for females.
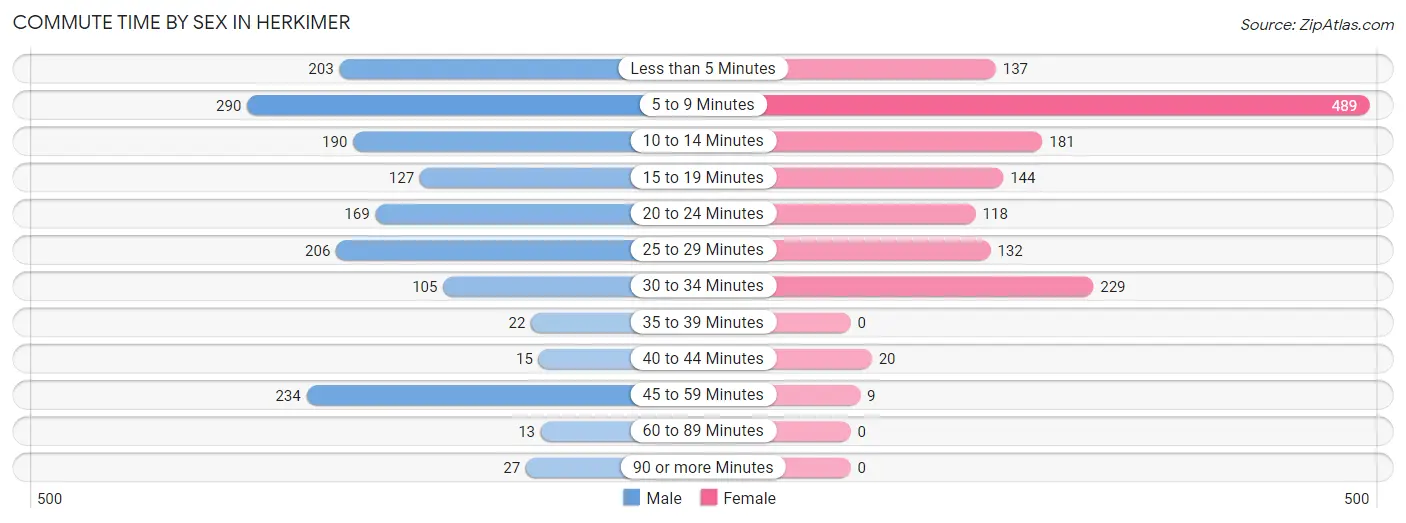
| Commute Time | Male | Female |
| Less than 5 Minutes | 203 (12.7%) | 137 (9.4%) |
| 5 to 9 Minutes | 290 (18.1%) | 489 (33.5%) |
| 10 to 14 Minutes | 190 (11.9%) | 181 (12.4%) |
| 15 to 19 Minutes | 127 (7.9%) | 144 (9.9%) |
| 20 to 24 Minutes | 169 (10.6%) | 118 (8.1%) |
| 25 to 29 Minutes | 206 (12.9%) | 132 (9.0%) |
| 30 to 34 Minutes | 105 (6.6%) | 229 (15.7%) |
| 35 to 39 Minutes | 22 (1.4%) | 0 (0.0%) |
| 40 to 44 Minutes | 15 (0.9%) | 20 (1.4%) |
| 45 to 59 Minutes | 234 (14.6%) | 9 (0.6%) |
| 60 to 89 Minutes | 13 (0.8%) | 0 (0.0%) |
| 90 or more Minutes | 27 (1.7%) | 0 (0.0%) |
Time of Departure to Work by Sex in Herkimer
The most frequent times of departure to work in Herkimer are 4:00 PM to 11:59 PM (220, 13.7%) for males and 7:30 AM to 7:59 AM (381, 26.1%) for females.
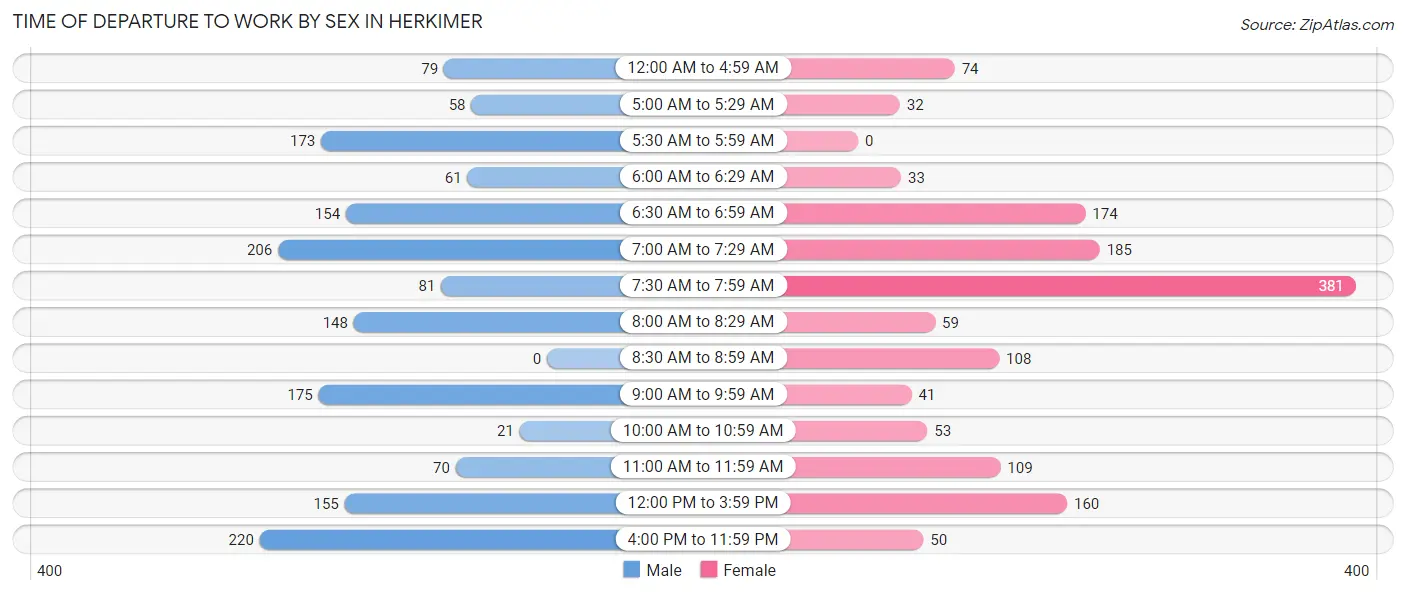
| Time of Departure | Male | Female |
| 12:00 AM to 4:59 AM | 79 (4.9%) | 74 (5.1%) |
| 5:00 AM to 5:29 AM | 58 (3.6%) | 32 (2.2%) |
| 5:30 AM to 5:59 AM | 173 (10.8%) | 0 (0.0%) |
| 6:00 AM to 6:29 AM | 61 (3.8%) | 33 (2.3%) |
| 6:30 AM to 6:59 AM | 154 (9.6%) | 174 (11.9%) |
| 7:00 AM to 7:29 AM | 206 (12.9%) | 185 (12.7%) |
| 7:30 AM to 7:59 AM | 81 (5.1%) | 381 (26.1%) |
| 8:00 AM to 8:29 AM | 148 (9.2%) | 59 (4.0%) |
| 8:30 AM to 8:59 AM | 0 (0.0%) | 108 (7.4%) |
| 9:00 AM to 9:59 AM | 175 (10.9%) | 41 (2.8%) |
| 10:00 AM to 10:59 AM | 21 (1.3%) | 53 (3.6%) |
| 11:00 AM to 11:59 AM | 70 (4.4%) | 109 (7.5%) |
| 12:00 PM to 3:59 PM | 155 (9.7%) | 160 (11.0%) |
| 4:00 PM to 11:59 PM | 220 (13.7%) | 50 (3.4%) |
| Total | 1,601 (100.0%) | 1,459 (100.0%) |
Housing Occupancy in Herkimer
Occupancy by Ownership in Herkimer
Of the total 3,042 dwellings in Herkimer, owner-occupied units account for 1,654 (54.4%), while renter-occupied units make up 1,388 (45.6%).
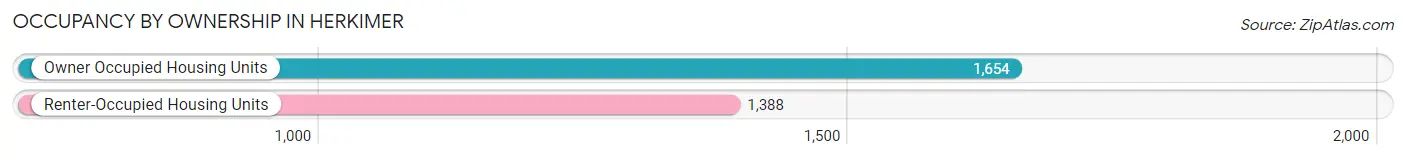
| Occupancy | # Housing Units | % Housing Units |
| Owner Occupied Housing Units | 1,654 | 54.4% |
| Renter-Occupied Housing Units | 1,388 | 45.6% |
| Total Occupied Housing Units | 3,042 | 100.0% |
Occupancy by Household Size in Herkimer
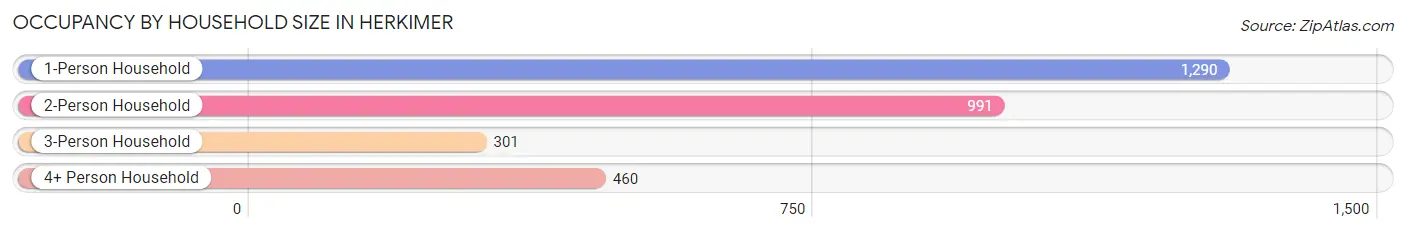
| Household Size | # Housing Units | % Housing Units |
| 1-Person Household | 1,290 | 42.4% |
| 2-Person Household | 991 | 32.6% |
| 3-Person Household | 301 | 9.9% |
| 4+ Person Household | 460 | 15.1% |
| Total Housing Units | 3,042 | 100.0% |
Occupancy by Ownership by Household Size in Herkimer
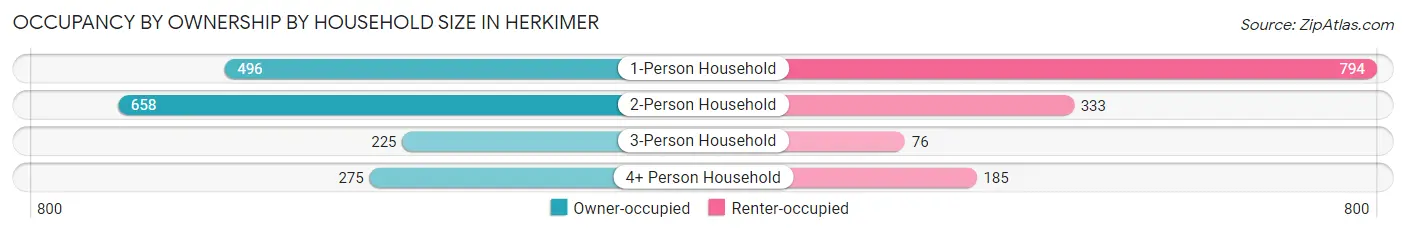
| Household Size | Owner-occupied | Renter-occupied |
| 1-Person Household | 496 (38.5%) | 794 (61.6%) |
| 2-Person Household | 658 (66.4%) | 333 (33.6%) |
| 3-Person Household | 225 (74.8%) | 76 (25.3%) |
| 4+ Person Household | 275 (59.8%) | 185 (40.2%) |
| Total Housing Units | 1,654 (54.4%) | 1,388 (45.6%) |
Occupancy by Educational Attainment in Herkimer
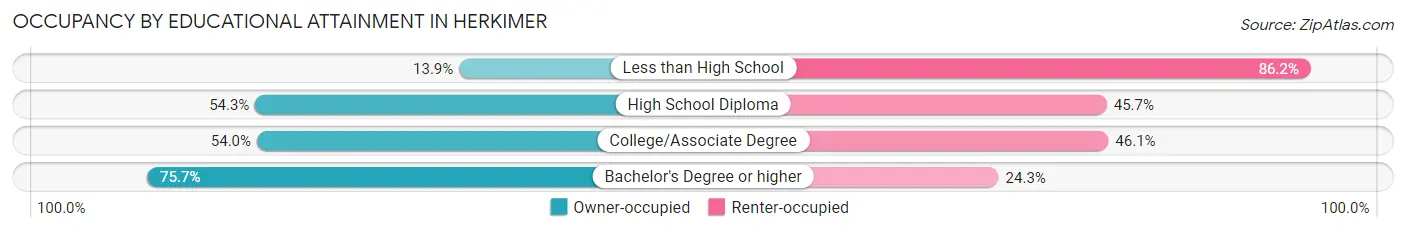
| Household Size | Owner-occupied | Renter-occupied |
| Less than High School | 41 (13.9%) | 255 (86.2%) |
| High School Diploma | 539 (54.3%) | 454 (45.7%) |
| College/Associate Degree | 628 (53.9%) | 536 (46.1%) |
| Bachelor's Degree or higher | 446 (75.7%) | 143 (24.3%) |
Occupancy by Age of Householder in Herkimer
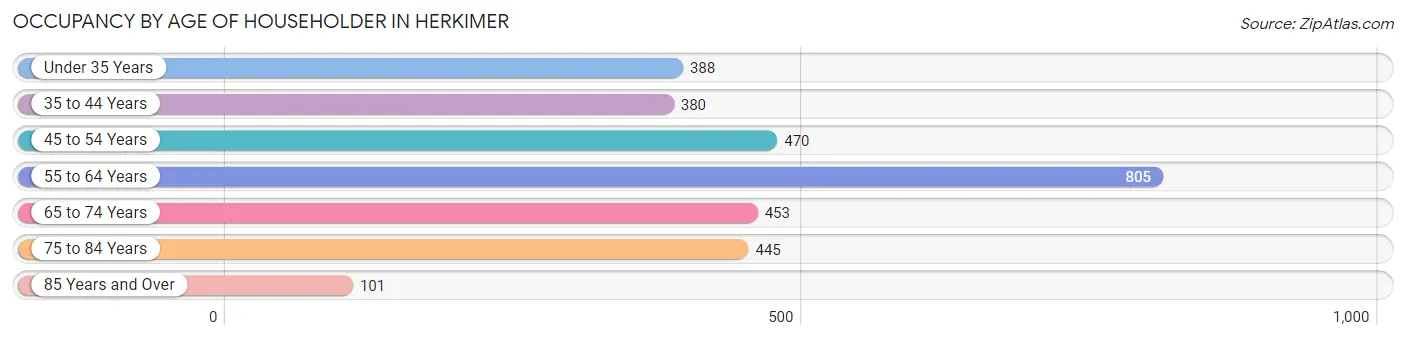
| Age Bracket | # Households | % Households |
| Under 35 Years | 388 | 12.8% |
| 35 to 44 Years | 380 | 12.5% |
| 45 to 54 Years | 470 | 15.4% |
| 55 to 64 Years | 805 | 26.5% |
| 65 to 74 Years | 453 | 14.9% |
| 75 to 84 Years | 445 | 14.6% |
| 85 Years and Over | 101 | 3.3% |
| Total | 3,042 | 100.0% |
Housing Finances in Herkimer
Median Income by Occupancy in Herkimer
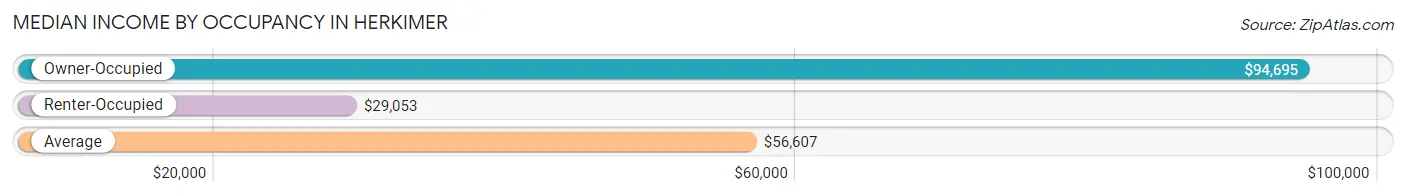
| Occupancy Type | # Households | Median Income |
| Owner-Occupied | 1,654 (54.4%) | $94,695 |
| Renter-Occupied | 1,388 (45.6%) | $29,053 |
| Average | 3,042 (100.0%) | $56,607 |
Occupancy by Householder Income Bracket in Herkimer
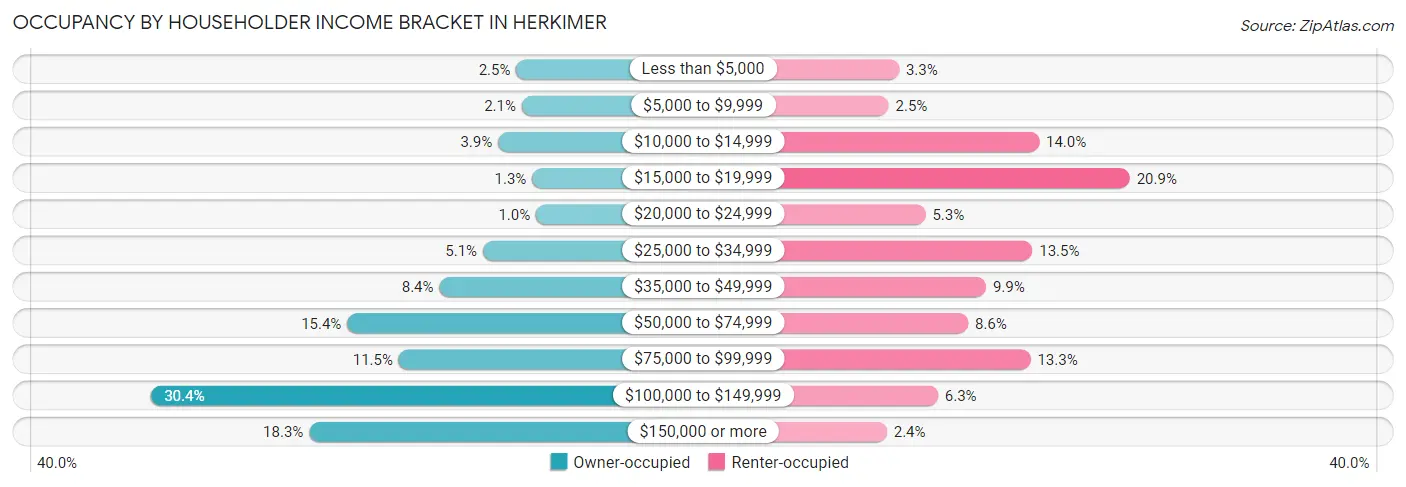
| Income Bracket | Owner-occupied | Renter-occupied |
| Less than $5,000 | 42 (2.5%) | 46 (3.3%) |
| $5,000 to $9,999 | 35 (2.1%) | 35 (2.5%) |
| $10,000 to $14,999 | 65 (3.9%) | 194 (14.0%) |
| $15,000 to $19,999 | 22 (1.3%) | 290 (20.9%) |
| $20,000 to $24,999 | 17 (1.0%) | 74 (5.3%) |
| $25,000 to $34,999 | 84 (5.1%) | 187 (13.5%) |
| $35,000 to $49,999 | 139 (8.4%) | 138 (9.9%) |
| $50,000 to $74,999 | 255 (15.4%) | 119 (8.6%) |
| $75,000 to $99,999 | 190 (11.5%) | 185 (13.3%) |
| $100,000 to $149,999 | 502 (30.3%) | 87 (6.3%) |
| $150,000 or more | 303 (18.3%) | 33 (2.4%) |
| Total | 1,654 (100.0%) | 1,388 (100.0%) |
Monthly Housing Cost Tiers in Herkimer
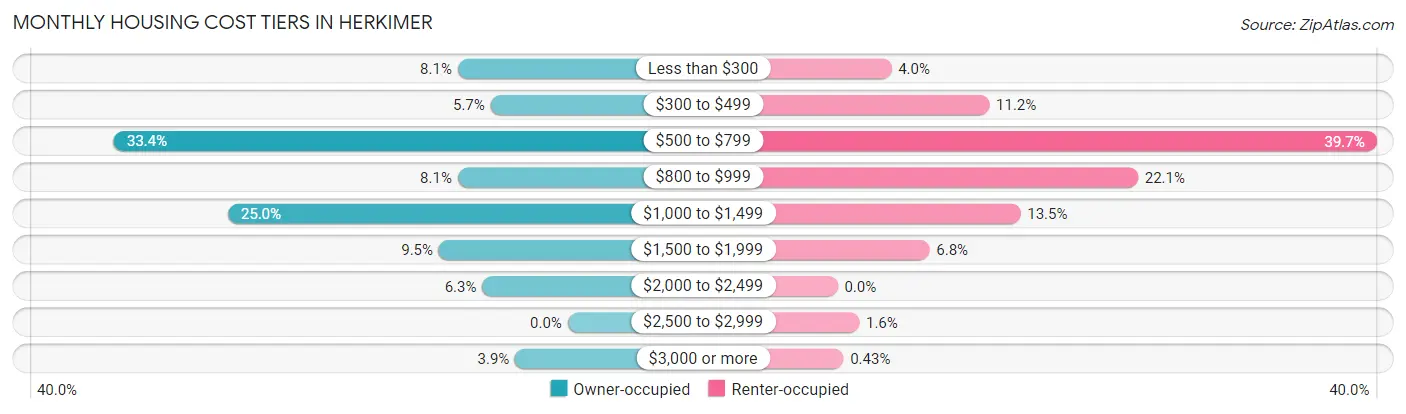
| Monthly Cost | Owner-occupied | Renter-occupied |
| Less than $300 | 134 (8.1%) | 55 (4.0%) |
| $300 to $499 | 94 (5.7%) | 155 (11.2%) |
| $500 to $799 | 553 (33.4%) | 551 (39.7%) |
| $800 to $999 | 134 (8.1%) | 307 (22.1%) |
| $1,000 to $1,499 | 414 (25.0%) | 187 (13.5%) |
| $1,500 to $1,999 | 157 (9.5%) | 94 (6.8%) |
| $2,000 to $2,499 | 104 (6.3%) | 0 (0.0%) |
| $2,500 to $2,999 | 0 (0.0%) | 22 (1.6%) |
| $3,000 or more | 64 (3.9%) | 6 (0.4%) |
| Total | 1,654 (100.0%) | 1,388 (100.0%) |
Physical Housing Characteristics in Herkimer
Housing Structures in Herkimer
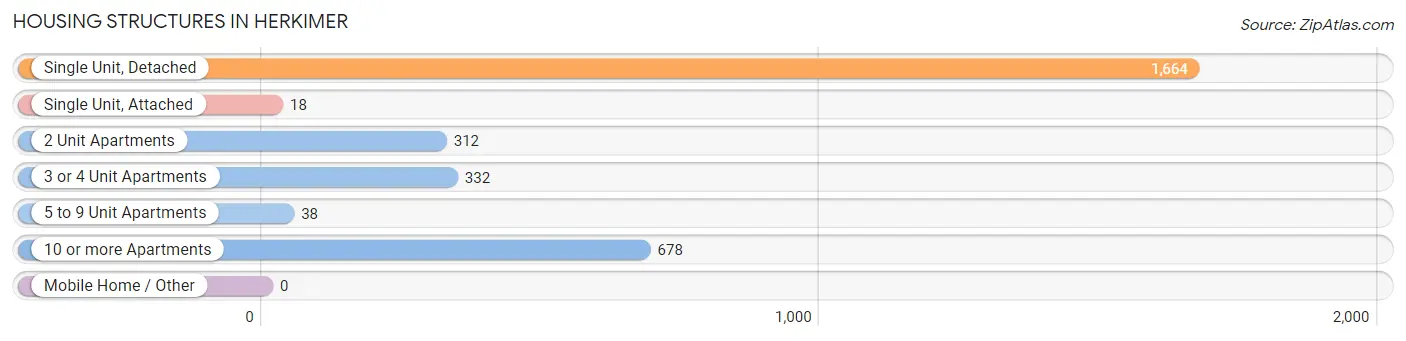
| Structure Type | # Housing Units | % Housing Units |
| Single Unit, Detached | 1,664 | 54.7% |
| Single Unit, Attached | 18 | 0.6% |
| 2 Unit Apartments | 312 | 10.3% |
| 3 or 4 Unit Apartments | 332 | 10.9% |
| 5 to 9 Unit Apartments | 38 | 1.3% |
| 10 or more Apartments | 678 | 22.3% |
| Mobile Home / Other | 0 | 0.0% |
| Total | 3,042 | 100.0% |
Housing Structures by Occupancy in Herkimer
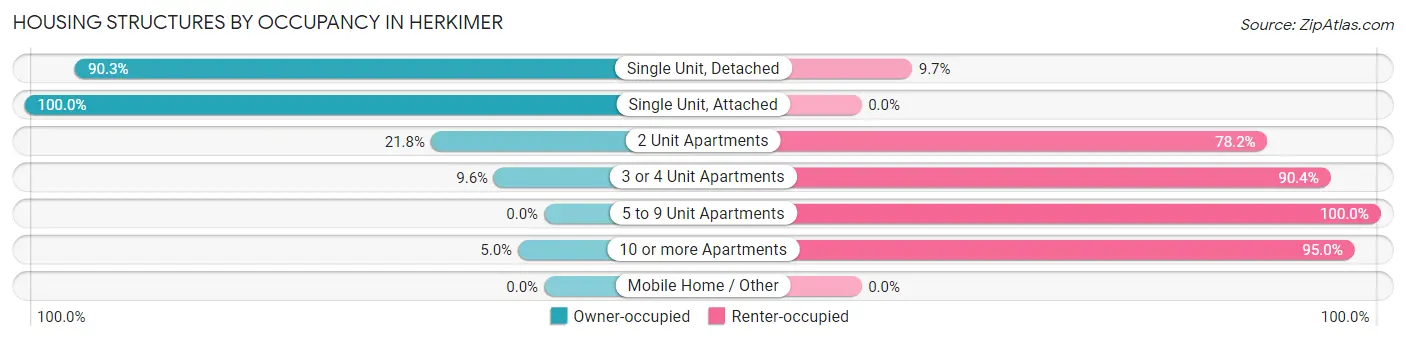
| Structure Type | Owner-occupied | Renter-occupied |
| Single Unit, Detached | 1,502 (90.3%) | 162 (9.7%) |
| Single Unit, Attached | 18 (100.0%) | 0 (0.0%) |
| 2 Unit Apartments | 68 (21.8%) | 244 (78.2%) |
| 3 or 4 Unit Apartments | 32 (9.6%) | 300 (90.4%) |
| 5 to 9 Unit Apartments | 0 (0.0%) | 38 (100.0%) |
| 10 or more Apartments | 34 (5.0%) | 644 (95.0%) |
| Mobile Home / Other | 0 (0.0%) | 0 (0.0%) |
| Total | 1,654 (54.4%) | 1,388 (45.6%) |
Housing Structures by Number of Rooms in Herkimer
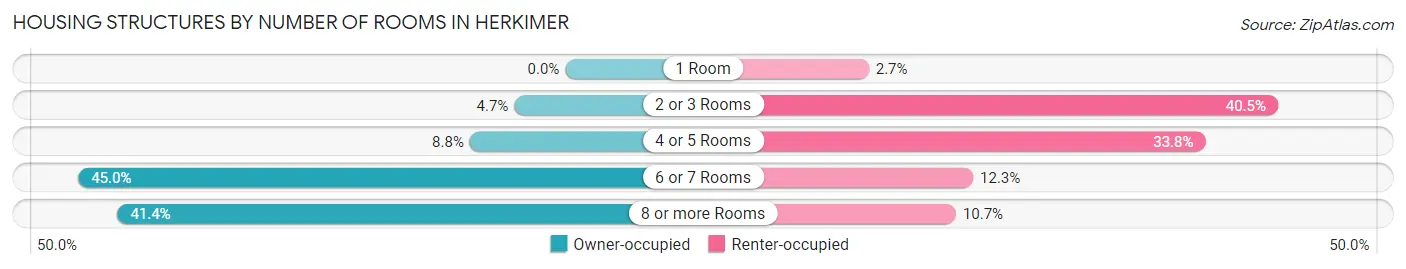
| Number of Rooms | Owner-occupied | Renter-occupied |
| 1 Room | 0 (0.0%) | 37 (2.7%) |
| 2 or 3 Rooms | 78 (4.7%) | 562 (40.5%) |
| 4 or 5 Rooms | 146 (8.8%) | 469 (33.8%) |
| 6 or 7 Rooms | 745 (45.0%) | 171 (12.3%) |
| 8 or more Rooms | 685 (41.4%) | 149 (10.7%) |
| Total | 1,654 (100.0%) | 1,388 (100.0%) |
Housing Structure by Heating Type in Herkimer
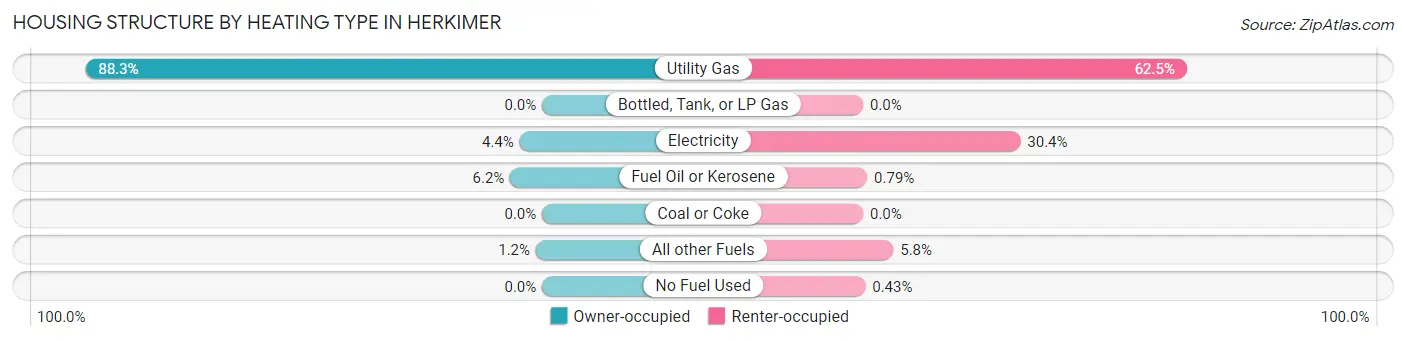
| Heating Type | Owner-occupied | Renter-occupied |
| Utility Gas | 1,460 (88.3%) | 868 (62.5%) |
| Bottled, Tank, or LP Gas | 0 (0.0%) | 0 (0.0%) |
| Electricity | 72 (4.3%) | 422 (30.4%) |
| Fuel Oil or Kerosene | 102 (6.2%) | 11 (0.8%) |
| Coal or Coke | 0 (0.0%) | 0 (0.0%) |
| All other Fuels | 20 (1.2%) | 81 (5.8%) |
| No Fuel Used | 0 (0.0%) | 6 (0.4%) |
| Total | 1,654 (100.0%) | 1,388 (100.0%) |
Household Vehicle Usage in Herkimer
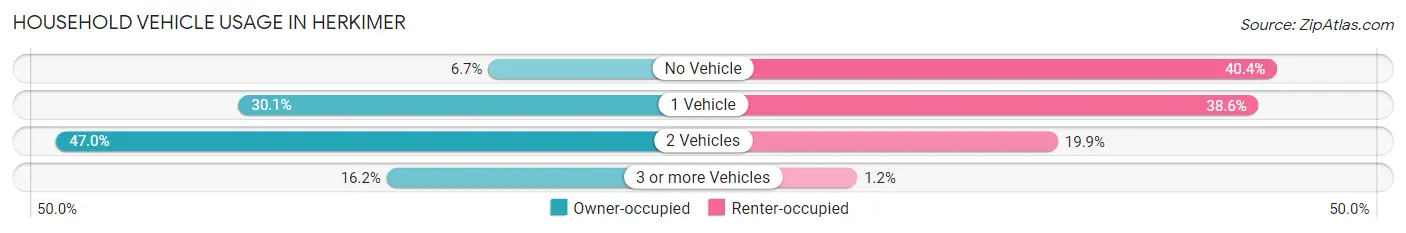
| Vehicles per Household | Owner-occupied | Renter-occupied |
| No Vehicle | 111 (6.7%) | 560 (40.4%) |
| 1 Vehicle | 497 (30.0%) | 536 (38.6%) |
| 2 Vehicles | 778 (47.0%) | 276 (19.9%) |
| 3 or more Vehicles | 268 (16.2%) | 16 (1.1%) |
| Total | 1,654 (100.0%) | 1,388 (100.0%) |
Real Estate & Mortgages in Herkimer
Real Estate and Mortgage Overview in Herkimer
| Characteristic | Without Mortgage | With Mortgage |
| Housing Units | 817 | 837 |
| Median Property Value | $92,400 | $114,600 |
| Median Household Income | $90,850 | $188 |
| Monthly Housing Costs | $594 | $64 |
| Real Estate Taxes | $3,238 | $27 |
Property Value by Mortgage Status in Herkimer
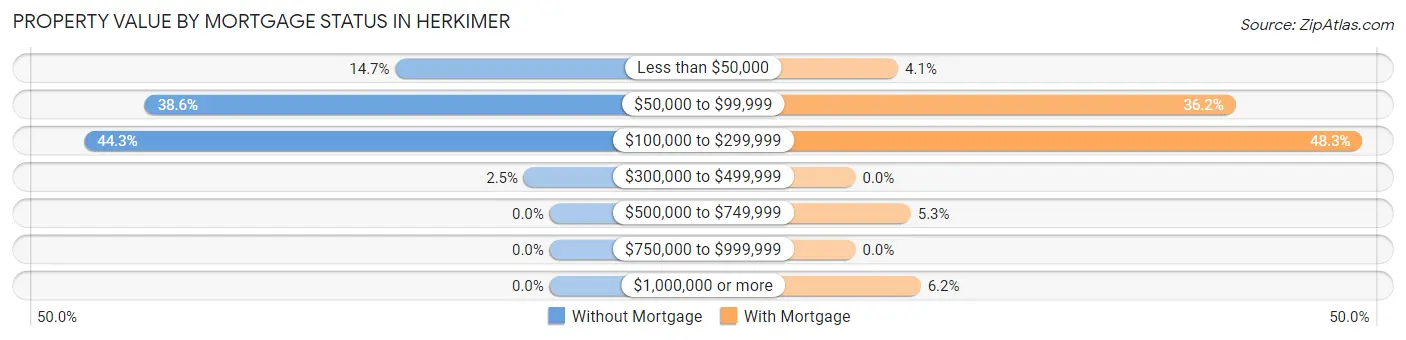
| Property Value | Without Mortgage | With Mortgage |
| Less than $50,000 | 120 (14.7%) | 34 (4.1%) |
| $50,000 to $99,999 | 315 (38.6%) | 303 (36.2%) |
| $100,000 to $299,999 | 362 (44.3%) | 404 (48.3%) |
| $300,000 to $499,999 | 20 (2.5%) | 0 (0.0%) |
| $500,000 to $749,999 | 0 (0.0%) | 44 (5.3%) |
| $750,000 to $999,999 | 0 (0.0%) | 0 (0.0%) |
| $1,000,000 or more | 0 (0.0%) | 52 (6.2%) |
| Total | 817 (100.0%) | 837 (100.0%) |
Household Income by Mortgage Status in Herkimer
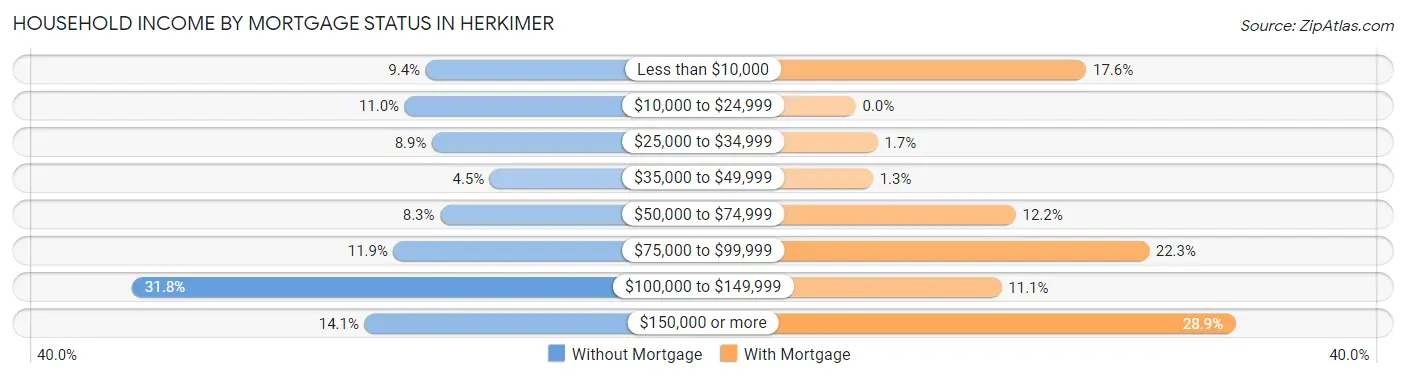
| Household Income | Without Mortgage | With Mortgage |
| Less than $10,000 | 77 (9.4%) | 147 (17.6%) |
| $10,000 to $24,999 | 90 (11.0%) | 0 (0.0%) |
| $25,000 to $34,999 | 73 (8.9%) | 14 (1.7%) |
| $35,000 to $49,999 | 37 (4.5%) | 11 (1.3%) |
| $50,000 to $74,999 | 68 (8.3%) | 102 (12.2%) |
| $75,000 to $99,999 | 97 (11.9%) | 187 (22.3%) |
| $100,000 to $149,999 | 260 (31.8%) | 93 (11.1%) |
| $150,000 or more | 115 (14.1%) | 242 (28.9%) |
| Total | 817 (100.0%) | 837 (100.0%) |
Property Value to Household Income Ratio in Herkimer
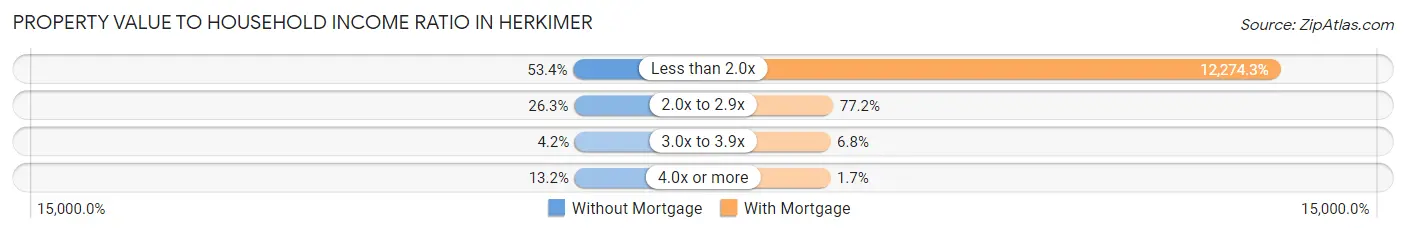
| Value-to-Income Ratio | Without Mortgage | With Mortgage |
| Less than 2.0x | 436 (53.4%) | 102,736 (12,274.3%) |
| 2.0x to 2.9x | 215 (26.3%) | 646 (77.2%) |
| 3.0x to 3.9x | 34 (4.2%) | 57 (6.8%) |
| 4.0x or more | 108 (13.2%) | 14 (1.7%) |
| Total | 817 (100.0%) | 837 (100.0%) |
Real Estate Taxes by Mortgage Status in Herkimer
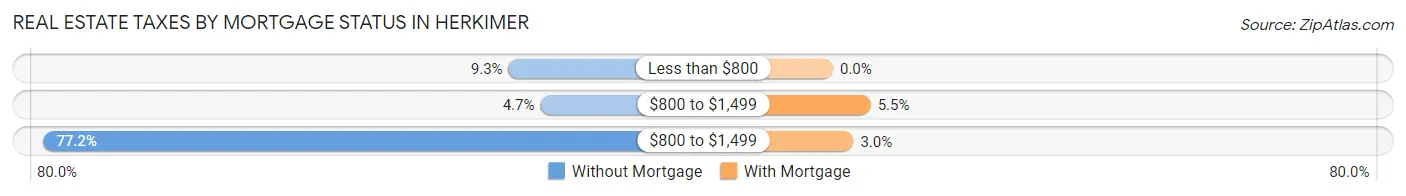
| Property Taxes | Without Mortgage | With Mortgage |
| Less than $800 | 76 (9.3%) | 0 (0.0%) |
| $800 to $1,499 | 38 (4.6%) | 46 (5.5%) |
| $800 to $1,499 | 631 (77.2%) | 25 (3.0%) |
| Total | 817 (100.0%) | 837 (100.0%) |
Health & Disability in Herkimer
Health Insurance Coverage by Age in Herkimer
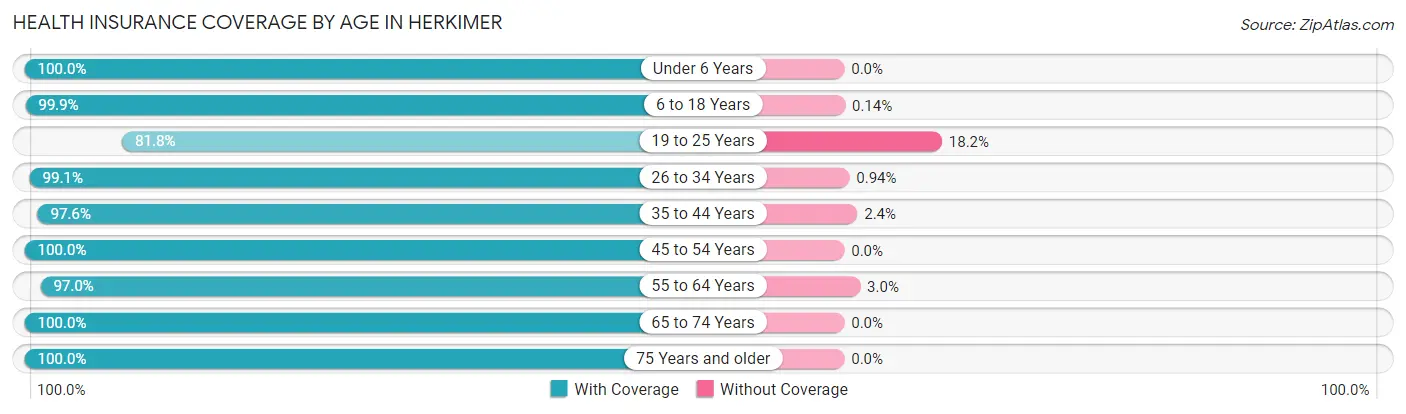
| Age Bracket | With Coverage | Without Coverage |
| Under 6 Years | 216 (100.0%) | 0 (0.0%) |
| 6 to 18 Years | 733 (99.9%) | 1 (0.1%) |
| 19 to 25 Years | 656 (81.8%) | 146 (18.2%) |
| 26 to 34 Years | 629 (99.1%) | 6 (0.9%) |
| 35 to 44 Years | 685 (97.6%) | 17 (2.4%) |
| 45 to 54 Years | 909 (100.0%) | 0 (0.0%) |
| 55 to 64 Years | 1,080 (97.0%) | 33 (3.0%) |
| 65 to 74 Years | 760 (100.0%) | 0 (0.0%) |
| 75 Years and older | 666 (100.0%) | 0 (0.0%) |
| Total | 6,334 (96.9%) | 203 (3.1%) |
Health Insurance Coverage by Citizenship Status in Herkimer
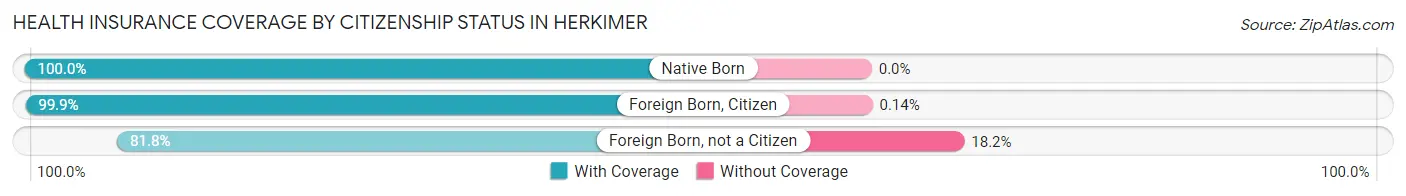
| Citizenship Status | With Coverage | Without Coverage |
| Native Born | 216 (100.0%) | 0 (0.0%) |
| Foreign Born, Citizen | 733 (99.9%) | 1 (0.1%) |
| Foreign Born, not a Citizen | 656 (81.8%) | 146 (18.2%) |
Health Insurance Coverage by Household Income in Herkimer
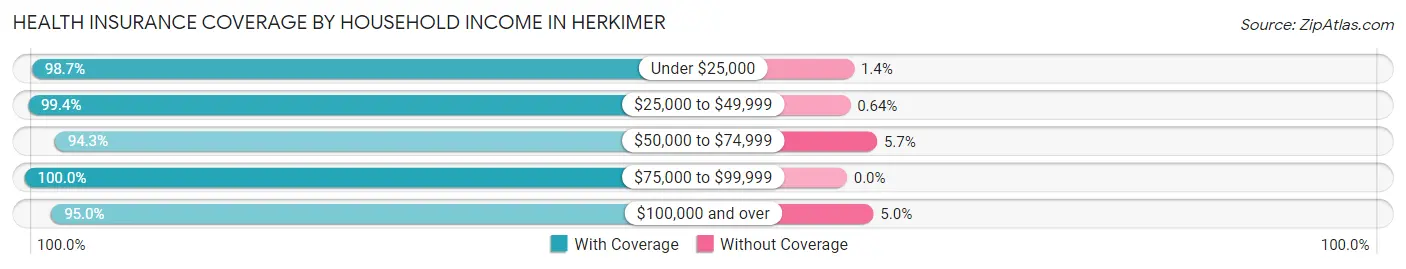
| Household Income | With Coverage | Without Coverage |
| Under $25,000 | 1,025 (98.7%) | 14 (1.3%) |
| $25,000 to $49,999 | 933 (99.4%) | 6 (0.6%) |
| $50,000 to $74,999 | 700 (94.3%) | 42 (5.7%) |
| $75,000 to $99,999 | 871 (100.0%) | 0 (0.0%) |
| $100,000 and over | 2,515 (95.0%) | 132 (5.0%) |
Public vs Private Health Insurance Coverage by Age in Herkimer
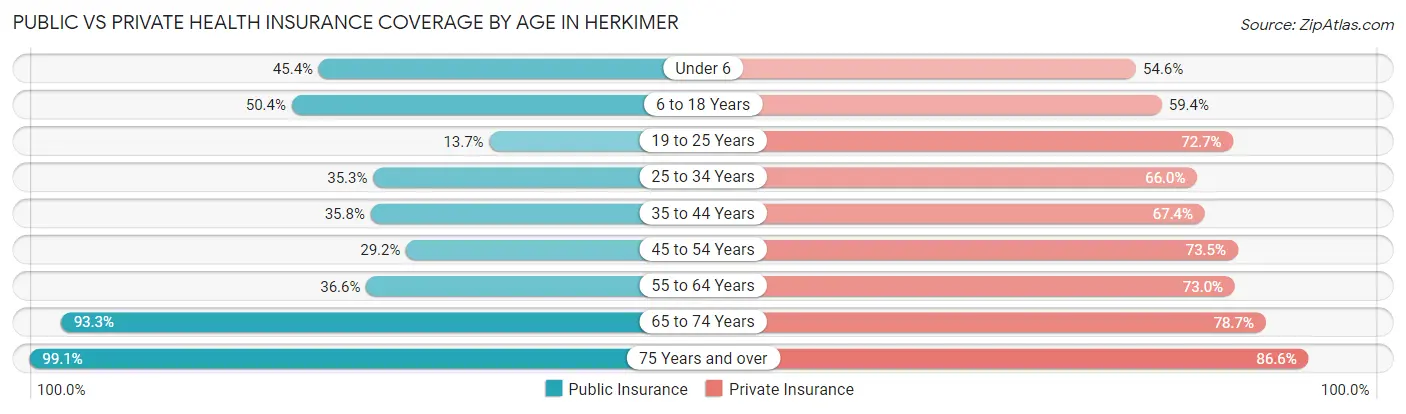
| Age Bracket | Public Insurance | Private Insurance |
| Under 6 | 98 (45.4%) | 118 (54.6%) |
| 6 to 18 Years | 370 (50.4%) | 436 (59.4%) |
| 19 to 25 Years | 110 (13.7%) | 583 (72.7%) |
| 25 to 34 Years | 224 (35.3%) | 419 (66.0%) |
| 35 to 44 Years | 251 (35.7%) | 473 (67.4%) |
| 45 to 54 Years | 265 (29.1%) | 668 (73.5%) |
| 55 to 64 Years | 407 (36.6%) | 812 (73.0%) |
| 65 to 74 Years | 709 (93.3%) | 598 (78.7%) |
| 75 Years and over | 660 (99.1%) | 577 (86.6%) |
| Total | 3,094 (47.3%) | 4,684 (71.7%) |
Disability Status by Sex by Age in Herkimer
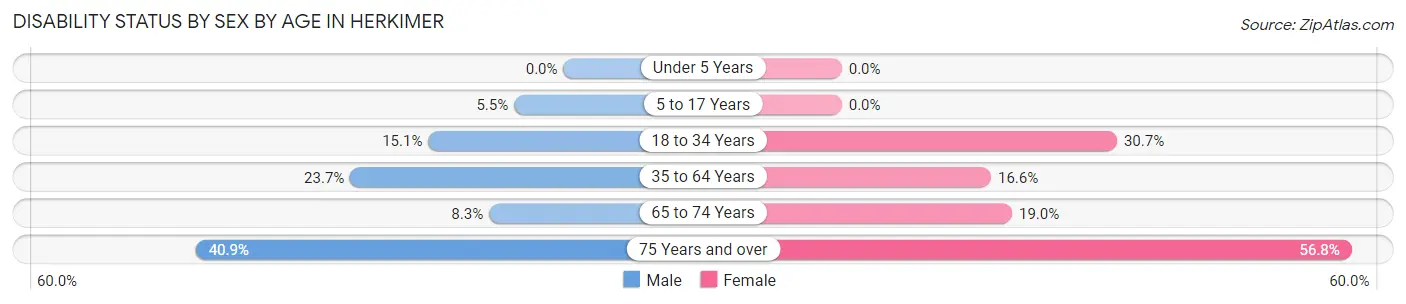
| Age Bracket | Male | Female |
| Under 5 Years | 0 (0.0%) | 0 (0.0%) |
| 5 to 17 Years | 18 (5.5%) | 0 (0.0%) |
| 18 to 34 Years | 121 (15.0%) | 232 (30.6%) |
| 35 to 64 Years | 338 (23.7%) | 216 (16.6%) |
| 65 to 74 Years | 28 (8.3%) | 80 (19.0%) |
| 75 Years and over | 52 (40.9%) | 306 (56.8%) |
Disability Class by Sex by Age in Herkimer
Disability Class: Hearing Difficulty
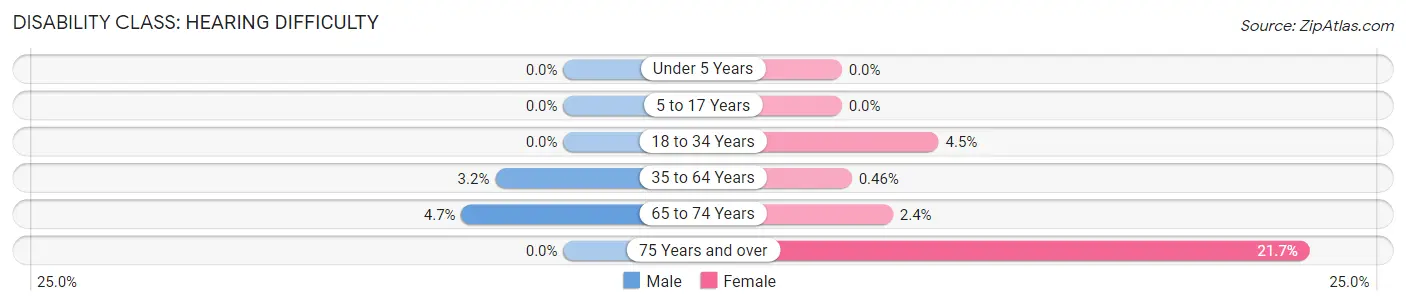
| Age Bracket | Male | Female |
| Under 5 Years | 0 (0.0%) | 0 (0.0%) |
| 5 to 17 Years | 0 (0.0%) | 0 (0.0%) |
| 18 to 34 Years | 0 (0.0%) | 34 (4.5%) |
| 35 to 64 Years | 45 (3.2%) | 6 (0.5%) |
| 65 to 74 Years | 16 (4.7%) | 10 (2.4%) |
| 75 Years and over | 0 (0.0%) | 117 (21.7%) |
Disability Class: Vision Difficulty
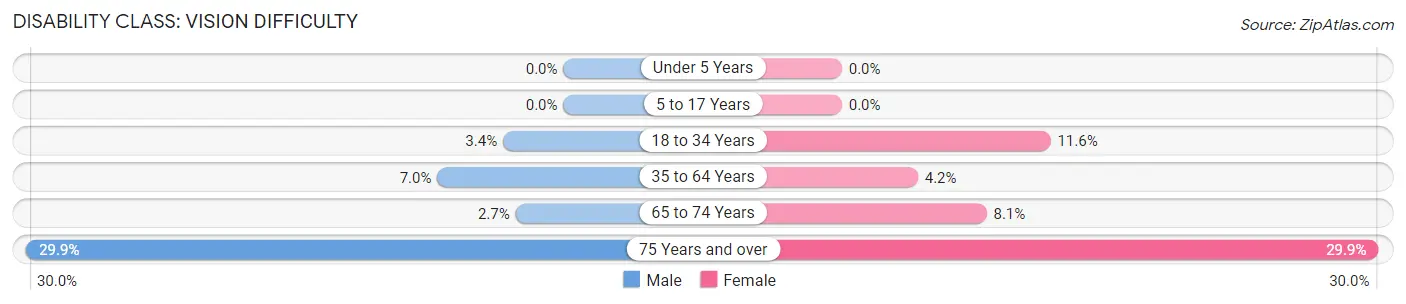
| Age Bracket | Male | Female |
| Under 5 Years | 0 (0.0%) | 0 (0.0%) |
| 5 to 17 Years | 0 (0.0%) | 0 (0.0%) |
| 18 to 34 Years | 27 (3.4%) | 88 (11.6%) |
| 35 to 64 Years | 100 (7.0%) | 55 (4.2%) |
| 65 to 74 Years | 9 (2.7%) | 34 (8.1%) |
| 75 Years and over | 38 (29.9%) | 161 (29.9%) |
Disability Class: Cognitive Difficulty
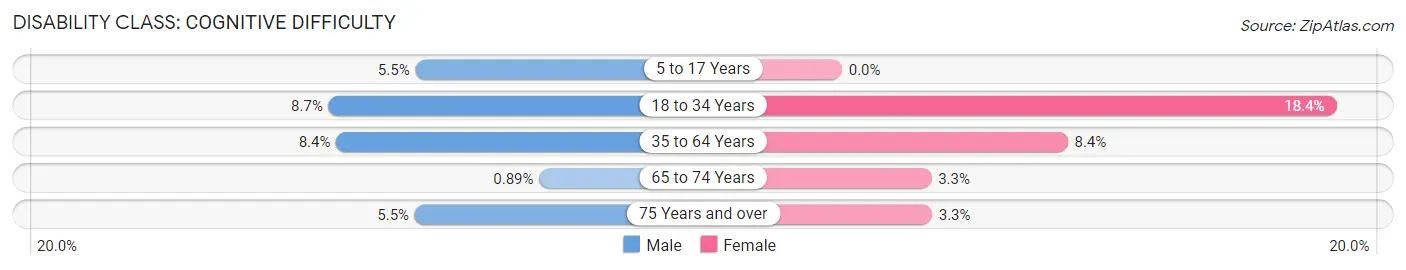
| Age Bracket | Male | Female |
| 5 to 17 Years | 18 (5.5%) | 0 (0.0%) |
| 18 to 34 Years | 70 (8.7%) | 139 (18.4%) |
| 35 to 64 Years | 120 (8.4%) | 109 (8.4%) |
| 65 to 74 Years | 3 (0.9%) | 14 (3.3%) |
| 75 Years and over | 7 (5.5%) | 18 (3.3%) |
Disability Class: Ambulatory Difficulty
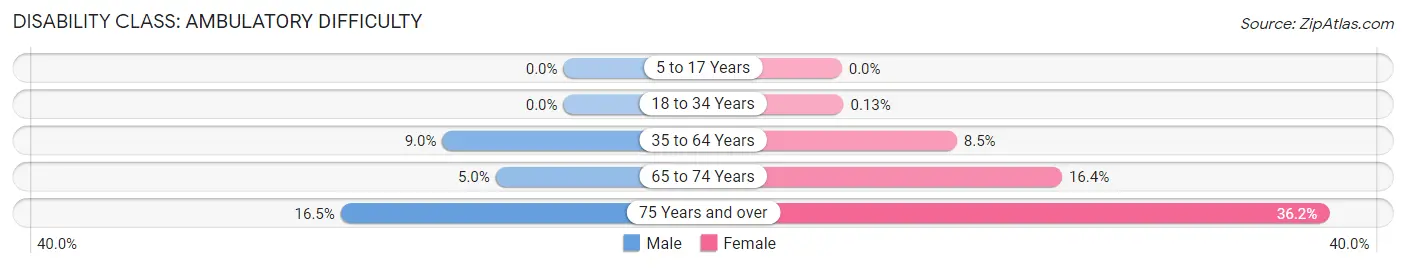
| Age Bracket | Male | Female |
| 5 to 17 Years | 0 (0.0%) | 0 (0.0%) |
| 18 to 34 Years | 0 (0.0%) | 1 (0.1%) |
| 35 to 64 Years | 128 (9.0%) | 111 (8.5%) |
| 65 to 74 Years | 17 (5.0%) | 69 (16.4%) |
| 75 Years and over | 21 (16.5%) | 195 (36.2%) |
Disability Class: Self-Care Difficulty
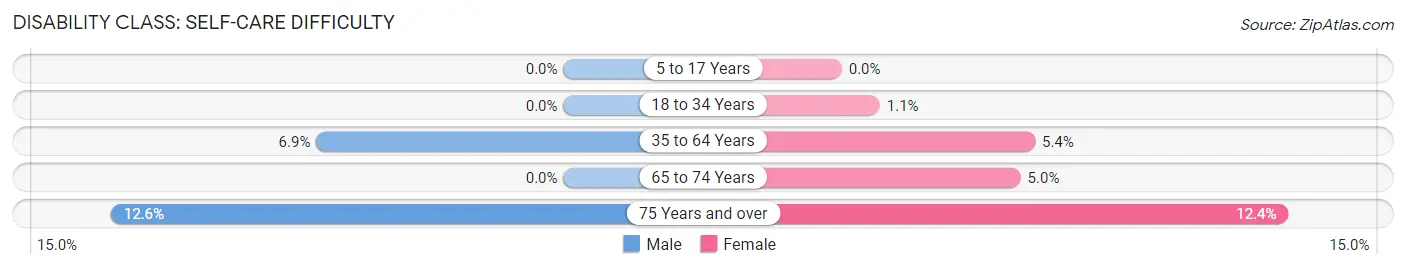
| Age Bracket | Male | Female |
| 5 to 17 Years | 0 (0.0%) | 0 (0.0%) |
| 18 to 34 Years | 0 (0.0%) | 8 (1.1%) |
| 35 to 64 Years | 98 (6.9%) | 70 (5.4%) |
| 65 to 74 Years | 0 (0.0%) | 21 (5.0%) |
| 75 Years and over | 16 (12.6%) | 67 (12.4%) |
Technology Access in Herkimer
Computing Device Access in Herkimer
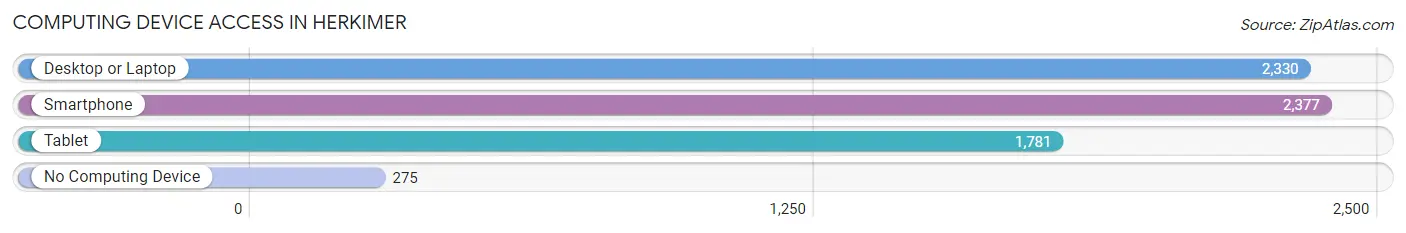
| Device Type | # Households | % Households |
| Desktop or Laptop | 2,330 | 76.6% |
| Smartphone | 2,377 | 78.1% |
| Tablet | 1,781 | 58.6% |
| No Computing Device | 275 | 9.0% |
| Total | 3,042 | 100.0% |
Internet Access in Herkimer
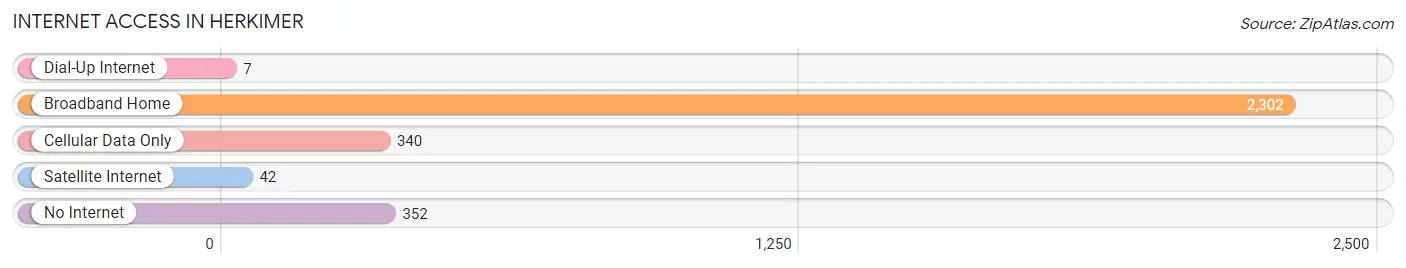
| Internet Type | # Households | % Households |
| Dial-Up Internet | 7 | 0.2% |
| Broadband Home | 2,302 | 75.7% |
| Cellular Data Only | 340 | 11.2% |
| Satellite Internet | 42 | 1.4% |
| No Internet | 352 | 11.6% |
| Total | 3,042 | 100.0% |
Herkimer Summary
Herkimer, NY is a small village located in Herkimer County, New York. It is situated in the Mohawk Valley region of the state, and is part of the Utica-Rome Metropolitan Statistical Area. The village has a population of approximately 7,700 people, and is the county seat of Herkimer County.
History
Herkimer was first settled in 1725 by German Palatines, who were fleeing religious persecution in their homeland. The village was originally known as German Flats, and was later renamed Herkimer in honor of Nicholas Herkimer, a Revolutionary War hero. The village was officially incorporated in 1807.
In the 19th century, Herkimer was an important center for manufacturing and industry. The village was home to several factories, including the Herkimer Woolen Mill, which produced woolen goods, and the Herkimer Iron Works, which produced iron products. The village was also home to several tanneries, which produced leather goods.
Geography
Herkimer is located in the Mohawk Valley region of New York, and is situated on the banks of the Mohawk River. The village is located approximately 25 miles east of Utica, and is bordered by the towns of German Flatts, Little Falls, and Schuyler.
The village has a total area of 1.3 square miles, all of which is land. The terrain is mostly flat, with some rolling hills in the surrounding area. The village is located at an elevation of approximately 500 feet above sea level.
Economy
Herkimer’s economy is largely based on manufacturing and industry. The village is home to several factories, including the Herkimer Woolen Mill, which produces woolen goods, and the Herkimer Iron Works, which produces iron products. The village is also home to several tanneries, which produce leather goods.
In addition to manufacturing, Herkimer is home to several retail stores, restaurants, and other businesses. The village is also home to several medical facilities, including Herkimer County Medical Center and Herkimer County Mental Health Center.
Demographics
As of the 2010 census, Herkimer had a population of 7,743 people. The racial makeup of the village was 94.3% White, 1.7% African American, 0.3% Native American, 0.7% Asian, 0.1% Pacific Islander, 1.2% from other races, and 1.7% from two or more races. Hispanic or Latino of any race were 3.3% of the population.
The median household income in Herkimer was $37,917, and the median family income was $45,938. The per capita income for the village was $19,945. About 11.3% of families and 14.2% of the population were below the poverty line, including 19.2% of those under age 18 and 8.2% of those age 65 or over.
Herkimer is served by the Herkimer Central School District, which consists of four elementary schools, one middle school, and one high school. The village is also home to Herkimer County Community College, which offers a variety of degree and certificate programs.
Common Questions
What is the Total Population of Herkimer?
Total Population of Herkimer is 6,858.
What is the Total Male Population of Herkimer?
Total Male Population of Herkimer is 3,227.
What is the Total Female Population of Herkimer?
Total Female Population of Herkimer is 3,631.
What is the Ratio of Males per 100 Females in Herkimer?
There are 88.87 Males per 100 Females in Herkimer.
What is the Ratio of Females per 100 Males in Herkimer?
There are 112.52 Females per 100 Males in Herkimer.
What is the Median Population Age in Herkimer?
Median Population Age in Herkimer is 48.1 Years.
What is the Average Family Size in Herkimer
Average Family Size in Herkimer is 2.9 People.
What is the Average Household Size in Herkimer
Average Household Size in Herkimer is 2.0 People.
What is Per Capita Income in Herkimer?
Per Capita income in Herkimer is $32,762.
What is the Median Family Income in Herkimer?
Median Family Income in Herkimer is $91,547.
What is the Median Household income in Herkimer?
Median Household Income in Herkimer is $56,607.
What is Income or Wage Gap in Herkimer?
Income or Wage Gap in Herkimer is 3.4%.
Women in Herkimer earn 96.6 cents for every dollar earned by a man.
What is Inequality or Gini Index in Herkimer?
Inequality or Gini Index in Herkimer is 0.43.
How Large is the Labor Force in Herkimer?
There are 3,587 People in the Labor Forcein in Herkimer.
What is the Percentage of People in the Labor Force in Herkimer?
58.7% of People are in the Labor Force in Herkimer.
What is the Unemployment Rate in Herkimer?
Unemployment Rate in Herkimer is 6.1%.