Cities with the Most Immigrants from Honduras in New York
RELATED REPORTS & OPTIONS
Honduras
New York
Compare Cities
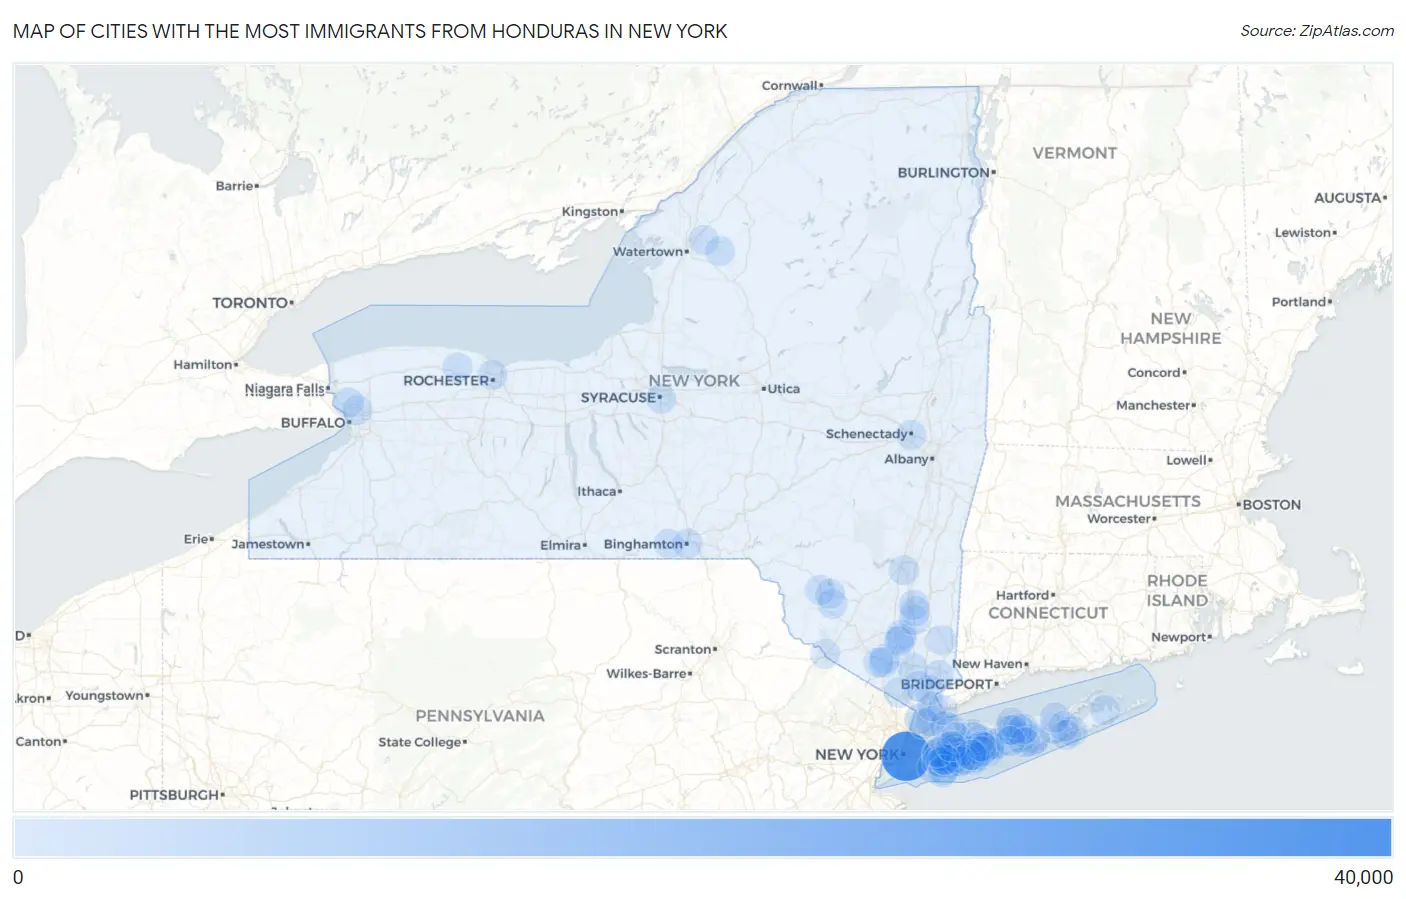
Map of Cities with the Most Immigrants from Honduras in New York
0
40,000
Cities with the Most Immigrants from Honduras in New York
| City | Honduras | vs State | vs National | |
| 1. | New York | 32,433 | 55,571(58.36%)#1 | 727,303(4.46%)#2 |
| 2. | Hempstead | 2,556 | 55,571(4.60%)#2 | 727,303(0.35%)#23 |
| 3. | Brentwood | 1,637 | 55,571(2.95%)#3 | 727,303(0.23%)#47 |
| 4. | Central Islip | 1,560 | 55,571(2.81%)#4 | 727,303(0.21%)#57 |
| 5. | North Bay Shore | 1,064 | 55,571(1.91%)#5 | 727,303(0.15%)#87 |
| 6. | Yonkers | 1,049 | 55,571(1.89%)#6 | 727,303(0.14%)#90 |
| 7. | Uniondale | 979 | 55,571(1.76%)#7 | 727,303(0.13%)#101 |
| 8. | Newburgh | 757 | 55,571(1.36%)#8 | 727,303(0.10%)#137 |
| 9. | New Cassel | 659 | 55,571(1.19%)#9 | 727,303(0.09%)#154 |
| 10. | Inwood | 509 | 55,571(0.92%)#10 | 727,303(0.07%)#209 |
| 11. | Bay Shore | 485 | 55,571(0.87%)#11 | 727,303(0.07%)#214 |
| 12. | Elmont | 438 | 55,571(0.79%)#12 | 727,303(0.06%)#241 |
| 13. | Roosevelt | 303 | 55,571(0.55%)#13 | 727,303(0.04%)#352 |
| 14. | Mineola | 269 | 55,571(0.48%)#14 | 727,303(0.04%)#400 |
| 15. | Mount Vernon | 268 | 55,571(0.48%)#15 | 727,303(0.04%)#402 |
| 16. | Mastic | 262 | 55,571(0.47%)#16 | 727,303(0.04%)#410 |
| 17. | West Babylon | 252 | 55,571(0.45%)#17 | 727,303(0.03%)#420 |
| 18. | Hampton Bays | 251 | 55,571(0.45%)#18 | 727,303(0.03%)#425 |
| 19. | Ossining | 241 | 55,571(0.43%)#19 | 727,303(0.03%)#430 |
| 20. | Medford | 221 | 55,571(0.40%)#20 | 727,303(0.03%)#462 |
| 21. | Gordon Heights | 216 | 55,571(0.39%)#21 | 727,303(0.03%)#473 |
| 22. | West Hempstead | 199 | 55,571(0.36%)#22 | 727,303(0.03%)#505 |
| 23. | Shirley | 196 | 55,571(0.35%)#23 | 727,303(0.03%)#512 |
| 24. | Copiague | 196 | 55,571(0.35%)#24 | 727,303(0.03%)#513 |
| 25. | South Fallsburg | 196 | 55,571(0.35%)#25 | 727,303(0.03%)#514 |
| 26. | New Rochelle | 189 | 55,571(0.34%)#26 | 727,303(0.03%)#532 |
| 27. | Huntington Station | 183 | 55,571(0.33%)#27 | 727,303(0.03%)#550 |
| 28. | Peekskill | 182 | 55,571(0.33%)#28 | 727,303(0.03%)#554 |
| 29. | Liberty | 182 | 55,571(0.33%)#29 | 727,303(0.03%)#555 |
| 30. | Northampton | 170 | 55,571(0.31%)#30 | 727,303(0.02%)#585 |
| 31. | Wyandanch | 169 | 55,571(0.30%)#31 | 727,303(0.02%)#587 |
| 32. | Freeport | 163 | 55,571(0.29%)#32 | 727,303(0.02%)#605 |
| 33. | North Lindenhurst | 161 | 55,571(0.29%)#33 | 727,303(0.02%)#617 |
| 34. | Hicksville | 160 | 55,571(0.29%)#34 | 727,303(0.02%)#620 |
| 35. | Franklin Square | 155 | 55,571(0.28%)#35 | 727,303(0.02%)#631 |
| 36. | New Windsor | 136 | 55,571(0.24%)#36 | 727,303(0.02%)#696 |
| 37. | Baldwin | 134 | 55,571(0.24%)#37 | 727,303(0.02%)#700 |
| 38. | Spring Valley | 134 | 55,571(0.24%)#38 | 727,303(0.02%)#701 |
| 39. | New Hyde Park | 131 | 55,571(0.24%)#39 | 727,303(0.02%)#713 |
| 40. | Farmingdale | 131 | 55,571(0.24%)#40 | 727,303(0.02%)#715 |
| 41. | Coram | 128 | 55,571(0.23%)#41 | 727,303(0.02%)#725 |
| 42. | Monroe | 128 | 55,571(0.23%)#42 | 727,303(0.02%)#729 |
| 43. | Centereach | 127 | 55,571(0.23%)#43 | 727,303(0.02%)#733 |
| 44. | Levittown | 124 | 55,571(0.22%)#44 | 727,303(0.02%)#753 |
| 45. | Middle Island | 124 | 55,571(0.22%)#45 | 727,303(0.02%)#758 |
| 46. | Pleasantville | 122 | 55,571(0.22%)#46 | 727,303(0.02%)#767 |
| 47. | Dix Hills | 112 | 55,571(0.20%)#47 | 727,303(0.02%)#818 |
| 48. | Kiryas Joel | 111 | 55,571(0.20%)#48 | 727,303(0.02%)#822 |
| 49. | South Huntington | 105 | 55,571(0.19%)#49 | 727,303(0.01%)#848 |
| 50. | Flanders | 98 | 55,571(0.18%)#50 | 727,303(0.01%)#899 |
| 51. | Baywood | 95 | 55,571(0.17%)#51 | 727,303(0.01%)#916 |
| 52. | Rochester | 93 | 55,571(0.17%)#52 | 727,303(0.01%)#927 |
| 53. | Glen Cove | 91 | 55,571(0.16%)#53 | 727,303(0.01%)#948 |
| 54. | Valley Stream | 83 | 55,571(0.15%)#54 | 727,303(0.01%)#1,005 |
| 55. | Salisbury | 82 | 55,571(0.15%)#55 | 727,303(0.01%)#1,014 |
| 56. | Lake Carmel | 80 | 55,571(0.14%)#56 | 727,303(0.01%)#1,025 |
| 57. | Lindenhurst | 78 | 55,571(0.14%)#57 | 727,303(0.01%)#1,039 |
| 58. | Vails Gate | 78 | 55,571(0.14%)#58 | 727,303(0.01%)#1,045 |
| 59. | Long Beach | 73 | 55,571(0.13%)#59 | 727,303(0.01%)#1,082 |
| 60. | Port Jefferson Station | 73 | 55,571(0.13%)#60 | 727,303(0.01%)#1,087 |
| 61. | North Bellmore | 71 | 55,571(0.13%)#61 | 727,303(0.01%)#1,107 |
| 62. | Lakeview | 69 | 55,571(0.12%)#62 | 727,303(0.01%)#1,128 |
| 63. | Wappingers Falls | 69 | 55,571(0.12%)#63 | 727,303(0.01%)#1,129 |
| 64. | Port Jervis | 67 | 55,571(0.12%)#64 | 727,303(0.01%)#1,148 |
| 65. | Clarkson | 67 | 55,571(0.12%)#65 | 727,303(0.01%)#1,150 |
| 66. | Lynbrook | 65 | 55,571(0.12%)#66 | 727,303(0.01%)#1,162 |
| 67. | East Meadow | 64 | 55,571(0.12%)#67 | 727,303(0.01%)#1,167 |
| 68. | Locust Valley | 63 | 55,571(0.11%)#68 | 727,303(0.01%)#1,188 |
| 69. | Port Chester | 60 | 55,571(0.11%)#69 | 727,303(0.01%)#1,215 |
| 70. | Selden | 58 | 55,571(0.10%)#70 | 727,303(0.01%)#1,244 |
| 71. | Eggertsville | 58 | 55,571(0.10%)#71 | 727,303(0.01%)#1,246 |
| 72. | Syracuse | 57 | 55,571(0.10%)#72 | 727,303(0.01%)#1,257 |
| 73. | Muttontown | 57 | 55,571(0.10%)#73 | 727,303(0.01%)#1,274 |
| 74. | Fort Drum | 55 | 55,571(0.10%)#74 | 727,303(0.01%)#1,296 |
| 75. | East Quogue | 55 | 55,571(0.10%)#75 | 727,303(0.01%)#1,301 |
| 76. | Bedford Hills | 55 | 55,571(0.10%)#76 | 727,303(0.01%)#1,303 |
| 77. | Kingston | 54 | 55,571(0.10%)#77 | 727,303(0.01%)#1,312 |
| 78. | Endicott | 54 | 55,571(0.10%)#78 | 727,303(0.01%)#1,315 |
| 79. | Spackenkill | 54 | 55,571(0.10%)#79 | 727,303(0.01%)#1,320 |
| 80. | Massapequa | 52 | 55,571(0.09%)#80 | 727,303(0.01%)#1,341 |
| 81. | North Babylon | 52 | 55,571(0.09%)#81 | 727,303(0.01%)#1,342 |
| 82. | Riverhead | 52 | 55,571(0.09%)#82 | 727,303(0.01%)#1,343 |
| 83. | Island Park | 52 | 55,571(0.09%)#83 | 727,303(0.01%)#1,344 |
| 84. | Wantagh | 51 | 55,571(0.09%)#84 | 727,303(0.01%)#1,351 |
| 85. | Binghamton | 50 | 55,571(0.09%)#85 | 727,303(0.01%)#1,363 |
| 86. | Rockville Centre | 48 | 55,571(0.09%)#86 | 727,303(0.01%)#1,395 |
| 87. | North Bellport | 48 | 55,571(0.09%)#87 | 727,303(0.01%)#1,402 |
| 88. | Schenectady | 42 | 55,571(0.08%)#88 | 727,303(0.01%)#1,491 |
| 89. | Holbrook | 40 | 55,571(0.07%)#89 | 727,303(0.01%)#1,529 |
| 90. | Tonawanda | 36 | 55,571(0.06%)#90 | 727,303(0.00%)#1,615 |
| 91. | Deer Park | 36 | 55,571(0.06%)#91 | 727,303(0.00%)#1,619 |
| 92. | Floral Park | 36 | 55,571(0.06%)#92 | 727,303(0.00%)#1,624 |
| 93. | Westbury | 36 | 55,571(0.06%)#93 | 727,303(0.00%)#1,625 |
| 94. | North Amityville | 34 | 55,571(0.06%)#94 | 727,303(0.00%)#1,663 |
| 95. | West Carthage | 33 | 55,571(0.06%)#95 | 727,303(0.00%)#1,694 |
| 96. | Poughkeepsie | 32 | 55,571(0.06%)#96 | 727,303(0.00%)#1,704 |
| 97. | Northwest Harbor | 32 | 55,571(0.06%)#97 | 727,303(0.00%)#1,719 |
| 98. | Walton Park | 32 | 55,571(0.06%)#98 | 727,303(0.00%)#1,722 |
| 99. | Loch Sheldrake | 31 | 55,571(0.06%)#99 | 727,303(0.00%)#1,741 |
| 100. | White Plains | 30 | 55,571(0.05%)#100 | 727,303(0.00%)#1,745 |
Common Questions
What are the Top 10 Cities with the Most Immigrants from Honduras in New York?
Top 10 Cities with the Most Immigrants from Honduras in New York are:
#1
32,433
#2
2,556
#3
1,637
#4
1,560
#5
1,064
#6
1,049
#7
979
#8
757
#9
659
#10
509
What city has the Most Immigrants from Honduras in New York?
New York has the Most Immigrants from Honduras in New York with 32,433.
What is the Total Immigrants from Honduras in the State of New York?
Total Immigrants from Honduras in New York is 55,571.
What is the Total Immigrants from Honduras in the United States?
Total Immigrants from Honduras in the United States is 727,303.