Cities with the Most Immigrants from Guyana in New York
RELATED REPORTS & OPTIONS
Guyana
New York
Compare Cities
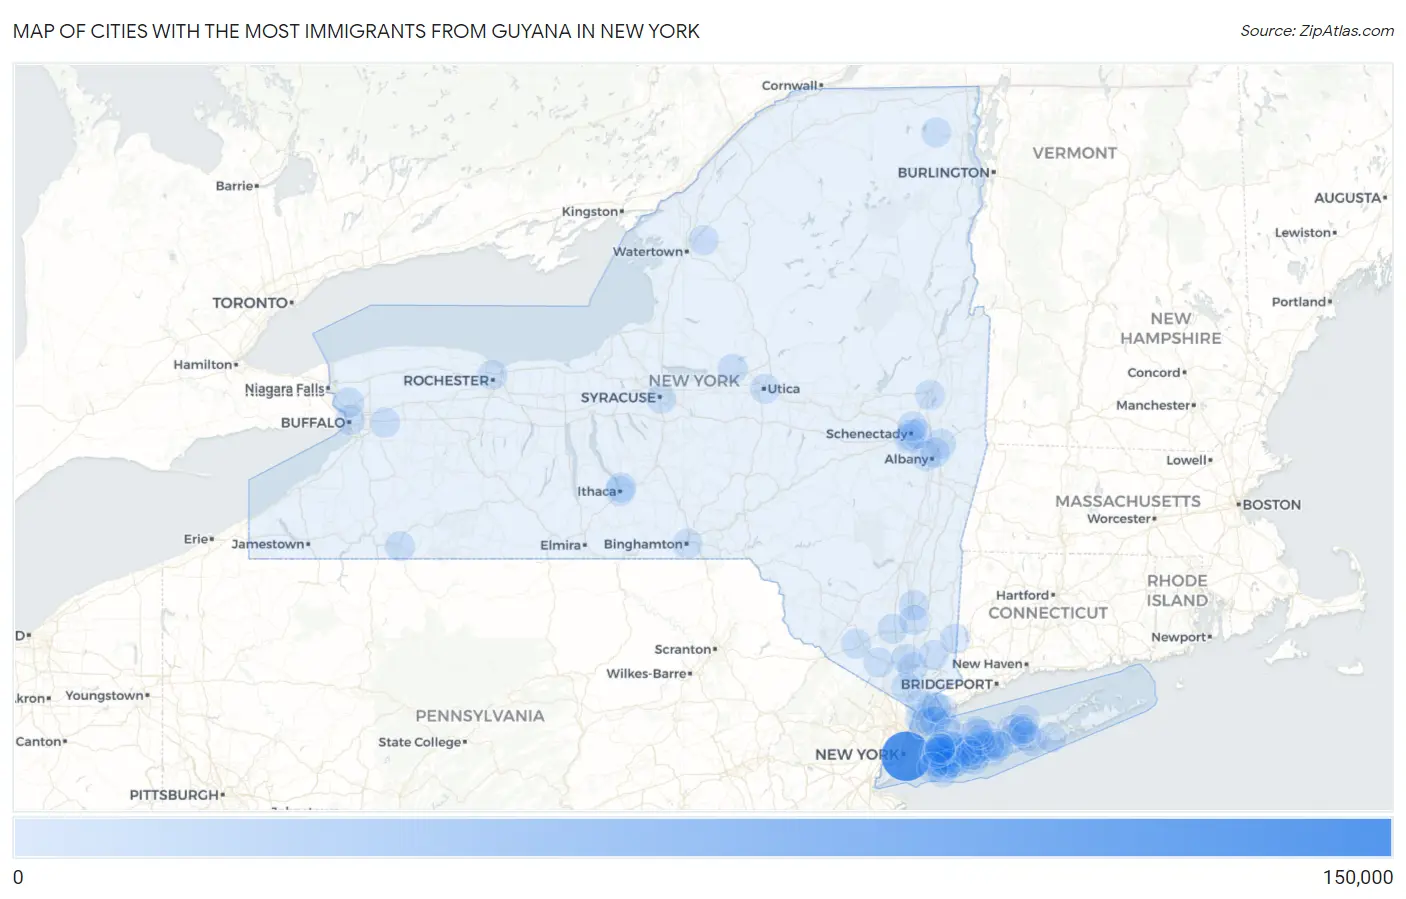
Map of Cities with the Most Immigrants from Guyana in New York
0
150,000
Cities with the Most Immigrants from Guyana in New York
| City | Guyana | vs State | vs National | |
| 1. | New York | 143,980 | 172,129(83.65%)#1 | 287,198(50.13%)#1 |
| 2. | Schenectady | 5,928 | 172,129(3.44%)#2 | 287,198(2.06%)#2 |
| 3. | Valley Stream | 2,009 | 172,129(1.17%)#3 | 287,198(0.70%)#6 |
| 4. | Elmont | 1,271 | 172,129(0.74%)#4 | 287,198(0.44%)#9 |
| 5. | Albany | 940 | 172,129(0.55%)#5 | 287,198(0.33%)#12 |
| 6. | North Valley Stream | 714 | 172,129(0.41%)#6 | 287,198(0.25%)#17 |
| 7. | Yonkers | 689 | 172,129(0.40%)#7 | 287,198(0.24%)#18 |
| 8. | Coram | 668 | 172,129(0.39%)#8 | 287,198(0.23%)#21 |
| 9. | Mount Vernon | 633 | 172,129(0.37%)#9 | 287,198(0.22%)#26 |
| 10. | Brentwood | 453 | 172,129(0.26%)#10 | 287,198(0.16%)#36 |
| 11. | Franklin Square | 385 | 172,129(0.22%)#11 | 287,198(0.13%)#46 |
| 12. | Baldwin | 380 | 172,129(0.22%)#12 | 287,198(0.13%)#49 |
| 13. | Uniondale | 372 | 172,129(0.22%)#13 | 287,198(0.13%)#51 |
| 14. | Hempstead | 363 | 172,129(0.21%)#14 | 287,198(0.13%)#52 |
| 15. | Freeport | 353 | 172,129(0.21%)#15 | 287,198(0.12%)#55 |
| 16. | East Meadow | 333 | 172,129(0.19%)#16 | 287,198(0.12%)#64 |
| 17. | Salisbury | 312 | 172,129(0.18%)#17 | 287,198(0.11%)#65 |
| 18. | Rotterdam | 293 | 172,129(0.17%)#18 | 287,198(0.10%)#69 |
| 19. | Lakeview | 273 | 172,129(0.16%)#19 | 287,198(0.10%)#74 |
| 20. | Syracuse | 234 | 172,129(0.14%)#20 | 287,198(0.08%)#93 |
| 21. | Glen Cove | 234 | 172,129(0.14%)#21 | 287,198(0.08%)#94 |
| 22. | Roosevelt | 231 | 172,129(0.13%)#22 | 287,198(0.08%)#97 |
| 23. | Deer Park | 214 | 172,129(0.12%)#23 | 287,198(0.07%)#103 |
| 24. | Rochester | 213 | 172,129(0.12%)#24 | 287,198(0.07%)#104 |
| 25. | Islip | 193 | 172,129(0.11%)#25 | 287,198(0.07%)#120 |
| 26. | Levittown | 190 | 172,129(0.11%)#26 | 287,198(0.07%)#122 |
| 27. | Orange Lake | 186 | 172,129(0.11%)#27 | 287,198(0.06%)#124 |
| 28. | Buffalo | 183 | 172,129(0.11%)#28 | 287,198(0.06%)#125 |
| 29. | Hicksville | 179 | 172,129(0.10%)#29 | 287,198(0.06%)#129 |
| 30. | East Massapequa | 165 | 172,129(0.10%)#30 | 287,198(0.06%)#143 |
| 31. | Fort Drum | 156 | 172,129(0.09%)#31 | 287,198(0.05%)#157 |
| 32. | West Hempstead | 154 | 172,129(0.09%)#32 | 287,198(0.05%)#160 |
| 33. | Middletown | 153 | 172,129(0.09%)#33 | 287,198(0.05%)#162 |
| 34. | Bellerose Terrace | 144 | 172,129(0.08%)#34 | 287,198(0.05%)#172 |
| 35. | West Babylon | 141 | 172,129(0.08%)#35 | 287,198(0.05%)#176 |
| 36. | Peekskill | 140 | 172,129(0.08%)#36 | 287,198(0.05%)#177 |
| 37. | Selden | 138 | 172,129(0.08%)#37 | 287,198(0.05%)#180 |
| 38. | Long Beach | 131 | 172,129(0.08%)#38 | 287,198(0.05%)#191 |
| 39. | South Valley Stream | 129 | 172,129(0.07%)#39 | 287,198(0.04%)#197 |
| 40. | Copiague | 127 | 172,129(0.07%)#40 | 287,198(0.04%)#199 |
| 41. | White Plains | 120 | 172,129(0.07%)#41 | 287,198(0.04%)#211 |
| 42. | Westbury | 119 | 172,129(0.07%)#42 | 287,198(0.04%)#216 |
| 43. | Tonawanda | 114 | 172,129(0.07%)#43 | 287,198(0.04%)#229 |
| 44. | Niskayuna | 111 | 172,129(0.06%)#44 | 287,198(0.04%)#235 |
| 45. | Troy | 107 | 172,129(0.06%)#45 | 287,198(0.04%)#245 |
| 46. | Bethpage | 106 | 172,129(0.06%)#46 | 287,198(0.04%)#249 |
| 47. | Central Islip | 104 | 172,129(0.06%)#47 | 287,198(0.04%)#251 |
| 48. | Rockville Centre | 103 | 172,129(0.06%)#48 | 287,198(0.04%)#253 |
| 49. | Poughkeepsie | 101 | 172,129(0.06%)#49 | 287,198(0.04%)#259 |
| 50. | Shirley | 98 | 172,129(0.06%)#50 | 287,198(0.03%)#261 |
| 51. | Irvington | 98 | 172,129(0.06%)#51 | 287,198(0.03%)#263 |
| 52. | East Glenville | 97 | 172,129(0.06%)#52 | 287,198(0.03%)#265 |
| 53. | Wappingers Falls | 95 | 172,129(0.06%)#53 | 287,198(0.03%)#271 |
| 54. | Binghamton | 92 | 172,129(0.05%)#54 | 287,198(0.03%)#278 |
| 55. | Fairview Cdp Dutchess County | 92 | 172,129(0.05%)#55 | 287,198(0.03%)#279 |
| 56. | Wyandanch | 85 | 172,129(0.05%)#56 | 287,198(0.03%)#294 |
| 57. | Mineola | 82 | 172,129(0.05%)#57 | 287,198(0.03%)#300 |
| 58. | Commack | 80 | 172,129(0.05%)#58 | 287,198(0.03%)#307 |
| 59. | New Rochelle | 79 | 172,129(0.05%)#59 | 287,198(0.03%)#311 |
| 60. | Searingtown | 77 | 172,129(0.04%)#60 | 287,198(0.03%)#317 |
| 61. | Holtsville | 76 | 172,129(0.04%)#61 | 287,198(0.03%)#321 |
| 62. | Olean | 75 | 172,129(0.04%)#62 | 287,198(0.03%)#324 |
| 63. | Rome | 74 | 172,129(0.04%)#63 | 287,198(0.03%)#329 |
| 64. | Mamaroneck | 74 | 172,129(0.04%)#64 | 287,198(0.03%)#331 |
| 65. | Garden City Park | 74 | 172,129(0.04%)#65 | 287,198(0.03%)#333 |
| 66. | Merrick | 72 | 172,129(0.04%)#66 | 287,198(0.03%)#343 |
| 67. | Putnam Lake | 72 | 172,129(0.04%)#67 | 287,198(0.03%)#347 |
| 68. | Town Line | 72 | 172,129(0.04%)#68 | 287,198(0.03%)#348 |
| 69. | Saratoga Springs | 70 | 172,129(0.04%)#69 | 287,198(0.02%)#359 |
| 70. | North Bay Shore | 69 | 172,129(0.04%)#70 | 287,198(0.02%)#364 |
| 71. | Port Chester | 67 | 172,129(0.04%)#71 | 287,198(0.02%)#370 |
| 72. | Dix Hills | 67 | 172,129(0.04%)#72 | 287,198(0.02%)#373 |
| 73. | Fort Montgomery | 67 | 172,129(0.04%)#73 | 287,198(0.02%)#376 |
| 74. | Akwesasne | 62 | 172,129(0.04%)#74 | 287,198(0.02%)#391 |
| 75. | Utica | 61 | 172,129(0.04%)#75 | 287,198(0.02%)#392 |
| 76. | Rocky Point | 60 | 172,129(0.03%)#76 | 287,198(0.02%)#402 |
| 77. | Farmingdale | 60 | 172,129(0.03%)#77 | 287,198(0.02%)#404 |
| 78. | North Great River | 59 | 172,129(0.03%)#78 | 287,198(0.02%)#406 |
| 79. | Gordon Heights | 57 | 172,129(0.03%)#79 | 287,198(0.02%)#419 |
| 80. | Dannemora | 56 | 172,129(0.03%)#80 | 287,198(0.02%)#426 |
| 81. | North Amityville | 55 | 172,129(0.03%)#81 | 287,198(0.02%)#429 |
| 82. | New City | 54 | 172,129(0.03%)#82 | 287,198(0.02%)#431 |
| 83. | Harrison | 54 | 172,129(0.03%)#83 | 287,198(0.02%)#432 |
| 84. | Mahopac | 54 | 172,129(0.03%)#84 | 287,198(0.02%)#439 |
| 85. | Yaphank | 54 | 172,129(0.03%)#85 | 287,198(0.02%)#440 |
| 86. | Walton Park | 54 | 172,129(0.03%)#86 | 287,198(0.02%)#441 |
| 87. | Floral Park | 53 | 172,129(0.03%)#87 | 287,198(0.02%)#451 |
| 88. | Glen Head | 53 | 172,129(0.03%)#88 | 287,198(0.02%)#452 |
| 89. | Elwood | 51 | 172,129(0.03%)#89 | 287,198(0.02%)#459 |
| 90. | Oceanside | 47 | 172,129(0.03%)#90 | 287,198(0.02%)#488 |
| 91. | Ithaca | 47 | 172,129(0.03%)#91 | 287,198(0.02%)#489 |
| 92. | Middle Island | 47 | 172,129(0.03%)#92 | 287,198(0.02%)#493 |
| 93. | New Hyde Park | 47 | 172,129(0.03%)#93 | 287,198(0.02%)#494 |
| 94. | Menands | 47 | 172,129(0.03%)#94 | 287,198(0.02%)#495 |
| 95. | Greenlawn | 46 | 172,129(0.03%)#95 | 287,198(0.02%)#504 |
| 96. | Manhasset Hills | 45 | 172,129(0.03%)#96 | 287,198(0.02%)#518 |
| 97. | Remsenburg Speonk | 45 | 172,129(0.03%)#97 | 287,198(0.02%)#519 |
| 98. | North New Hyde Park | 44 | 172,129(0.03%)#98 | 287,198(0.02%)#522 |
| 99. | Inwood | 44 | 172,129(0.03%)#99 | 287,198(0.02%)#524 |
| 100. | Cayuga Heights | 44 | 172,129(0.03%)#100 | 287,198(0.02%)#527 |
Common Questions
What are the Top 10 Cities with the Most Immigrants from Guyana in New York?
Top 10 Cities with the Most Immigrants from Guyana in New York are:
#1
143,980
#2
5,928
#3
2,009
#4
1,271
#5
940
#6
714
#7
689
#8
668
#9
633
#10
453
What city has the Most Immigrants from Guyana in New York?
New York has the Most Immigrants from Guyana in New York with 143,980.
What is the Total Immigrants from Guyana in the State of New York?
Total Immigrants from Guyana in New York is 172,129.
What is the Total Immigrants from Guyana in the United States?
Total Immigrants from Guyana in the United States is 287,198.