Cities with the Highest Percentage of Immigrants from Switzerland in New York
RELATED REPORTS & OPTIONS
Switzerland
New York
Compare Cities
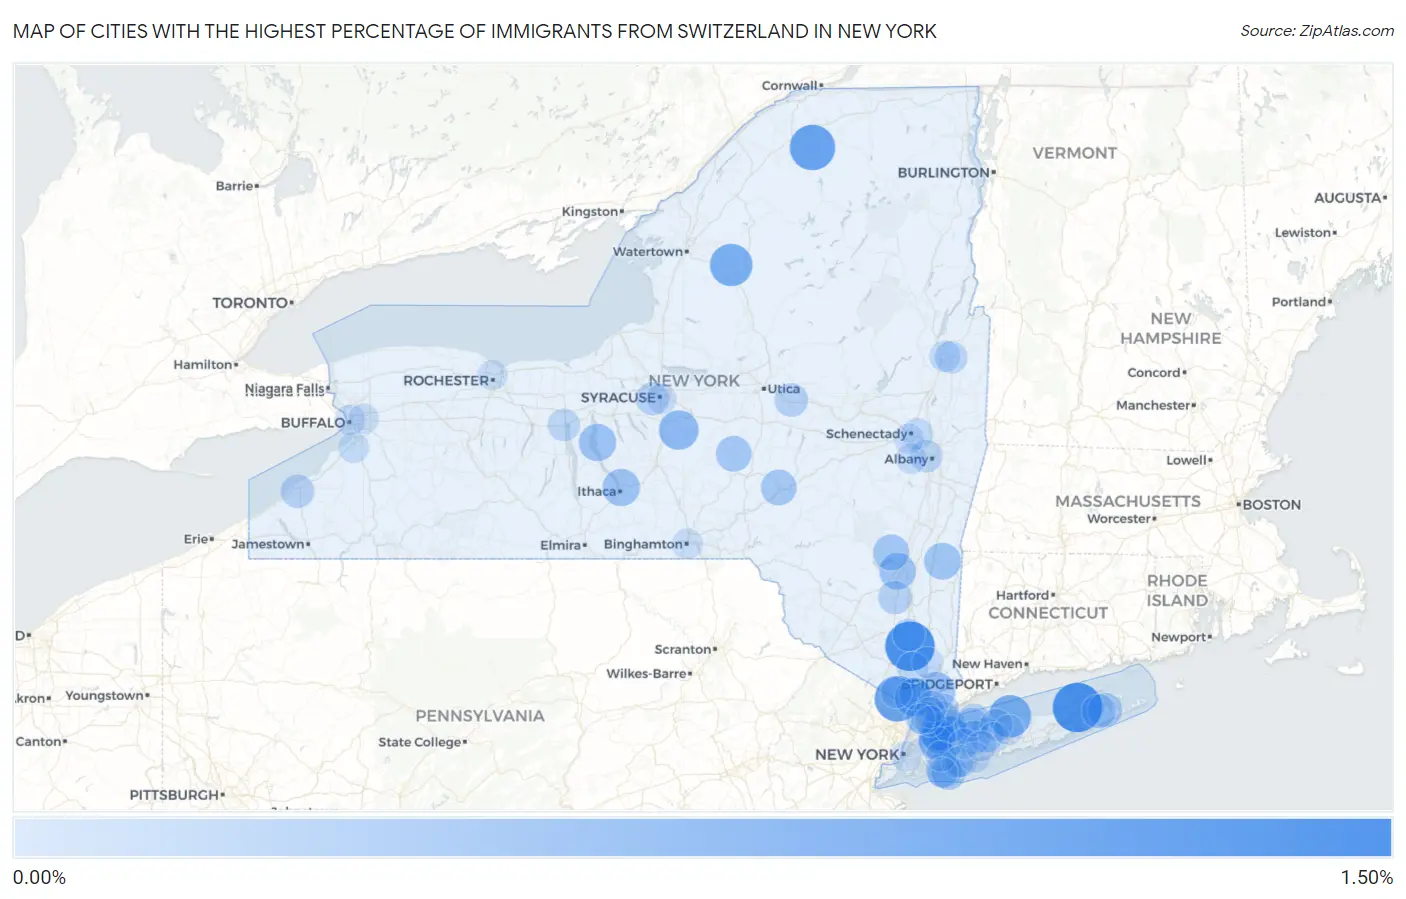
Map of Cities with the Highest Percentage of Immigrants from Switzerland in New York
0.00%
1.50%
Cities with the Highest Percentage of Immigrants from Switzerland in New York
| City | Switzerland | vs State | vs National | |
| 1. | Nelsonville | 1.19% | 0.022%(+1.16)#1 | 0.011%(+1.18)#27 |
| 2. | Cutchogue | 1.18% | 0.022%(+1.16)#2 | 0.011%(+1.17)#28 |
| 3. | Chestnut Ridge | 0.95% | 0.022%(+0.926)#3 | 0.011%(+0.937)#40 |
| 4. | Parishville | 0.93% | 0.022%(+0.905)#4 | 0.011%(+0.916)#41 |
| 5. | Castorland | 0.74% | 0.022%(+0.722)#5 | 0.011%(+0.733)#52 |
| 6. | Belle Terre | 0.74% | 0.022%(+0.718)#6 | 0.011%(+0.728)#54 |
| 7. | Fabius | 0.56% | 0.022%(+0.538)#7 | 0.011%(+0.549)#71 |
| 8. | Old Brookville | 0.55% | 0.022%(+0.523)#8 | 0.011%(+0.534)#77 |
| 9. | Nyack | 0.48% | 0.022%(+0.460)#9 | 0.011%(+0.470)#93 |
| 10. | Armonk | 0.48% | 0.022%(+0.458)#10 | 0.011%(+0.468)#94 |
| 11. | Aurora | 0.43% | 0.022%(+0.411)#11 | 0.011%(+0.422)#104 |
| 12. | Plandome Heights | 0.43% | 0.022%(+0.404)#12 | 0.011%(+0.415)#106 |
| 13. | Cayuga Heights | 0.42% | 0.022%(+0.398)#13 | 0.011%(+0.409)#107 |
| 14. | Pine Plains | 0.40% | 0.022%(+0.380)#14 | 0.011%(+0.391)#111 |
| 15. | Loudonville | 0.39% | 0.022%(+0.365)#15 | 0.011%(+0.375)#117 |
| 16. | Hurley | 0.39% | 0.022%(+0.364)#16 | 0.011%(+0.374)#121 |
| 17. | Sands Point | 0.37% | 0.022%(+0.348)#17 | 0.011%(+0.359)#126 |
| 18. | Woodstock | 0.35% | 0.022%(+0.326)#18 | 0.011%(+0.337)#130 |
| 19. | Island Park | 0.34% | 0.022%(+0.321)#19 | 0.011%(+0.332)#135 |
| 20. | Sherburne | 0.34% | 0.022%(+0.315)#20 | 0.011%(+0.326)#139 |
| 21. | West End | 0.33% | 0.022%(+0.305)#21 | 0.011%(+0.315)#141 |
| 22. | Rye | 0.29% | 0.022%(+0.264)#22 | 0.011%(+0.274)#169 |
| 23. | Lido Beach | 0.27% | 0.022%(+0.246)#23 | 0.011%(+0.256)#184 |
| 24. | Commack | 0.26% | 0.022%(+0.241)#24 | 0.011%(+0.251)#186 |
| 25. | Baxter Estates | 0.26% | 0.022%(+0.239)#25 | 0.011%(+0.250)#187 |
| 26. | Great Neck Plaza | 0.26% | 0.022%(+0.233)#26 | 0.011%(+0.244)#188 |
| 27. | Northwest Harbor | 0.25% | 0.022%(+0.229)#27 | 0.011%(+0.240)#190 |
| 28. | Sag Harbor | 0.23% | 0.022%(+0.210)#28 | 0.011%(+0.221)#210 |
| 29. | Tuckahoe | 0.23% | 0.022%(+0.207)#29 | 0.011%(+0.217)#212 |
| 30. | Huntington Bay | 0.23% | 0.022%(+0.203)#30 | 0.011%(+0.214)#215 |
| 31. | South Huntington | 0.21% | 0.022%(+0.191)#31 | 0.011%(+0.202)#232 |
| 32. | New Paltz | 0.21% | 0.022%(+0.185)#32 | 0.011%(+0.196)#237 |
| 33. | Fredonia | 0.21% | 0.022%(+0.184)#33 | 0.011%(+0.195)#238 |
| 34. | Herkimer | 0.20% | 0.022%(+0.182)#34 | 0.011%(+0.193)#241 |
| 35. | Lattingtown | 0.20% | 0.022%(+0.174)#35 | 0.011%(+0.185)#249 |
| 36. | Westvale | 0.18% | 0.022%(+0.160)#36 | 0.011%(+0.171)#265 |
| 37. | Port Chester | 0.18% | 0.022%(+0.160)#37 | 0.011%(+0.171)#266 |
| 38. | Asharoken | 0.15% | 0.022%(+0.131)#38 | 0.011%(+0.142)#316 |
| 39. | Albany | 0.15% | 0.022%(+0.124)#39 | 0.011%(+0.135)#329 |
| 40. | Beacon | 0.14% | 0.022%(+0.122)#40 | 0.011%(+0.133)#331 |
| 41. | Hudson Falls | 0.13% | 0.022%(+0.113)#41 | 0.011%(+0.123)#348 |
| 42. | Geneva | 0.13% | 0.022%(+0.112)#42 | 0.011%(+0.123)#350 |
| 43. | Nissequogue | 0.13% | 0.022%(+0.109)#43 | 0.011%(+0.120)#356 |
| 44. | Seaford | 0.12% | 0.022%(+0.098)#44 | 0.011%(+0.109)#377 |
| 45. | Upper Nyack | 0.093% | 0.022%(+0.071)#45 | 0.011%(+0.082)#430 |
| 46. | Peekskill | 0.091% | 0.022%(+0.068)#46 | 0.011%(+0.079)#439 |
| 47. | Glens Falls | 0.075% | 0.022%(+0.052)#47 | 0.011%(+0.063)#492 |
| 48. | Niskayuna | 0.073% | 0.022%(+0.051)#48 | 0.011%(+0.061)#498 |
| 49. | Jefferson Valley Yorktown | 0.064% | 0.022%(+0.042)#49 | 0.011%(+0.053)#529 |
| 50. | Bellmore | 0.063% | 0.022%(+0.041)#50 | 0.011%(+0.051)#537 |
| 51. | Eastchester | 0.058% | 0.022%(+0.036)#51 | 0.011%(+0.047)#553 |
| 52. | Monsey | 0.057% | 0.022%(+0.034)#52 | 0.011%(+0.045)#562 |
| 53. | Hamburg | 0.051% | 0.022%(+0.029)#53 | 0.011%(+0.040)#588 |
| 54. | White Plains | 0.045% | 0.022%(+0.023)#54 | 0.011%(+0.034)#624 |
| 55. | Scarsdale | 0.044% | 0.022%(+0.022)#55 | 0.011%(+0.033)#633 |
| 56. | New Rochelle | 0.042% | 0.022%(+0.020)#56 | 0.011%(+0.031)#648 |
| 57. | Binghamton | 0.040% | 0.022%(+0.018)#57 | 0.011%(+0.029)#660 |
| 58. | Hauppauge | 0.039% | 0.022%(+0.017)#58 | 0.011%(+0.028)#666 |
| 59. | Buffalo | 0.038% | 0.022%(+0.016)#59 | 0.011%(+0.027)#671 |
| 60. | Voorheesville | 0.035% | 0.022%(+0.013)#60 | 0.011%(+0.024)#693 |
| 61. | Franklin Square | 0.034% | 0.022%(+0.012)#61 | 0.011%(+0.023)#698 |
| 62. | Plainview | 0.030% | 0.022%(+0.008)#62 | 0.011%(+0.019)#737 |
| 63. | Lindenhurst | 0.029% | 0.022%(+0.007)#63 | 0.011%(+0.018)#741 |
| 64. | New York | 0.029% | 0.022%(+0.007)#64 | 0.011%(+0.018)#742 |
| 65. | Rotterdam | 0.026% | 0.022%(+0.004)#65 | 0.011%(+0.015)#773 |
| 66. | Deer Park | 0.026% | 0.022%(+0.003)#66 | 0.011%(+0.014)#787 |
| 67. | Syracuse | 0.024% | 0.022%(+0.002)#67 | 0.011%(+0.013)#800 |
| 68. | Rochester | 0.018% | 0.022%(-0.004)#68 | 0.011%(+0.007)#858 |
| 69. | Cheektowaga | 0.017% | 0.022%(-0.005)#69 | 0.011%(+0.006)#881 |
| 70. | Centereach | 0.013% | 0.022%(-0.010)#70 | 0.011%(+0.001)#924 |
| 71. | Long Beach | 0.012% | 0.022%(-0.011)#71 | 0.011%(+0.000)#933 |
| 72. | Yonkers | 0.0067% | 0.022%(-0.015)#72 | 0.011%(-0.005)#996 |
Common Questions
What are the Top 10 Cities with the Highest Percentage of Immigrants from Switzerland in New York?
Top 10 Cities with the Highest Percentage of Immigrants from Switzerland in New York are:
#1
1.19%
#2
1.18%
#3
0.95%
#4
0.93%
#5
0.74%
#6
0.74%
#7
0.56%
#8
0.55%
#9
0.48%
#10
0.48%
What city has the Highest Percentage of Immigrants from Switzerland in New York?
Nelsonville has the Highest Percentage of Immigrants from Switzerland in New York with 1.19%.
What is the Percentage of Immigrants from Switzerland in the State of New York?
Percentage of Immigrants from Switzerland in New York is 0.022%.
What is the Percentage of Immigrants from Switzerland in the United States?
Percentage of Immigrants from Switzerland in the United States is 0.011%.