West Babylon, NY
West Babylon Map
West Babylon Overview
42,783
TOTAL POPULATION
21,137
MALE POPULATION
21,646
FEMALE POPULATION
97.65
MALES / 100 FEMALES
102.41
FEMALES / 100 MALES
43.1
MEDIAN AGE
3.5
AVG FAMILY SIZE
3.0
AVG HOUSEHOLD SIZE
$47,239
PER CAPITA INCOME
$129,146
AVG FAMILY INCOME
$121,266
AVG HOUSEHOLD INCOME
21.5%
WAGE / INCOME GAP [ % ]
78.5¢/ $1
WAGE / INCOME GAP [ $ ]
$9,485
FAMILY INCOME DEFICIT
0.37
INEQUALITY / GINI INDEX
24,457
LABOR FORCE [ PEOPLE ]
68.3%
PERCENT IN LABOR FORCE
6.9%
UNEMPLOYMENT RATE
West Babylon Zip Codes
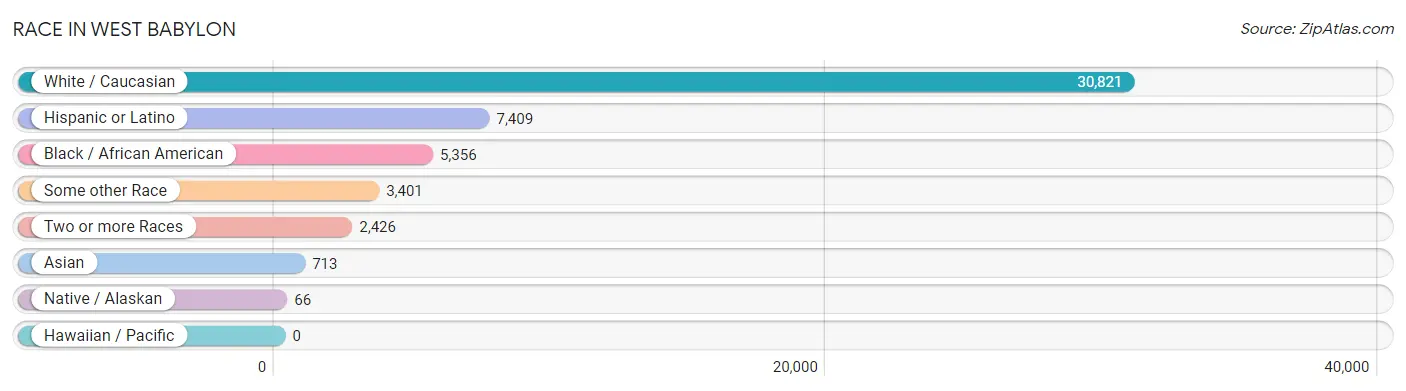
Race in West Babylon
The most populous races in West Babylon are White / Caucasian (30,821 | 72.0%), Hispanic or Latino (7,409 | 17.3%), and Black / African American (5,356 | 12.5%).
| Race | # Population | % Population |
| Asian | 713 | 1.7% |
| Black / African American | 5,356 | 12.5% |
| Hawaiian / Pacific | 0 | 0.0% |
| Hispanic or Latino | 7,409 | 17.3% |
| Native / Alaskan | 66 | 0.2% |
| White / Caucasian | 30,821 | 72.0% |
| Two or more Races | 2,426 | 5.7% |
| Some other Race | 3,401 | 8.0% |
| Total | 42,783 | 100.0% |
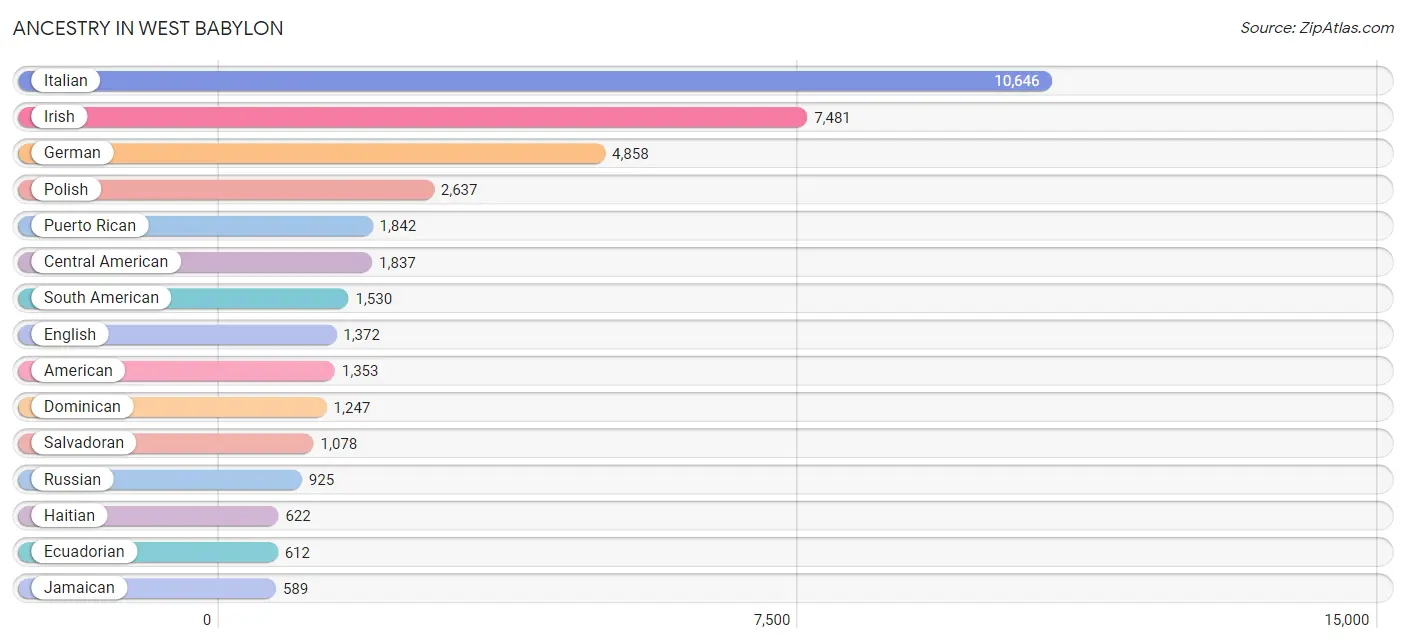
Ancestry in West Babylon
The most populous ancestries reported in West Babylon are Italian (10,646 | 24.9%), Irish (7,481 | 17.5%), German (4,858 | 11.4%), Polish (2,637 | 6.2%), and Puerto Rican (1,842 | 4.3%), together accounting for 64.2% of all West Babylon residents.
| Ancestry | # Population | % Population |
| African | 49 | 0.1% |
| American | 1,353 | 3.2% |
| Arab | 34 | 0.1% |
| Argentinean | 101 | 0.2% |
| Armenian | 54 | 0.1% |
| Australian | 5 | 0.0% |
| Austrian | 278 | 0.6% |
| Bahamian | 32 | 0.1% |
| Belizean | 7 | 0.0% |
| Bhutanese | 21 | 0.1% |
| Blackfeet | 50 | 0.1% |
| Bolivian | 12 | 0.0% |
| Brazilian | 48 | 0.1% |
| British | 58 | 0.1% |
| British West Indian | 117 | 0.3% |
| Burmese | 7 | 0.0% |
| Canadian | 14 | 0.0% |
| Central American | 1,837 | 4.3% |
| Central American Indian | 35 | 0.1% |
| Cherokee | 34 | 0.1% |
| Choctaw | 18 | 0.0% |
| Colombian | 489 | 1.1% |
| Cree | 27 | 0.1% |
| Croatian | 29 | 0.1% |
| Cuban | 264 | 0.6% |
| Czech | 161 | 0.4% |
| Czechoslovakian | 99 | 0.2% |
| Danish | 50 | 0.1% |
| Dominican | 1,247 | 2.9% |
| Dutch | 290 | 0.7% |
| Eastern European | 172 | 0.4% |
| Ecuadorian | 612 | 1.4% |
| Egyptian | 19 | 0.0% |
| English | 1,372 | 3.2% |
| European | 192 | 0.4% |
| Filipino | 16 | 0.0% |
| Finnish | 23 | 0.1% |
| French | 323 | 0.7% |
| French Canadian | 71 | 0.2% |
| German | 4,858 | 11.4% |
| Ghanaian | 17 | 0.0% |
| Greek | 258 | 0.6% |
| Guatemalan | 84 | 0.2% |
| Guyanese | 129 | 0.3% |
| Haitian | 622 | 1.5% |
| Honduran | 325 | 0.8% |
| Hungarian | 122 | 0.3% |
| Icelander | 18 | 0.0% |
| Indian (Asian) | 243 | 0.6% |
| Irish | 7,481 | 17.5% |
| Iroquois | 3 | 0.0% |
| Italian | 10,646 | 24.9% |
| Jamaican | 589 | 1.4% |
| Korean | 93 | 0.2% |
| Lebanese | 14 | 0.0% |
| Lithuanian | 89 | 0.2% |
| Maltese | 27 | 0.1% |
| Mexican | 194 | 0.4% |
| Mexican American Indian | 23 | 0.1% |
| Norwegian | 162 | 0.4% |
| Panamanian | 72 | 0.2% |
| Paraguayan | 62 | 0.1% |
| Peruvian | 223 | 0.5% |
| Polish | 2,637 | 6.2% |
| Portuguese | 21 | 0.1% |
| Puerto Rican | 1,842 | 4.3% |
| Romanian | 18 | 0.0% |
| Russian | 925 | 2.2% |
| Salvadoran | 1,078 | 2.5% |
| Scandinavian | 97 | 0.2% |
| Scotch-Irish | 164 | 0.4% |
| Scottish | 201 | 0.5% |
| Seminole | 67 | 0.2% |
| Slovak | 27 | 0.1% |
| Slovene | 21 | 0.1% |
| South American | 1,530 | 3.6% |
| Spaniard | 108 | 0.3% |
| Spanish | 180 | 0.4% |
| Sri Lankan | 92 | 0.2% |
| Subsaharan African | 98 | 0.2% |
| Swedish | 169 | 0.4% |
| Swiss | 57 | 0.1% |
| Thai | 240 | 0.6% |
| Trinidadian and Tobagonian | 215 | 0.5% |
| Turkish | 524 | 1.2% |
| Ugandan | 32 | 0.1% |
| Ukrainian | 235 | 0.5% |
| Uruguayan | 23 | 0.1% |
| Venezuelan | 8 | 0.0% |
| Vietnamese | 78 | 0.2% |
| West Indian | 26 | 0.1% |
| Yugoslavian | 30 | 0.1% | View All 92 Rows |
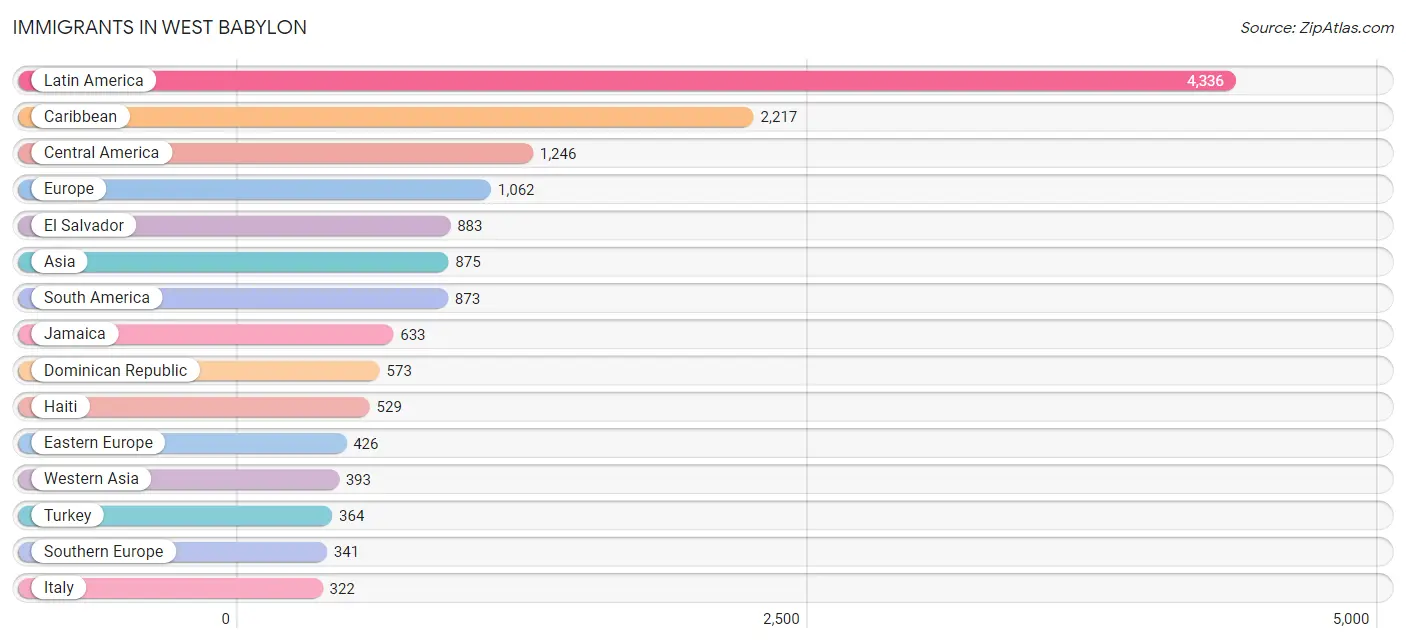
Immigrants in West Babylon
The most numerous immigrant groups reported in West Babylon came from Latin America (4,336 | 10.1%), Caribbean (2,217 | 5.2%), Central America (1,246 | 2.9%), Europe (1,062 | 2.5%), and El Salvador (883 | 2.1%), together accounting for 22.8% of all West Babylon residents.
| Immigration Origin | # Population | % Population |
| Africa | 45 | 0.1% |
| Argentina | 50 | 0.1% |
| Asia | 875 | 2.1% |
| Australia | 4 | 0.0% |
| Austria | 13 | 0.0% |
| Bahamas | 12 | 0.0% |
| Bangladesh | 58 | 0.1% |
| Belarus | 16 | 0.0% |
| Belize | 7 | 0.0% |
| Bolivia | 24 | 0.1% |
| Brazil | 26 | 0.1% |
| Canada | 27 | 0.1% |
| Caribbean | 2,217 | 5.2% |
| Central America | 1,246 | 2.9% |
| China | 150 | 0.4% |
| Colombia | 285 | 0.7% |
| Cuba | 79 | 0.2% |
| Czechoslovakia | 27 | 0.1% |
| Dominica | 40 | 0.1% |
| Dominican Republic | 573 | 1.3% |
| Eastern Africa | 11 | 0.0% |
| Eastern Asia | 157 | 0.4% |
| Eastern Europe | 426 | 1.0% |
| Ecuador | 202 | 0.5% |
| El Salvador | 883 | 2.1% |
| England | 12 | 0.0% |
| Europe | 1,062 | 2.5% |
| Germany | 105 | 0.3% |
| Ghana | 17 | 0.0% |
| Greece | 6 | 0.0% |
| Grenada | 60 | 0.1% |
| Guatemala | 37 | 0.1% |
| Guyana | 141 | 0.3% |
| Haiti | 529 | 1.2% |
| Honduras | 252 | 0.6% |
| India | 44 | 0.1% |
| Ireland | 19 | 0.0% |
| Italy | 322 | 0.7% |
| Jamaica | 633 | 1.5% |
| Korea | 7 | 0.0% |
| Latin America | 4,336 | 10.1% |
| Lebanon | 11 | 0.0% |
| Mexico | 67 | 0.2% |
| Northern Europe | 177 | 0.4% |
| Oceania | 4 | 0.0% |
| Pakistan | 101 | 0.2% |
| Peru | 115 | 0.3% |
| Philippines | 62 | 0.1% |
| Poland | 263 | 0.6% |
| Romania | 39 | 0.1% |
| Scotland | 26 | 0.1% |
| South Africa | 17 | 0.0% |
| South America | 873 | 2.0% |
| South Central Asia | 203 | 0.5% |
| South Eastern Asia | 122 | 0.3% |
| Southern Europe | 341 | 0.8% |
| Spain | 13 | 0.0% |
| Trinidad and Tobago | 142 | 0.3% |
| Turkey | 364 | 0.9% |
| Uganda | 11 | 0.0% |
| Ukraine | 50 | 0.1% |
| Venezuela | 8 | 0.0% |
| Vietnam | 60 | 0.1% |
| Western Africa | 17 | 0.0% |
| Western Asia | 393 | 0.9% |
| Western Europe | 118 | 0.3% |
| Yemen | 18 | 0.0% | View All 67 Rows |
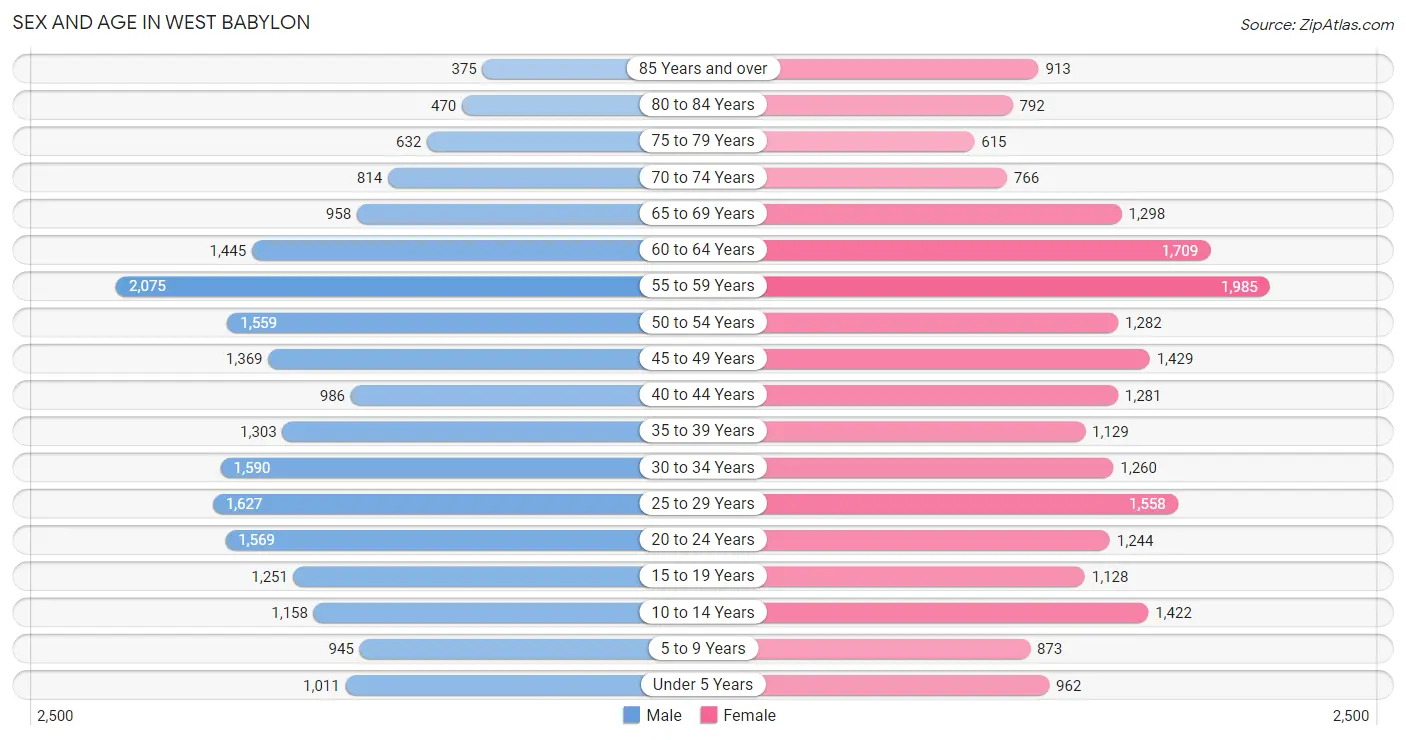
Sex and Age in West Babylon
Sex and Age in West Babylon
The most populous age groups in West Babylon are 55 to 59 Years (2,075 | 9.8%) for men and 55 to 59 Years (1,985 | 9.2%) for women.
| Age Bracket | Male | Female |
| Under 5 Years | 1,011 (4.8%) | 962 (4.4%) |
| 5 to 9 Years | 945 (4.5%) | 873 (4.0%) |
| 10 to 14 Years | 1,158 (5.5%) | 1,422 (6.6%) |
| 15 to 19 Years | 1,251 (5.9%) | 1,128 (5.2%) |
| 20 to 24 Years | 1,569 (7.4%) | 1,244 (5.8%) |
| 25 to 29 Years | 1,627 (7.7%) | 1,558 (7.2%) |
| 30 to 34 Years | 1,590 (7.5%) | 1,260 (5.8%) |
| 35 to 39 Years | 1,303 (6.2%) | 1,129 (5.2%) |
| 40 to 44 Years | 986 (4.7%) | 1,281 (5.9%) |
| 45 to 49 Years | 1,369 (6.5%) | 1,429 (6.6%) |
| 50 to 54 Years | 1,559 (7.4%) | 1,282 (5.9%) |
| 55 to 59 Years | 2,075 (9.8%) | 1,985 (9.2%) |
| 60 to 64 Years | 1,445 (6.8%) | 1,709 (7.9%) |
| 65 to 69 Years | 958 (4.5%) | 1,298 (6.0%) |
| 70 to 74 Years | 814 (3.8%) | 766 (3.5%) |
| 75 to 79 Years | 632 (3.0%) | 615 (2.8%) |
| 80 to 84 Years | 470 (2.2%) | 792 (3.7%) |
| 85 Years and over | 375 (1.8%) | 913 (4.2%) |
| Total | 21,137 (100.0%) | 21,646 (100.0%) |
Families and Households in West Babylon
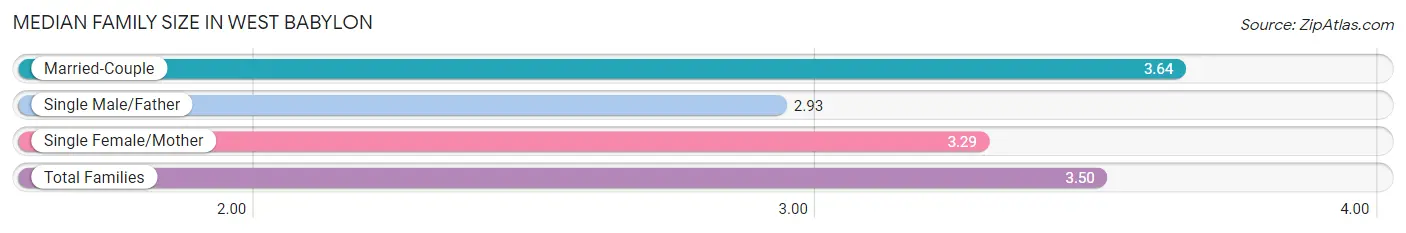
Median Family Size in West Babylon
The median family size in West Babylon is 3.50 persons per family, with married-couple families (7,035 | 70.5%) accounting for the largest median family size of 3.64 persons per family. On the other hand, single male/father families (933 | 9.3%) represent the smallest median family size with 2.93 persons per family.
| Family Type | # Families | Family Size |
| Married-Couple | 7,035 (70.5%) | 3.64 |
| Single Male/Father | 933 (9.3%) | 2.93 |
| Single Female/Mother | 2,012 (20.2%) | 3.29 |
| Total Families | 9,980 (100.0%) | 3.50 |
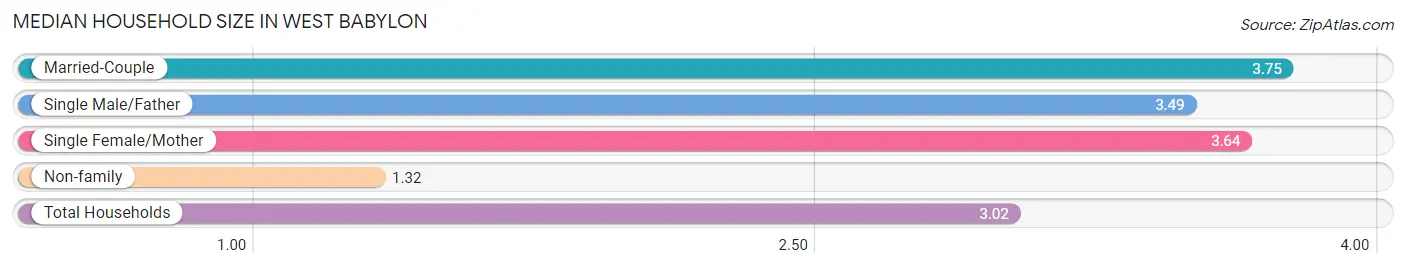
Median Household Size in West Babylon
The median household size in West Babylon is 3.02 persons per household, with married-couple households (7,035 | 50.4%) accounting for the largest median household size of 3.75 persons per household. non-family households (3,977 | 28.5%) represent the smallest median household size with 1.32 persons per household.
| Household Type | # Households | Household Size |
| Married-Couple | 7,035 (50.4%) | 3.75 |
| Single Male/Father | 933 (6.7%) | 3.49 |
| Single Female/Mother | 2,012 (14.4%) | 3.64 |
| Non-family | 3,977 (28.5%) | 1.32 |
| Total Households | 13,957 (100.0%) | 3.02 |
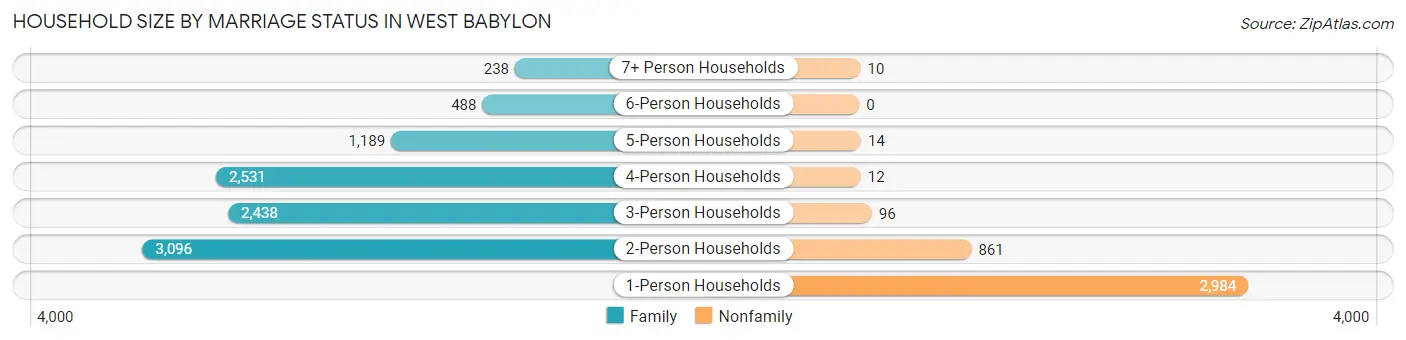
Household Size by Marriage Status in West Babylon
Out of a total of 13,957 households in West Babylon, 9,980 (71.5%) are family households, while 3,977 (28.5%) are nonfamily households. The most numerous type of family households are 2-person households, comprising 3,096, and the most common type of nonfamily households are 1-person households, comprising 2,984.
| Household Size | Family Households | Nonfamily Households |
| 1-Person Households | - | 2,984 (21.4%) |
| 2-Person Households | 3,096 (22.2%) | 861 (6.2%) |
| 3-Person Households | 2,438 (17.5%) | 96 (0.7%) |
| 4-Person Households | 2,531 (18.1%) | 12 (0.1%) |
| 5-Person Households | 1,189 (8.5%) | 14 (0.1%) |
| 6-Person Households | 488 (3.5%) | 0 (0.0%) |
| 7+ Person Households | 238 (1.7%) | 10 (0.1%) |
| Total | 9,980 (71.5%) | 3,977 (28.5%) |
Female Fertility in West Babylon
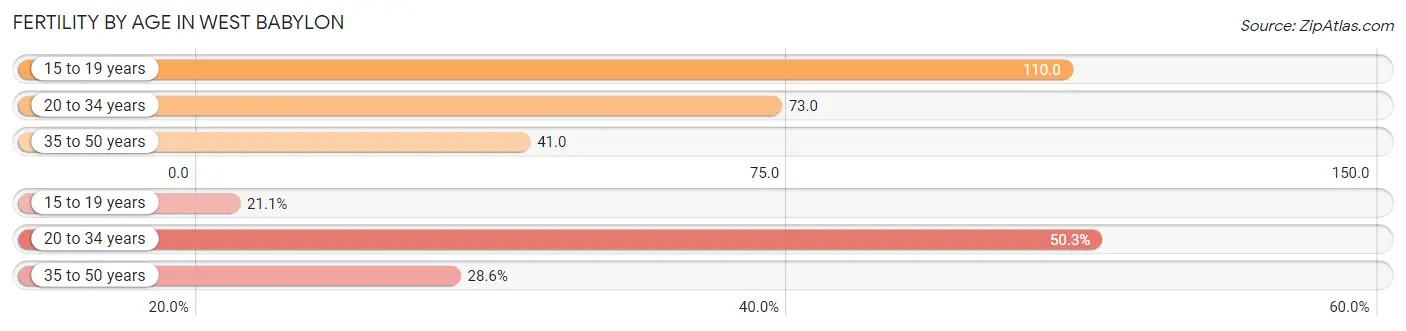
Fertility by Age in West Babylon
Average fertility rate in West Babylon is 63.0 births per 1,000 women. Women in the age bracket of 15 to 19 years have the highest fertility rate with 110.0 births per 1,000 women. Women in the age bracket of 20 to 34 years acount for 50.3% of all women with births.
| Age Bracket | Women with Births | Births / 1,000 Women |
| 15 to 19 years | 124 (21.1%) | 110.0 |
| 20 to 34 years | 296 (50.3%) | 73.0 |
| 35 to 50 years | 168 (28.6%) | 41.0 |
| Total | 588 (100.0%) | 63.0 |
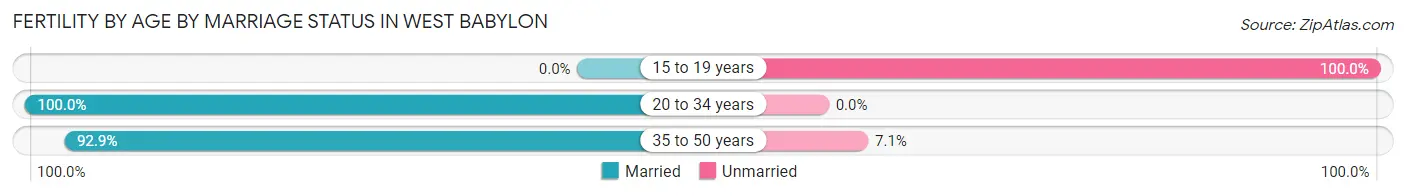
Fertility by Age by Marriage Status in West Babylon
76.9% of women with births (588) in West Babylon are married. The highest percentage of unmarried women with births falls into 15 to 19 years age bracket with 100.0% of them unmarried at the time of birth, while the lowest percentage of unmarried women with births belong to 20 to 34 years age bracket with 0.0% of them unmarried.
| Age Bracket | Married | Unmarried |
| 15 to 19 years | 0 (0.0%) | 124 (100.0%) |
| 20 to 34 years | 296 (100.0%) | 0 (0.0%) |
| 35 to 50 years | 156 (92.9%) | 12 (7.1%) |
| Total | 452 (76.9%) | 136 (23.1%) |
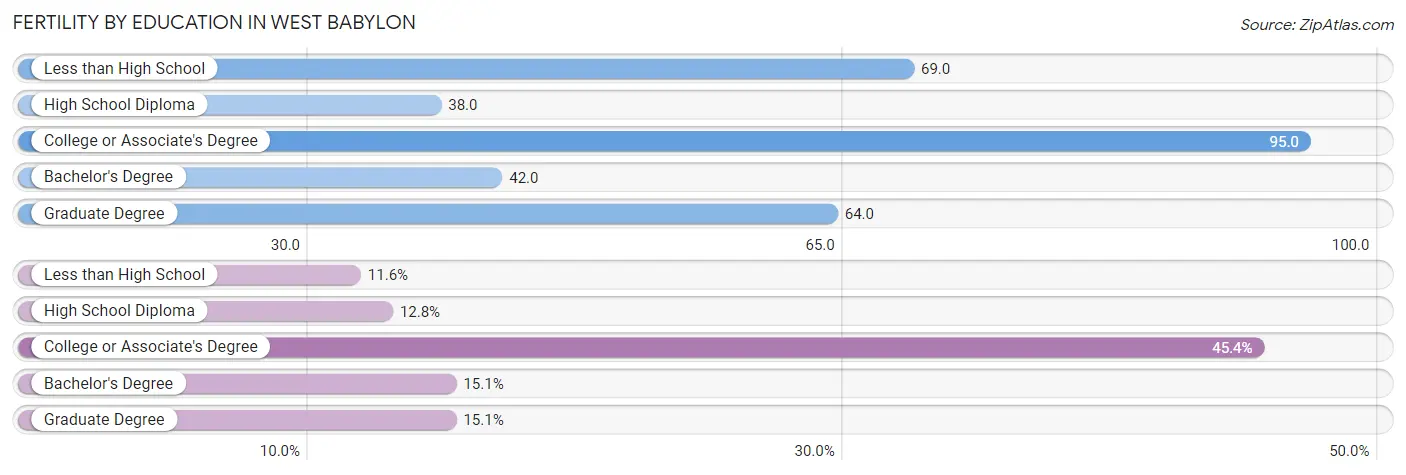
Fertility by Education in West Babylon
Average fertility rate in West Babylon is 63.0 births per 1,000 women. Women with the education attainment of college or associate's degree have the highest fertility rate of 95.0 births per 1,000 women, while women with the education attainment of high school diploma have the lowest fertility at 38.0 births per 1,000 women. Women with the education attainment of college or associate's degree represent 45.4% of all women with births.
| Educational Attainment | Women with Births | Births / 1,000 Women |
| Less than High School | 68 (11.6%) | 69.0 |
| High School Diploma | 75 (12.8%) | 38.0 |
| College or Associate's Degree | 267 (45.4%) | 95.0 |
| Bachelor's Degree | 89 (15.1%) | 42.0 |
| Graduate Degree | 89 (15.1%) | 64.0 |
| Total | 588 (100.0%) | 63.0 |
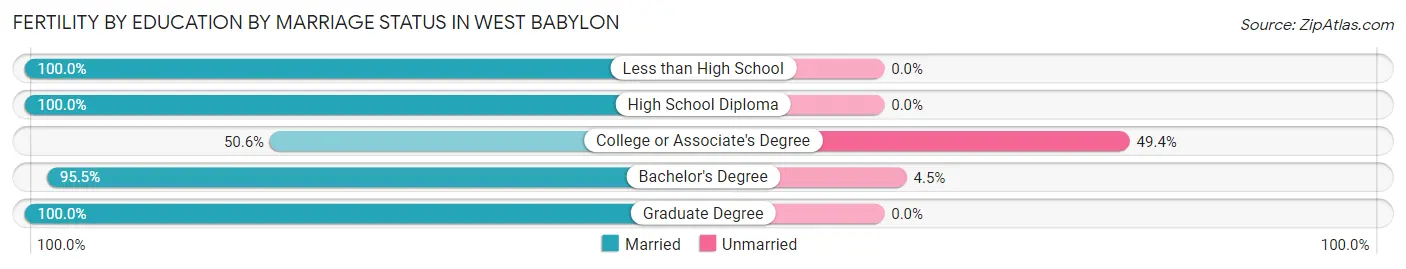
Fertility by Education by Marriage Status in West Babylon
23.1% of women with births in West Babylon are unmarried. Women with the educational attainment of less than high school are most likely to be married with 100.0% of them married at childbirth, while women with the educational attainment of college or associate's degree are least likely to be married with 49.4% of them unmarried at childbirth.
| Educational Attainment | Married | Unmarried |
| Less than High School | 68 (100.0%) | 0 (0.0%) |
| High School Diploma | 75 (100.0%) | 0 (0.0%) |
| College or Associate's Degree | 135 (50.6%) | 132 (49.4%) |
| Bachelor's Degree | 85 (95.5%) | 4 (4.5%) |
| Graduate Degree | 89 (100.0%) | 0 (0.0%) |
| Total | 452 (76.9%) | 136 (23.1%) |
Income in West Babylon
Income Overview in West Babylon
Per Capita Income in West Babylon is $47,239, while median incomes of families and households are $129,146 and $121,266 respectively.
| Characteristic | Number | Measure |
| Per Capita Income | 42,783 | $47,239 |
| Median Family Income | 9,980 | $129,146 |
| Mean Family Income | 9,980 | $147,000 |
| Median Household Income | 13,957 | $121,266 |
| Mean Household Income | 13,957 | $137,215 |
| Income Deficit | 9,980 | $9,485 |
| Wage / Income Gap (%) | 42,783 | 21.51% |
| Wage / Income Gap ($) | 42,783 | 78.49¢ per $1 |
| Gini / Inequality Index | 42,783 | 0.37 |
Earnings by Sex in West Babylon
Average Earnings in West Babylon are $53,321, $59,588 for men and $46,771 for women, a difference of 21.5%.
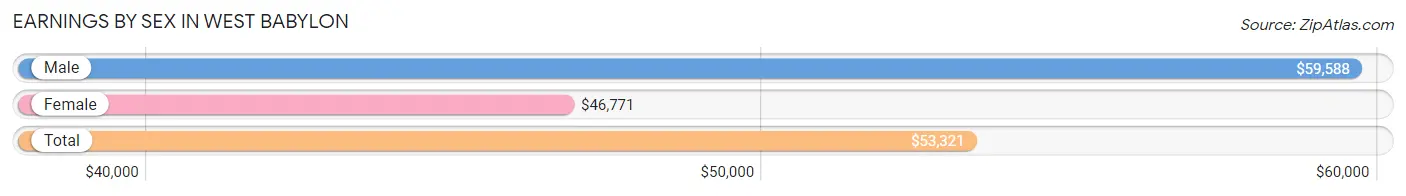
| Sex | Number | Average Earnings |
| Male | 12,584 (51.0%) | $59,588 |
| Female | 12,085 (49.0%) | $46,771 |
| Total | 24,669 (100.0%) | $53,321 |
Earnings by Sex by Income Bracket in West Babylon
The most common earnings brackets in West Babylon are $100,000+ for men (3,233 | 25.7%) and $100,000+ for women (2,119 | 17.5%).
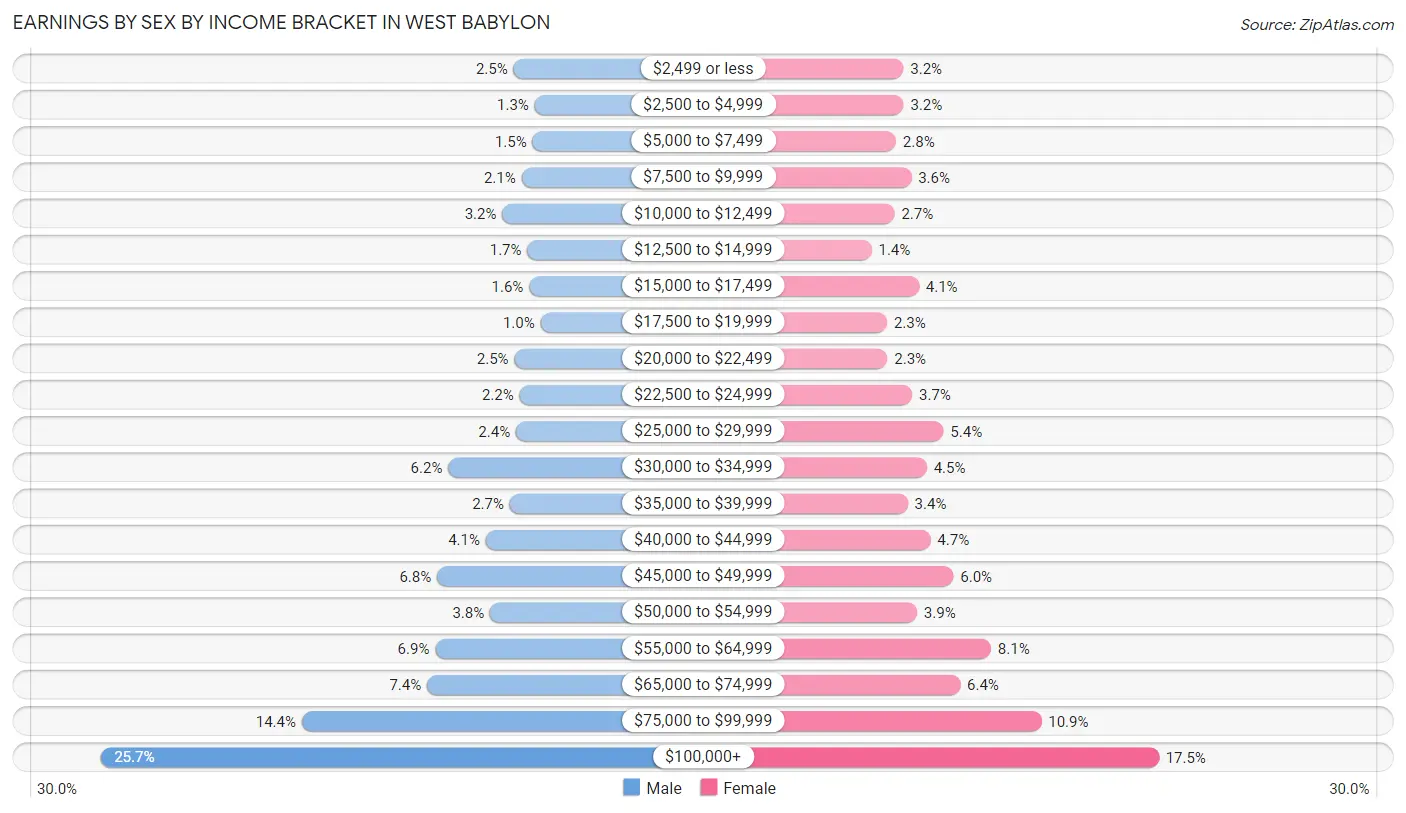
| Income | Male | Female |
| $2,499 or less | 317 (2.5%) | 384 (3.2%) |
| $2,500 to $4,999 | 167 (1.3%) | 386 (3.2%) |
| $5,000 to $7,499 | 182 (1.5%) | 333 (2.8%) |
| $7,500 to $9,999 | 260 (2.1%) | 438 (3.6%) |
| $10,000 to $12,499 | 397 (3.2%) | 324 (2.7%) |
| $12,500 to $14,999 | 219 (1.7%) | 168 (1.4%) |
| $15,000 to $17,499 | 207 (1.6%) | 490 (4.1%) |
| $17,500 to $19,999 | 126 (1.0%) | 273 (2.3%) |
| $20,000 to $22,499 | 311 (2.5%) | 276 (2.3%) |
| $22,500 to $24,999 | 274 (2.2%) | 444 (3.7%) |
| $25,000 to $29,999 | 299 (2.4%) | 656 (5.4%) |
| $30,000 to $34,999 | 779 (6.2%) | 543 (4.5%) |
| $35,000 to $39,999 | 344 (2.7%) | 413 (3.4%) |
| $40,000 to $44,999 | 513 (4.1%) | 568 (4.7%) |
| $45,000 to $49,999 | 858 (6.8%) | 724 (6.0%) |
| $50,000 to $54,999 | 483 (3.8%) | 476 (3.9%) |
| $55,000 to $64,999 | 871 (6.9%) | 979 (8.1%) |
| $65,000 to $74,999 | 929 (7.4%) | 770 (6.4%) |
| $75,000 to $99,999 | 1,815 (14.4%) | 1,321 (10.9%) |
| $100,000+ | 3,233 (25.7%) | 2,119 (17.5%) |
| Total | 12,584 (100.0%) | 12,085 (100.0%) |
Earnings by Sex by Educational Attainment in West Babylon
Average earnings in West Babylon are $69,980 for men and $54,450 for women, a difference of 22.2%. Men with an educational attainment of graduate degree enjoy the highest average annual earnings of $96,188, while those with less than high school education earn the least with $50,391. Women with an educational attainment of graduate degree earn the most with the average annual earnings of $84,444, while those with high school diploma education have the smallest earnings of $35,709.
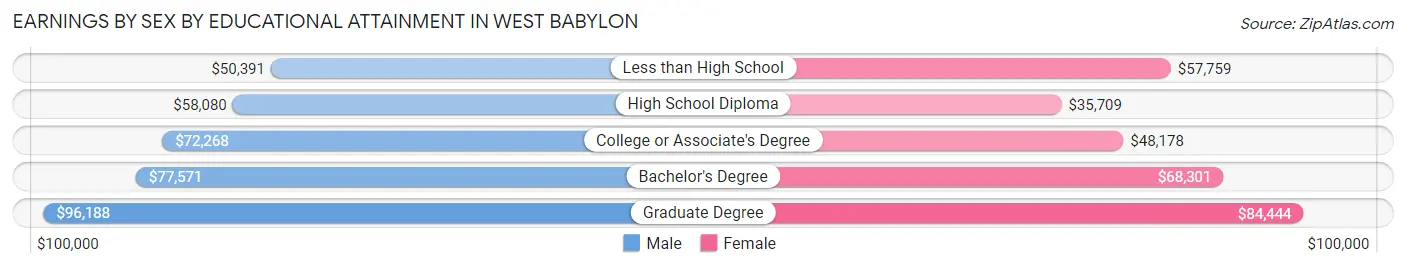
| Educational Attainment | Male Income | Female Income |
| Less than High School | $50,391 | $57,759 |
| High School Diploma | $58,080 | $35,709 |
| College or Associate's Degree | $72,268 | $48,178 |
| Bachelor's Degree | $77,571 | $68,301 |
| Graduate Degree | $96,188 | $84,444 |
| Total | $69,980 | $54,450 |
Family Income in West Babylon
Family Income Brackets in West Babylon
According to the West Babylon family income data, there are 2,954 families falling into the $100,000 to $149,999 income range, which is the most common income bracket and makes up 29.6% of all families. Conversely, the less than $10,000 income bracket is the least frequent group with only 60 families (0.6%) belonging to this category.
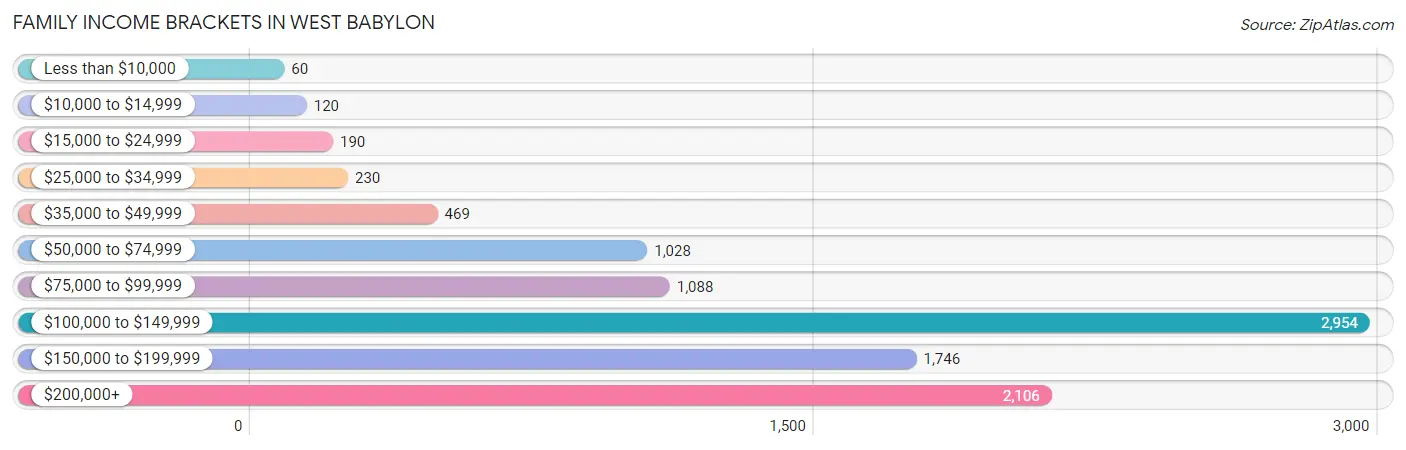
| Income Bracket | # Families | % Families |
| Less than $10,000 | 60 | 0.6% |
| $10,000 to $14,999 | 120 | 1.2% |
| $15,000 to $24,999 | 190 | 1.9% |
| $25,000 to $34,999 | 230 | 2.3% |
| $35,000 to $49,999 | 469 | 4.7% |
| $50,000 to $74,999 | 1,028 | 10.3% |
| $75,000 to $99,999 | 1,088 | 10.9% |
| $100,000 to $149,999 | 2,954 | 29.6% |
| $150,000 to $199,999 | 1,746 | 17.5% |
| $200,000+ | 2,106 | 21.1% |
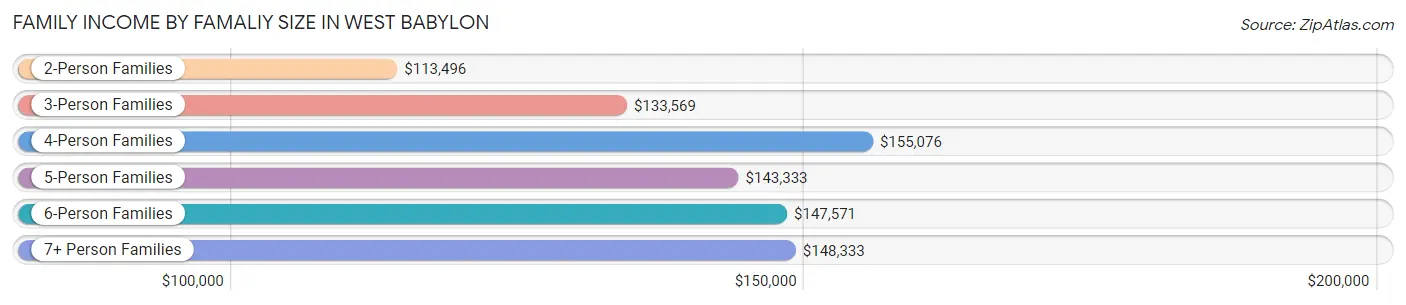
Family Income by Famaliy Size in West Babylon
4-person families (2,284 | 22.9%) account for the highest median family income in West Babylon with $155,076 per family, while 2-person families (3,569 | 35.8%) have the highest median income of $56,748 per family member.
| Income Bracket | # Families | Median Income |
| 2-Person Families | 3,569 (35.8%) | $113,496 |
| 3-Person Families | 2,497 (25.0%) | $133,569 |
| 4-Person Families | 2,284 (22.9%) | $155,076 |
| 5-Person Families | 1,084 (10.9%) | $143,333 |
| 6-Person Families | 358 (3.6%) | $147,571 |
| 7+ Person Families | 188 (1.9%) | $148,333 |
| Total | 9,980 (100.0%) | $129,146 |
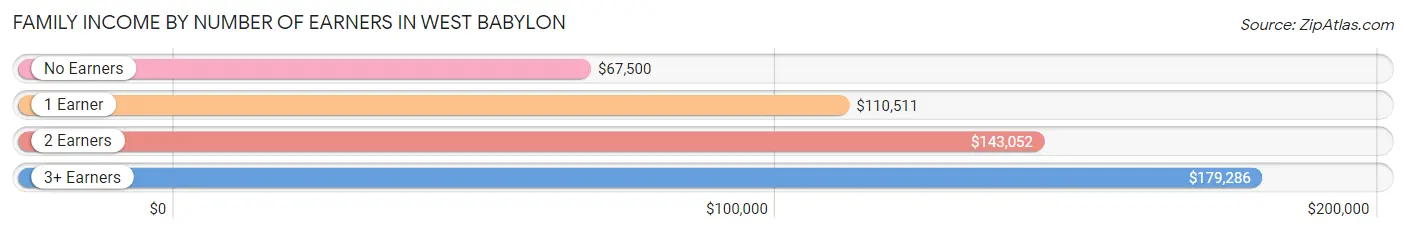
Family Income by Number of Earners in West Babylon
The median family income in West Babylon is $129,146, with families comprising 3+ earners (2,308) having the highest median family income of $179,286, while families with no earners (1,084) have the lowest median family income of $67,500, accounting for 23.1% and 10.9% of families, respectively.
| Number of Earners | # Families | Median Income |
| No Earners | 1,084 (10.9%) | $67,500 |
| 1 Earner | 2,699 (27.0%) | $110,511 |
| 2 Earners | 3,889 (39.0%) | $143,052 |
| 3+ Earners | 2,308 (23.1%) | $179,286 |
| Total | 9,980 (100.0%) | $129,146 |
Household Income in West Babylon
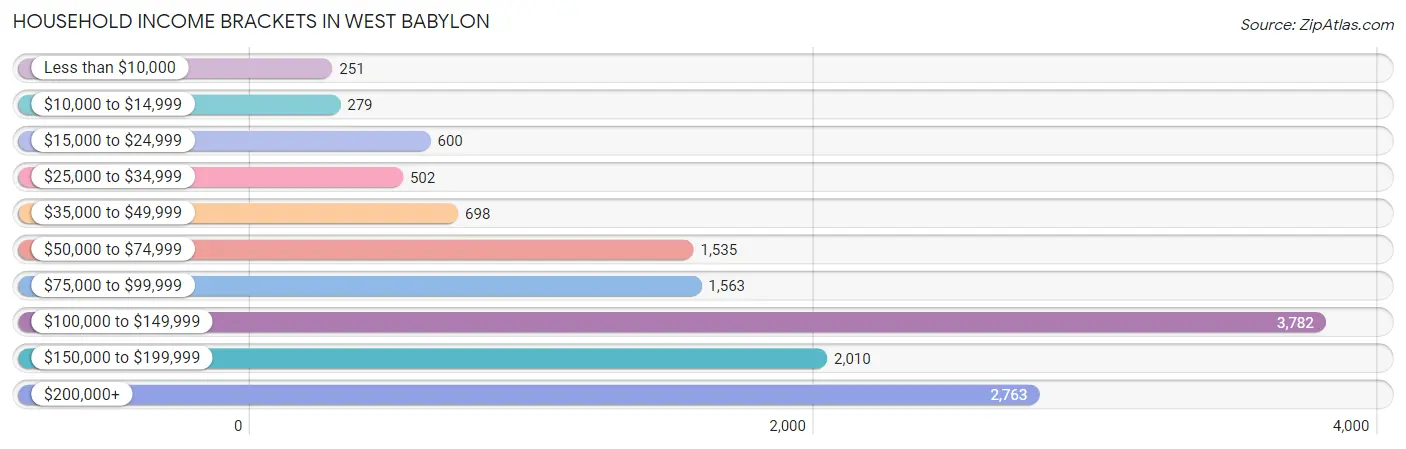
Household Income Brackets in West Babylon
With 3,782 households falling in the category, the $100,000 to $149,999 income range is the most frequent in West Babylon, accounting for 27.1% of all households. In contrast, only 251 households (1.8%) fall into the less than $10,000 income bracket, making it the least populous group.
| Income Bracket | # Households | % Households |
| Less than $10,000 | 251 | 1.8% |
| $10,000 to $14,999 | 279 | 2.0% |
| $15,000 to $24,999 | 600 | 4.3% |
| $25,000 to $34,999 | 502 | 3.6% |
| $35,000 to $49,999 | 698 | 5.0% |
| $50,000 to $74,999 | 1,535 | 11.0% |
| $75,000 to $99,999 | 1,563 | 11.2% |
| $100,000 to $149,999 | 3,782 | 27.1% |
| $150,000 to $199,999 | 2,010 | 14.4% |
| $200,000+ | 2,763 | 19.8% |
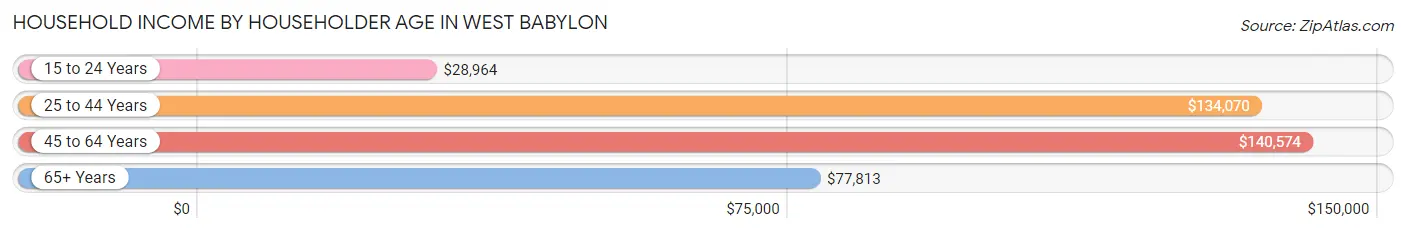
Household Income by Householder Age in West Babylon
The median household income in West Babylon is $121,266, with the highest median household income of $140,574 found in the 45 to 64 years age bracket for the primary householder. A total of 6,566 households (47.0%) fall into this category. Meanwhile, the 15 to 24 years age bracket for the primary householder has the lowest median household income of $28,964, with 82 households (0.6%) in this group.
| Income Bracket | # Households | Median Income |
| 15 to 24 Years | 82 (0.6%) | $28,964 |
| 25 to 44 Years | 3,074 (22.0%) | $134,070 |
| 45 to 64 Years | 6,566 (47.0%) | $140,574 |
| 65+ Years | 4,235 (30.3%) | $77,813 |
| Total | 13,957 (100.0%) | $121,266 |
Poverty in West Babylon
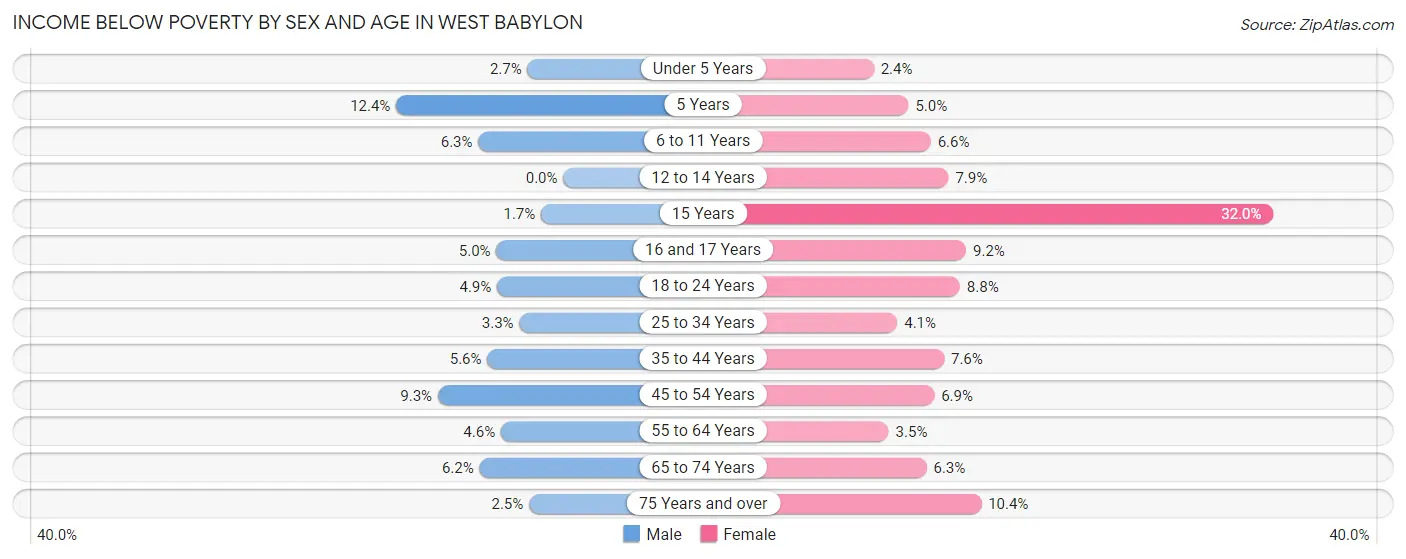
Income Below Poverty by Sex and Age in West Babylon
With 5.1% poverty level for males and 6.6% for females among the residents of West Babylon, 5 year old males and 15 year old females are the most vulnerable to poverty, with 17 males (12.4%) and 58 females (32.0%) in their respective age groups living below the poverty level.
| Age Bracket | Male | Female |
| Under 5 Years | 26 (2.7%) | 21 (2.4%) |
| 5 Years | 17 (12.4%) | 10 (5.0%) |
| 6 to 11 Years | 84 (6.3%) | 71 (6.6%) |
| 12 to 14 Years | 0 (0.0%) | 77 (7.9%) |
| 15 Years | 7 (1.7%) | 58 (32.0%) |
| 16 and 17 Years | 23 (5.0%) | 36 (9.2%) |
| 18 to 24 Years | 95 (4.9%) | 158 (8.8%) |
| 25 to 34 Years | 105 (3.3%) | 116 (4.1%) |
| 35 to 44 Years | 129 (5.6%) | 183 (7.6%) |
| 45 to 54 Years | 272 (9.3%) | 186 (6.9%) |
| 55 to 64 Years | 162 (4.6%) | 128 (3.5%) |
| 65 to 74 Years | 109 (6.2%) | 128 (6.3%) |
| 75 Years and over | 35 (2.5%) | 224 (10.3%) |
| Total | 1,064 (5.1%) | 1,396 (6.6%) |
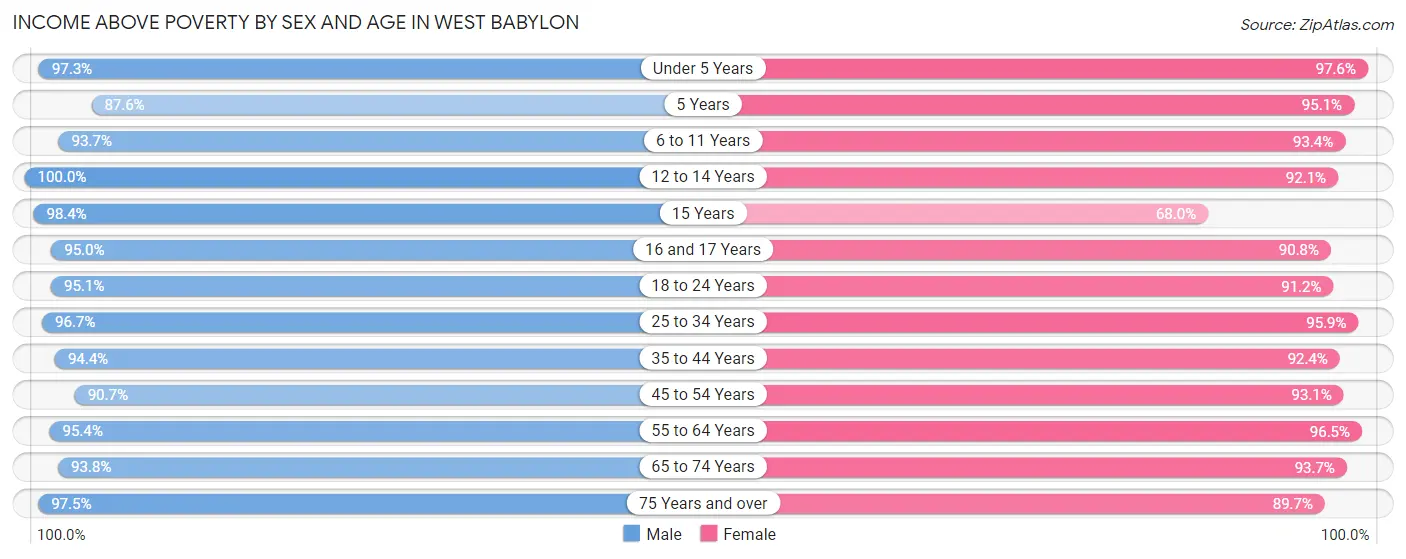
Income Above Poverty by Sex and Age in West Babylon
According to the poverty statistics in West Babylon, males aged 12 to 14 years and females aged under 5 years are the age groups that are most secure financially, with 100.0% of males and 97.6% of females in these age groups living above the poverty line.
| Age Bracket | Male | Female |
| Under 5 Years | 950 (97.3%) | 864 (97.6%) |
| 5 Years | 120 (87.6%) | 192 (95.1%) |
| 6 to 11 Years | 1,248 (93.7%) | 1,004 (93.4%) |
| 12 to 14 Years | 609 (100.0%) | 895 (92.1%) |
| 15 Years | 416 (98.4%) | 123 (68.0%) |
| 16 and 17 Years | 440 (95.0%) | 354 (90.8%) |
| 18 to 24 Years | 1,837 (95.1%) | 1,643 (91.2%) |
| 25 to 34 Years | 3,112 (96.7%) | 2,702 (95.9%) |
| 35 to 44 Years | 2,160 (94.4%) | 2,227 (92.4%) |
| 45 to 54 Years | 2,650 (90.7%) | 2,525 (93.1%) |
| 55 to 64 Years | 3,339 (95.4%) | 3,549 (96.5%) |
| 65 to 74 Years | 1,643 (93.8%) | 1,908 (93.7%) |
| 75 Years and over | 1,343 (97.5%) | 1,941 (89.6%) |
| Total | 19,867 (94.9%) | 19,927 (93.4%) |
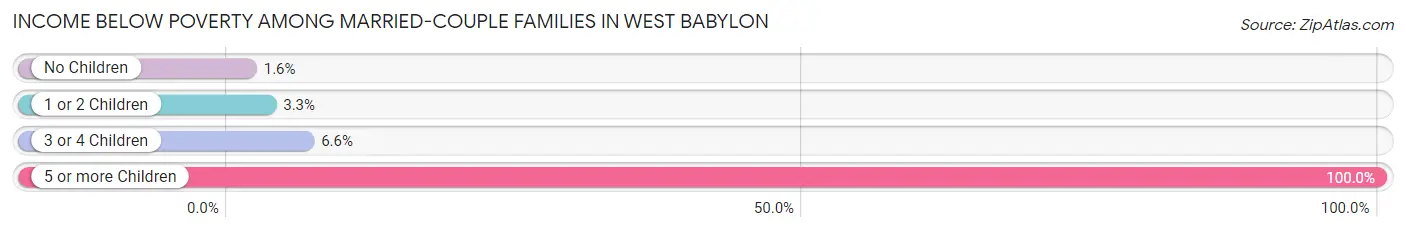
Income Below Poverty Among Married-Couple Families in West Babylon
The poverty statistics for married-couple families in West Babylon show that 2.6% or 186 of the total 7,035 families live below the poverty line. Families with 5 or more children have the highest poverty rate of 100.0%, comprising of 7 families. On the other hand, families with no children have the lowest poverty rate of 1.6%, which includes 68 families.
| Children | Above Poverty | Below Poverty |
| No Children | 4,107 (98.4%) | 68 (1.6%) |
| 1 or 2 Children | 2,291 (96.7%) | 79 (3.3%) |
| 3 or 4 Children | 451 (93.4%) | 32 (6.6%) |
| 5 or more Children | 0 (0.0%) | 7 (100.0%) |
| Total | 6,849 (97.4%) | 186 (2.6%) |
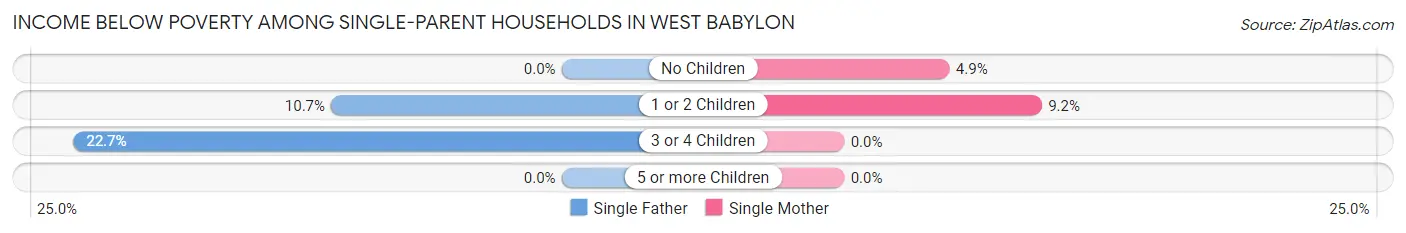
Income Below Poverty Among Single-Parent Households in West Babylon
According to the poverty data in West Babylon, 4.8% or 45 single-father households and 5.8% or 116 single-mother households are living below the poverty line. Among single-father households, those with 3 or 4 children have the highest poverty rate, with 10 households (22.7%) experiencing poverty. Likewise, among single-mother households, those with 1 or 2 children have the highest poverty rate, with 53 households (9.2%) falling below the poverty line.
| Children | Single Father | Single Mother |
| No Children | 0 (0.0%) | 63 (4.9%) |
| 1 or 2 Children | 35 (10.7%) | 53 (9.2%) |
| 3 or 4 Children | 10 (22.7%) | 0 (0.0%) |
| 5 or more Children | 0 (0.0%) | 0 (0.0%) |
| Total | 45 (4.8%) | 116 (5.8%) |
Income Below Poverty Among Married-Couple vs Single-Parent Households in West Babylon
The poverty data for West Babylon shows that 186 of the married-couple family households (2.6%) and 161 of the single-parent households (5.5%) are living below the poverty level. Within the married-couple family households, those with 5 or more children have the highest poverty rate, with 7 households (100.0%) falling below the poverty line. Among the single-parent households, those with 1 or 2 children have the highest poverty rate, with 88 household (9.8%) living below poverty.
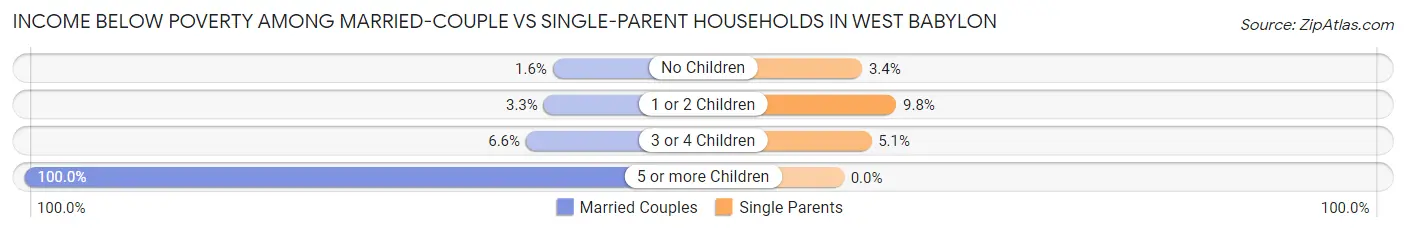
| Children | Married-Couple Families | Single-Parent Households |
| No Children | 68 (1.6%) | 63 (3.4%) |
| 1 or 2 Children | 79 (3.3%) | 88 (9.8%) |
| 3 or 4 Children | 32 (6.6%) | 10 (5.1%) |
| 5 or more Children | 7 (100.0%) | 0 (0.0%) |
| Total | 186 (2.6%) | 161 (5.5%) |
Employment Characteristics in West Babylon
Employment by Class of Employer in West Babylon
Among the 22,492 employed individuals in West Babylon, private company employees (14,622 | 65.0%), local government employees (2,524 | 11.2%), and not-for-profit organizations (2,174 | 9.7%) make up the most common classes of employment.
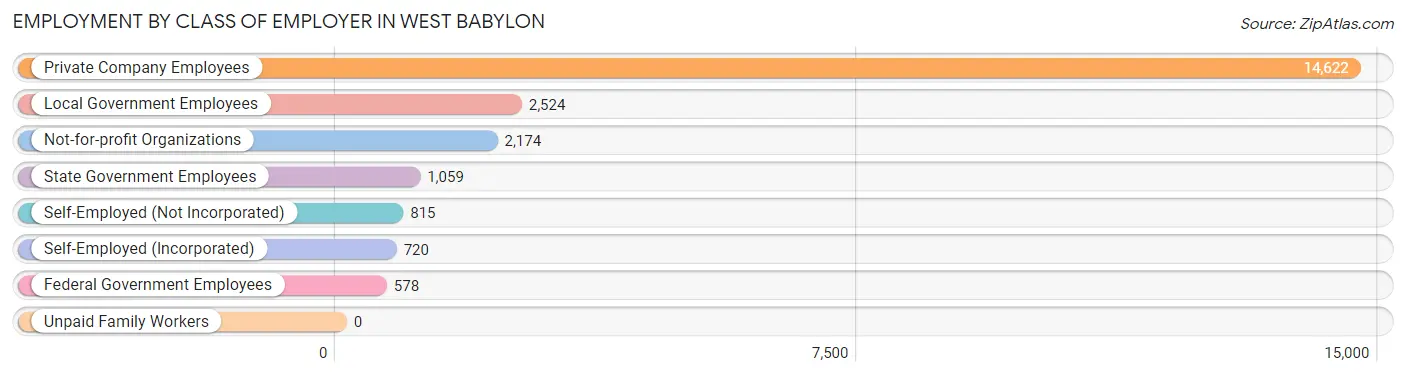
| Employer Class | # Employees | % Employees |
| Private Company Employees | 14,622 | 65.0% |
| Self-Employed (Incorporated) | 720 | 3.2% |
| Self-Employed (Not Incorporated) | 815 | 3.6% |
| Not-for-profit Organizations | 2,174 | 9.7% |
| Local Government Employees | 2,524 | 11.2% |
| State Government Employees | 1,059 | 4.7% |
| Federal Government Employees | 578 | 2.6% |
| Unpaid Family Workers | 0 | 0.0% |
| Total | 22,492 | 100.0% |
Employment Status by Age in West Babylon
According to the labor force statistics for West Babylon, out of the total population over 16 years of age (35,808), 68.3% or 24,457 individuals are in the labor force, with 6.9% or 1,688 of them unemployed. The age group with the highest labor force participation rate is 25 to 29 years, with 91.4% or 2,911 individuals in the labor force. Within the labor force, the 16 to 19 years age range has the highest percentage of unemployed individuals, with 21.5% or 195 of them being unemployed.
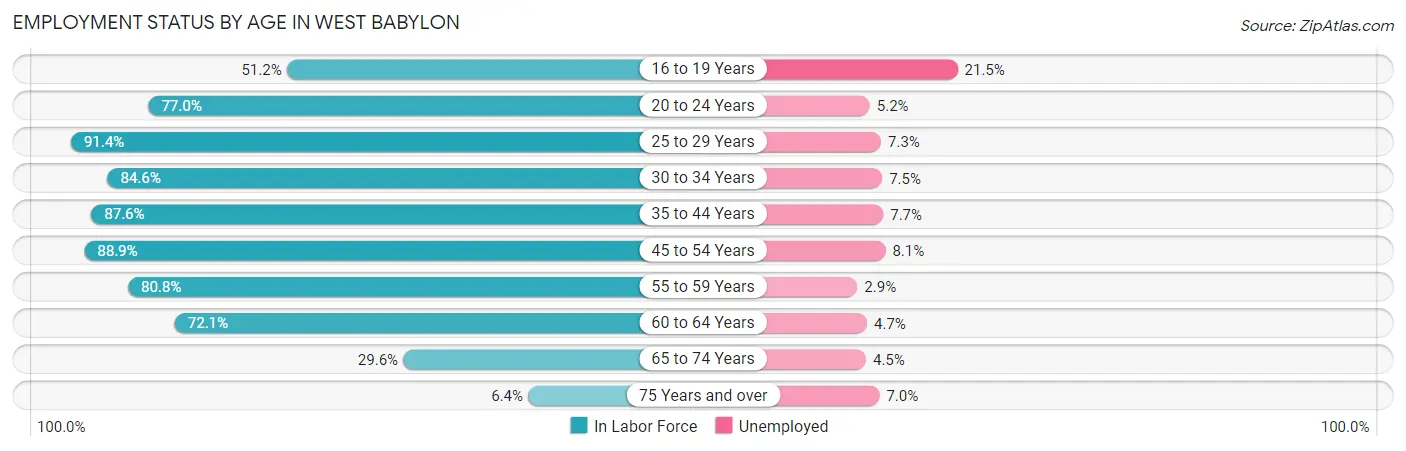
| Age Bracket | In Labor Force | Unemployed |
| 16 to 19 Years | 909 (51.2%) | 195 (21.5%) |
| 20 to 24 Years | 2,166 (77.0%) | 113 (5.2%) |
| 25 to 29 Years | 2,911 (91.4%) | 213 (7.3%) |
| 30 to 34 Years | 2,411 (84.6%) | 181 (7.5%) |
| 35 to 44 Years | 4,116 (87.6%) | 317 (7.7%) |
| 45 to 54 Years | 5,013 (88.9%) | 406 (8.1%) |
| 55 to 59 Years | 3,280 (80.8%) | 95 (2.9%) |
| 60 to 64 Years | 2,274 (72.1%) | 107 (4.7%) |
| 65 to 74 Years | 1,135 (29.6%) | 51 (4.5%) |
| 75 Years and over | 243 (6.4%) | 17 (7.0%) |
| Total | 24,457 (68.3%) | 1,688 (6.9%) |
Employment Status by Educational Attainment in West Babylon
According to labor force statistics for West Babylon, 84.8% of individuals (20,002) out of the total population between 25 and 64 years of age (23,587) are in the labor force, with 6.6% or 1,320 of them being unemployed. The group with the highest labor force participation rate are those with the educational attainment of bachelor's degree or higher, with 90.4% or 7,576 individuals in the labor force. Within the labor force, individuals with high school diploma education have the highest percentage of unemployment, with 11.0% or 575 of them being unemployed.
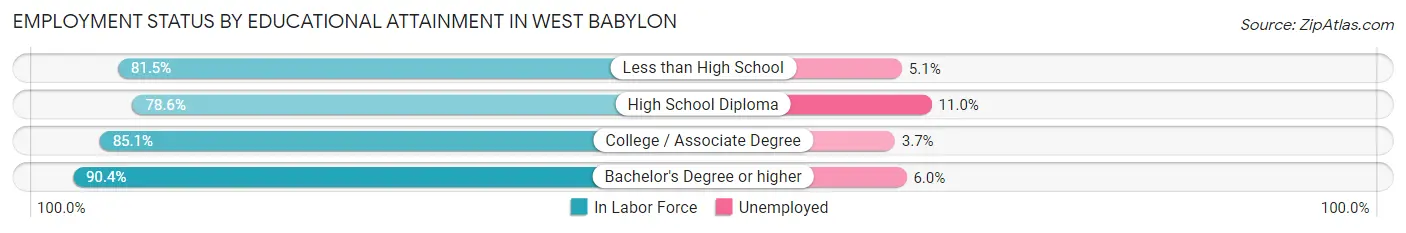
| Educational Attainment | In Labor Force | Unemployed |
| Less than High School | 1,675 (81.5%) | 105 (5.1%) |
| High School Diploma | 5,225 (78.6%) | 731 (11.0%) |
| College / Associate Degree | 5,535 (85.1%) | 241 (3.7%) |
| Bachelor's Degree or higher | 7,576 (90.4%) | 503 (6.0%) |
| Total | 20,002 (84.8%) | 1,557 (6.6%) |
Employment Occupations by Sex in West Babylon
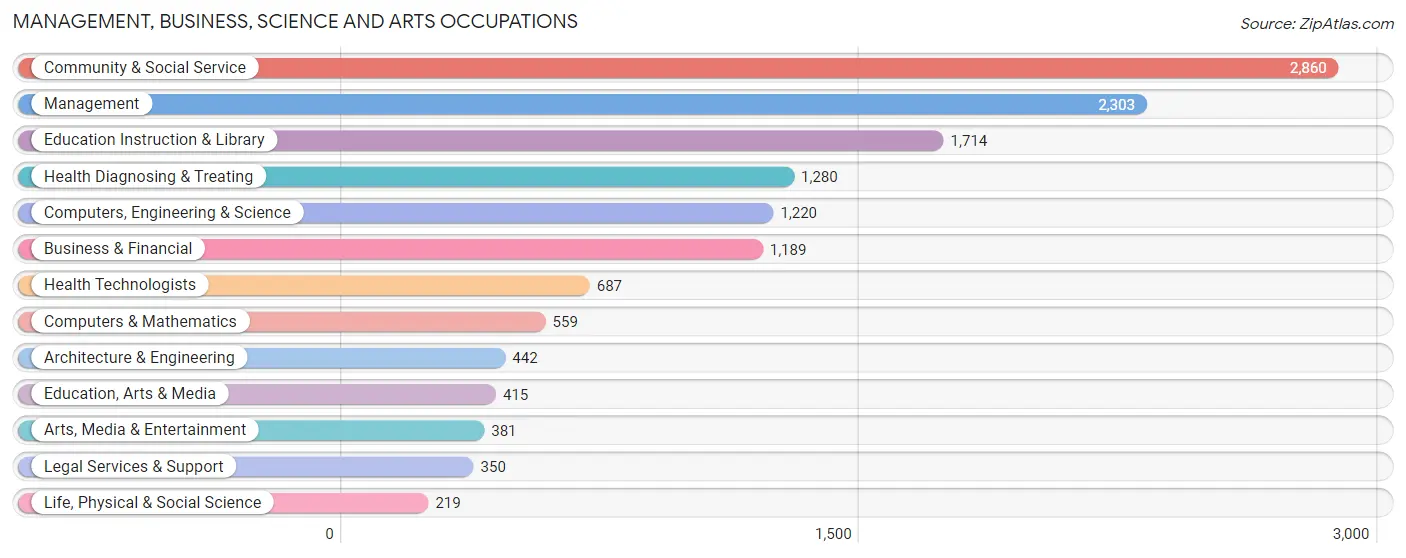
Management, Business, Science and Arts Occupations
The most common Management, Business, Science and Arts occupations in West Babylon are Community & Social Service (2,860 | 12.6%), Management (2,303 | 10.1%), Education Instruction & Library (1,714 | 7.5%), Health Diagnosing & Treating (1,280 | 5.6%), and Computers, Engineering & Science (1,220 | 5.4%).
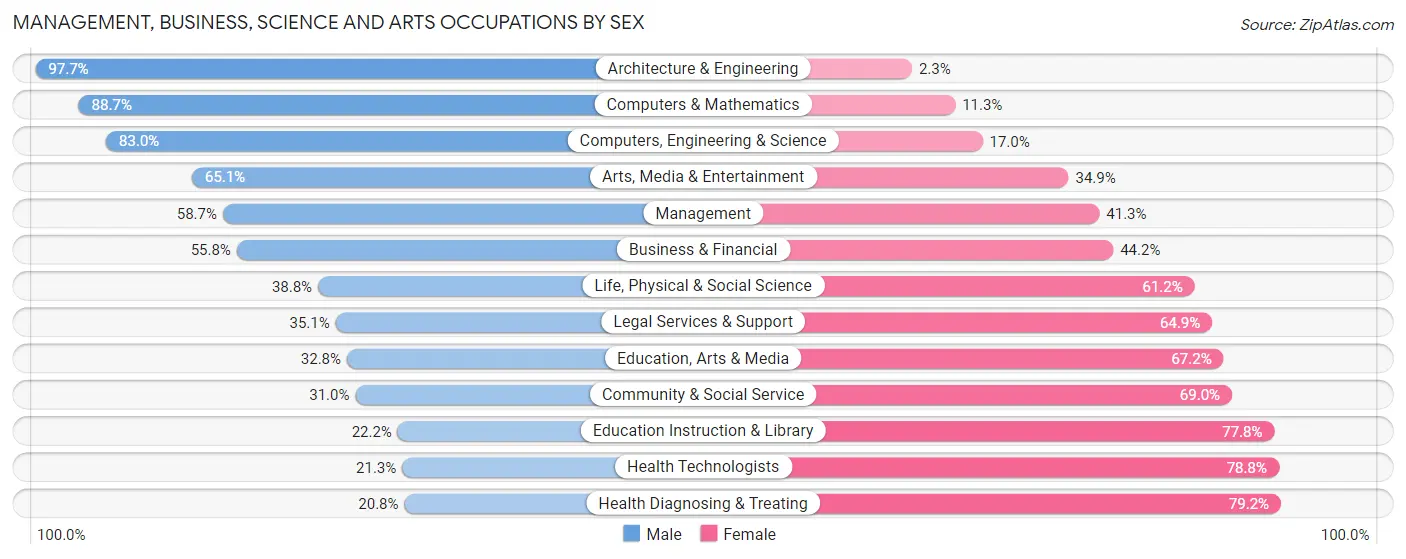
Management, Business, Science and Arts Occupations by Sex
Within the Management, Business, Science and Arts occupations in West Babylon, the most male-oriented occupations are Architecture & Engineering (97.7%), Computers & Mathematics (88.7%), and Computers, Engineering & Science (83.0%), while the most female-oriented occupations are Health Diagnosing & Treating (79.2%), Health Technologists (78.7%), and Education Instruction & Library (77.8%).
| Occupation | Male | Female |
| Management | 1,351 (58.7%) | 952 (41.3%) |
| Business & Financial | 663 (55.8%) | 526 (44.2%) |
| Computers, Engineering & Science | 1,013 (83.0%) | 207 (17.0%) |
| Computers & Mathematics | 496 (88.7%) | 63 (11.3%) |
| Architecture & Engineering | 432 (97.7%) | 10 (2.3%) |
| Life, Physical & Social Science | 85 (38.8%) | 134 (61.2%) |
| Community & Social Service | 887 (31.0%) | 1,973 (69.0%) |
| Education, Arts & Media | 136 (32.8%) | 279 (67.2%) |
| Legal Services & Support | 123 (35.1%) | 227 (64.9%) |
| Education Instruction & Library | 380 (22.2%) | 1,334 (77.8%) |
| Arts, Media & Entertainment | 248 (65.1%) | 133 (34.9%) |
| Health Diagnosing & Treating | 266 (20.8%) | 1,014 (79.2%) |
| Health Technologists | 146 (21.2%) | 541 (78.7%) |
| Total (Category) | 4,180 (47.2%) | 4,672 (52.8%) |
| Total (Overall) | 11,763 (51.7%) | 10,993 (48.3%) |
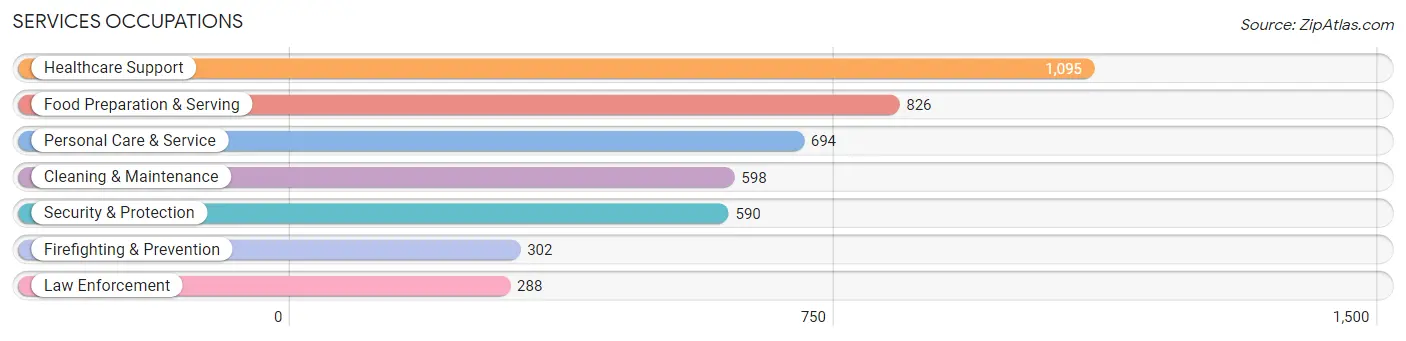
Services Occupations
The most common Services occupations in West Babylon are Healthcare Support (1,095 | 4.8%), Food Preparation & Serving (826 | 3.6%), Personal Care & Service (694 | 3.0%), Cleaning & Maintenance (598 | 2.6%), and Security & Protection (590 | 2.6%).
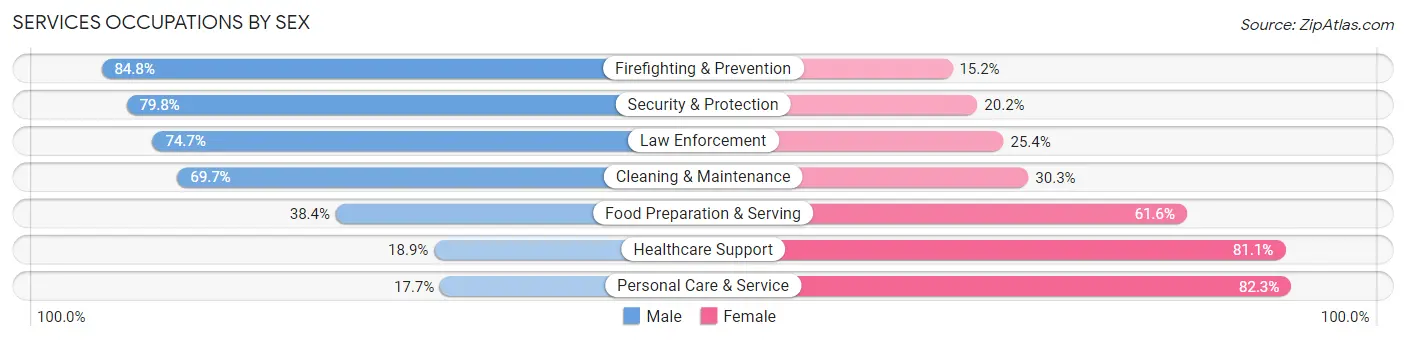
Services Occupations by Sex
Within the Services occupations in West Babylon, the most male-oriented occupations are Firefighting & Prevention (84.8%), Security & Protection (79.8%), and Law Enforcement (74.7%), while the most female-oriented occupations are Personal Care & Service (82.3%), Healthcare Support (81.1%), and Food Preparation & Serving (61.6%).
| Occupation | Male | Female |
| Healthcare Support | 207 (18.9%) | 888 (81.1%) |
| Security & Protection | 471 (79.8%) | 119 (20.2%) |
| Firefighting & Prevention | 256 (84.8%) | 46 (15.2%) |
| Law Enforcement | 215 (74.7%) | 73 (25.4%) |
| Food Preparation & Serving | 317 (38.4%) | 509 (61.6%) |
| Cleaning & Maintenance | 417 (69.7%) | 181 (30.3%) |
| Personal Care & Service | 123 (17.7%) | 571 (82.3%) |
| Total (Category) | 1,535 (40.4%) | 2,268 (59.6%) |
| Total (Overall) | 11,763 (51.7%) | 10,993 (48.3%) |
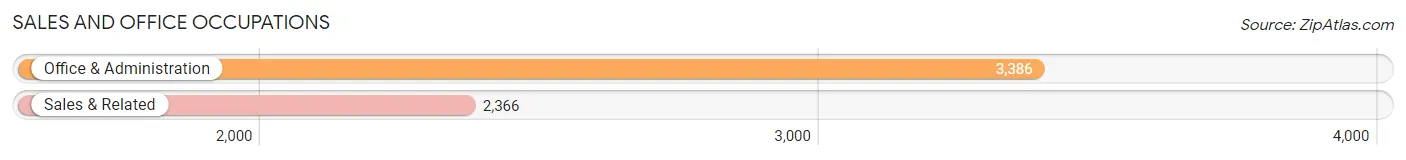
Sales and Office Occupations
The most common Sales and Office occupations in West Babylon are Office & Administration (3,386 | 14.9%), and Sales & Related (2,366 | 10.4%).
Sales and Office Occupations by Sex
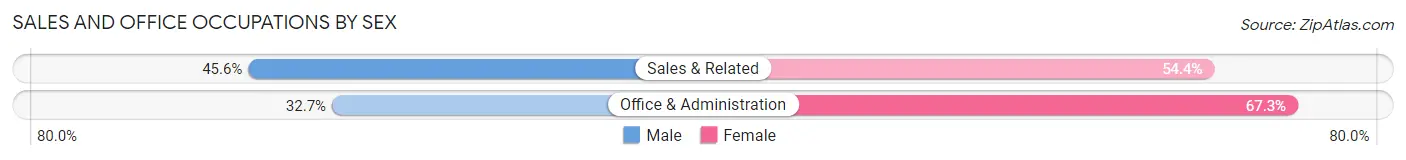
| Occupation | Male | Female |
| Sales & Related | 1,079 (45.6%) | 1,287 (54.4%) |
| Office & Administration | 1,108 (32.7%) | 2,278 (67.3%) |
| Total (Category) | 2,187 (38.0%) | 3,565 (62.0%) |
| Total (Overall) | 11,763 (51.7%) | 10,993 (48.3%) |
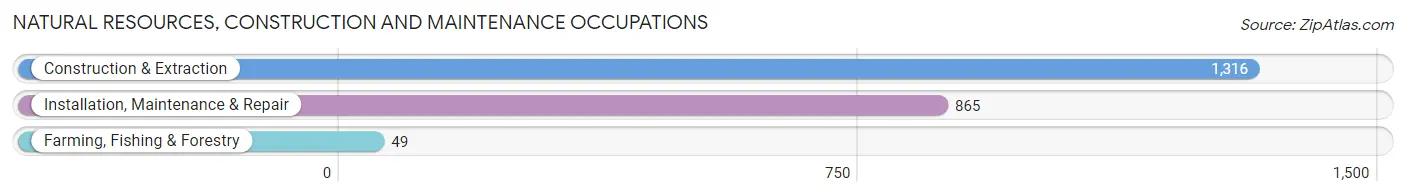
Natural Resources, Construction and Maintenance Occupations
The most common Natural Resources, Construction and Maintenance occupations in West Babylon are Construction & Extraction (1,316 | 5.8%), Installation, Maintenance & Repair (865 | 3.8%), and Farming, Fishing & Forestry (49 | 0.2%).
Natural Resources, Construction and Maintenance Occupations by Sex
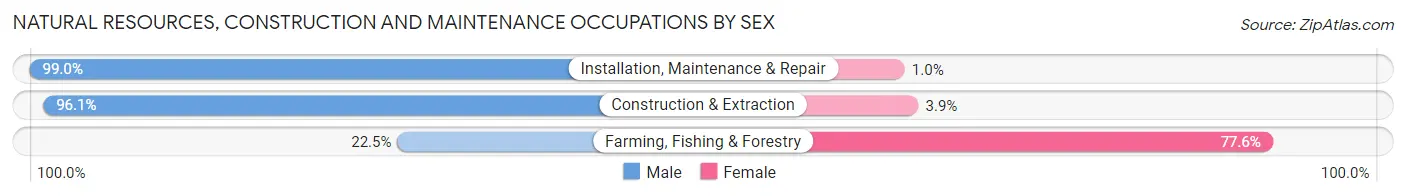
| Occupation | Male | Female |
| Farming, Fishing & Forestry | 11 (22.5%) | 38 (77.5%) |
| Construction & Extraction | 1,265 (96.1%) | 51 (3.9%) |
| Installation, Maintenance & Repair | 856 (99.0%) | 9 (1.0%) |
| Total (Category) | 2,132 (95.6%) | 98 (4.4%) |
| Total (Overall) | 11,763 (51.7%) | 10,993 (48.3%) |
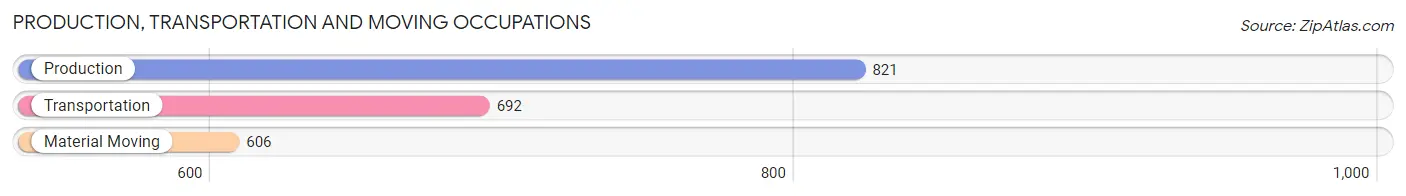
Production, Transportation and Moving Occupations
The most common Production, Transportation and Moving occupations in West Babylon are Production (821 | 3.6%), Transportation (692 | 3.0%), and Material Moving (606 | 2.7%).
Production, Transportation and Moving Occupations by Sex
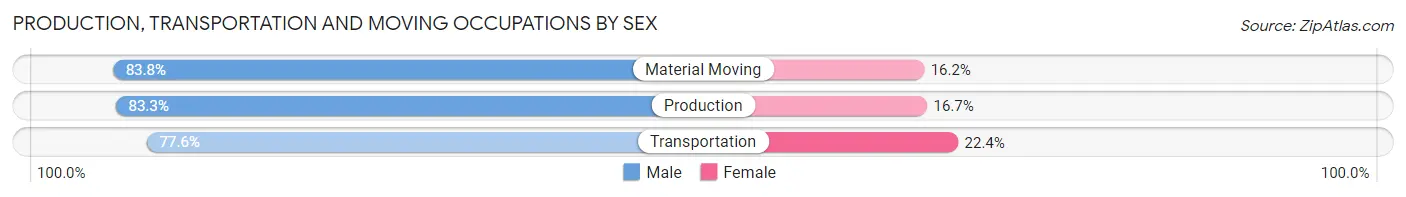
| Occupation | Male | Female |
| Production | 684 (83.3%) | 137 (16.7%) |
| Transportation | 537 (77.6%) | 155 (22.4%) |
| Material Moving | 508 (83.8%) | 98 (16.2%) |
| Total (Category) | 1,729 (81.6%) | 390 (18.4%) |
| Total (Overall) | 11,763 (51.7%) | 10,993 (48.3%) |
Employment Industries by Sex in West Babylon
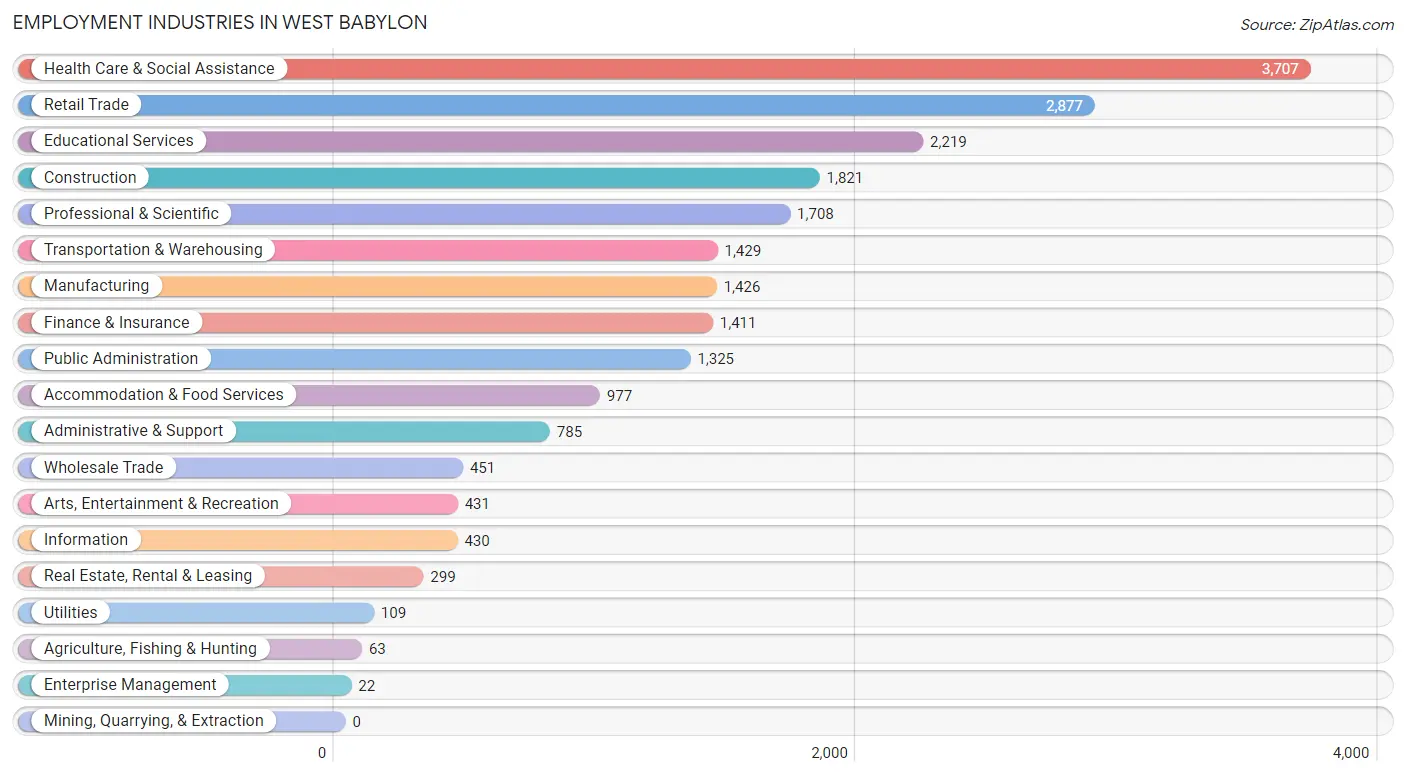
Employment Industries in West Babylon
The major employment industries in West Babylon include Health Care & Social Assistance (3,707 | 16.3%), Retail Trade (2,877 | 12.6%), Educational Services (2,219 | 9.8%), Construction (1,821 | 8.0%), and Professional & Scientific (1,708 | 7.5%).
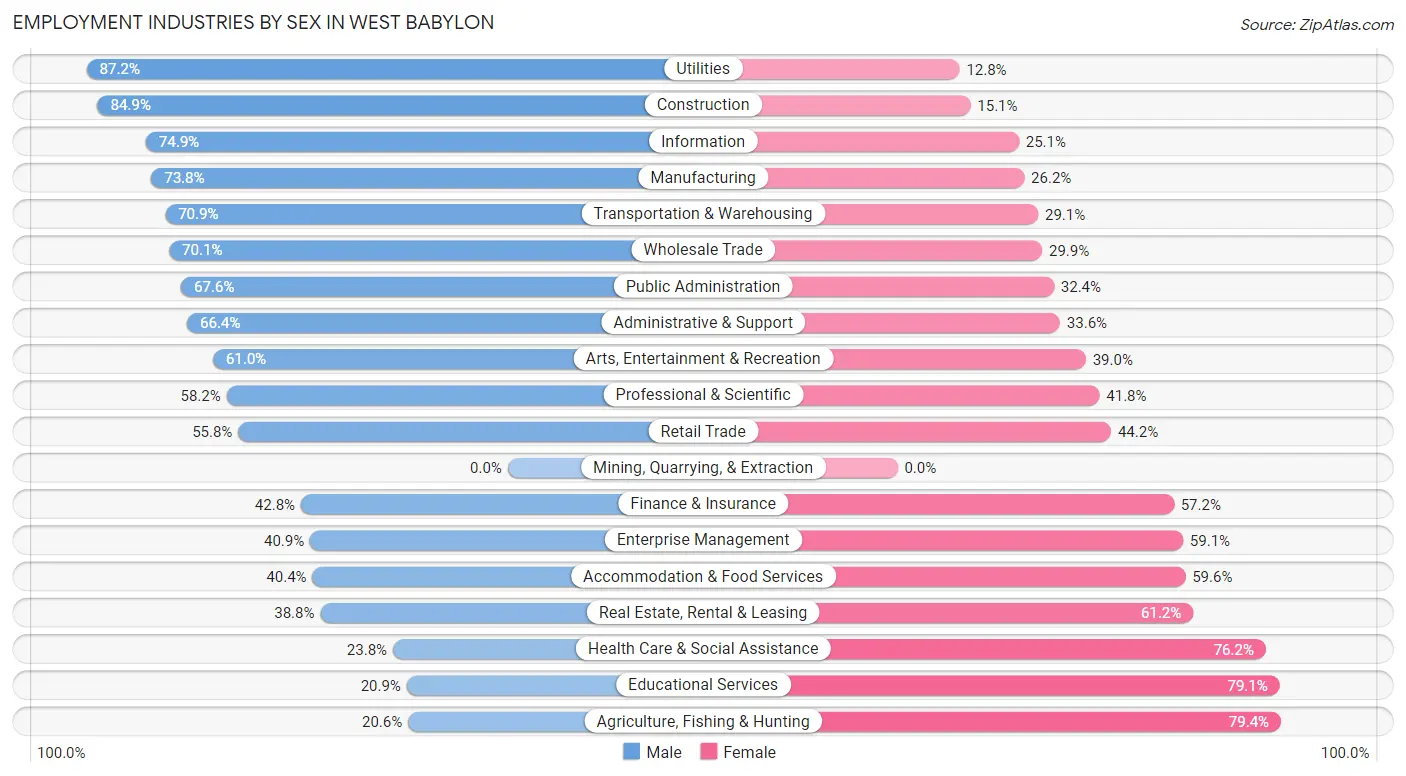
Employment Industries by Sex in West Babylon
The West Babylon industries that see more men than women are Utilities (87.2%), Construction (84.9%), and Information (74.9%), whereas the industries that tend to have a higher number of women are Agriculture, Fishing & Hunting (79.4%), Educational Services (79.1%), and Health Care & Social Assistance (76.2%).
| Industry | Male | Female |
| Agriculture, Fishing & Hunting | 13 (20.6%) | 50 (79.4%) |
| Mining, Quarrying, & Extraction | 0 (0.0%) | 0 (0.0%) |
| Construction | 1,546 (84.9%) | 275 (15.1%) |
| Manufacturing | 1,052 (73.8%) | 374 (26.2%) |
| Wholesale Trade | 316 (70.1%) | 135 (29.9%) |
| Retail Trade | 1,605 (55.8%) | 1,272 (44.2%) |
| Transportation & Warehousing | 1,013 (70.9%) | 416 (29.1%) |
| Utilities | 95 (87.2%) | 14 (12.8%) |
| Information | 322 (74.9%) | 108 (25.1%) |
| Finance & Insurance | 604 (42.8%) | 807 (57.2%) |
| Real Estate, Rental & Leasing | 116 (38.8%) | 183 (61.2%) |
| Professional & Scientific | 994 (58.2%) | 714 (41.8%) |
| Enterprise Management | 9 (40.9%) | 13 (59.1%) |
| Administrative & Support | 521 (66.4%) | 264 (33.6%) |
| Educational Services | 464 (20.9%) | 1,755 (79.1%) |
| Health Care & Social Assistance | 881 (23.8%) | 2,826 (76.2%) |
| Arts, Entertainment & Recreation | 263 (61.0%) | 168 (39.0%) |
| Accommodation & Food Services | 395 (40.4%) | 582 (59.6%) |
| Public Administration | 896 (67.6%) | 429 (32.4%) |
| Total | 11,763 (51.7%) | 10,993 (48.3%) |
Education in West Babylon
School Enrollment in West Babylon
The most common levels of schooling among the 9,352 students in West Babylon are college / undergraduate (2,448 | 26.2%), middle school (2,143 | 22.9%), and high school (1,873 | 20.0%).
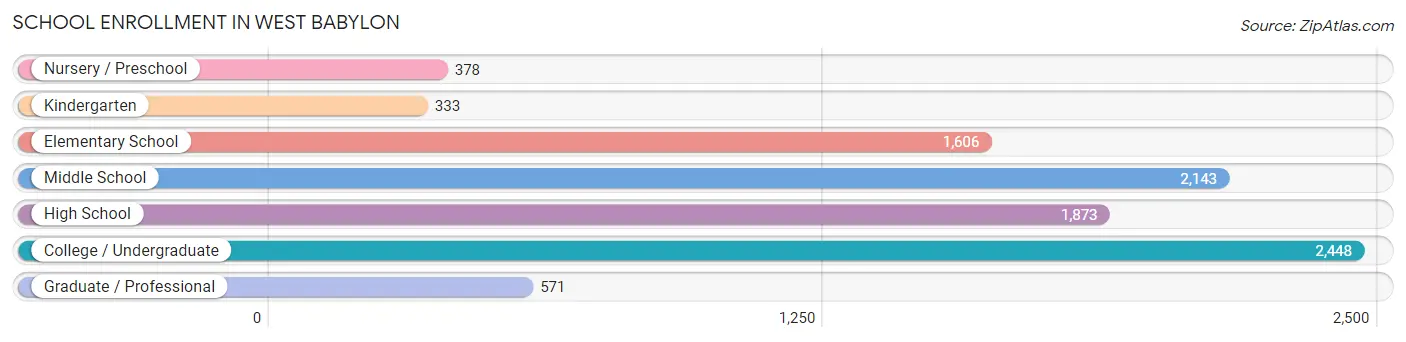
| School Level | # Students | % Students |
| Nursery / Preschool | 378 | 4.0% |
| Kindergarten | 333 | 3.6% |
| Elementary School | 1,606 | 17.2% |
| Middle School | 2,143 | 22.9% |
| High School | 1,873 | 20.0% |
| College / Undergraduate | 2,448 | 26.2% |
| Graduate / Professional | 571 | 6.1% |
| Total | 9,352 | 100.0% |
School Enrollment by Age by Funding Source in West Babylon
Out of a total of 9,352 students who are enrolled in schools in West Babylon, 1,637 (17.5%) attend a private institution, while the remaining 7,715 (82.5%) are enrolled in public schools. The age group of 3 to 4 year olds has the highest likelihood of being enrolled in private schools, with 186 (52.7% in the age bracket) enrolled. Conversely, the age group of 5 to 9 year old has the lowest likelihood of being enrolled in a private school, with 1,730 (96.2% in the age bracket) attending a public institution.
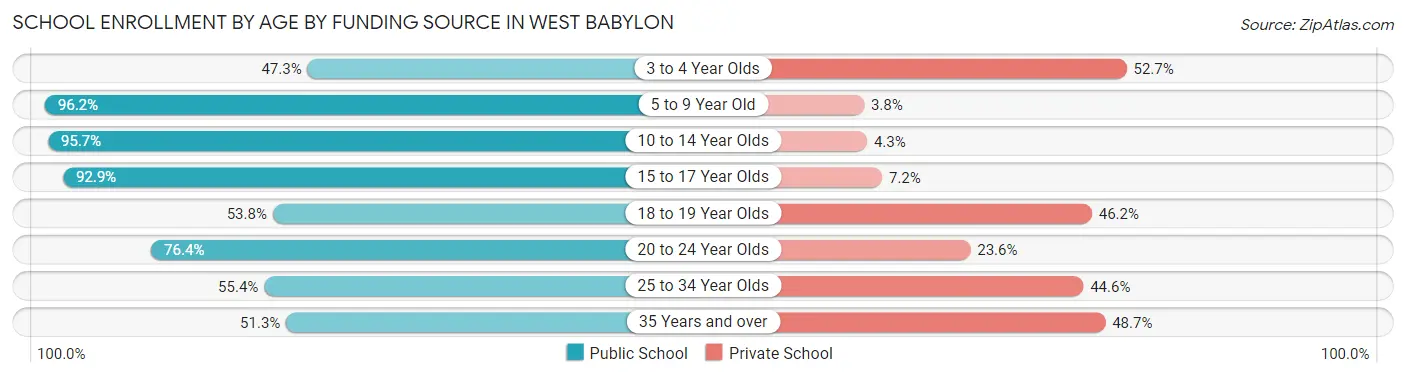
| Age Bracket | Public School | Private School |
| 3 to 4 Year Olds | 167 (47.3%) | 186 (52.7%) |
| 5 to 9 Year Old | 1,730 (96.2%) | 68 (3.8%) |
| 10 to 14 Year Olds | 2,446 (95.7%) | 111 (4.3%) |
| 15 to 17 Year Olds | 1,312 (92.8%) | 101 (7.1%) |
| 18 to 19 Year Olds | 320 (53.8%) | 275 (46.2%) |
| 20 to 24 Year Olds | 1,079 (76.4%) | 333 (23.6%) |
| 25 to 34 Year Olds | 396 (55.4%) | 319 (44.6%) |
| 35 Years and over | 261 (51.3%) | 248 (48.7%) |
| Total | 7,715 (82.5%) | 1,637 (17.5%) |
Educational Attainment by Field of Study in West Babylon
Business (2,320 | 22.0%), education (1,448 | 13.8%), science & technology (1,228 | 11.7%), social sciences (770 | 7.3%), and arts & humanities (687 | 6.5%) are the most common fields of study among 10,524 individuals in West Babylon who have obtained a bachelor's degree or higher.
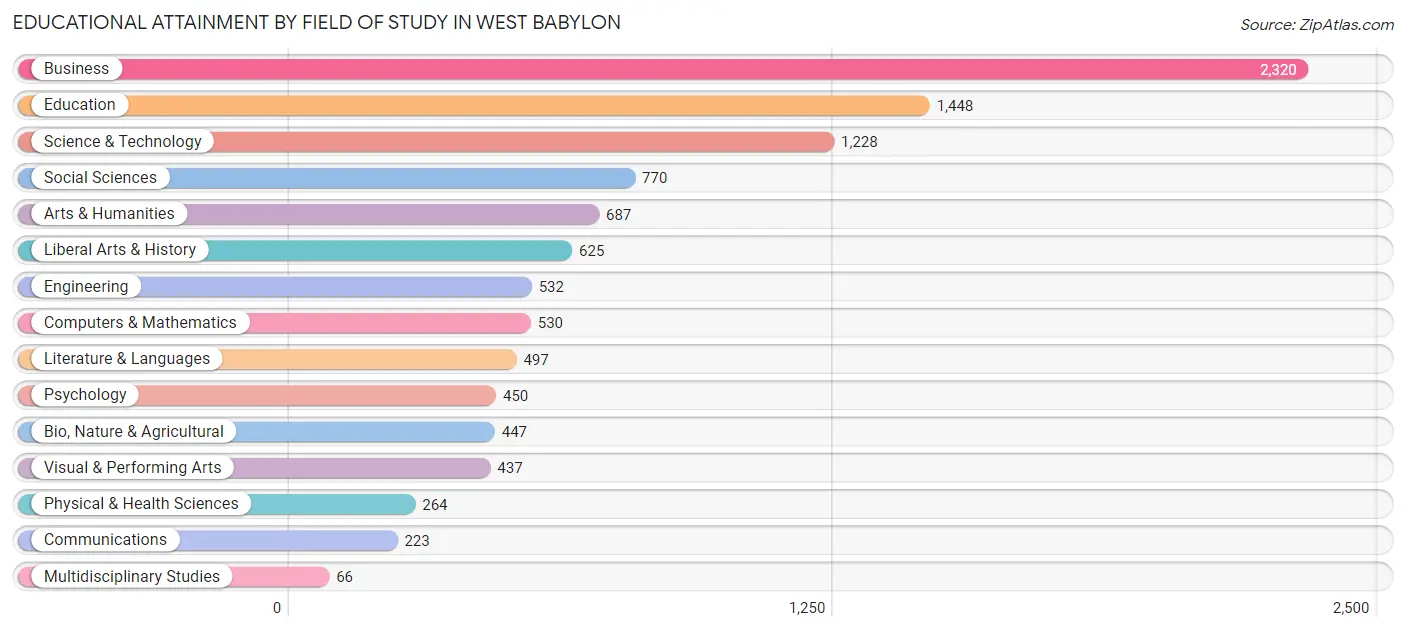
| Field of Study | # Graduates | % Graduates |
| Computers & Mathematics | 530 | 5.0% |
| Bio, Nature & Agricultural | 447 | 4.3% |
| Physical & Health Sciences | 264 | 2.5% |
| Psychology | 450 | 4.3% |
| Social Sciences | 770 | 7.3% |
| Engineering | 532 | 5.1% |
| Multidisciplinary Studies | 66 | 0.6% |
| Science & Technology | 1,228 | 11.7% |
| Business | 2,320 | 22.0% |
| Education | 1,448 | 13.8% |
| Literature & Languages | 497 | 4.7% |
| Liberal Arts & History | 625 | 5.9% |
| Visual & Performing Arts | 437 | 4.2% |
| Communications | 223 | 2.1% |
| Arts & Humanities | 687 | 6.5% |
| Total | 10,524 | 100.0% |
Transportation & Commute in West Babylon
Vehicle Availability by Sex in West Babylon
The most prevalent vehicle ownership categories in West Babylon are males with 2 vehicles (4,128, accounting for 35.6%) and females with 2 vehicles (4,150, making up 38.0%).
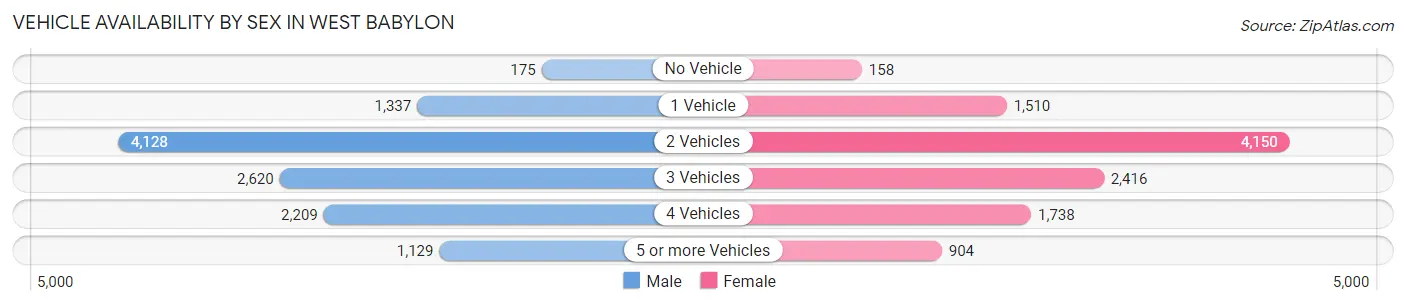
| Vehicles Available | Male | Female |
| No Vehicle | 175 (1.5%) | 158 (1.5%) |
| 1 Vehicle | 1,337 (11.5%) | 1,510 (13.9%) |
| 2 Vehicles | 4,128 (35.6%) | 4,150 (38.2%) |
| 3 Vehicles | 2,620 (22.6%) | 2,416 (22.2%) |
| 4 Vehicles | 2,209 (19.1%) | 1,738 (16.0%) |
| 5 or more Vehicles | 1,129 (9.7%) | 904 (8.3%) |
| Total | 11,598 (100.0%) | 10,876 (100.0%) |
Commute Time in West Babylon
The most frequently occuring commute durations in West Babylon are 15 to 19 minutes (3,001 commuters, 14.4%), 20 to 24 minutes (2,802 commuters, 13.4%), and 10 to 14 minutes (2,611 commuters, 12.5%).
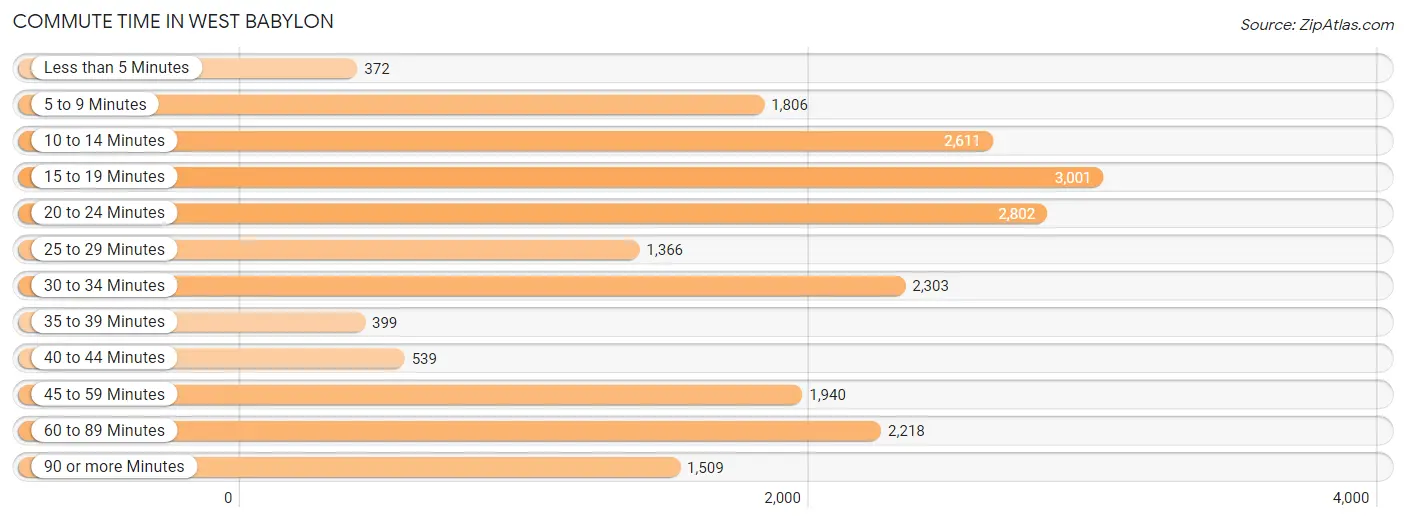
| Commute Time | # Commuters | % Commuters |
| Less than 5 Minutes | 372 | 1.8% |
| 5 to 9 Minutes | 1,806 | 8.7% |
| 10 to 14 Minutes | 2,611 | 12.5% |
| 15 to 19 Minutes | 3,001 | 14.4% |
| 20 to 24 Minutes | 2,802 | 13.4% |
| 25 to 29 Minutes | 1,366 | 6.6% |
| 30 to 34 Minutes | 2,303 | 11.0% |
| 35 to 39 Minutes | 399 | 1.9% |
| 40 to 44 Minutes | 539 | 2.6% |
| 45 to 59 Minutes | 1,940 | 9.3% |
| 60 to 89 Minutes | 2,218 | 10.6% |
| 90 or more Minutes | 1,509 | 7.2% |
Commute Time by Sex in West Babylon
The most common commute times in West Babylon are 15 to 19 minutes (1,648 commuters, 15.2%) for males and 15 to 19 minutes (1,353 commuters, 13.5%) for females.
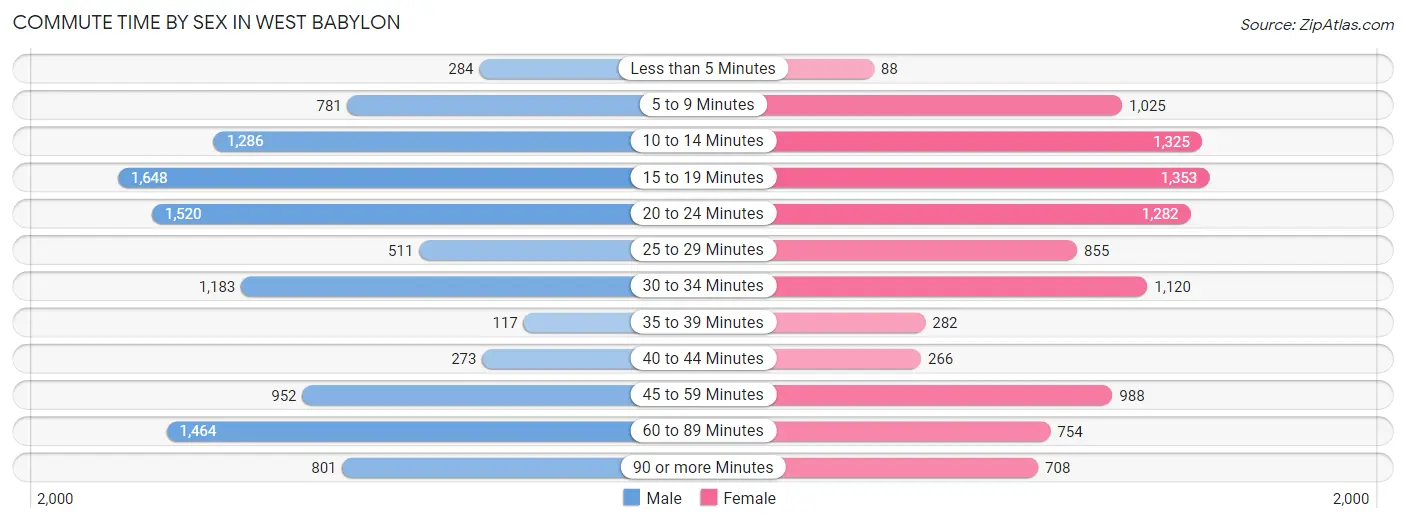
| Commute Time | Male | Female |
| Less than 5 Minutes | 284 (2.6%) | 88 (0.9%) |
| 5 to 9 Minutes | 781 (7.2%) | 1,025 (10.2%) |
| 10 to 14 Minutes | 1,286 (11.9%) | 1,325 (13.2%) |
| 15 to 19 Minutes | 1,648 (15.2%) | 1,353 (13.5%) |
| 20 to 24 Minutes | 1,520 (14.1%) | 1,282 (12.8%) |
| 25 to 29 Minutes | 511 (4.7%) | 855 (8.5%) |
| 30 to 34 Minutes | 1,183 (10.9%) | 1,120 (11.2%) |
| 35 to 39 Minutes | 117 (1.1%) | 282 (2.8%) |
| 40 to 44 Minutes | 273 (2.5%) | 266 (2.6%) |
| 45 to 59 Minutes | 952 (8.8%) | 988 (9.8%) |
| 60 to 89 Minutes | 1,464 (13.5%) | 754 (7.5%) |
| 90 or more Minutes | 801 (7.4%) | 708 (7.0%) |
Time of Departure to Work by Sex in West Babylon
The most frequent times of departure to work in West Babylon are 8:00 AM to 8:29 AM (1,573, 14.5%) for males and 8:00 AM to 8:29 AM (1,297, 12.9%) for females.
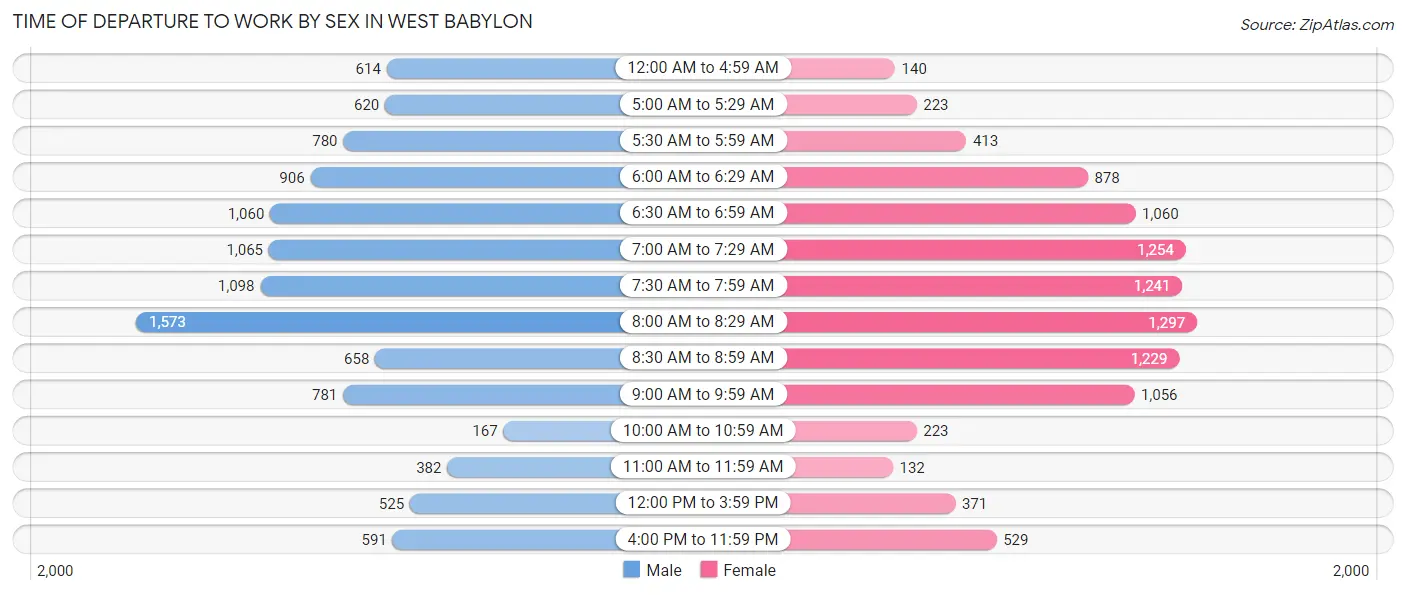
| Time of Departure | Male | Female |
| 12:00 AM to 4:59 AM | 614 (5.7%) | 140 (1.4%) |
| 5:00 AM to 5:29 AM | 620 (5.7%) | 223 (2.2%) |
| 5:30 AM to 5:59 AM | 780 (7.2%) | 413 (4.1%) |
| 6:00 AM to 6:29 AM | 906 (8.4%) | 878 (8.7%) |
| 6:30 AM to 6:59 AM | 1,060 (9.8%) | 1,060 (10.5%) |
| 7:00 AM to 7:29 AM | 1,065 (9.8%) | 1,254 (12.5%) |
| 7:30 AM to 7:59 AM | 1,098 (10.2%) | 1,241 (12.3%) |
| 8:00 AM to 8:29 AM | 1,573 (14.5%) | 1,297 (12.9%) |
| 8:30 AM to 8:59 AM | 658 (6.1%) | 1,229 (12.2%) |
| 9:00 AM to 9:59 AM | 781 (7.2%) | 1,056 (10.5%) |
| 10:00 AM to 10:59 AM | 167 (1.5%) | 223 (2.2%) |
| 11:00 AM to 11:59 AM | 382 (3.5%) | 132 (1.3%) |
| 12:00 PM to 3:59 PM | 525 (4.9%) | 371 (3.7%) |
| 4:00 PM to 11:59 PM | 591 (5.5%) | 529 (5.3%) |
| Total | 10,820 (100.0%) | 10,046 (100.0%) |
Housing Occupancy in West Babylon
Occupancy by Ownership in West Babylon
Of the total 13,957 dwellings in West Babylon, owner-occupied units account for 10,705 (76.7%), while renter-occupied units make up 3,252 (23.3%).
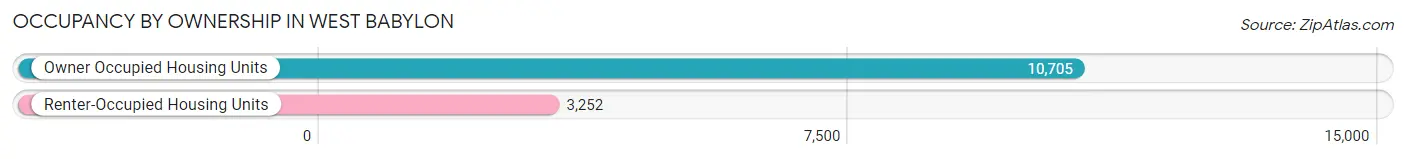
| Occupancy | # Housing Units | % Housing Units |
| Owner Occupied Housing Units | 10,705 | 76.7% |
| Renter-Occupied Housing Units | 3,252 | 23.3% |
| Total Occupied Housing Units | 13,957 | 100.0% |
Occupancy by Household Size in West Babylon
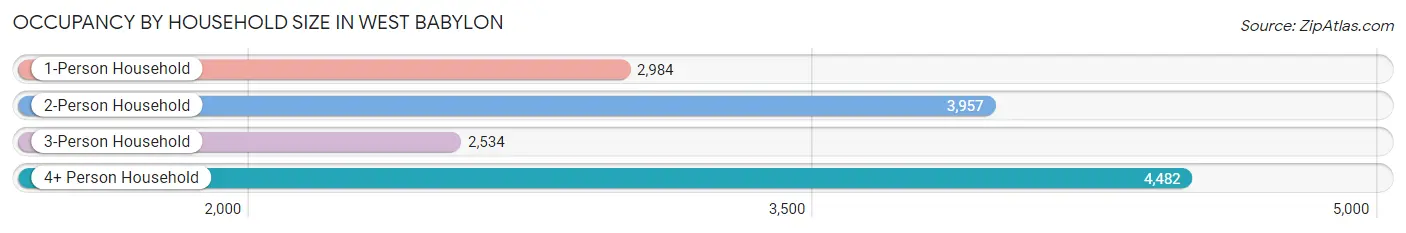
| Household Size | # Housing Units | % Housing Units |
| 1-Person Household | 2,984 | 21.4% |
| 2-Person Household | 3,957 | 28.3% |
| 3-Person Household | 2,534 | 18.2% |
| 4+ Person Household | 4,482 | 32.1% |
| Total Housing Units | 13,957 | 100.0% |
Occupancy by Ownership by Household Size in West Babylon
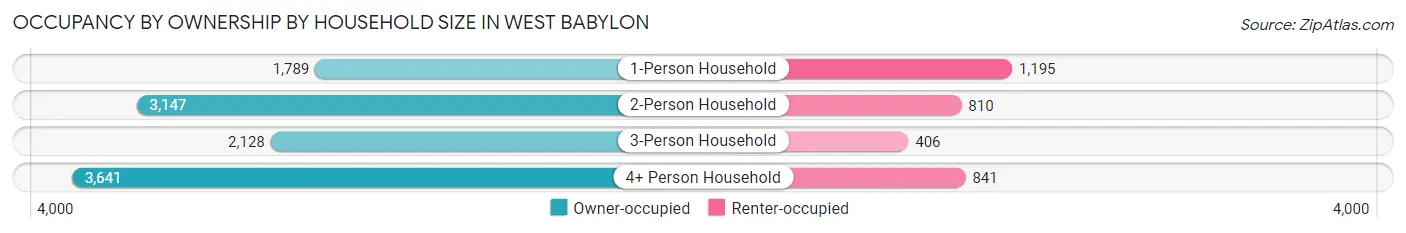
| Household Size | Owner-occupied | Renter-occupied |
| 1-Person Household | 1,789 (60.0%) | 1,195 (40.1%) |
| 2-Person Household | 3,147 (79.5%) | 810 (20.5%) |
| 3-Person Household | 2,128 (84.0%) | 406 (16.0%) |
| 4+ Person Household | 3,641 (81.2%) | 841 (18.8%) |
| Total Housing Units | 10,705 (76.7%) | 3,252 (23.3%) |
Occupancy by Educational Attainment in West Babylon
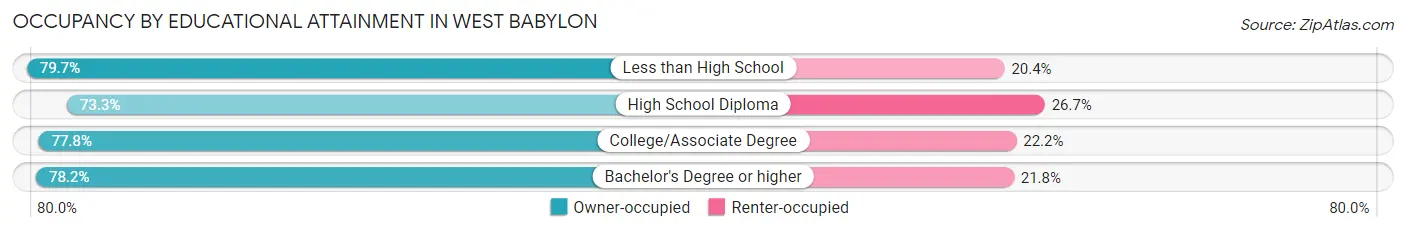
| Household Size | Owner-occupied | Renter-occupied |
| Less than High School | 853 (79.6%) | 218 (20.3%) |
| High School Diploma | 3,042 (73.3%) | 1,110 (26.7%) |
| College/Associate Degree | 3,486 (77.8%) | 996 (22.2%) |
| Bachelor's Degree or higher | 3,324 (78.2%) | 928 (21.8%) |
Occupancy by Age of Householder in West Babylon
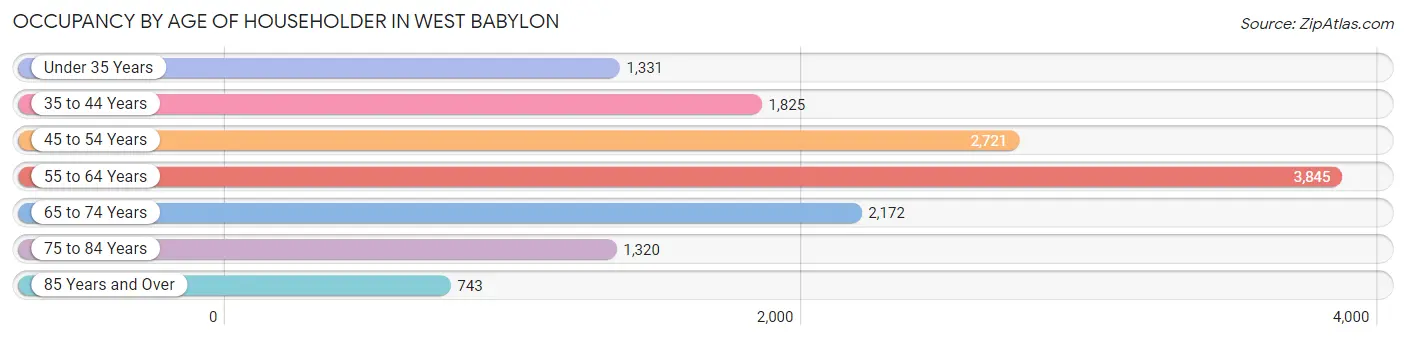
| Age Bracket | # Households | % Households |
| Under 35 Years | 1,331 | 9.5% |
| 35 to 44 Years | 1,825 | 13.1% |
| 45 to 54 Years | 2,721 | 19.5% |
| 55 to 64 Years | 3,845 | 27.6% |
| 65 to 74 Years | 2,172 | 15.6% |
| 75 to 84 Years | 1,320 | 9.5% |
| 85 Years and Over | 743 | 5.3% |
| Total | 13,957 | 100.0% |
Housing Finances in West Babylon
Median Income by Occupancy in West Babylon
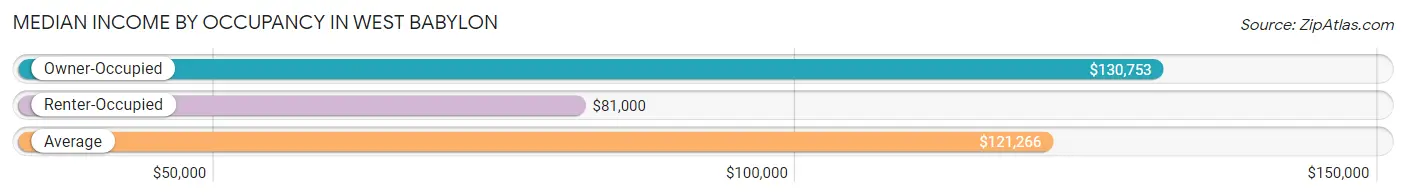
| Occupancy Type | # Households | Median Income |
| Owner-Occupied | 10,705 (76.7%) | $130,753 |
| Renter-Occupied | 3,252 (23.3%) | $81,000 |
| Average | 13,957 (100.0%) | $121,266 |
Occupancy by Householder Income Bracket in West Babylon
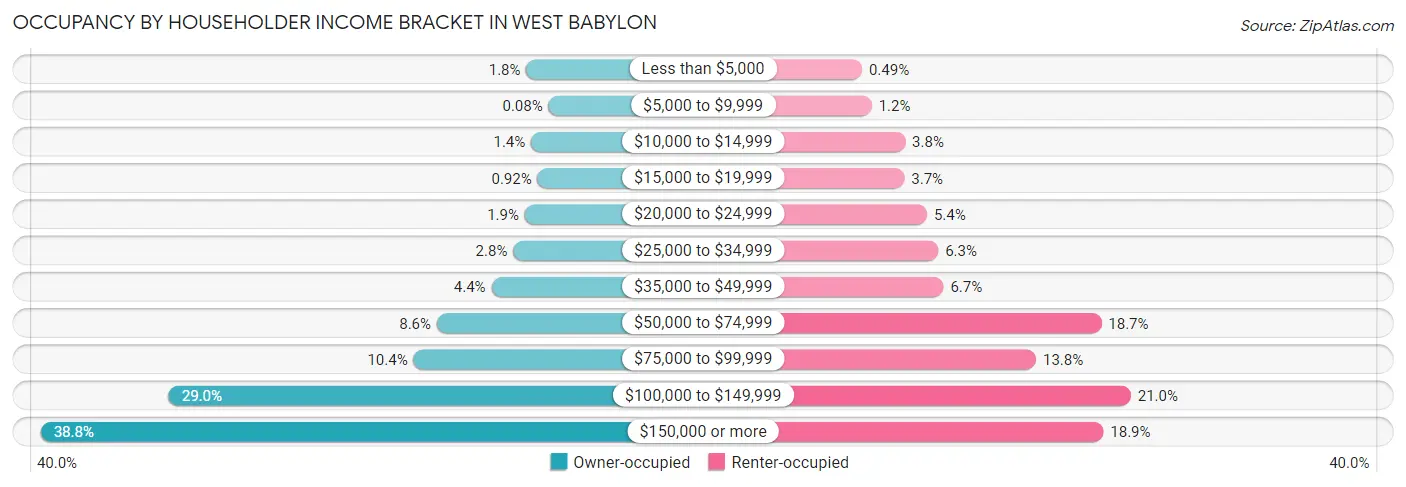
| Income Bracket | Owner-occupied | Renter-occupied |
| Less than $5,000 | 190 (1.8%) | 16 (0.5%) |
| $5,000 to $9,999 | 9 (0.1%) | 40 (1.2%) |
| $10,000 to $14,999 | 151 (1.4%) | 123 (3.8%) |
| $15,000 to $19,999 | 98 (0.9%) | 121 (3.7%) |
| $20,000 to $24,999 | 202 (1.9%) | 177 (5.4%) |
| $25,000 to $34,999 | 296 (2.8%) | 205 (6.3%) |
| $35,000 to $49,999 | 474 (4.4%) | 218 (6.7%) |
| $50,000 to $74,999 | 920 (8.6%) | 609 (18.7%) |
| $75,000 to $99,999 | 1,110 (10.4%) | 447 (13.8%) |
| $100,000 to $149,999 | 3,105 (29.0%) | 682 (21.0%) |
| $150,000 or more | 4,150 (38.8%) | 614 (18.9%) |
| Total | 10,705 (100.0%) | 3,252 (100.0%) |
Monthly Housing Cost Tiers in West Babylon
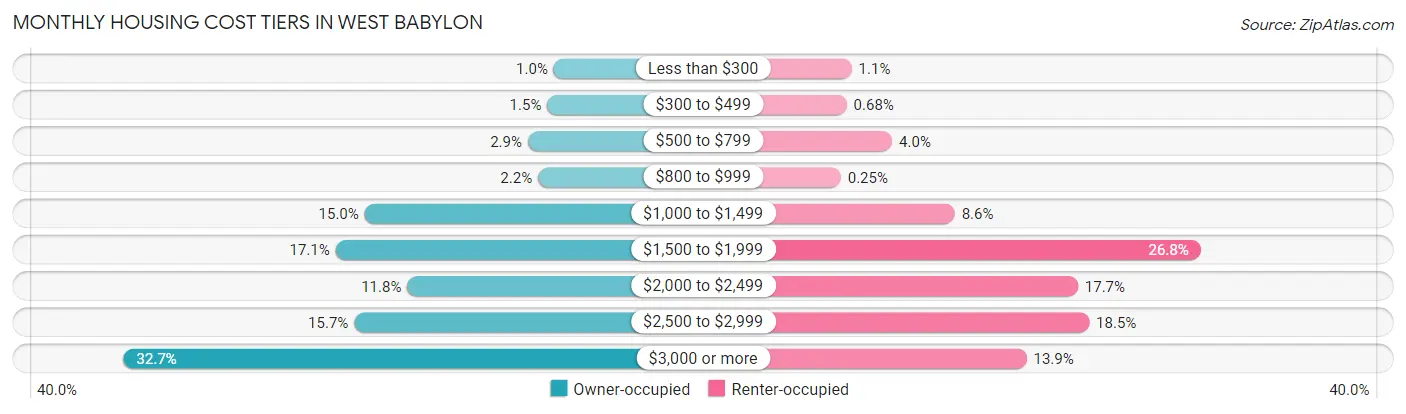
| Monthly Cost | Owner-occupied | Renter-occupied |
| Less than $300 | 110 (1.0%) | 34 (1.1%) |
| $300 to $499 | 162 (1.5%) | 22 (0.7%) |
| $500 to $799 | 315 (2.9%) | 131 (4.0%) |
| $800 to $999 | 234 (2.2%) | 8 (0.3%) |
| $1,000 to $1,499 | 1,601 (15.0%) | 281 (8.6%) |
| $1,500 to $1,999 | 1,831 (17.1%) | 870 (26.8%) |
| $2,000 to $2,499 | 1,265 (11.8%) | 576 (17.7%) |
| $2,500 to $2,999 | 1,684 (15.7%) | 603 (18.5%) |
| $3,000 or more | 3,503 (32.7%) | 453 (13.9%) |
| Total | 10,705 (100.0%) | 3,252 (100.0%) |
Physical Housing Characteristics in West Babylon
Housing Structures in West Babylon
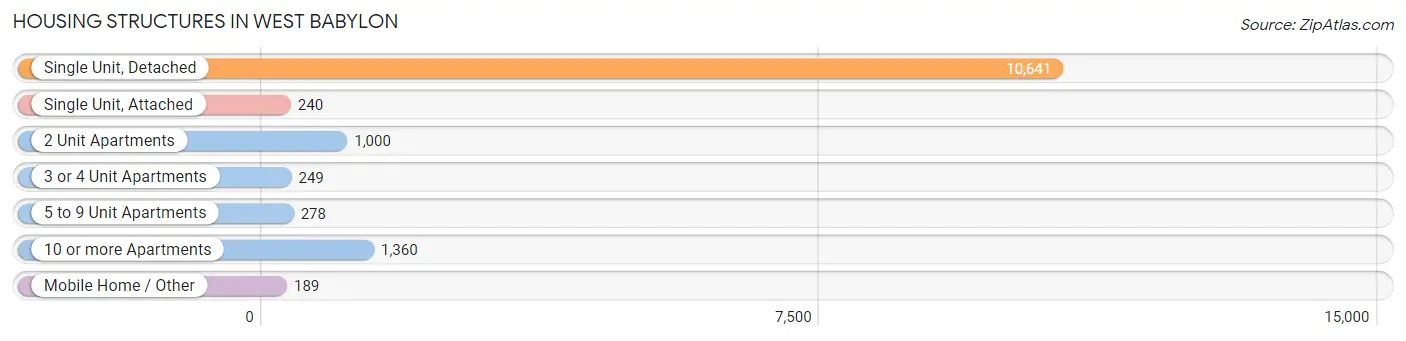
| Structure Type | # Housing Units | % Housing Units |
| Single Unit, Detached | 10,641 | 76.2% |
| Single Unit, Attached | 240 | 1.7% |
| 2 Unit Apartments | 1,000 | 7.2% |
| 3 or 4 Unit Apartments | 249 | 1.8% |
| 5 to 9 Unit Apartments | 278 | 2.0% |
| 10 or more Apartments | 1,360 | 9.7% |
| Mobile Home / Other | 189 | 1.3% |
| Total | 13,957 | 100.0% |
Housing Structures by Occupancy in West Babylon
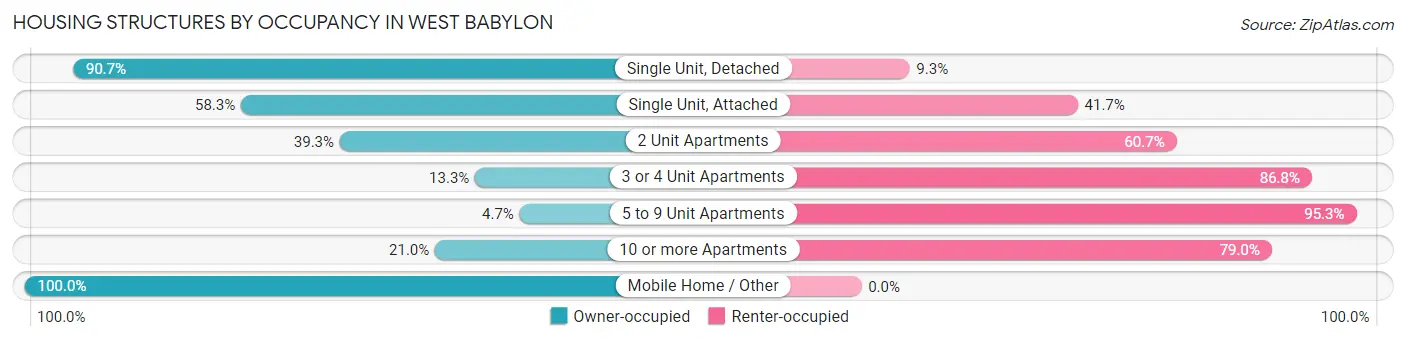
| Structure Type | Owner-occupied | Renter-occupied |
| Single Unit, Detached | 9,652 (90.7%) | 989 (9.3%) |
| Single Unit, Attached | 140 (58.3%) | 100 (41.7%) |
| 2 Unit Apartments | 393 (39.3%) | 607 (60.7%) |
| 3 or 4 Unit Apartments | 33 (13.3%) | 216 (86.8%) |
| 5 to 9 Unit Apartments | 13 (4.7%) | 265 (95.3%) |
| 10 or more Apartments | 285 (21.0%) | 1,075 (79.0%) |
| Mobile Home / Other | 189 (100.0%) | 0 (0.0%) |
| Total | 10,705 (76.7%) | 3,252 (23.3%) |
Housing Structures by Number of Rooms in West Babylon
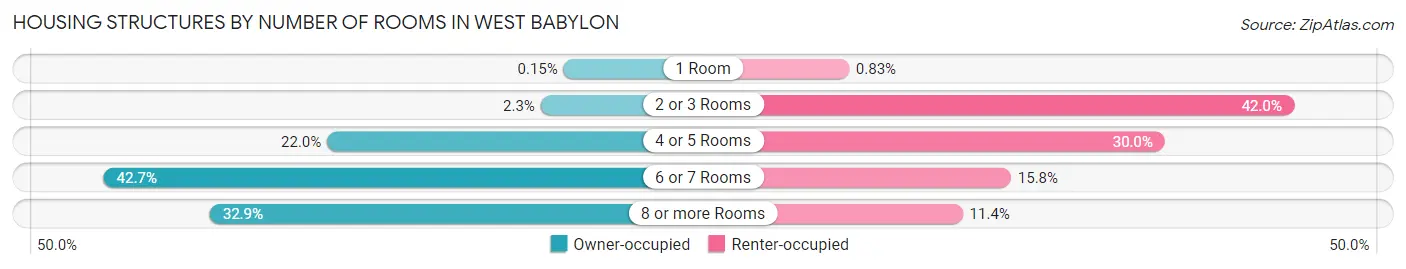
| Number of Rooms | Owner-occupied | Renter-occupied |
| 1 Room | 16 (0.2%) | 27 (0.8%) |
| 2 or 3 Rooms | 243 (2.3%) | 1,365 (42.0%) |
| 4 or 5 Rooms | 2,357 (22.0%) | 977 (30.0%) |
| 6 or 7 Rooms | 4,570 (42.7%) | 514 (15.8%) |
| 8 or more Rooms | 3,519 (32.9%) | 369 (11.4%) |
| Total | 10,705 (100.0%) | 3,252 (100.0%) |
Housing Structure by Heating Type in West Babylon
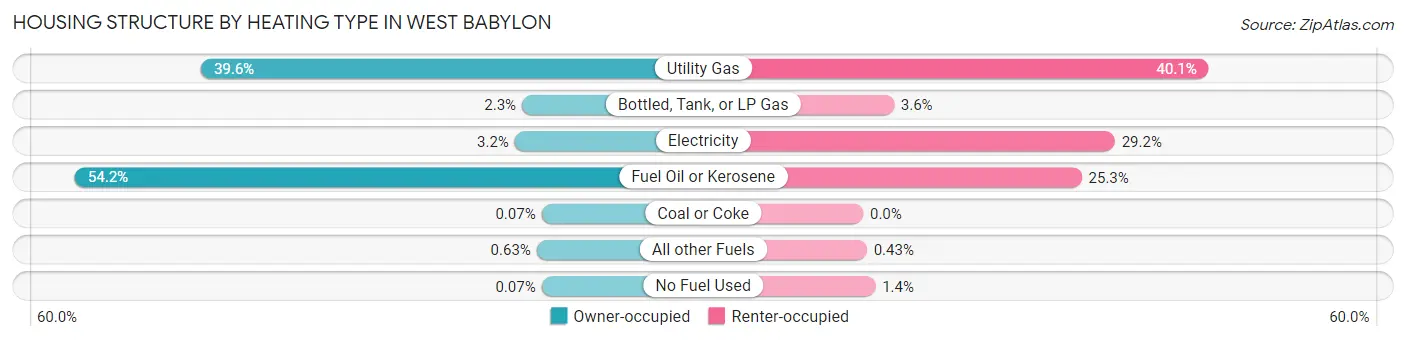
| Heating Type | Owner-occupied | Renter-occupied |
| Utility Gas | 4,234 (39.6%) | 1,303 (40.1%) |
| Bottled, Tank, or LP Gas | 250 (2.3%) | 116 (3.6%) |
| Electricity | 340 (3.2%) | 949 (29.2%) |
| Fuel Oil or Kerosene | 5,798 (54.2%) | 824 (25.3%) |
| Coal or Coke | 8 (0.1%) | 0 (0.0%) |
| All other Fuels | 67 (0.6%) | 14 (0.4%) |
| No Fuel Used | 8 (0.1%) | 46 (1.4%) |
| Total | 10,705 (100.0%) | 3,252 (100.0%) |
Household Vehicle Usage in West Babylon
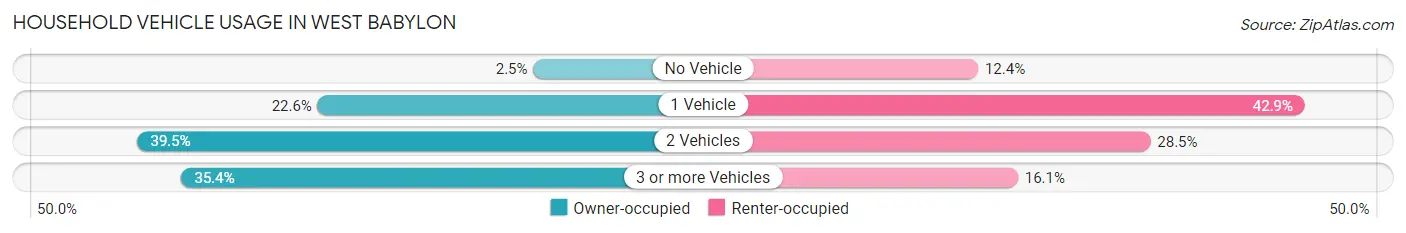
| Vehicles per Household | Owner-occupied | Renter-occupied |
| No Vehicle | 269 (2.5%) | 404 (12.4%) |
| 1 Vehicle | 2,424 (22.6%) | 1,396 (42.9%) |
| 2 Vehicles | 4,226 (39.5%) | 927 (28.5%) |
| 3 or more Vehicles | 3,786 (35.4%) | 525 (16.1%) |
| Total | 10,705 (100.0%) | 3,252 (100.0%) |
Real Estate & Mortgages in West Babylon
Real Estate and Mortgage Overview in West Babylon
| Characteristic | Without Mortgage | With Mortgage |
| Housing Units | 4,042 | 6,663 |
| Median Property Value | $441,100 | $452,300 |
| Median Household Income | $113,194 | $2,856 |
| Monthly Housing Costs | $1,450 | $3,503 |
| Real Estate Taxes | $10,001 | $51 |
Property Value by Mortgage Status in West Babylon
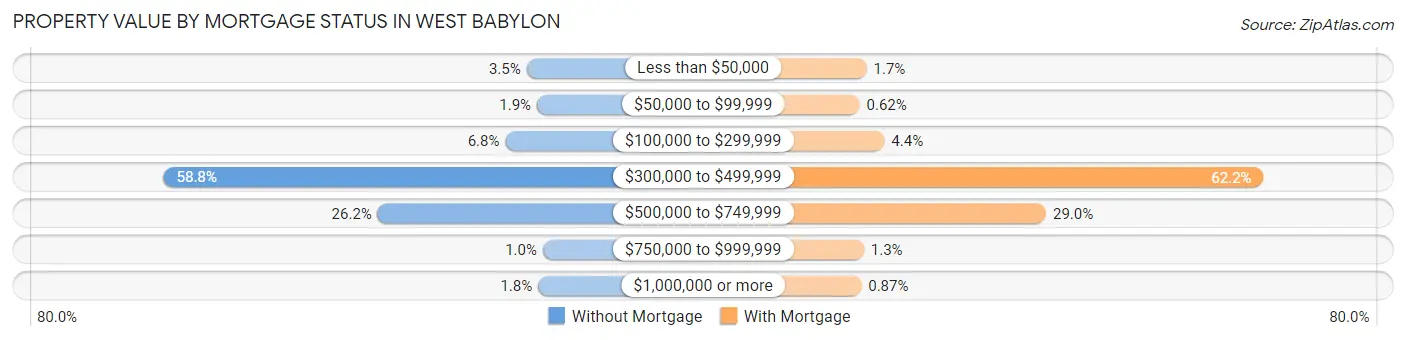
| Property Value | Without Mortgage | With Mortgage |
| Less than $50,000 | 142 (3.5%) | 112 (1.7%) |
| $50,000 to $99,999 | 78 (1.9%) | 41 (0.6%) |
| $100,000 to $299,999 | 273 (6.8%) | 293 (4.4%) |
| $300,000 to $499,999 | 2,377 (58.8%) | 4,141 (62.2%) |
| $500,000 to $749,999 | 1,059 (26.2%) | 1,934 (29.0%) |
| $750,000 to $999,999 | 42 (1.0%) | 84 (1.3%) |
| $1,000,000 or more | 71 (1.8%) | 58 (0.9%) |
| Total | 4,042 (100.0%) | 6,663 (100.0%) |
Household Income by Mortgage Status in West Babylon
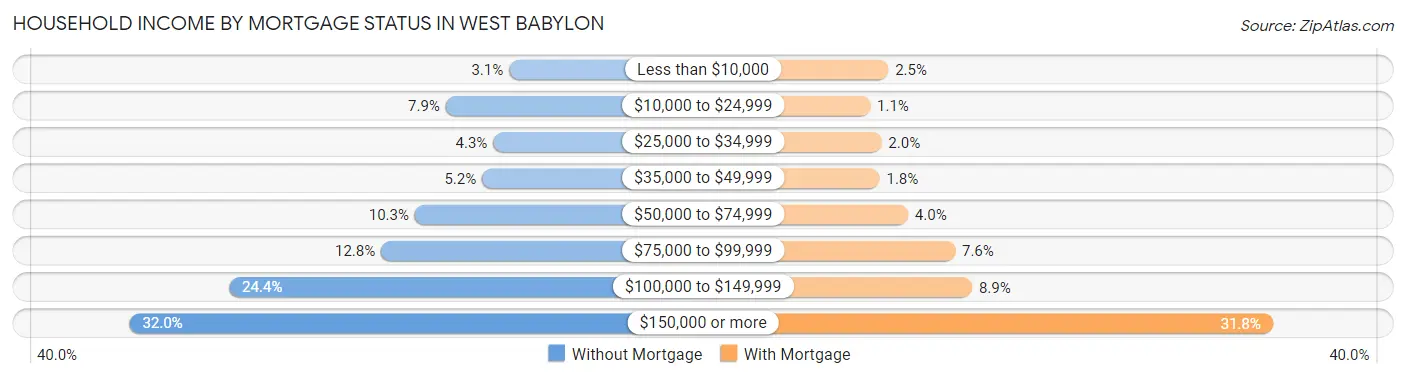
| Household Income | Without Mortgage | With Mortgage |
| Less than $10,000 | 125 (3.1%) | 166 (2.5%) |
| $10,000 to $24,999 | 320 (7.9%) | 74 (1.1%) |
| $25,000 to $34,999 | 174 (4.3%) | 131 (2.0%) |
| $35,000 to $49,999 | 208 (5.1%) | 122 (1.8%) |
| $50,000 to $74,999 | 415 (10.3%) | 266 (4.0%) |
| $75,000 to $99,999 | 519 (12.8%) | 505 (7.6%) |
| $100,000 to $149,999 | 987 (24.4%) | 591 (8.9%) |
| $150,000 or more | 1,294 (32.0%) | 2,118 (31.8%) |
| Total | 4,042 (100.0%) | 6,663 (100.0%) |
Property Value to Household Income Ratio in West Babylon
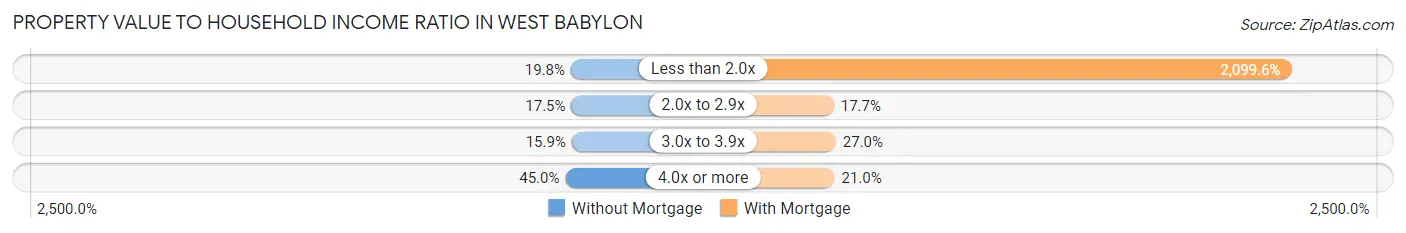
| Value-to-Income Ratio | Without Mortgage | With Mortgage |
| Less than 2.0x | 800 (19.8%) | 139,893 (2,099.5%) |
| 2.0x to 2.9x | 706 (17.5%) | 1,176 (17.6%) |
| 3.0x to 3.9x | 642 (15.9%) | 1,797 (27.0%) |
| 4.0x or more | 1,820 (45.0%) | 1,397 (21.0%) |
| Total | 4,042 (100.0%) | 6,663 (100.0%) |
Real Estate Taxes by Mortgage Status in West Babylon
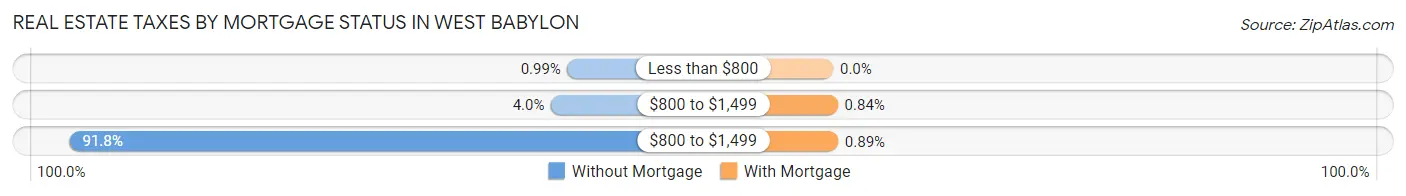
| Property Taxes | Without Mortgage | With Mortgage |
| Less than $800 | 40 (1.0%) | 0 (0.0%) |
| $800 to $1,499 | 161 (4.0%) | 56 (0.8%) |
| $800 to $1,499 | 3,710 (91.8%) | 59 (0.9%) |
| Total | 4,042 (100.0%) | 6,663 (100.0%) |
Health & Disability in West Babylon
Health Insurance Coverage by Age in West Babylon
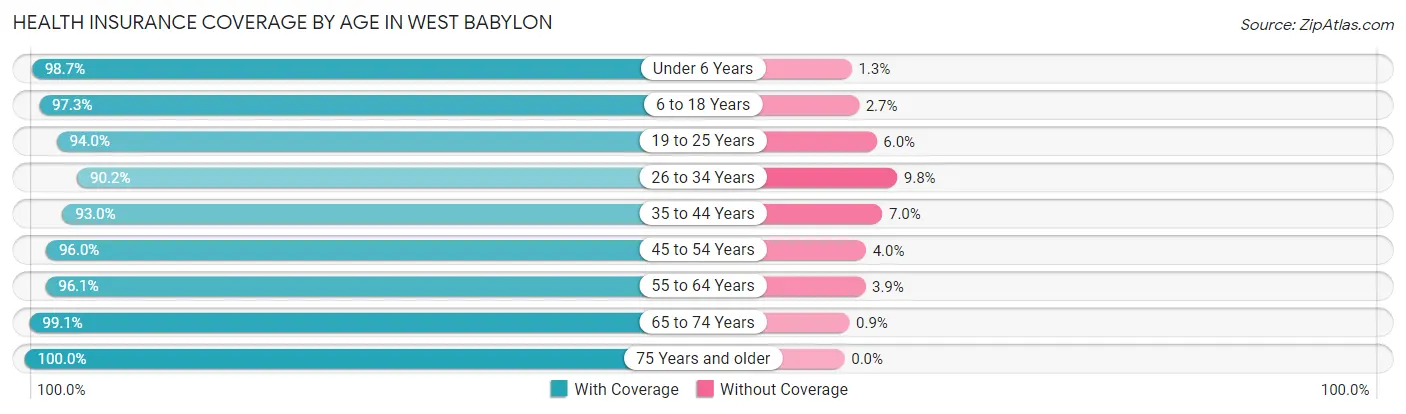
| Age Bracket | With Coverage | Without Coverage |
| Under 6 Years | 2,281 (98.7%) | 31 (1.3%) |
| 6 to 18 Years | 5,710 (97.3%) | 158 (2.7%) |
| 19 to 25 Years | 3,748 (94.0%) | 238 (6.0%) |
| 26 to 34 Years | 4,886 (90.2%) | 531 (9.8%) |
| 35 to 44 Years | 4,368 (93.0%) | 331 (7.0%) |
| 45 to 54 Years | 5,408 (96.0%) | 225 (4.0%) |
| 55 to 64 Years | 6,900 (96.1%) | 278 (3.9%) |
| 65 to 74 Years | 3,754 (99.1%) | 34 (0.9%) |
| 75 Years and older | 3,543 (100.0%) | 0 (0.0%) |
| Total | 40,598 (95.7%) | 1,826 (4.3%) |
Health Insurance Coverage by Citizenship Status in West Babylon
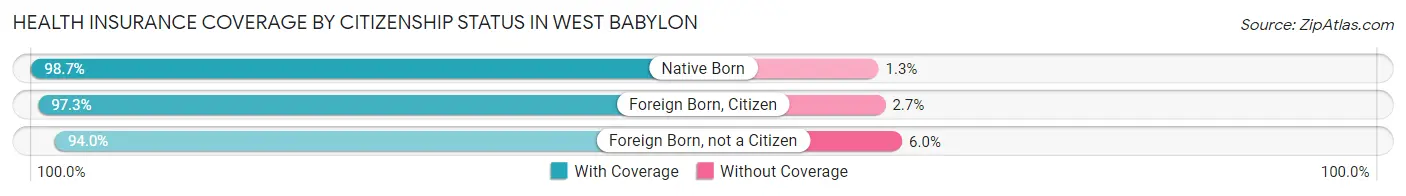
| Citizenship Status | With Coverage | Without Coverage |
| Native Born | 2,281 (98.7%) | 31 (1.3%) |
| Foreign Born, Citizen | 5,710 (97.3%) | 158 (2.7%) |
| Foreign Born, not a Citizen | 3,748 (94.0%) | 238 (6.0%) |
Health Insurance Coverage by Household Income in West Babylon
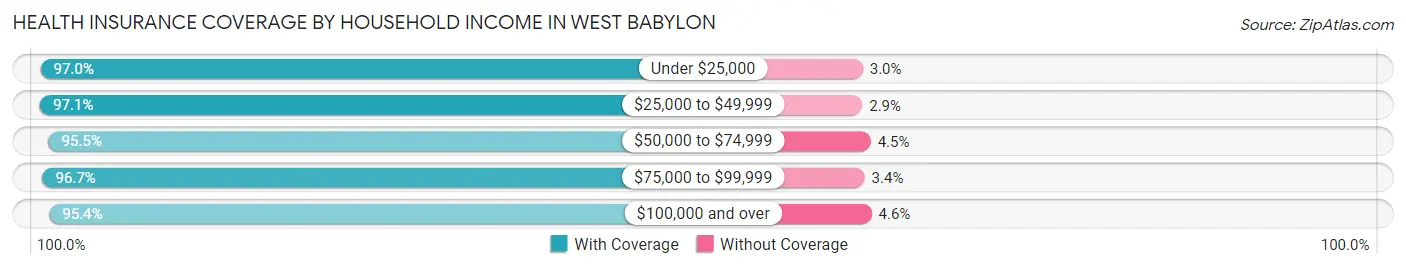
| Household Income | With Coverage | Without Coverage |
| Under $25,000 | 1,679 (97.0%) | 52 (3.0%) |
| $25,000 to $49,999 | 2,408 (97.1%) | 72 (2.9%) |
| $50,000 to $74,999 | 3,733 (95.5%) | 175 (4.5%) |
| $75,000 to $99,999 | 3,927 (96.7%) | 136 (3.4%) |
| $100,000 and over | 28,600 (95.4%) | 1,391 (4.6%) |
Public vs Private Health Insurance Coverage by Age in West Babylon
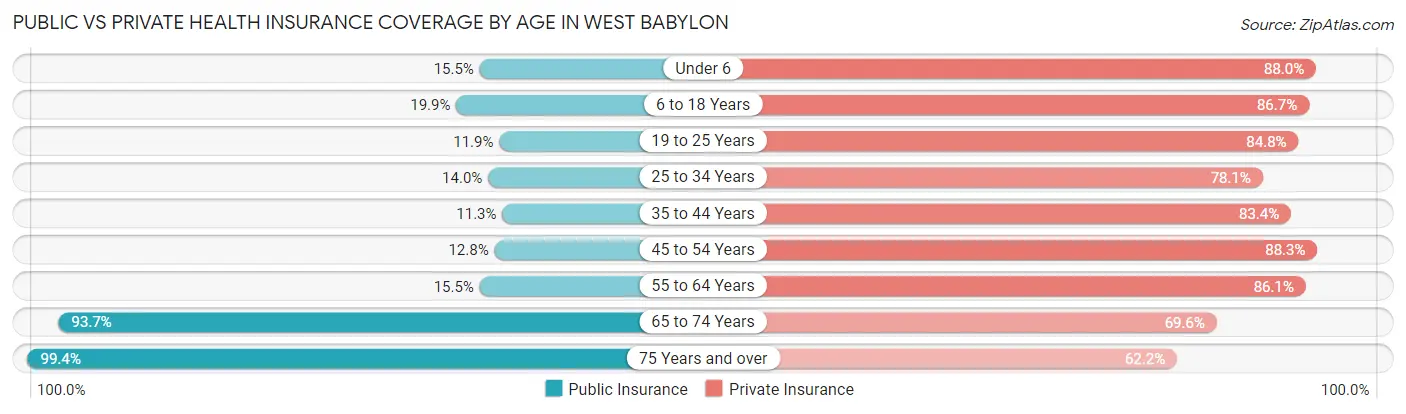
| Age Bracket | Public Insurance | Private Insurance |
| Under 6 | 359 (15.5%) | 2,035 (88.0%) |
| 6 to 18 Years | 1,166 (19.9%) | 5,088 (86.7%) |
| 19 to 25 Years | 474 (11.9%) | 3,378 (84.8%) |
| 25 to 34 Years | 756 (14.0%) | 4,232 (78.1%) |
| 35 to 44 Years | 532 (11.3%) | 3,918 (83.4%) |
| 45 to 54 Years | 720 (12.8%) | 4,971 (88.2%) |
| 55 to 64 Years | 1,115 (15.5%) | 6,181 (86.1%) |
| 65 to 74 Years | 3,550 (93.7%) | 2,636 (69.6%) |
| 75 Years and over | 3,523 (99.4%) | 2,204 (62.2%) |
| Total | 12,195 (28.7%) | 34,643 (81.7%) |
Disability Status by Sex by Age in West Babylon
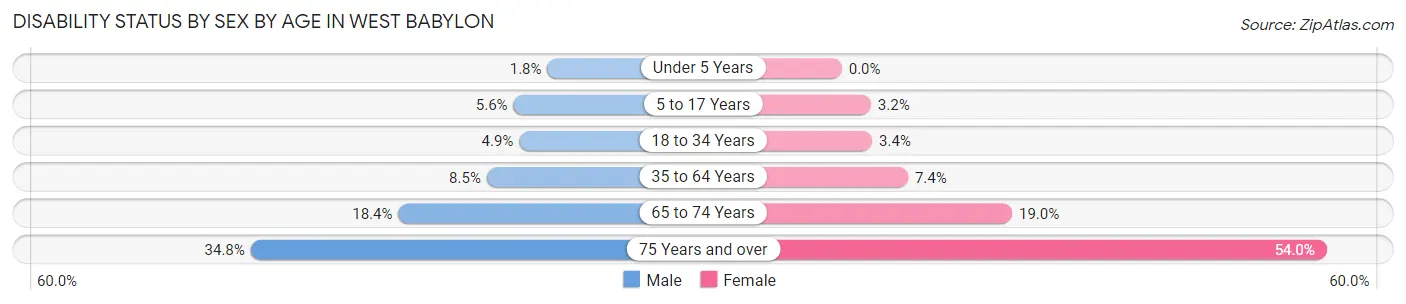
| Age Bracket | Male | Female |
| Under 5 Years | 18 (1.8%) | 0 (0.0%) |
| 5 to 17 Years | 166 (5.6%) | 93 (3.2%) |
| 18 to 34 Years | 253 (4.9%) | 156 (3.4%) |
| 35 to 64 Years | 743 (8.5%) | 648 (7.4%) |
| 65 to 74 Years | 322 (18.4%) | 386 (19.0%) |
| 75 Years and over | 480 (34.8%) | 1,169 (54.0%) |
Disability Class by Sex by Age in West Babylon
Disability Class: Hearing Difficulty
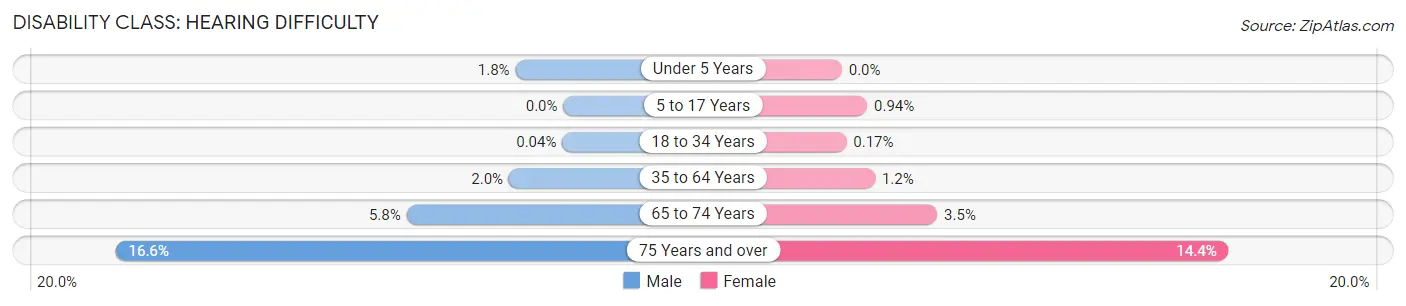
| Age Bracket | Male | Female |
| Under 5 Years | 18 (1.8%) | 0 (0.0%) |
| 5 to 17 Years | 0 (0.0%) | 27 (0.9%) |
| 18 to 34 Years | 2 (0.0%) | 8 (0.2%) |
| 35 to 64 Years | 176 (2.0%) | 108 (1.2%) |
| 65 to 74 Years | 102 (5.8%) | 72 (3.5%) |
| 75 Years and over | 229 (16.6%) | 311 (14.4%) |
Disability Class: Vision Difficulty
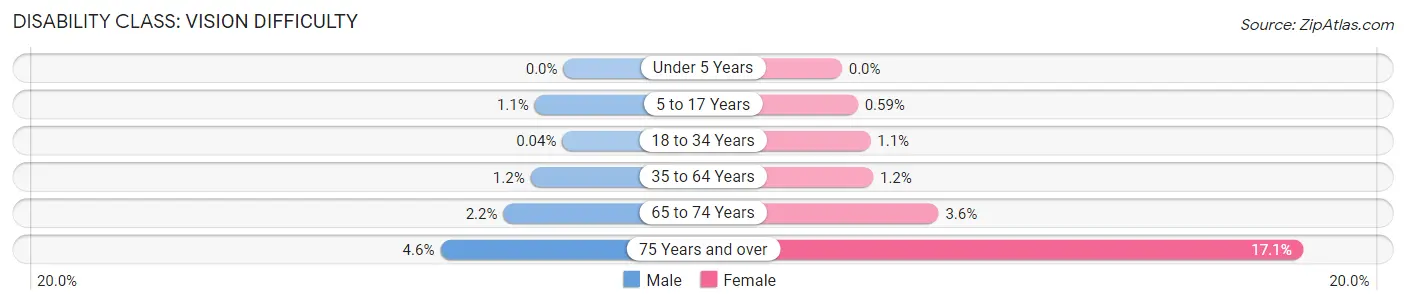
| Age Bracket | Male | Female |
| Under 5 Years | 0 (0.0%) | 0 (0.0%) |
| 5 to 17 Years | 32 (1.1%) | 17 (0.6%) |
| 18 to 34 Years | 2 (0.0%) | 49 (1.1%) |
| 35 to 64 Years | 106 (1.2%) | 102 (1.2%) |
| 65 to 74 Years | 39 (2.2%) | 73 (3.6%) |
| 75 Years and over | 63 (4.6%) | 371 (17.1%) |
Disability Class: Cognitive Difficulty
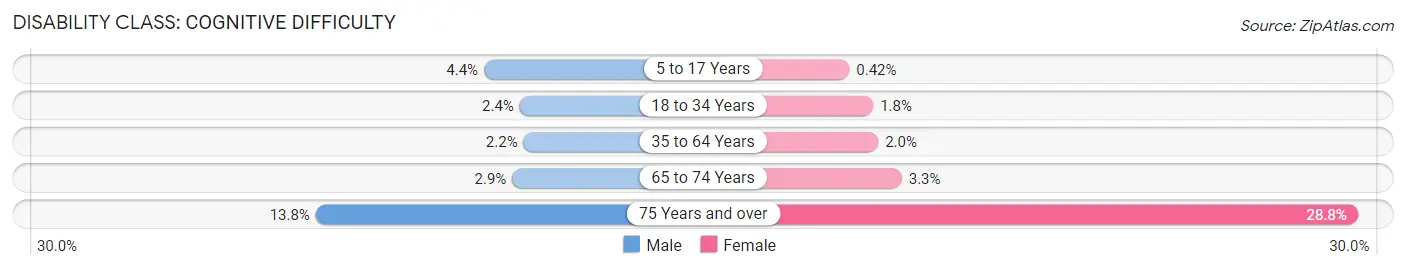
| Age Bracket | Male | Female |
| 5 to 17 Years | 132 (4.4%) | 12 (0.4%) |
| 18 to 34 Years | 125 (2.4%) | 81 (1.8%) |
| 35 to 64 Years | 193 (2.2%) | 179 (2.0%) |
| 65 to 74 Years | 50 (2.9%) | 68 (3.3%) |
| 75 Years and over | 190 (13.8%) | 623 (28.8%) |
Disability Class: Ambulatory Difficulty
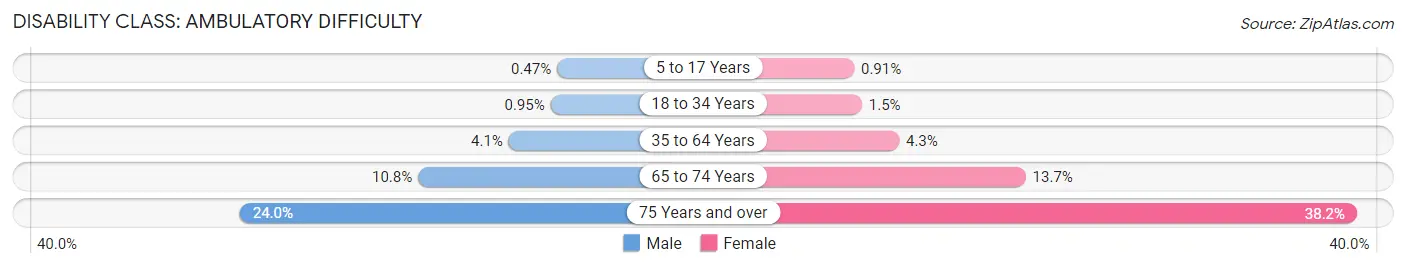
| Age Bracket | Male | Female |
| 5 to 17 Years | 14 (0.5%) | 26 (0.9%) |
| 18 to 34 Years | 49 (0.9%) | 69 (1.5%) |
| 35 to 64 Years | 354 (4.1%) | 374 (4.3%) |
| 65 to 74 Years | 189 (10.8%) | 278 (13.7%) |
| 75 Years and over | 331 (24.0%) | 828 (38.2%) |
Disability Class: Self-Care Difficulty
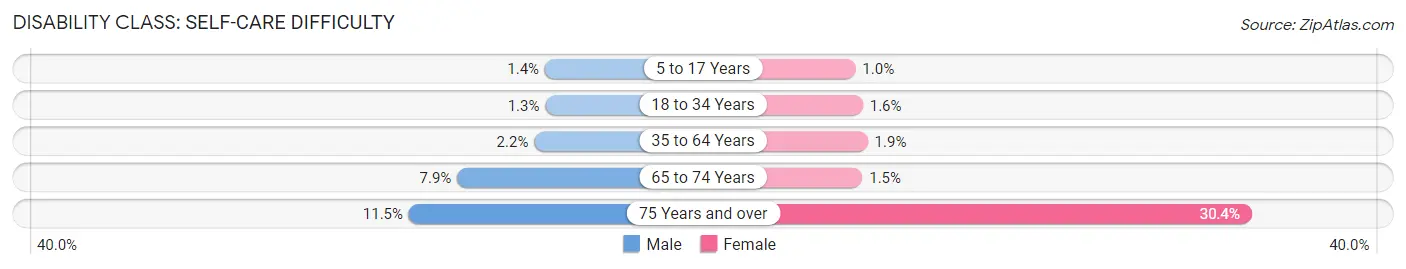
| Age Bracket | Male | Female |
| 5 to 17 Years | 41 (1.4%) | 29 (1.0%) |
| 18 to 34 Years | 69 (1.3%) | 72 (1.6%) |
| 35 to 64 Years | 188 (2.2%) | 169 (1.9%) |
| 65 to 74 Years | 138 (7.9%) | 31 (1.5%) |
| 75 Years and over | 158 (11.5%) | 659 (30.4%) |
Technology Access in West Babylon
Computing Device Access in West Babylon
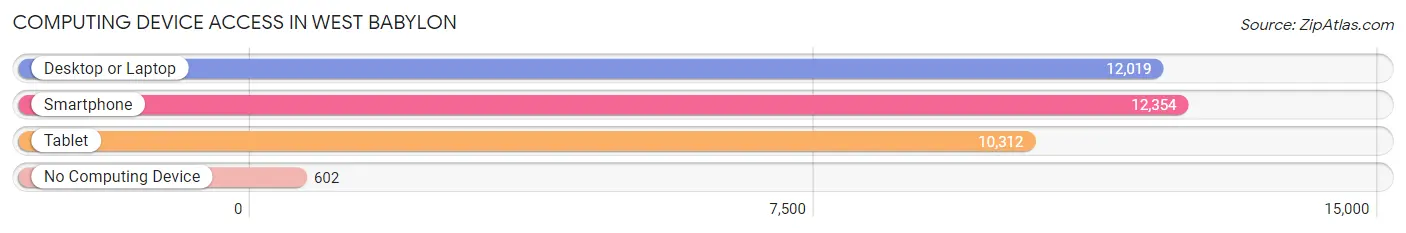
| Device Type | # Households | % Households |
| Desktop or Laptop | 12,019 | 86.1% |
| Smartphone | 12,354 | 88.5% |
| Tablet | 10,312 | 73.9% |
| No Computing Device | 602 | 4.3% |
| Total | 13,957 | 100.0% |
Internet Access in West Babylon
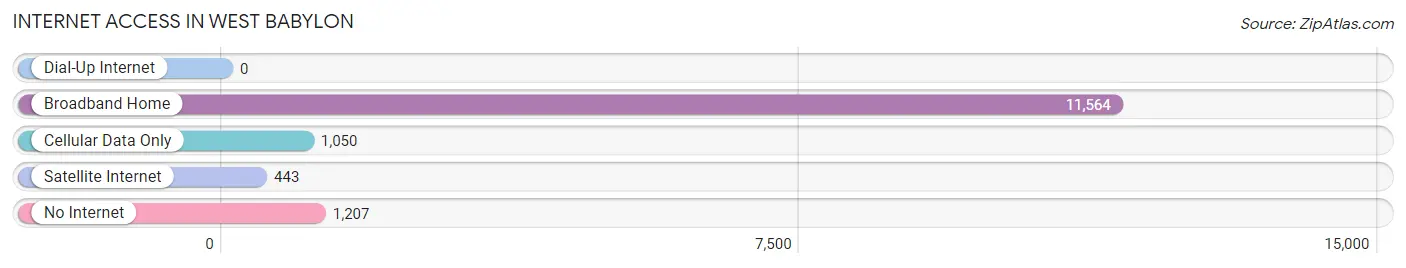
| Internet Type | # Households | % Households |
| Dial-Up Internet | 0 | 0.0% |
| Broadband Home | 11,564 | 82.9% |
| Cellular Data Only | 1,050 | 7.5% |
| Satellite Internet | 443 | 3.2% |
| No Internet | 1,207 | 8.6% |
| Total | 13,957 | 100.0% |
West Babylon Summary
Introduction
West Babylon is a hamlet located in the Town of Babylon in Suffolk County, New York. It is situated on the South Shore of Long Island, approximately 50 miles east of New York City. West Babylon is a vibrant community with a rich history, diverse geography, and a thriving economy. This paper will explore the history, geography, economy, and demographics of West Babylon in 2000 words.
History
West Babylon was originally inhabited by the Secatogue Indians, a branch of the Algonquin tribe. The Secatogue Indians were a peaceful people who lived off the land and were known for their basket weaving and shellfish harvesting. The first European settlers arrived in the area in the 1650s and established a small farming community. The area was known as “West Neck” until the late 1800s when it was renamed “West Babylon” after the nearby town of Babylon.
In the early 1900s, West Babylon began to experience rapid growth as more and more people moved to the area. The population increased from just over 1,000 in 1910 to over 10,000 by the 1950s. During this time, the area was transformed from a rural farming community to a bustling suburban town.
In the 1960s, West Babylon experienced a period of rapid development as new homes and businesses were built. The area was further transformed in the 1970s when the Long Island Rail Road opened a station in West Babylon, making it easier for people to commute to New York City.
Today, West Babylon is a vibrant community with a population of over 40,000. The area is home to a variety of businesses, parks, and recreational facilities.
Geography
West Babylon is located on the South Shore of Long Island, approximately 50 miles east of New York City. The hamlet is bordered by the Great South Bay to the south and the Town of Babylon to the north. The area is characterized by rolling hills, wooded areas, and wetlands.
The climate in West Babylon is typical of the Northeastern United States. Summers are warm and humid, while winters are cold and snowy. The average annual temperature is around 50 degrees Fahrenheit.
Economy
West Babylon’s economy is largely based on retail, manufacturing, and services. The area is home to a variety of businesses, including restaurants, banks, and retail stores. The largest employers in the area are the West Babylon School District, the Town of Babylon, and the Long Island Rail Road.
West Babylon is also home to a number of industrial parks, which provide jobs in manufacturing and other industries. The area is also home to a number of medical facilities, including Good Samaritan Hospital and Southside Hospital.
Demographics
As of the 2010 census, West Babylon had a population of 40,213. The population is largely white (83.3%), with smaller percentages of African Americans (7.2%), Hispanics (5.3%), and Asians (3.2%). The median household income is $87,845, and the median age is 40.
Conclusion
West Babylon is a vibrant community with a rich history, diverse geography, and a thriving economy. The area is home to a variety of businesses, parks, and recreational facilities. The population is largely white, with smaller percentages of African Americans, Hispanics, and Asians. West Babylon is a great place to live, work, and play.
Common Questions
What is the Total Population of West Babylon?
Total Population of West Babylon is 42,783.
What is the Total Male Population of West Babylon?
Total Male Population of West Babylon is 21,137.
What is the Total Female Population of West Babylon?
Total Female Population of West Babylon is 21,646.
What is the Ratio of Males per 100 Females in West Babylon?
There are 97.65 Males per 100 Females in West Babylon.
What is the Ratio of Females per 100 Males in West Babylon?
There are 102.41 Females per 100 Males in West Babylon.
What is the Median Population Age in West Babylon?
Median Population Age in West Babylon is 43.1 Years.
What is the Average Family Size in West Babylon
Average Family Size in West Babylon is 3.5 People.
What is the Average Household Size in West Babylon
Average Household Size in West Babylon is 3.0 People.
What is Per Capita Income in West Babylon?
Per Capita income in West Babylon is $47,239.
What is the Median Family Income in West Babylon?
Median Family Income in West Babylon is $129,146.
What is the Median Household income in West Babylon?
Median Household Income in West Babylon is $121,266.
What is Income or Wage Gap in West Babylon?
Income or Wage Gap in West Babylon is 21.5%.
Women in West Babylon earn 78.5 cents for every dollar earned by a man.
What is Family Income Deficit in West Babylon?
Family Income Deficit in West Babylon is $9,485.
Families that are below poverty line in West Babylon earn $9,485 less on average than the poverty threshold level.
What is Inequality or Gini Index in West Babylon?
Inequality or Gini Index in West Babylon is 0.37.
How Large is the Labor Force in West Babylon?
There are 24,457 People in the Labor Forcein in West Babylon.
What is the Percentage of People in the Labor Force in West Babylon?
68.3% of People are in the Labor Force in West Babylon.
What is the Unemployment Rate in West Babylon?
Unemployment Rate in West Babylon is 6.9%.