Lansing, NY
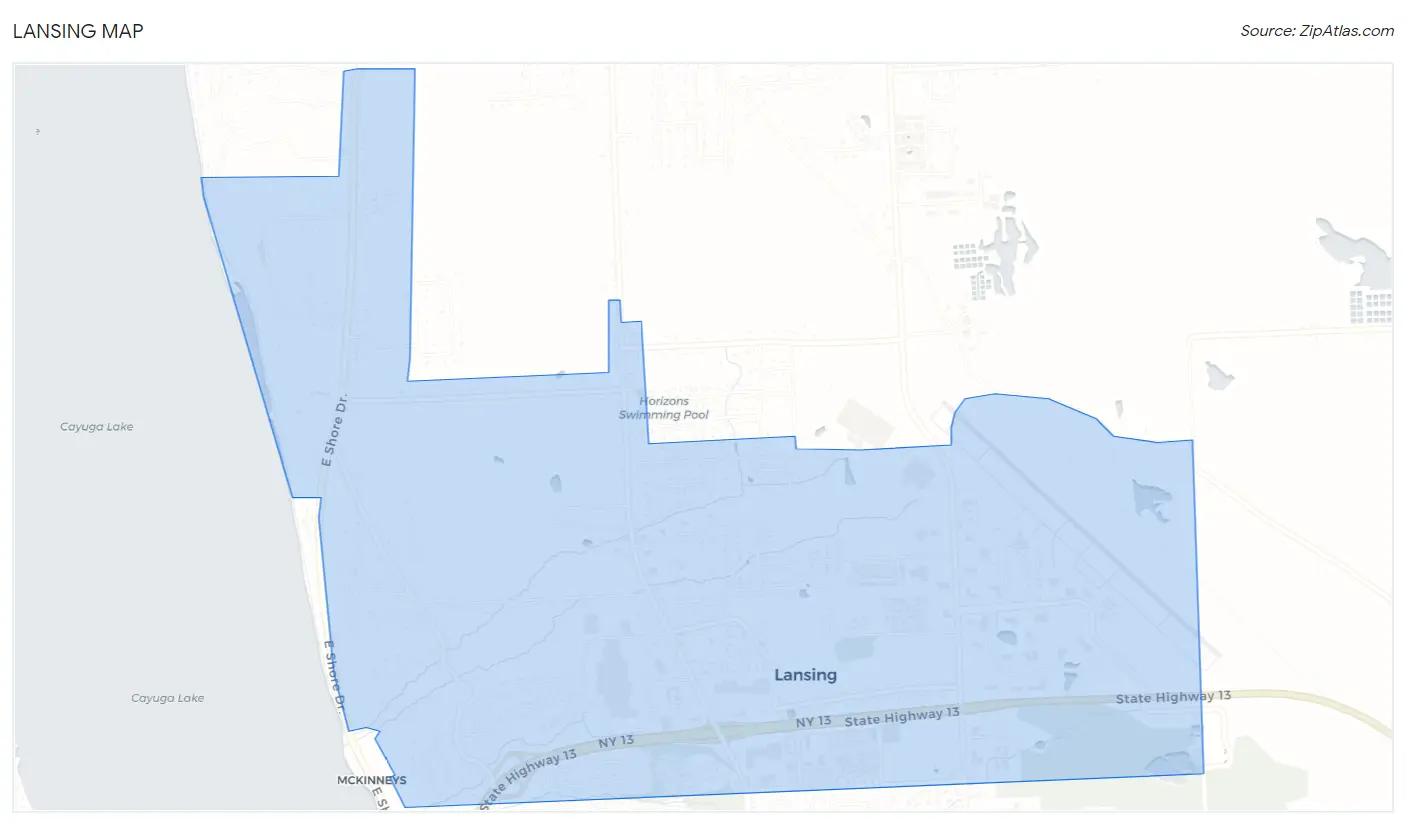
Lansing Map
Lansing Overview
3,814
TOTAL POPULATION
2,006
MALE POPULATION
1,808
FEMALE POPULATION
110.95
MALES / 100 FEMALES
90.13
FEMALES / 100 MALES
31.2
MEDIAN AGE
2.7
AVG FAMILY SIZE
2.2
AVG HOUSEHOLD SIZE
$59,542
PER CAPITA INCOME
$121,776
AVG FAMILY INCOME
$75,245
AVG HOUSEHOLD INCOME
0.3%
WAGE / INCOME GAP [ % ]
99.7¢/ $1
WAGE / INCOME GAP [ $ ]
0.55
INEQUALITY / GINI INDEX
2,400
LABOR FORCE [ PEOPLE ]
72.7%
PERCENT IN LABOR FORCE
3.8%
UNEMPLOYMENT RATE
Lansing Zip Codes
Lansing Area Codes
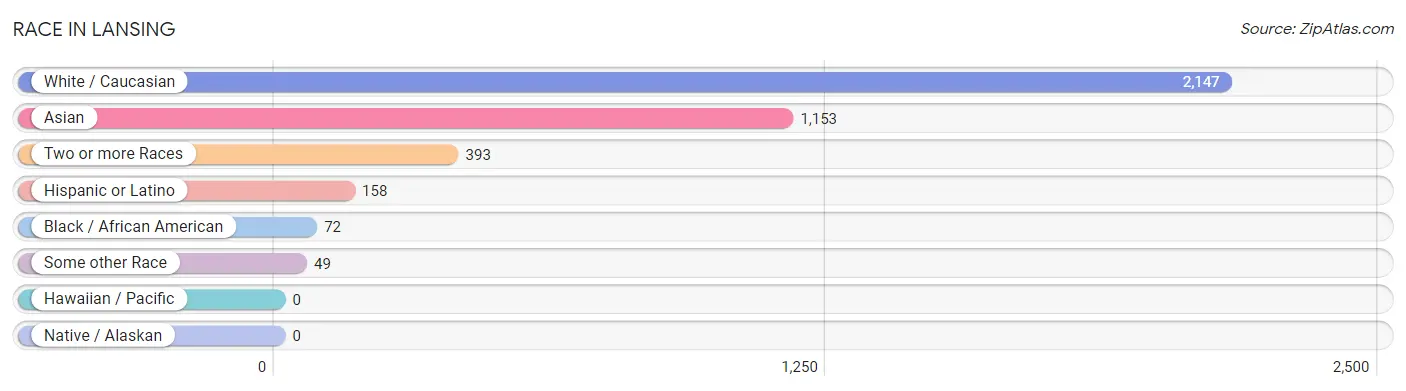
Race in Lansing
The most populous races in Lansing are White / Caucasian (2,147 | 56.3%), Asian (1,153 | 30.2%), and Two or more Races (393 | 10.3%).
| Race | # Population | % Population |
| Asian | 1,153 | 30.2% |
| Black / African American | 72 | 1.9% |
| Hawaiian / Pacific | 0 | 0.0% |
| Hispanic or Latino | 158 | 4.1% |
| Native / Alaskan | 0 | 0.0% |
| White / Caucasian | 2,147 | 56.3% |
| Two or more Races | 393 | 10.3% |
| Some other Race | 49 | 1.3% |
| Total | 3,814 | 100.0% |
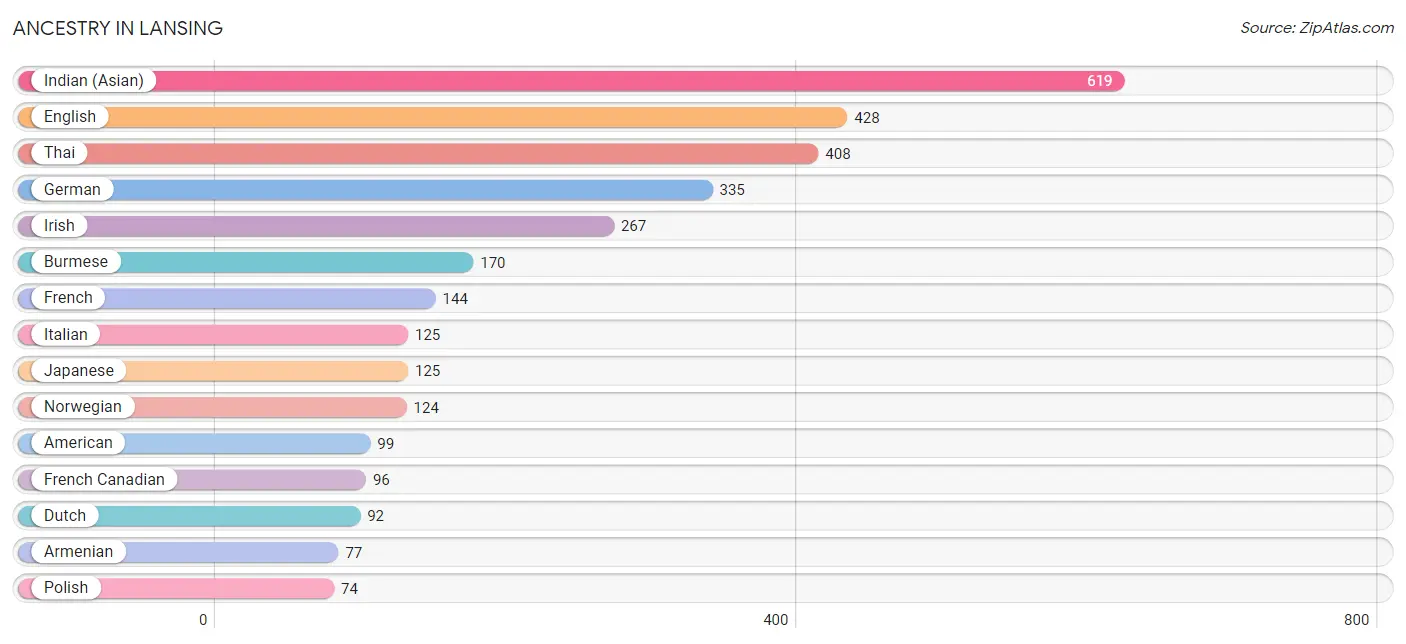
Ancestry in Lansing
The most populous ancestries reported in Lansing are Indian (Asian) (619 | 16.2%), English (428 | 11.2%), Thai (408 | 10.7%), German (335 | 8.8%), and Irish (267 | 7.0%), together accounting for 53.9% of all Lansing residents.
| Ancestry | # Population | % Population |
| American | 99 | 2.6% |
| Armenian | 77 | 2.0% |
| Bhutanese | 13 | 0.3% |
| British | 26 | 0.7% |
| Burmese | 170 | 4.5% |
| Canadian | 59 | 1.5% |
| Central American | 22 | 0.6% |
| Chickasaw | 10 | 0.3% |
| Costa Rican | 22 | 0.6% |
| Croatian | 27 | 0.7% |
| Czech | 12 | 0.3% |
| Dutch | 92 | 2.4% |
| English | 428 | 11.2% |
| European | 40 | 1.1% |
| Filipino | 34 | 0.9% |
| French | 144 | 3.8% |
| French Canadian | 96 | 2.5% |
| German | 335 | 8.8% |
| Greek | 62 | 1.6% |
| Hungarian | 22 | 0.6% |
| Indian (Asian) | 619 | 16.2% |
| Iranian | 6 | 0.2% |
| Irish | 267 | 7.0% |
| Italian | 125 | 3.3% |
| Jamaican | 16 | 0.4% |
| Japanese | 125 | 3.3% |
| Mexican | 59 | 1.5% |
| Northern European | 27 | 0.7% |
| Norwegian | 124 | 3.3% |
| Okinawan | 34 | 0.9% |
| Pennsylvania German | 21 | 0.5% |
| Peruvian | 8 | 0.2% |
| Polish | 74 | 1.9% |
| Puerto Rican | 56 | 1.5% |
| Romanian | 15 | 0.4% |
| Russian | 27 | 0.7% |
| Scotch-Irish | 19 | 0.5% |
| Scottish | 8 | 0.2% |
| Serbian | 11 | 0.3% |
| Slovak | 11 | 0.3% |
| South American | 8 | 0.2% |
| Swedish | 32 | 0.8% |
| Thai | 408 | 10.7% |
| Trinidadian and Tobagonian | 12 | 0.3% |
| Turkish | 21 | 0.5% |
| Welsh | 61 | 1.6% | View All 46 Rows |
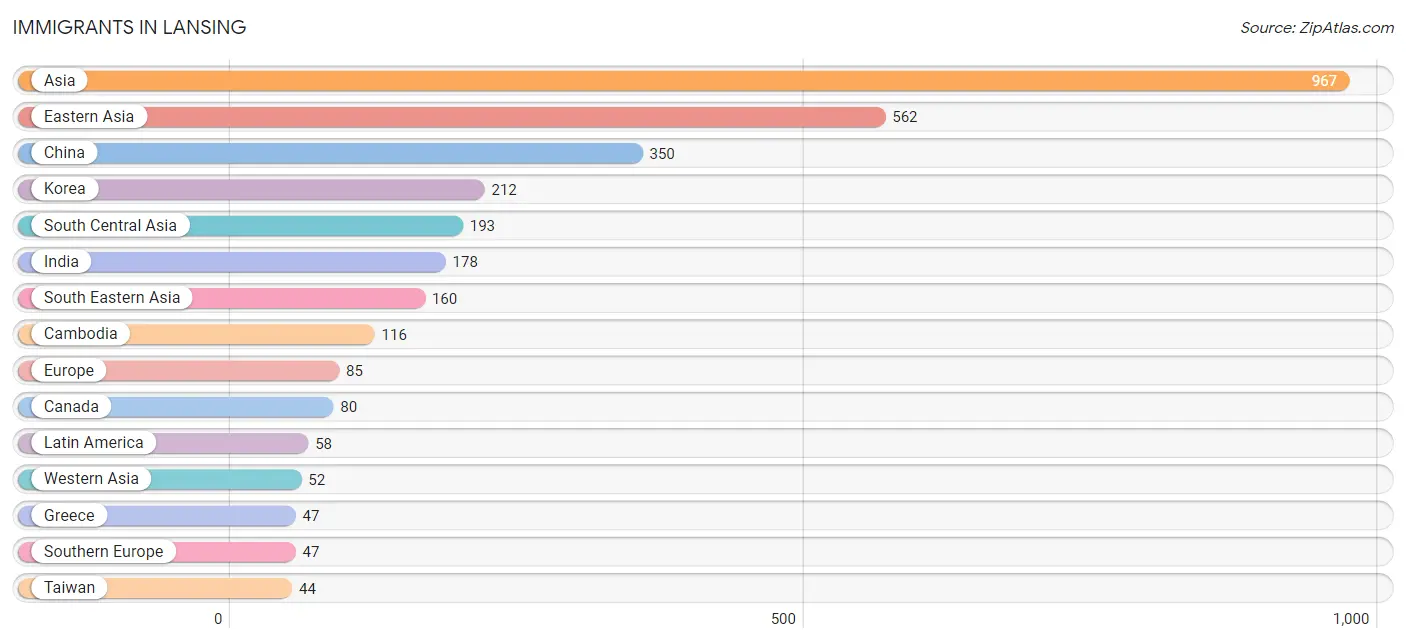
Immigrants in Lansing
The most numerous immigrant groups reported in Lansing came from Asia (967 | 25.4%), Eastern Asia (562 | 14.7%), China (350 | 9.2%), Korea (212 | 5.6%), and South Central Asia (193 | 5.1%), together accounting for 59.9% of all Lansing residents.
| Immigration Origin | # Population | % Population |
| Asia | 967 | 25.4% |
| Cambodia | 116 | 3.0% |
| Canada | 80 | 2.1% |
| Caribbean | 28 | 0.7% |
| Central America | 22 | 0.6% |
| China | 350 | 9.2% |
| Costa Rica | 22 | 0.6% |
| Eastern Asia | 562 | 14.7% |
| Eastern Europe | 16 | 0.4% |
| Europe | 85 | 2.2% |
| Greece | 47 | 1.2% |
| India | 178 | 4.7% |
| Iran | 15 | 0.4% |
| Jamaica | 16 | 0.4% |
| Korea | 212 | 5.6% |
| Latin America | 58 | 1.5% |
| Northern Europe | 22 | 0.6% |
| Peru | 8 | 0.2% |
| Romania | 5 | 0.1% |
| Russia | 11 | 0.3% |
| South America | 8 | 0.2% |
| South Central Asia | 193 | 5.1% |
| South Eastern Asia | 160 | 4.2% |
| Southern Europe | 47 | 1.2% |
| Taiwan | 44 | 1.1% |
| Trinidad and Tobago | 12 | 0.3% |
| Vietnam | 44 | 1.1% |
| Western Asia | 52 | 1.4% | View All 28 Rows |
Sex and Age in Lansing
Sex and Age in Lansing
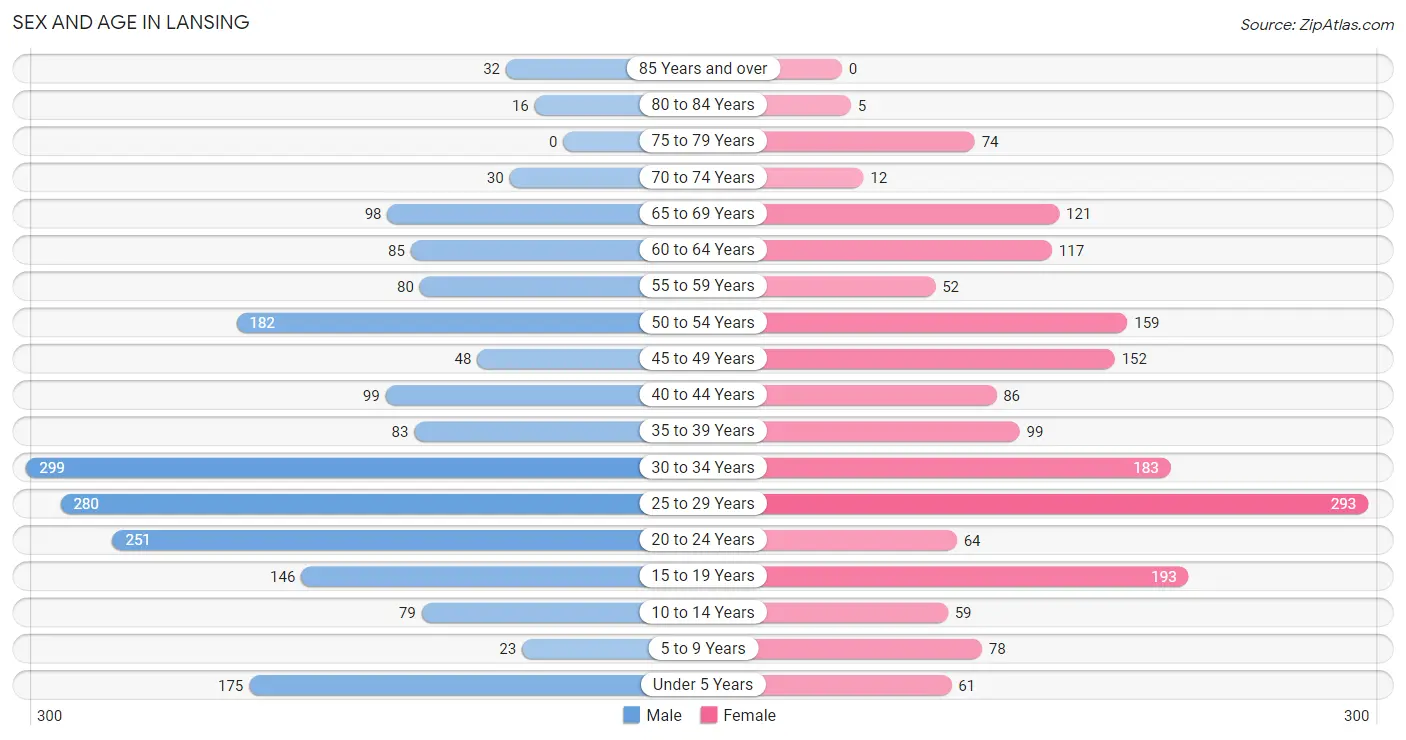
The most populous age groups in Lansing are 30 to 34 Years (299 | 14.9%) for men and 25 to 29 Years (293 | 16.2%) for women.
| Age Bracket | Male | Female |
| Under 5 Years | 175 (8.7%) | 61 (3.4%) |
| 5 to 9 Years | 23 (1.1%) | 78 (4.3%) |
| 10 to 14 Years | 79 (3.9%) | 59 (3.3%) |
| 15 to 19 Years | 146 (7.3%) | 193 (10.7%) |
| 20 to 24 Years | 251 (12.5%) | 64 (3.5%) |
| 25 to 29 Years | 280 (14.0%) | 293 (16.2%) |
| 30 to 34 Years | 299 (14.9%) | 183 (10.1%) |
| 35 to 39 Years | 83 (4.1%) | 99 (5.5%) |
| 40 to 44 Years | 99 (4.9%) | 86 (4.8%) |
| 45 to 49 Years | 48 (2.4%) | 152 (8.4%) |
| 50 to 54 Years | 182 (9.1%) | 159 (8.8%) |
| 55 to 59 Years | 80 (4.0%) | 52 (2.9%) |
| 60 to 64 Years | 85 (4.2%) | 117 (6.5%) |
| 65 to 69 Years | 98 (4.9%) | 121 (6.7%) |
| 70 to 74 Years | 30 (1.5%) | 12 (0.7%) |
| 75 to 79 Years | 0 (0.0%) | 74 (4.1%) |
| 80 to 84 Years | 16 (0.8%) | 5 (0.3%) |
| 85 Years and over | 32 (1.6%) | 0 (0.0%) |
| Total | 2,006 (100.0%) | 1,808 (100.0%) |
Families and Households in Lansing
Median Family Size in Lansing
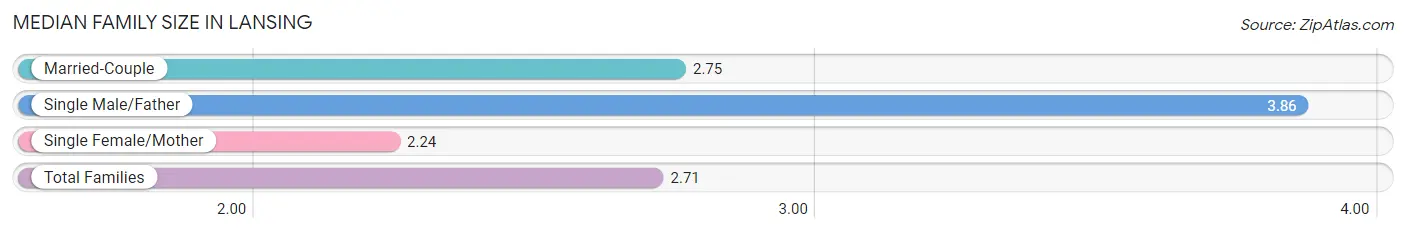
The median family size in Lansing is 2.71 persons per family, with single male/father families (44 | 4.9%) accounting for the largest median family size of 3.86 persons per family. On the other hand, single female/mother families (156 | 17.2%) represent the smallest median family size with 2.24 persons per family.
| Family Type | # Families | Family Size |
| Married-Couple | 706 (77.9%) | 2.75 |
| Single Male/Father | 44 (4.9%) | 3.86 |
| Single Female/Mother | 156 (17.2%) | 2.24 |
| Total Families | 906 (100.0%) | 2.71 |
Median Household Size in Lansing
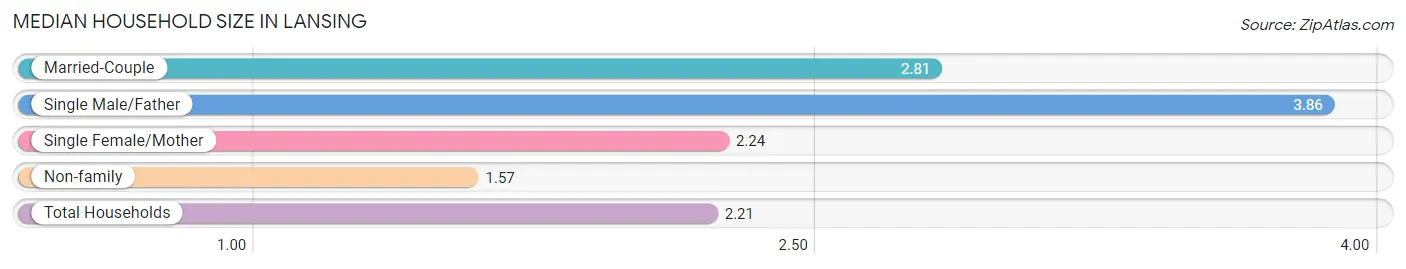
The median household size in Lansing is 2.21 persons per household, with single male/father households (44 | 2.6%) accounting for the largest median household size of 3.86 persons per household. non-family households (799 | 46.9%) represent the smallest median household size with 1.57 persons per household.
| Household Type | # Households | Household Size |
| Married-Couple | 706 (41.4%) | 2.81 |
| Single Male/Father | 44 (2.6%) | 3.86 |
| Single Female/Mother | 156 (9.1%) | 2.24 |
| Non-family | 799 (46.9%) | 1.57 |
| Total Households | 1,705 (100.0%) | 2.21 |
Household Size by Marriage Status in Lansing
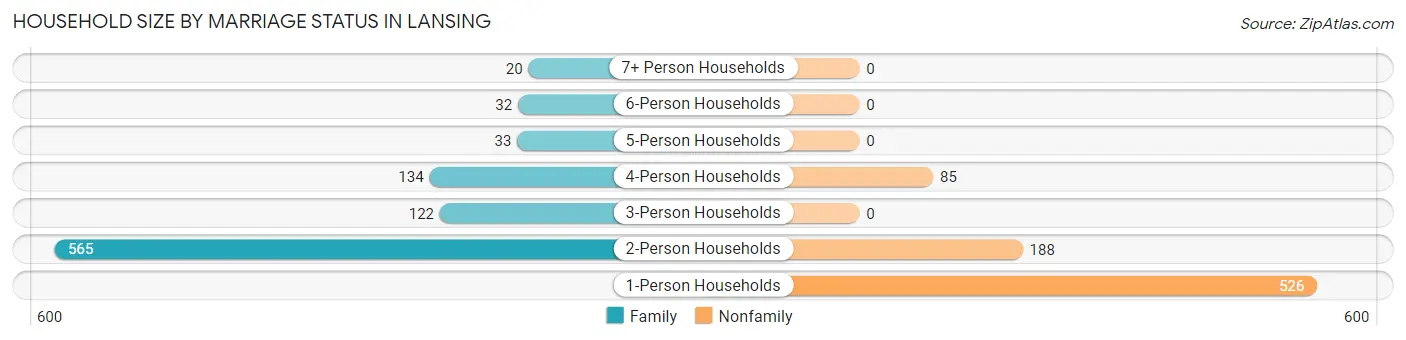
Out of a total of 1,705 households in Lansing, 906 (53.1%) are family households, while 799 (46.9%) are nonfamily households. The most numerous type of family households are 2-person households, comprising 565, and the most common type of nonfamily households are 1-person households, comprising 526.
| Household Size | Family Households | Nonfamily Households |
| 1-Person Households | - | 526 (30.8%) |
| 2-Person Households | 565 (33.1%) | 188 (11.0%) |
| 3-Person Households | 122 (7.2%) | 0 (0.0%) |
| 4-Person Households | 134 (7.9%) | 85 (5.0%) |
| 5-Person Households | 33 (1.9%) | 0 (0.0%) |
| 6-Person Households | 32 (1.9%) | 0 (0.0%) |
| 7+ Person Households | 20 (1.2%) | 0 (0.0%) |
| Total | 906 (53.1%) | 799 (46.9%) |
Female Fertility in Lansing
Fertility by Age in Lansing
Average fertility rate in Lansing is 50.0 births per 1,000 women. Women in the age bracket of 35 to 50 years have the highest fertility rate with 110.0 births per 1,000 women. Women in the age bracket of 35 to 50 years acount for 75.0% of all women with births.
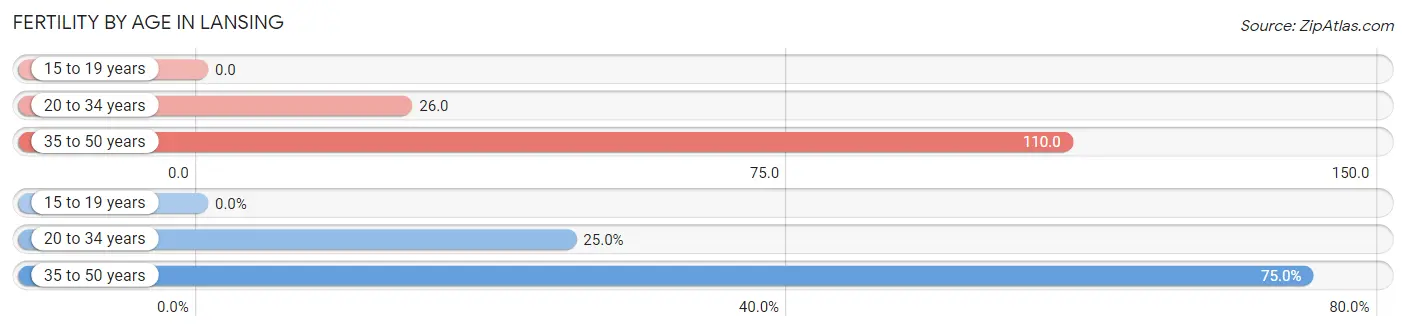
| Age Bracket | Women with Births | Births / 1,000 Women |
| 15 to 19 years | 0 (0.0%) | 0.0 |
| 20 to 34 years | 14 (25.0%) | 26.0 |
| 35 to 50 years | 42 (75.0%) | 110.0 |
| Total | 56 (100.0%) | 50.0 |
Fertility by Age by Marriage Status in Lansing
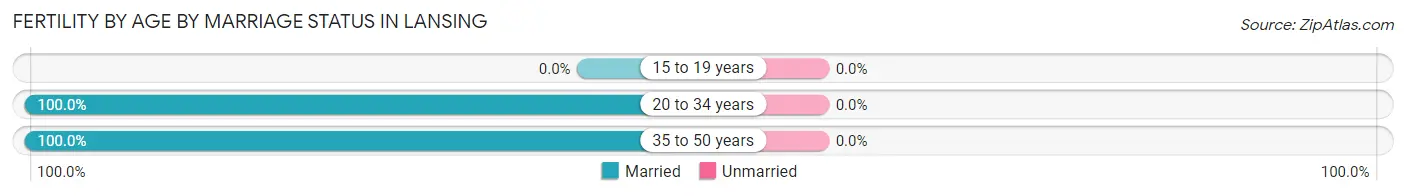
| Age Bracket | Married | Unmarried |
| 15 to 19 years | 0 (0.0%) | 0 (0.0%) |
| 20 to 34 years | 14 (100.0%) | 0 (0.0%) |
| 35 to 50 years | 42 (100.0%) | 0 (0.0%) |
| Total | 56 (100.0%) | 0 (0.0%) |
Fertility by Education in Lansing
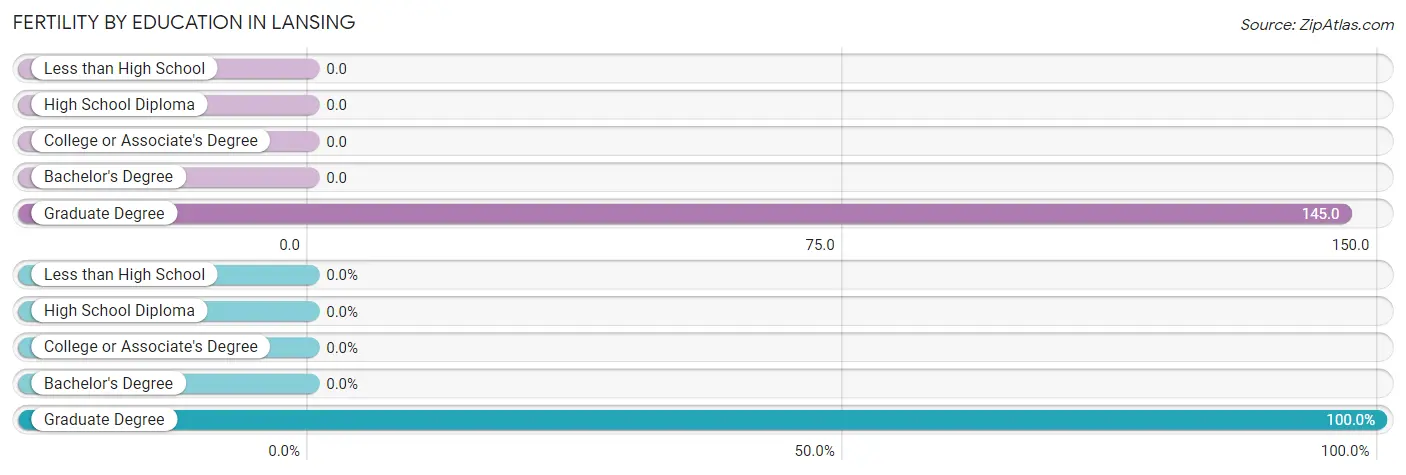
| Educational Attainment | Women with Births | Births / 1,000 Women |
| Less than High School | 0 (0.0%) | 0.0 |
| High School Diploma | 0 (0.0%) | 0.0 |
| College or Associate's Degree | 0 (0.0%) | 0.0 |
| Bachelor's Degree | 0 (0.0%) | 0.0 |
| Graduate Degree | 56 (100.0%) | 145.0 |
| Total | 56 (100.0%) | 50.0 |
Fertility by Education by Marriage Status in Lansing
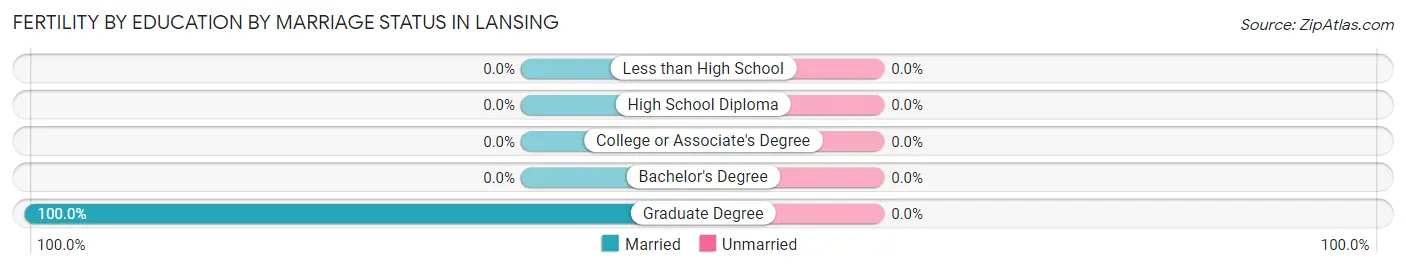
| Educational Attainment | Married | Unmarried |
| Less than High School | 0 (0.0%) | 0 (0.0%) |
| High School Diploma | 0 (0.0%) | 0 (0.0%) |
| College or Associate's Degree | 0 (0.0%) | 0 (0.0%) |
| Bachelor's Degree | 0 (0.0%) | 0 (0.0%) |
| Graduate Degree | 56 (100.0%) | 0 (0.0%) |
| Total | 56 (100.0%) | 0 (0.0%) |
Income in Lansing
Income Overview in Lansing
Per Capita Income in Lansing is $59,542, while median incomes of families and households are $121,776 and $75,245 respectively.
| Characteristic | Number | Measure |
| Per Capita Income | 3,814 | $59,542 |
| Median Family Income | 906 | $121,776 |
| Mean Family Income | 906 | $147,640 |
| Median Household Income | 1,705 | $75,245 |
| Mean Household Income | 1,705 | $134,662 |
| Income Deficit | 906 | $0 |
| Wage / Income Gap (%) | 3,814 | 0.26% |
| Wage / Income Gap ($) | 3,814 | 99.74¢ per $1 |
| Gini / Inequality Index | 3,814 | 0.55 |
Earnings by Sex in Lansing
Average Earnings in Lansing are $40,202, $40,174 for men and $40,278 for women, a difference of 0.3%.
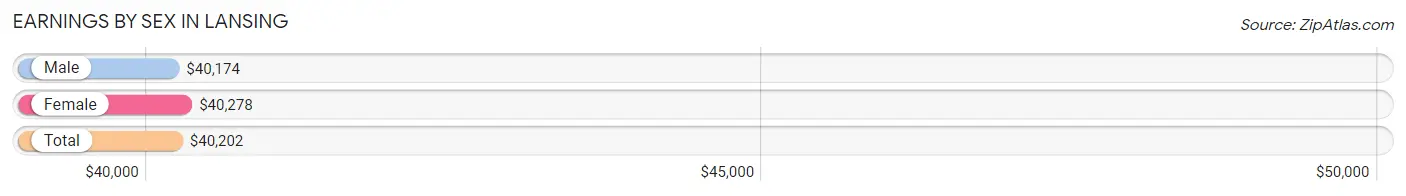
| Sex | Number | Average Earnings |
| Male | 1,414 (54.5%) | $40,174 |
| Female | 1,178 (45.5%) | $40,278 |
| Total | 2,592 (100.0%) | $40,202 |
Earnings by Sex by Income Bracket in Lansing
The most common earnings brackets in Lansing are $100,000+ for men (309 | 21.8%) and $100,000+ for women (275 | 23.3%).
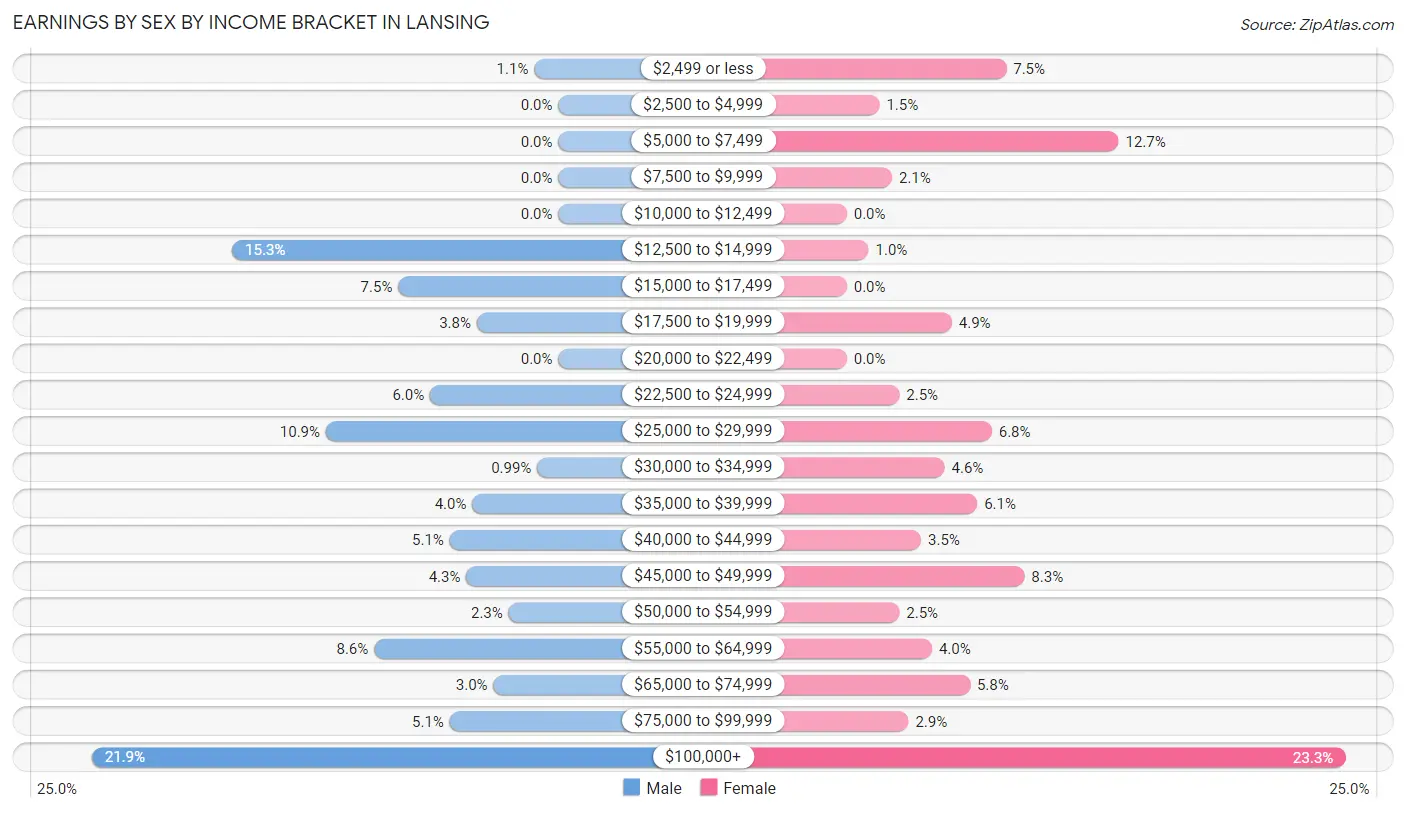
| Income | Male | Female |
| $2,499 or less | 16 (1.1%) | 88 (7.5%) |
| $2,500 to $4,999 | 0 (0.0%) | 18 (1.5%) |
| $5,000 to $7,499 | 0 (0.0%) | 150 (12.7%) |
| $7,500 to $9,999 | 0 (0.0%) | 25 (2.1%) |
| $10,000 to $12,499 | 0 (0.0%) | 0 (0.0%) |
| $12,500 to $14,999 | 216 (15.3%) | 12 (1.0%) |
| $15,000 to $17,499 | 106 (7.5%) | 0 (0.0%) |
| $17,500 to $19,999 | 54 (3.8%) | 58 (4.9%) |
| $20,000 to $22,499 | 0 (0.0%) | 0 (0.0%) |
| $22,500 to $24,999 | 85 (6.0%) | 29 (2.5%) |
| $25,000 to $29,999 | 154 (10.9%) | 80 (6.8%) |
| $30,000 to $34,999 | 14 (1.0%) | 54 (4.6%) |
| $35,000 to $39,999 | 57 (4.0%) | 72 (6.1%) |
| $40,000 to $44,999 | 72 (5.1%) | 41 (3.5%) |
| $45,000 to $49,999 | 61 (4.3%) | 98 (8.3%) |
| $50,000 to $54,999 | 33 (2.3%) | 29 (2.5%) |
| $55,000 to $64,999 | 122 (8.6%) | 47 (4.0%) |
| $65,000 to $74,999 | 43 (3.0%) | 68 (5.8%) |
| $75,000 to $99,999 | 72 (5.1%) | 34 (2.9%) |
| $100,000+ | 309 (21.8%) | 275 (23.3%) |
| Total | 1,414 (100.0%) | 1,178 (100.0%) |
Earnings by Sex by Educational Attainment in Lansing
Average earnings in Lansing are $55,605 for men and $47,473 for women, a difference of 14.6%. Men with an educational attainment of graduate degree enjoy the highest average annual earnings of $58,263, while those with high school diploma education earn the least with $36,316. Women with an educational attainment of graduate degree earn the most with the average annual earnings of $68,750, while those with bachelor's degree education have the smallest earnings of $49,716.
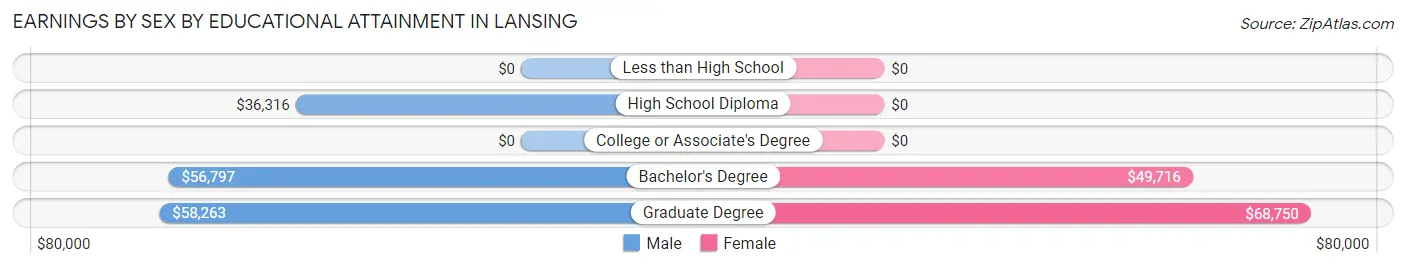
| Educational Attainment | Male Income | Female Income |
| Less than High School | - | - |
| High School Diploma | $36,316 | $0 |
| College or Associate's Degree | - | - |
| Bachelor's Degree | $56,797 | $49,716 |
| Graduate Degree | $58,263 | $68,750 |
| Total | $55,605 | $47,473 |
Family Income in Lansing
Family Income Brackets in Lansing
According to the Lansing family income data, there are 293 families falling into the $200,000+ income range, which is the most common income bracket and makes up 32.3% of all families. Conversely, the $10,000 to $14,999 income bracket is the least frequent group with only 7 families (0.8%) belonging to this category.
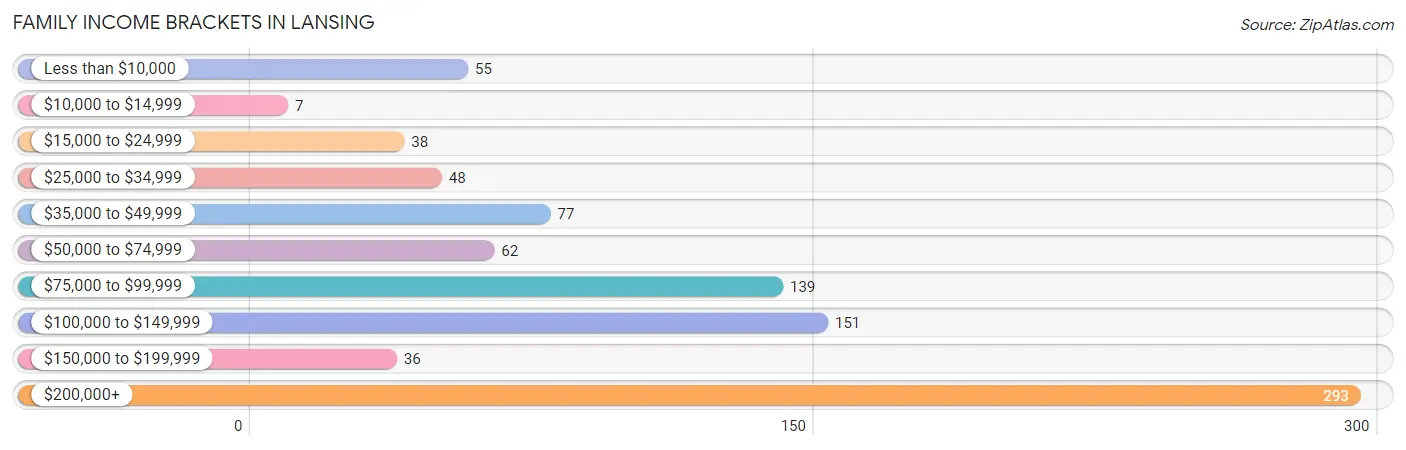
| Income Bracket | # Families | % Families |
| Less than $10,000 | 55 | 6.1% |
| $10,000 to $14,999 | 7 | 0.8% |
| $15,000 to $24,999 | 38 | 4.2% |
| $25,000 to $34,999 | 48 | 5.3% |
| $35,000 to $49,999 | 77 | 8.5% |
| $50,000 to $74,999 | 62 | 6.8% |
| $75,000 to $99,999 | 139 | 15.3% |
| $100,000 to $149,999 | 151 | 16.7% |
| $150,000 to $199,999 | 36 | 4.0% |
| $200,000+ | 293 | 32.3% |
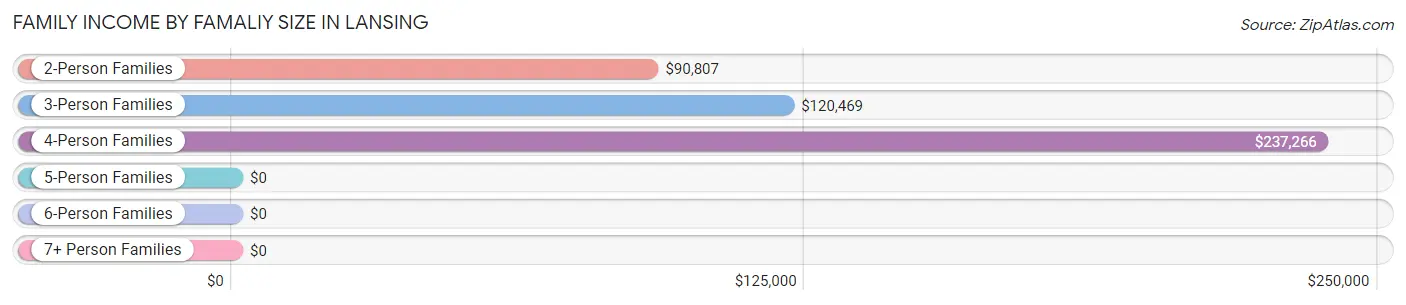
Family Income by Famaliy Size in Lansing
4-person families (166 | 18.3%) account for the highest median family income in Lansing with $237,266 per family, while 4-person families (166 | 18.3%) have the highest median income of $59,316 per family member.
| Income Bracket | # Families | Median Income |
| 2-Person Families | 565 (62.4%) | $90,807 |
| 3-Person Families | 122 (13.5%) | $120,469 |
| 4-Person Families | 166 (18.3%) | $237,266 |
| 5-Person Families | 33 (3.6%) | $0 |
| 6-Person Families | 0 (0.0%) | $0 |
| 7+ Person Families | 20 (2.2%) | $0 |
| Total | 906 (100.0%) | $121,776 |
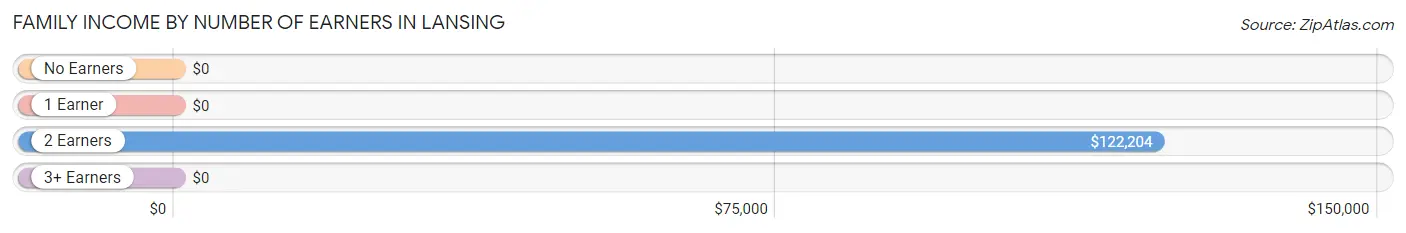
Family Income by Number of Earners in Lansing
| Number of Earners | # Families | Median Income |
| No Earners | 110 (12.1%) | $0 |
| 1 Earner | 275 (30.3%) | $0 |
| 2 Earners | 403 (44.5%) | $122,204 |
| 3+ Earners | 118 (13.0%) | $0 |
| Total | 906 (100.0%) | $121,776 |
Household Income in Lansing
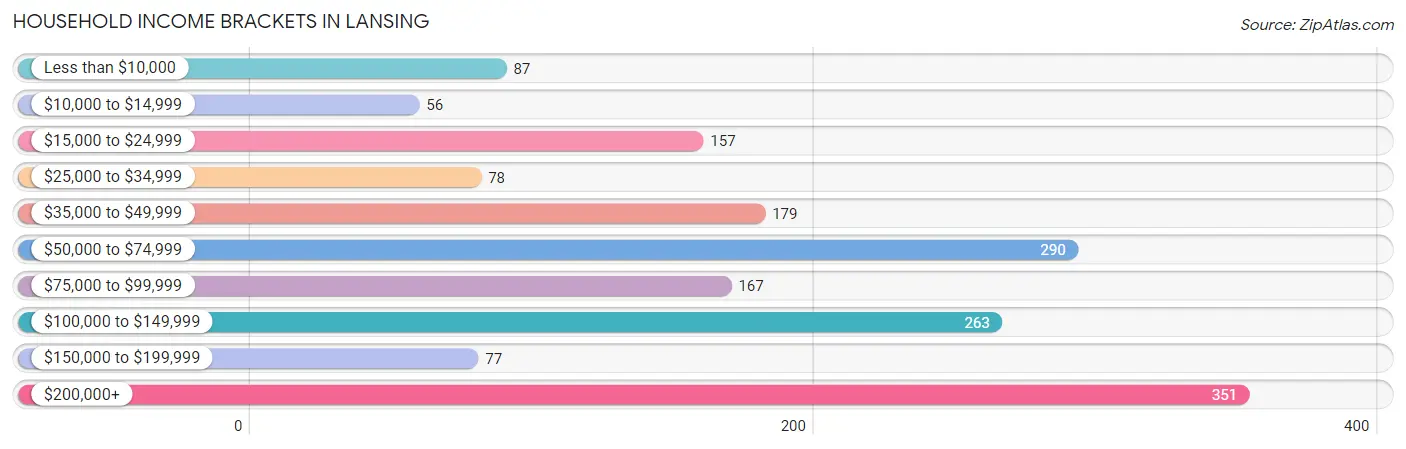
Household Income Brackets in Lansing
With 351 households falling in the category, the $200,000+ income range is the most frequent in Lansing, accounting for 20.6% of all households. In contrast, only 56 households (3.3%) fall into the $10,000 to $14,999 income bracket, making it the least populous group.
| Income Bracket | # Households | % Households |
| Less than $10,000 | 87 | 5.1% |
| $10,000 to $14,999 | 56 | 3.3% |
| $15,000 to $24,999 | 157 | 9.2% |
| $25,000 to $34,999 | 78 | 4.6% |
| $35,000 to $49,999 | 179 | 10.5% |
| $50,000 to $74,999 | 290 | 17.0% |
| $75,000 to $99,999 | 167 | 9.8% |
| $100,000 to $149,999 | 263 | 15.4% |
| $150,000 to $199,999 | 77 | 4.5% |
| $200,000+ | 351 | 20.6% |
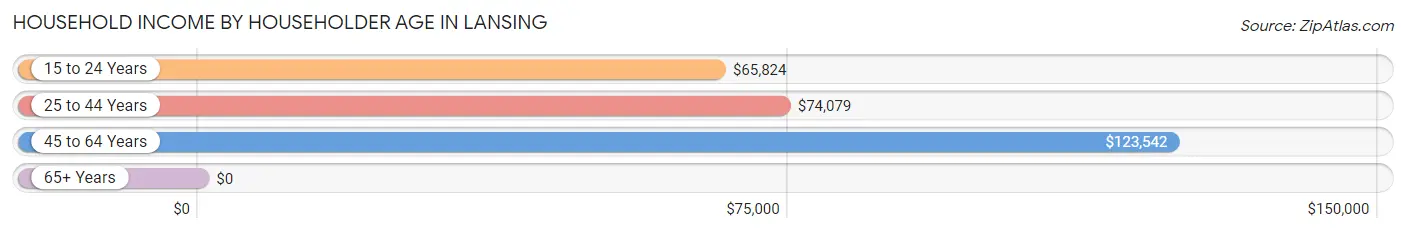
Household Income by Householder Age in Lansing
The median household income in Lansing is $75,245, with the highest median household income of $123,542 found in the 45 to 64 years age bracket for the primary householder. A total of 479 households (28.1%) fall into this category. Meanwhile, the 65+ years age bracket for the primary householder has the lowest median household income of $0, with 268 households (15.7%) in this group.
| Income Bracket | # Households | Median Income |
| 15 to 24 Years | 170 (10.0%) | $65,824 |
| 25 to 44 Years | 788 (46.2%) | $74,079 |
| 45 to 64 Years | 479 (28.1%) | $123,542 |
| 65+ Years | 268 (15.7%) | $0 |
| Total | 1,705 (100.0%) | $75,245 |
Poverty in Lansing
Income Below Poverty by Sex and Age in Lansing
With 10.8% poverty level for males and 13.2% for females among the residents of Lansing, 18 to 24 year old males and 18 to 24 year old females are the most vulnerable to poverty, with 112 males (28.9%) and 85 females (51.5%) in their respective age groups living below the poverty level.
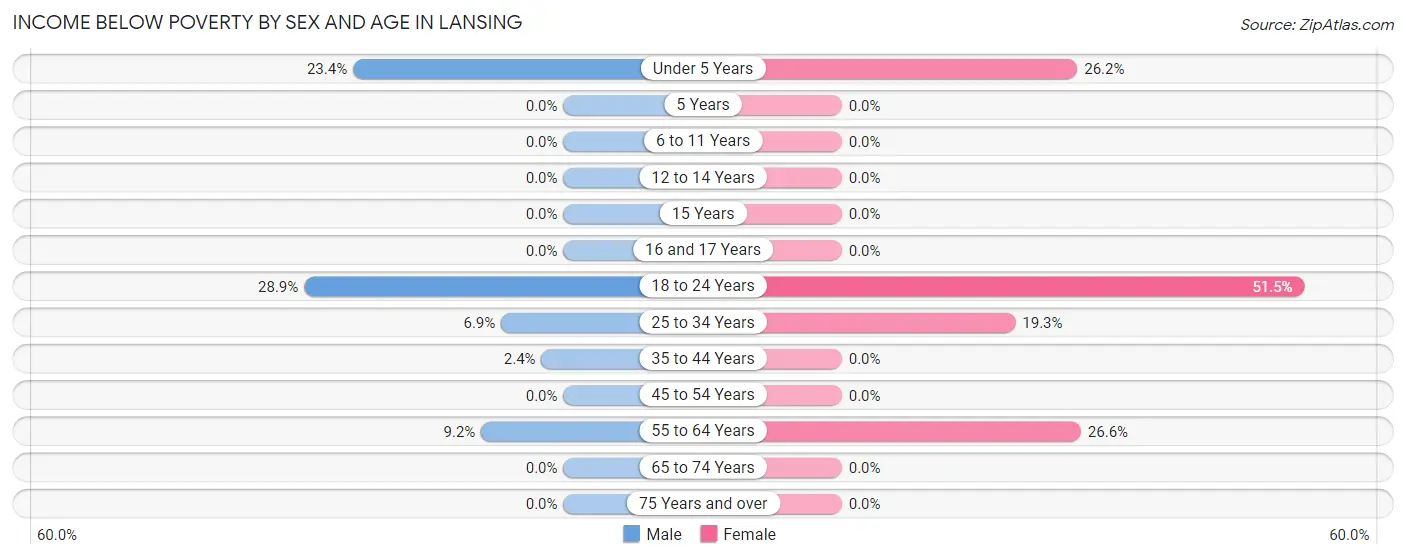
| Age Bracket | Male | Female |
| Under 5 Years | 41 (23.4%) | 16 (26.2%) |
| 5 Years | 0 (0.0%) | 0 (0.0%) |
| 6 to 11 Years | 0 (0.0%) | 0 (0.0%) |
| 12 to 14 Years | 0 (0.0%) | 0 (0.0%) |
| 15 Years | 0 (0.0%) | 0 (0.0%) |
| 16 and 17 Years | 0 (0.0%) | 0 (0.0%) |
| 18 to 24 Years | 112 (28.9%) | 85 (51.5%) |
| 25 to 34 Years | 39 (6.9%) | 92 (19.3%) |
| 35 to 44 Years | 4 (2.4%) | 0 (0.0%) |
| 45 to 54 Years | 0 (0.0%) | 0 (0.0%) |
| 55 to 64 Years | 15 (9.1%) | 45 (26.6%) |
| 65 to 74 Years | 0 (0.0%) | 0 (0.0%) |
| 75 Years and over | 0 (0.0%) | 0 (0.0%) |
| Total | 211 (10.8%) | 238 (13.2%) |
Income Above Poverty by Sex and Age in Lansing
According to the poverty statistics in Lansing, males aged 6 to 11 years and females aged 5 years are the age groups that are most secure financially, with 100.0% of males and 100.0% of females in these age groups living above the poverty line.
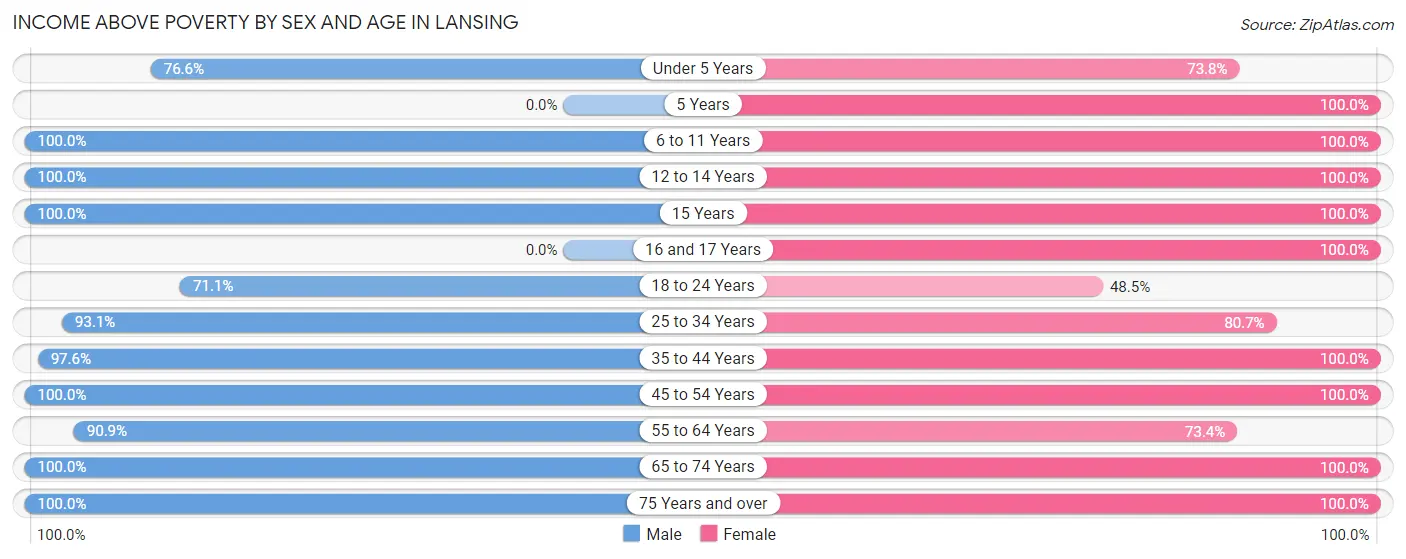
| Age Bracket | Male | Female |
| Under 5 Years | 134 (76.6%) | 45 (73.8%) |
| 5 Years | 0 (0.0%) | 33 (100.0%) |
| 6 to 11 Years | 84 (100.0%) | 58 (100.0%) |
| 12 to 14 Years | 18 (100.0%) | 46 (100.0%) |
| 15 Years | 1 (100.0%) | 37 (100.0%) |
| 16 and 17 Years | 0 (0.0%) | 55 (100.0%) |
| 18 to 24 Years | 276 (71.1%) | 80 (48.5%) |
| 25 to 34 Years | 524 (93.1%) | 384 (80.7%) |
| 35 to 44 Years | 160 (97.6%) | 185 (100.0%) |
| 45 to 54 Years | 223 (100.0%) | 311 (100.0%) |
| 55 to 64 Years | 149 (90.8%) | 124 (73.4%) |
| 65 to 74 Years | 128 (100.0%) | 133 (100.0%) |
| 75 Years and over | 48 (100.0%) | 79 (100.0%) |
| Total | 1,745 (89.2%) | 1,570 (86.8%) |
Income Below Poverty Among Married-Couple Families in Lansing
The poverty statistics for married-couple families in Lansing show that 1.0% or 7 of the total 706 families live below the poverty line. Families with no children have the highest poverty rate of 1.5%, comprising of 7 families. On the other hand, families with 1 or 2 children have the lowest poverty rate of 0.0%, which includes 0 families.
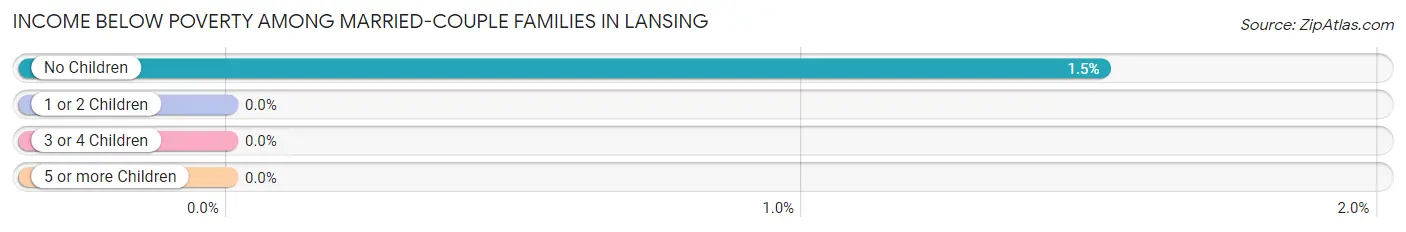
| Children | Above Poverty | Below Poverty |
| No Children | 454 (98.5%) | 7 (1.5%) |
| 1 or 2 Children | 225 (100.0%) | 0 (0.0%) |
| 3 or 4 Children | 20 (100.0%) | 0 (0.0%) |
| 5 or more Children | 0 (0.0%) | 0 (0.0%) |
| Total | 699 (99.0%) | 7 (1.0%) |
Income Below Poverty Among Single-Parent Households in Lansing
According to the poverty data in Lansing, 9.1% or 4 single-father households and 35.3% or 55 single-mother households are living below the poverty line. Among single-father households, those with 1 or 2 children have the highest poverty rate, with 4 households (50.0%) experiencing poverty. Likewise, among single-mother households, those with 1 or 2 children have the highest poverty rate, with 55 households (79.7%) falling below the poverty line.
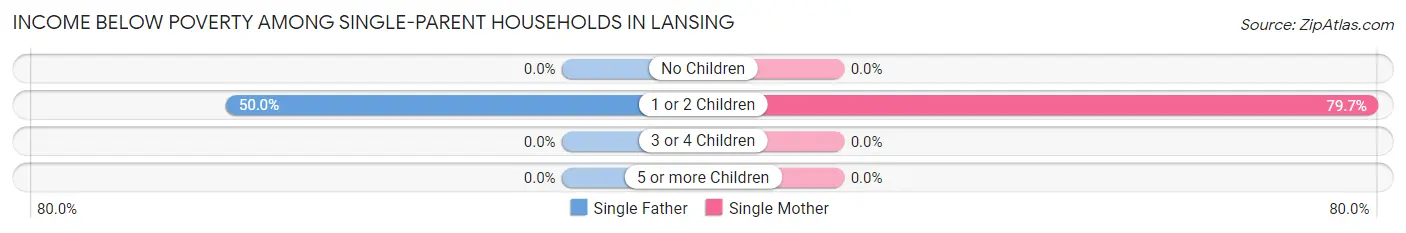
| Children | Single Father | Single Mother |
| No Children | 0 (0.0%) | 0 (0.0%) |
| 1 or 2 Children | 4 (50.0%) | 55 (79.7%) |
| 3 or 4 Children | 0 (0.0%) | 0 (0.0%) |
| 5 or more Children | 0 (0.0%) | 0 (0.0%) |
| Total | 4 (9.1%) | 55 (35.3%) |
Income Below Poverty Among Married-Couple vs Single-Parent Households in Lansing
The poverty data for Lansing shows that 7 of the married-couple family households (1.0%) and 59 of the single-parent households (29.5%) are living below the poverty level. Within the married-couple family households, those with no children have the highest poverty rate, with 7 households (1.5%) falling below the poverty line. Among the single-parent households, those with 1 or 2 children have the highest poverty rate, with 59 household (76.6%) living below poverty.
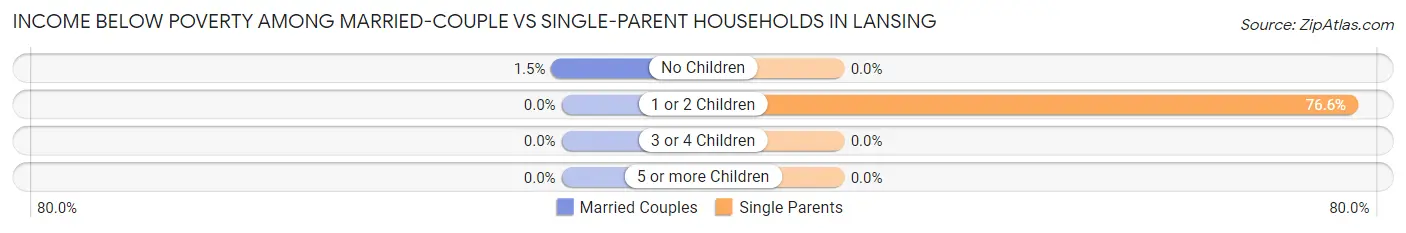
| Children | Married-Couple Families | Single-Parent Households |
| No Children | 7 (1.5%) | 0 (0.0%) |
| 1 or 2 Children | 0 (0.0%) | 59 (76.6%) |
| 3 or 4 Children | 0 (0.0%) | 0 (0.0%) |
| 5 or more Children | 0 (0.0%) | 0 (0.0%) |
| Total | 7 (1.0%) | 59 (29.5%) |
Employment Characteristics in Lansing
Employment by Class of Employer in Lansing
Among the 2,289 employed individuals in Lansing, private company employees (904 | 39.5%), not-for-profit organizations (771 | 33.7%), and local government employees (185 | 8.1%) make up the most common classes of employment.
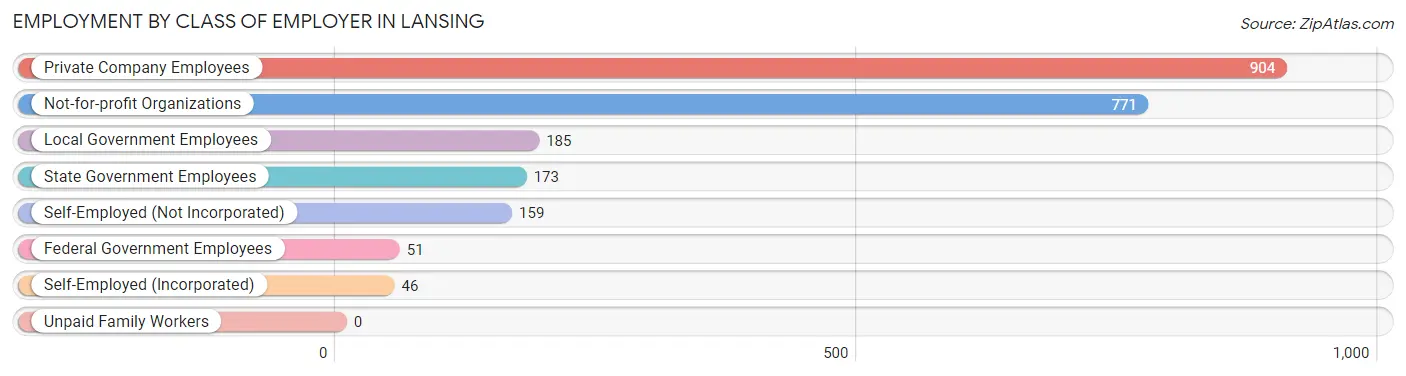
| Employer Class | # Employees | % Employees |
| Private Company Employees | 904 | 39.5% |
| Self-Employed (Incorporated) | 46 | 2.0% |
| Self-Employed (Not Incorporated) | 159 | 7.0% |
| Not-for-profit Organizations | 771 | 33.7% |
| Local Government Employees | 185 | 8.1% |
| State Government Employees | 173 | 7.6% |
| Federal Government Employees | 51 | 2.2% |
| Unpaid Family Workers | 0 | 0.0% |
| Total | 2,289 | 100.0% |
Employment Status by Age in Lansing
According to the labor force statistics for Lansing, out of the total population over 16 years of age (3,301), 72.7% or 2,400 individuals are in the labor force, with 3.8% or 91 of them unemployed. The age group with the highest labor force participation rate is 20 to 24 years, with 97.5% or 307 individuals in the labor force. Within the labor force, the 20 to 24 years age range has the highest percentage of unemployed individuals, with 23.5% or 72 of them being unemployed.
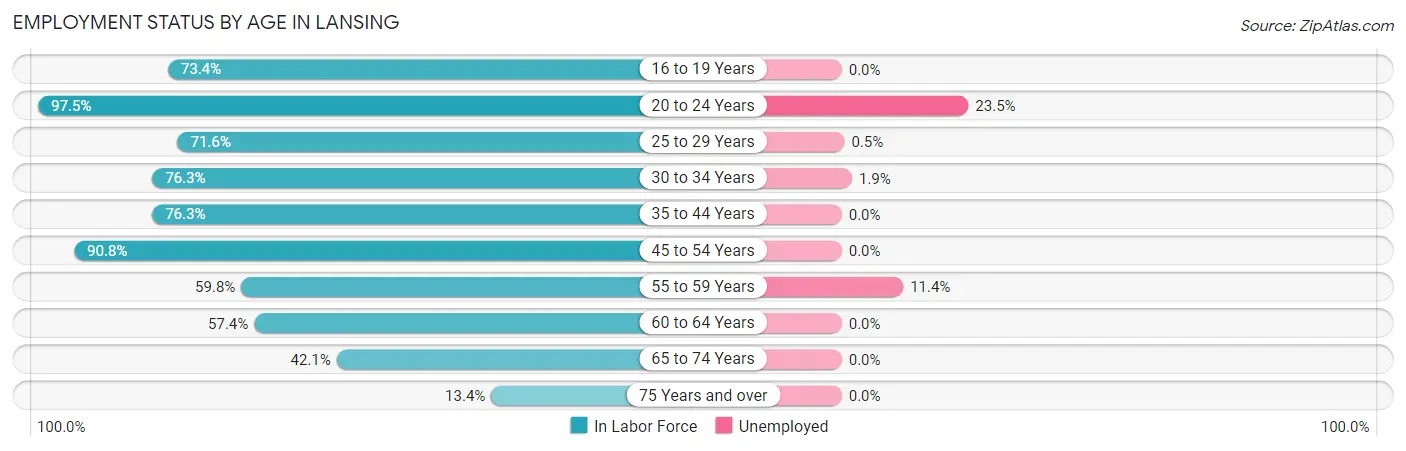
| Age Bracket | In Labor Force | Unemployed |
| 16 to 19 Years | 221 (73.4%) | 0 (0.0%) |
| 20 to 24 Years | 307 (97.5%) | 72 (23.5%) |
| 25 to 29 Years | 410 (71.6%) | 2 (0.5%) |
| 30 to 34 Years | 368 (76.3%) | 7 (1.9%) |
| 35 to 44 Years | 280 (76.3%) | 0 (0.0%) |
| 45 to 54 Years | 491 (90.8%) | 0 (0.0%) |
| 55 to 59 Years | 79 (59.8%) | 9 (11.4%) |
| 60 to 64 Years | 116 (57.4%) | 0 (0.0%) |
| 65 to 74 Years | 110 (42.1%) | 0 (0.0%) |
| 75 Years and over | 17 (13.4%) | 0 (0.0%) |
| Total | 2,400 (72.7%) | 91 (3.8%) |
Employment Status by Educational Attainment in Lansing
According to labor force statistics for Lansing, 75.9% of individuals (1,743) out of the total population between 25 and 64 years of age (2,297) are in the labor force, with 1.0% or 17 of them being unemployed. The group with the highest labor force participation rate are those with the educational attainment of bachelor's degree or higher, with 82.2% or 1,454 individuals in the labor force. Within the labor force, individuals with high school diploma education have the highest percentage of unemployment, with 2.8% or 2 of them being unemployed.
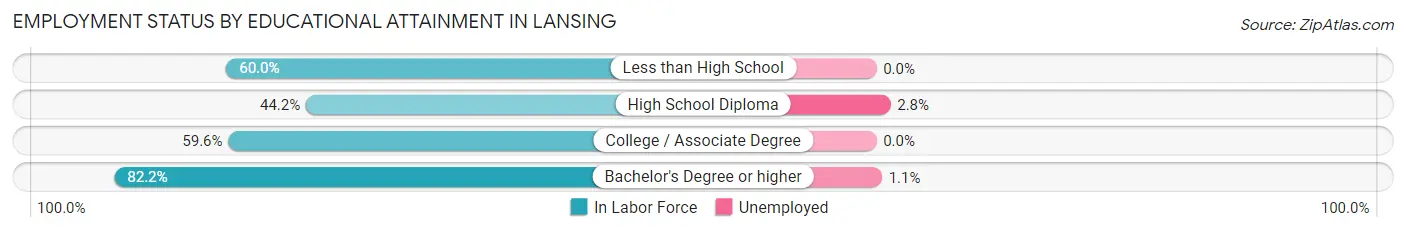
| Educational Attainment | In Labor Force | Unemployed |
| Less than High School | 75 (60.0%) | 0 (0.0%) |
| High School Diploma | 72 (44.2%) | 5 (2.8%) |
| College / Associate Degree | 143 (59.6%) | 0 (0.0%) |
| Bachelor's Degree or higher | 1,454 (82.2%) | 19 (1.1%) |
| Total | 1,743 (75.9%) | 23 (1.0%) |
Employment Occupations by Sex in Lansing
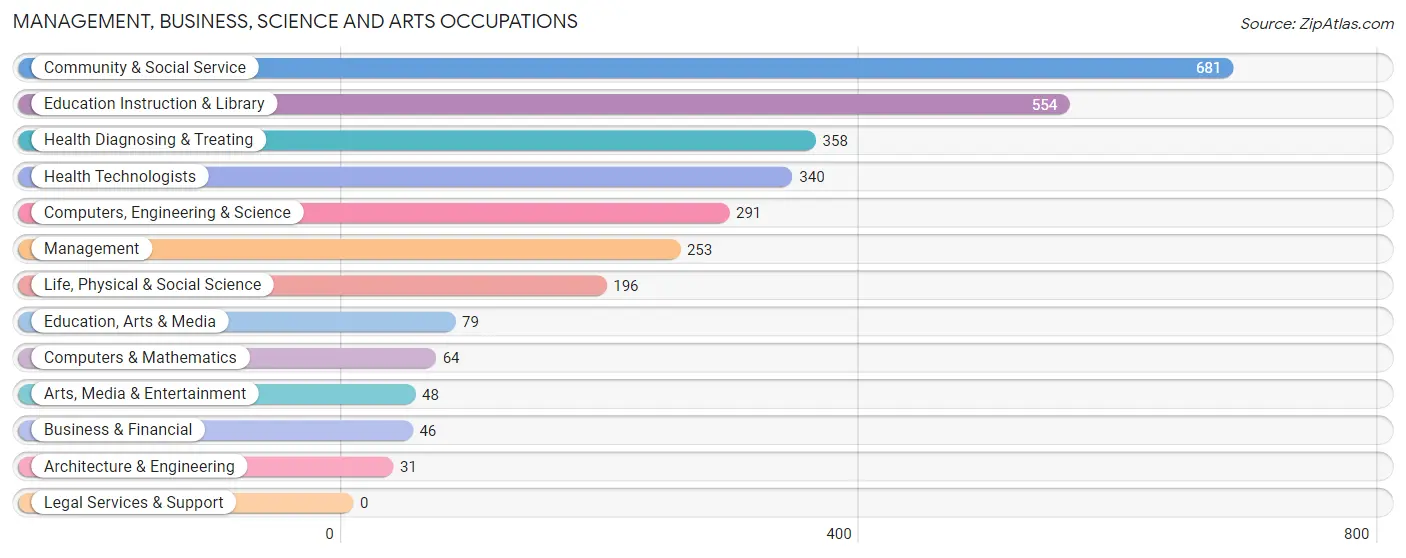
Management, Business, Science and Arts Occupations
The most common Management, Business, Science and Arts occupations in Lansing are Community & Social Service (681 | 29.5%), Education Instruction & Library (554 | 24.0%), Health Diagnosing & Treating (358 | 15.5%), Health Technologists (340 | 14.7%), and Computers, Engineering & Science (291 | 12.6%).
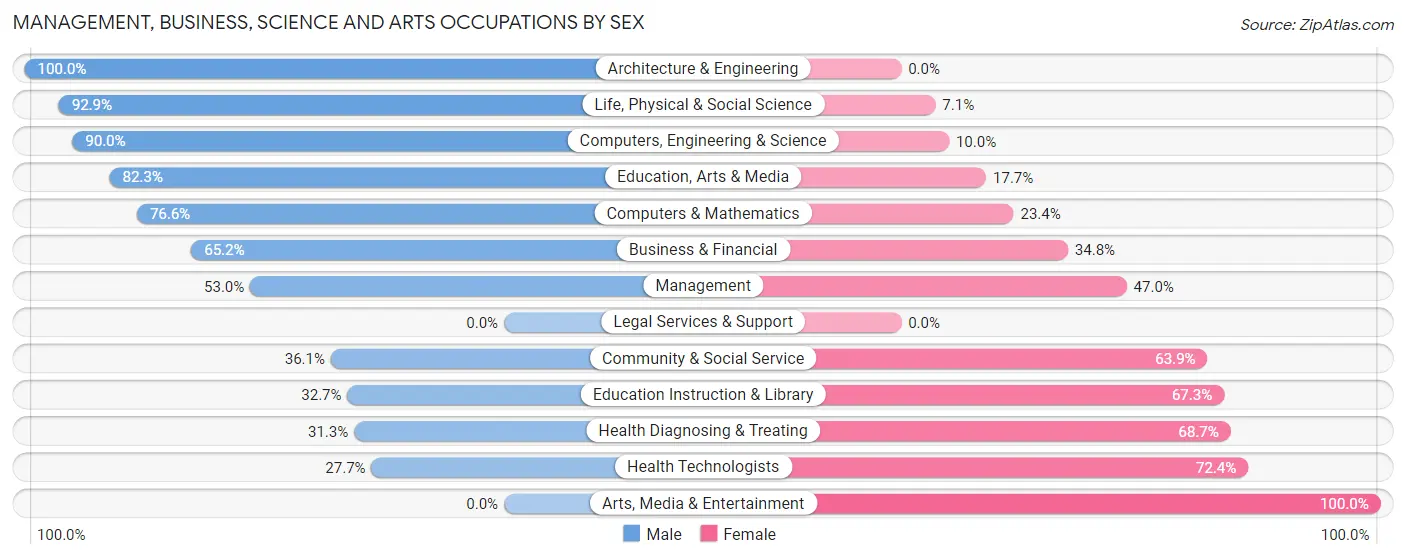
Management, Business, Science and Arts Occupations by Sex
Within the Management, Business, Science and Arts occupations in Lansing, the most male-oriented occupations are Architecture & Engineering (100.0%), Life, Physical & Social Science (92.9%), and Computers, Engineering & Science (90.0%), while the most female-oriented occupations are Arts, Media & Entertainment (100.0%), Health Technologists (72.4%), and Health Diagnosing & Treating (68.7%).
| Occupation | Male | Female |
| Management | 134 (53.0%) | 119 (47.0%) |
| Business & Financial | 30 (65.2%) | 16 (34.8%) |
| Computers, Engineering & Science | 262 (90.0%) | 29 (10.0%) |
| Computers & Mathematics | 49 (76.6%) | 15 (23.4%) |
| Architecture & Engineering | 31 (100.0%) | 0 (0.0%) |
| Life, Physical & Social Science | 182 (92.9%) | 14 (7.1%) |
| Community & Social Service | 246 (36.1%) | 435 (63.9%) |
| Education, Arts & Media | 65 (82.3%) | 14 (17.7%) |
| Legal Services & Support | 0 (0.0%) | 0 (0.0%) |
| Education Instruction & Library | 181 (32.7%) | 373 (67.3%) |
| Arts, Media & Entertainment | 0 (0.0%) | 48 (100.0%) |
| Health Diagnosing & Treating | 112 (31.3%) | 246 (68.7%) |
| Health Technologists | 94 (27.7%) | 246 (72.4%) |
| Total (Category) | 784 (48.1%) | 845 (51.9%) |
| Total (Overall) | 1,233 (53.4%) | 1,076 (46.6%) |
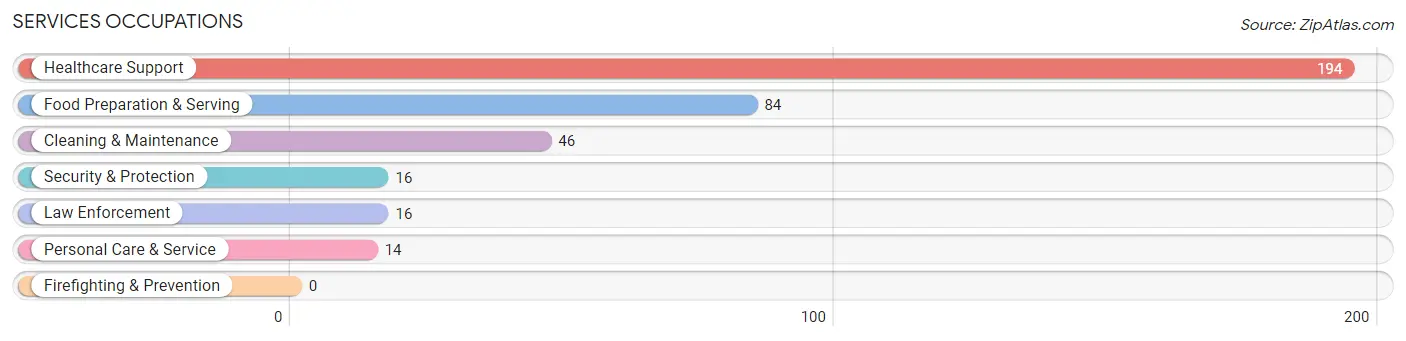
Services Occupations
The most common Services occupations in Lansing are Healthcare Support (194 | 8.4%), Food Preparation & Serving (84 | 3.6%), Cleaning & Maintenance (46 | 2.0%), Security & Protection (16 | 0.7%), and Law Enforcement (16 | 0.7%).
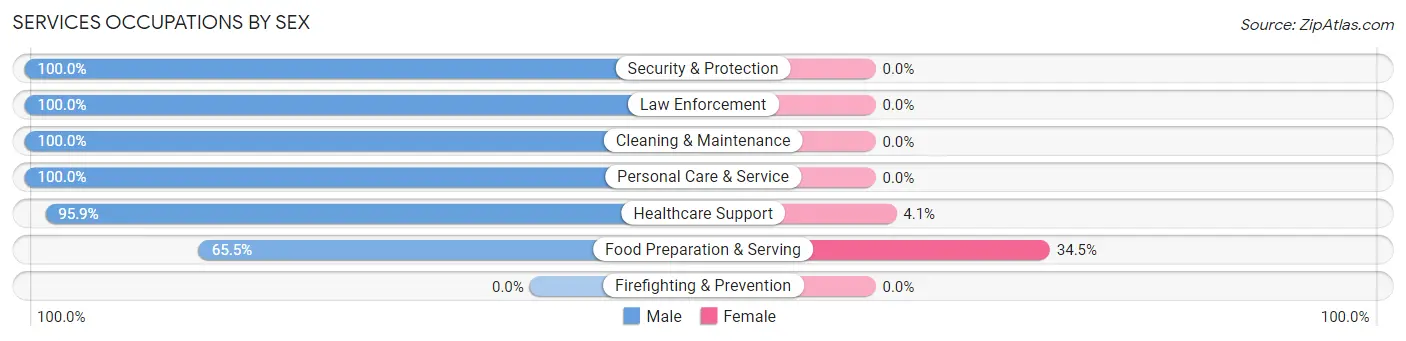
Services Occupations by Sex
Within the Services occupations in Lansing, the most male-oriented occupations are Security & Protection (100.0%), Law Enforcement (100.0%), and Cleaning & Maintenance (100.0%), while the most female-oriented occupations are Food Preparation & Serving (34.5%), and Healthcare Support (4.1%).
| Occupation | Male | Female |
| Healthcare Support | 186 (95.9%) | 8 (4.1%) |
| Security & Protection | 16 (100.0%) | 0 (0.0%) |
| Firefighting & Prevention | 0 (0.0%) | 0 (0.0%) |
| Law Enforcement | 16 (100.0%) | 0 (0.0%) |
| Food Preparation & Serving | 55 (65.5%) | 29 (34.5%) |
| Cleaning & Maintenance | 46 (100.0%) | 0 (0.0%) |
| Personal Care & Service | 14 (100.0%) | 0 (0.0%) |
| Total (Category) | 317 (89.5%) | 37 (10.4%) |
| Total (Overall) | 1,233 (53.4%) | 1,076 (46.6%) |
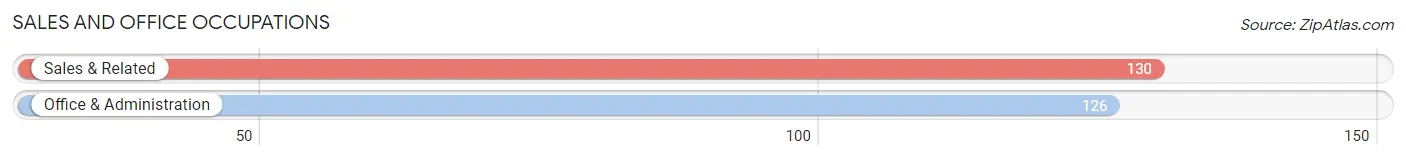
Sales and Office Occupations
The most common Sales and Office occupations in Lansing are Sales & Related (130 | 5.6%), and Office & Administration (126 | 5.5%).
Sales and Office Occupations by Sex
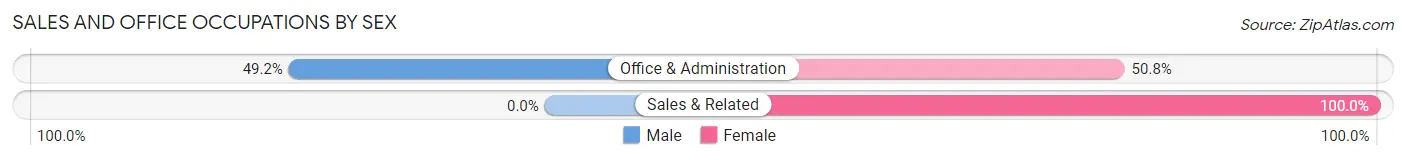
| Occupation | Male | Female |
| Sales & Related | 0 (0.0%) | 130 (100.0%) |
| Office & Administration | 62 (49.2%) | 64 (50.8%) |
| Total (Category) | 62 (24.2%) | 194 (75.8%) |
| Total (Overall) | 1,233 (53.4%) | 1,076 (46.6%) |
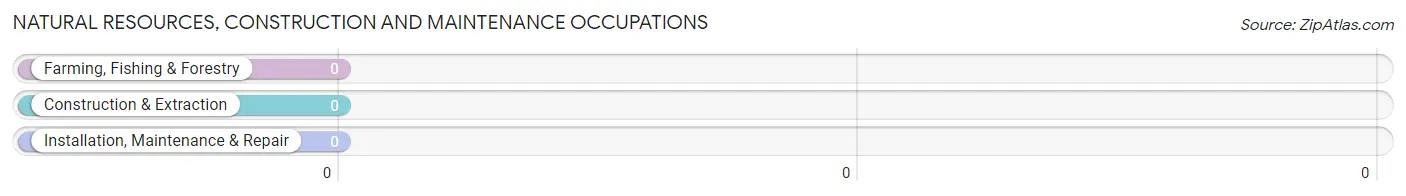
Natural Resources, Construction and Maintenance Occupations
Natural Resources, Construction and Maintenance Occupations by Sex
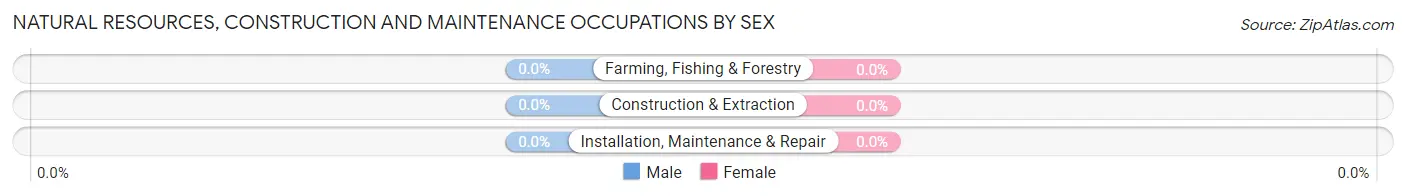
| Occupation | Male | Female |
| Farming, Fishing & Forestry | 0 (0.0%) | 0 (0.0%) |
| Construction & Extraction | 0 (0.0%) | 0 (0.0%) |
| Installation, Maintenance & Repair | 0 (0.0%) | 0 (0.0%) |
| Total (Category) | 0 (0.0%) | 0 (0.0%) |
| Total (Overall) | 1,233 (53.4%) | 1,076 (46.6%) |
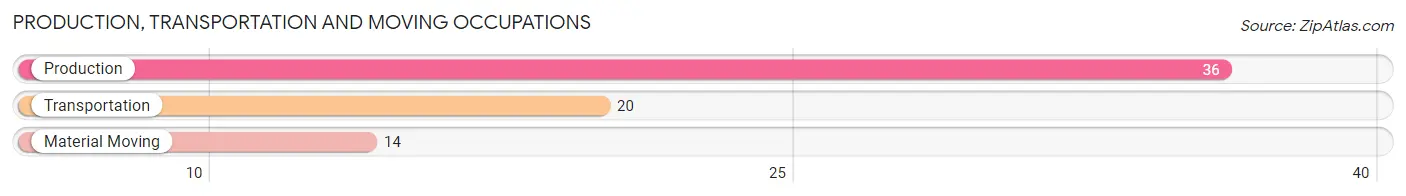
Production, Transportation and Moving Occupations
The most common Production, Transportation and Moving occupations in Lansing are Production (36 | 1.6%), Transportation (20 | 0.9%), and Material Moving (14 | 0.6%).
Production, Transportation and Moving Occupations by Sex
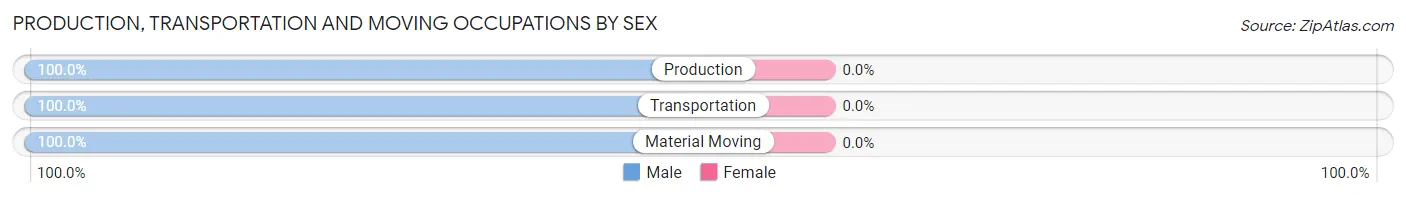
| Occupation | Male | Female |
| Production | 36 (100.0%) | 0 (0.0%) |
| Transportation | 20 (100.0%) | 0 (0.0%) |
| Material Moving | 14 (100.0%) | 0 (0.0%) |
| Total (Category) | 70 (100.0%) | 0 (0.0%) |
| Total (Overall) | 1,233 (53.4%) | 1,076 (46.6%) |
Employment Industries by Sex in Lansing
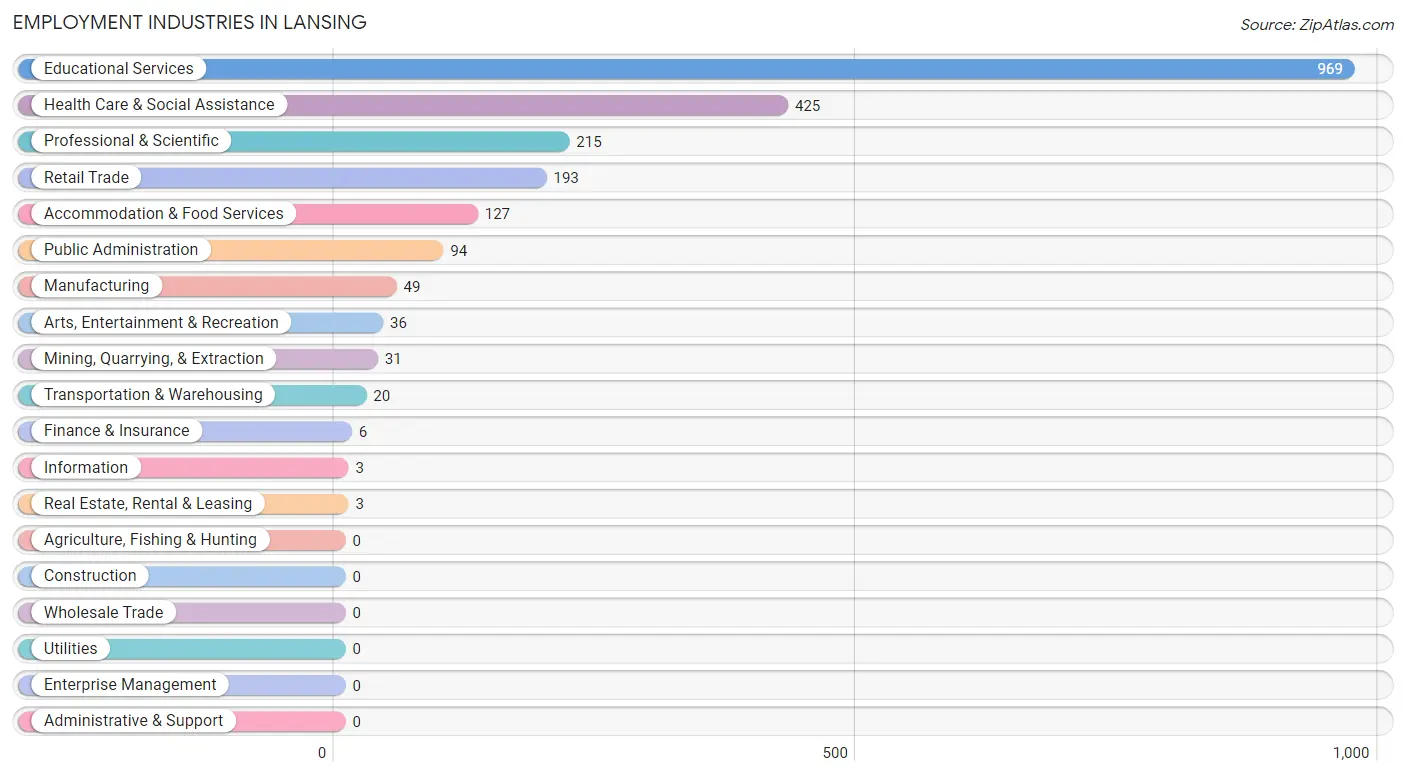
Employment Industries in Lansing
The major employment industries in Lansing include Educational Services (969 | 42.0%), Health Care & Social Assistance (425 | 18.4%), Professional & Scientific (215 | 9.3%), Retail Trade (193 | 8.4%), and Accommodation & Food Services (127 | 5.5%).
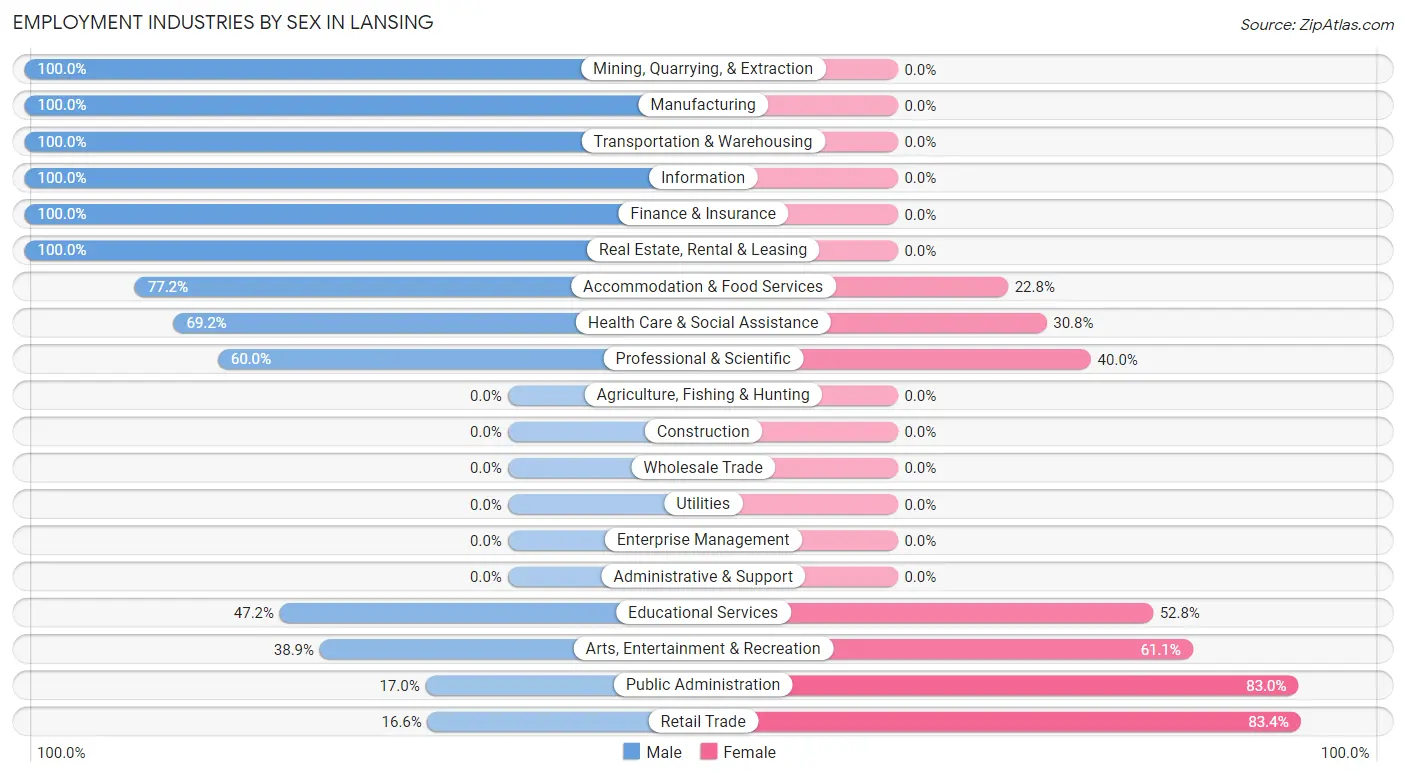
Employment Industries by Sex in Lansing
The Lansing industries that see more men than women are Mining, Quarrying, & Extraction (100.0%), Manufacturing (100.0%), and Transportation & Warehousing (100.0%), whereas the industries that tend to have a higher number of women are Retail Trade (83.4%), Public Administration (83.0%), and Arts, Entertainment & Recreation (61.1%).
| Industry | Male | Female |
| Agriculture, Fishing & Hunting | 0 (0.0%) | 0 (0.0%) |
| Mining, Quarrying, & Extraction | 31 (100.0%) | 0 (0.0%) |
| Construction | 0 (0.0%) | 0 (0.0%) |
| Manufacturing | 49 (100.0%) | 0 (0.0%) |
| Wholesale Trade | 0 (0.0%) | 0 (0.0%) |
| Retail Trade | 32 (16.6%) | 161 (83.4%) |
| Transportation & Warehousing | 20 (100.0%) | 0 (0.0%) |
| Utilities | 0 (0.0%) | 0 (0.0%) |
| Information | 3 (100.0%) | 0 (0.0%) |
| Finance & Insurance | 6 (100.0%) | 0 (0.0%) |
| Real Estate, Rental & Leasing | 3 (100.0%) | 0 (0.0%) |
| Professional & Scientific | 129 (60.0%) | 86 (40.0%) |
| Enterprise Management | 0 (0.0%) | 0 (0.0%) |
| Administrative & Support | 0 (0.0%) | 0 (0.0%) |
| Educational Services | 457 (47.2%) | 512 (52.8%) |
| Health Care & Social Assistance | 294 (69.2%) | 131 (30.8%) |
| Arts, Entertainment & Recreation | 14 (38.9%) | 22 (61.1%) |
| Accommodation & Food Services | 98 (77.2%) | 29 (22.8%) |
| Public Administration | 16 (17.0%) | 78 (83.0%) |
| Total | 1,233 (53.4%) | 1,076 (46.6%) |
Education in Lansing
School Enrollment in Lansing
The most common levels of schooling among the 851 students in Lansing are graduate / professional (313 | 36.8%), college / undergraduate (174 | 20.4%), and high school (127 | 14.9%).
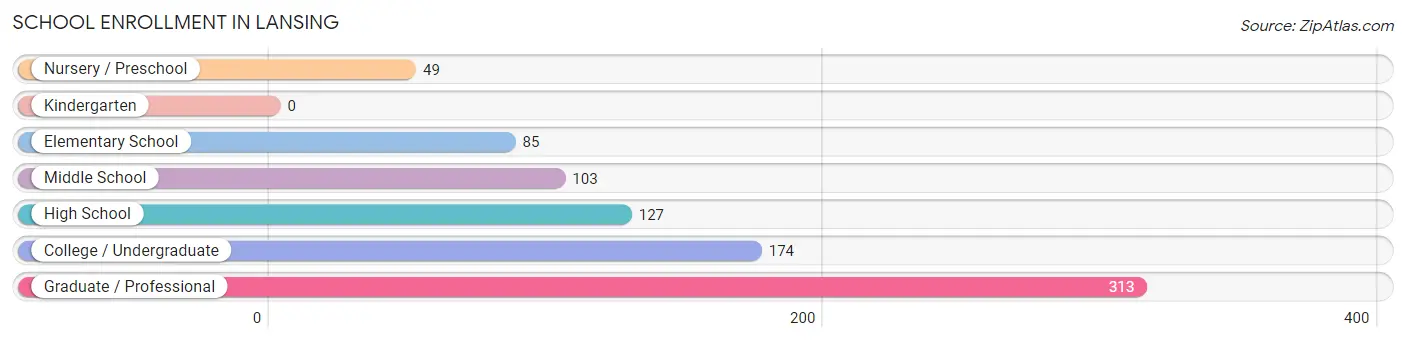
| School Level | # Students | % Students |
| Nursery / Preschool | 49 | 5.8% |
| Kindergarten | 0 | 0.0% |
| Elementary School | 85 | 10.0% |
| Middle School | 103 | 12.1% |
| High School | 127 | 14.9% |
| College / Undergraduate | 174 | 20.4% |
| Graduate / Professional | 313 | 36.8% |
| Total | 851 | 100.0% |
School Enrollment by Age by Funding Source in Lansing
Out of a total of 851 students who are enrolled in schools in Lansing, 292 (34.3%) attend a private institution, while the remaining 559 (65.7%) are enrolled in public schools. The age group of 3 to 4 year olds has the highest likelihood of being enrolled in private schools, with 16 (100.0% in the age bracket) enrolled. Conversely, the age group of 10 to 14 year olds has the lowest likelihood of being enrolled in a private school, with 138 (100.0% in the age bracket) attending a public institution.
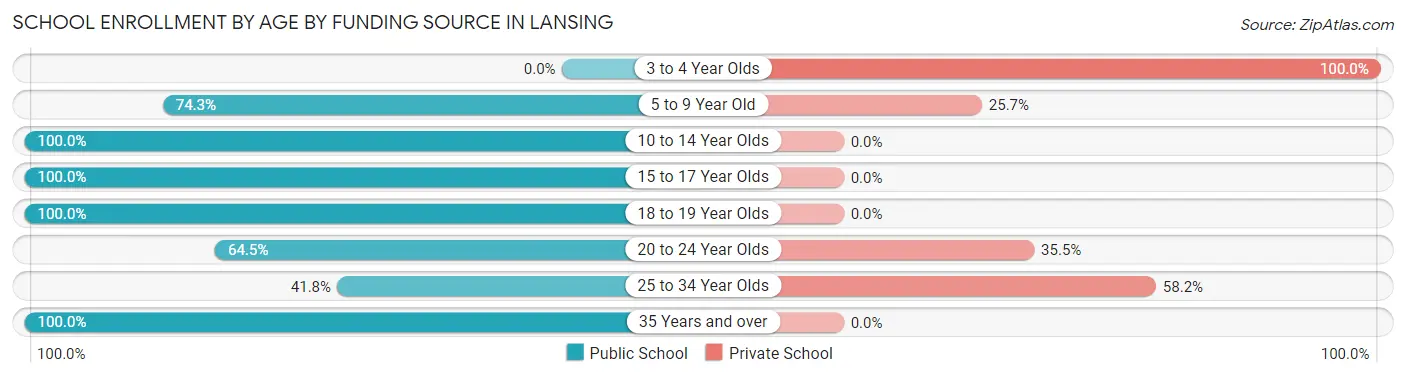
| Age Bracket | Public School | Private School |
| 3 to 4 Year Olds | 0 (0.0%) | 16 (100.0%) |
| 5 to 9 Year Old | 75 (74.3%) | 26 (25.7%) |
| 10 to 14 Year Olds | 138 (100.0%) | 0 (0.0%) |
| 15 to 17 Year Olds | 93 (100.0%) | 0 (0.0%) |
| 18 to 19 Year Olds | 32 (100.0%) | 0 (0.0%) |
| 20 to 24 Year Olds | 40 (64.5%) | 22 (35.5%) |
| 25 to 34 Year Olds | 164 (41.8%) | 228 (58.2%) |
| 35 Years and over | 17 (100.0%) | 0 (0.0%) |
| Total | 559 (65.7%) | 292 (34.3%) |
Educational Attainment by Field of Study in Lansing
Bio, nature & agricultural (442 | 18.9%), physical & health sciences (317 | 13.6%), social sciences (218 | 9.3%), engineering (189 | 8.1%), and psychology (187 | 8.0%) are the most common fields of study among 2,337 individuals in Lansing who have obtained a bachelor's degree or higher.
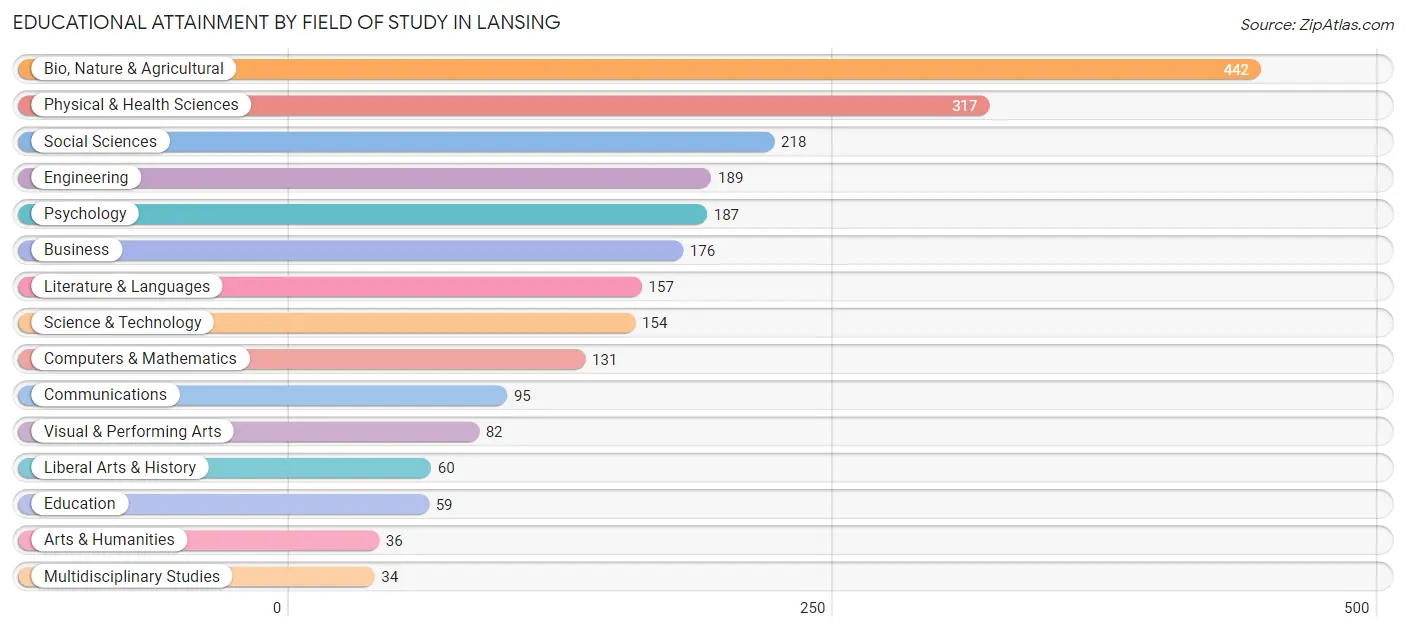
| Field of Study | # Graduates | % Graduates |
| Computers & Mathematics | 131 | 5.6% |
| Bio, Nature & Agricultural | 442 | 18.9% |
| Physical & Health Sciences | 317 | 13.6% |
| Psychology | 187 | 8.0% |
| Social Sciences | 218 | 9.3% |
| Engineering | 189 | 8.1% |
| Multidisciplinary Studies | 34 | 1.5% |
| Science & Technology | 154 | 6.6% |
| Business | 176 | 7.5% |
| Education | 59 | 2.5% |
| Literature & Languages | 157 | 6.7% |
| Liberal Arts & History | 60 | 2.6% |
| Visual & Performing Arts | 82 | 3.5% |
| Communications | 95 | 4.1% |
| Arts & Humanities | 36 | 1.5% |
| Total | 2,337 | 100.0% |
Transportation & Commute in Lansing
Vehicle Availability by Sex in Lansing
The most prevalent vehicle ownership categories in Lansing are males with 1 vehicle (577, accounting for 47.6%) and females with 1 vehicle (439, making up 53.6%).
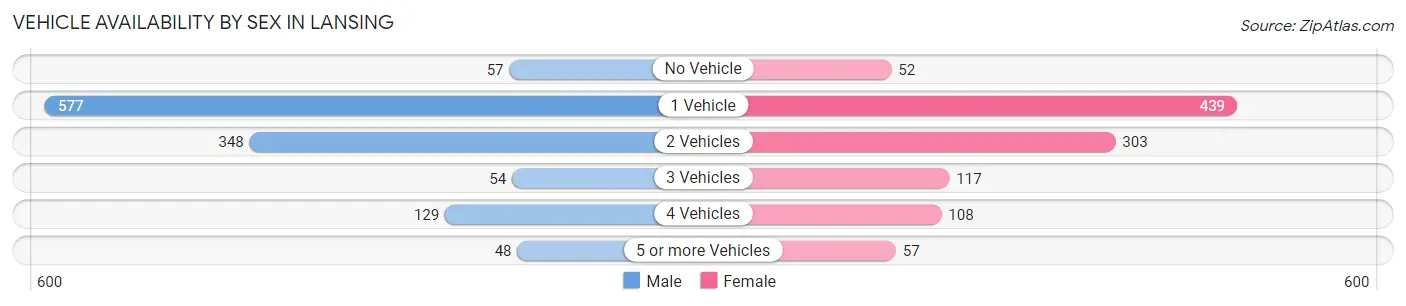
| Vehicles Available | Male | Female |
| No Vehicle | 57 (4.7%) | 52 (4.8%) |
| 1 Vehicle | 577 (47.6%) | 439 (40.8%) |
| 2 Vehicles | 348 (28.7%) | 303 (28.2%) |
| 3 Vehicles | 54 (4.4%) | 117 (10.9%) |
| 4 Vehicles | 129 (10.6%) | 108 (10.0%) |
| 5 or more Vehicles | 48 (4.0%) | 57 (5.3%) |
| Total | 1,213 (100.0%) | 1,076 (100.0%) |
Commute Time in Lansing
The most frequently occuring commute durations in Lansing are 10 to 14 minutes (699 commuters, 34.3%), 15 to 19 minutes (612 commuters, 30.1%), and 20 to 24 minutes (205 commuters, 10.1%).
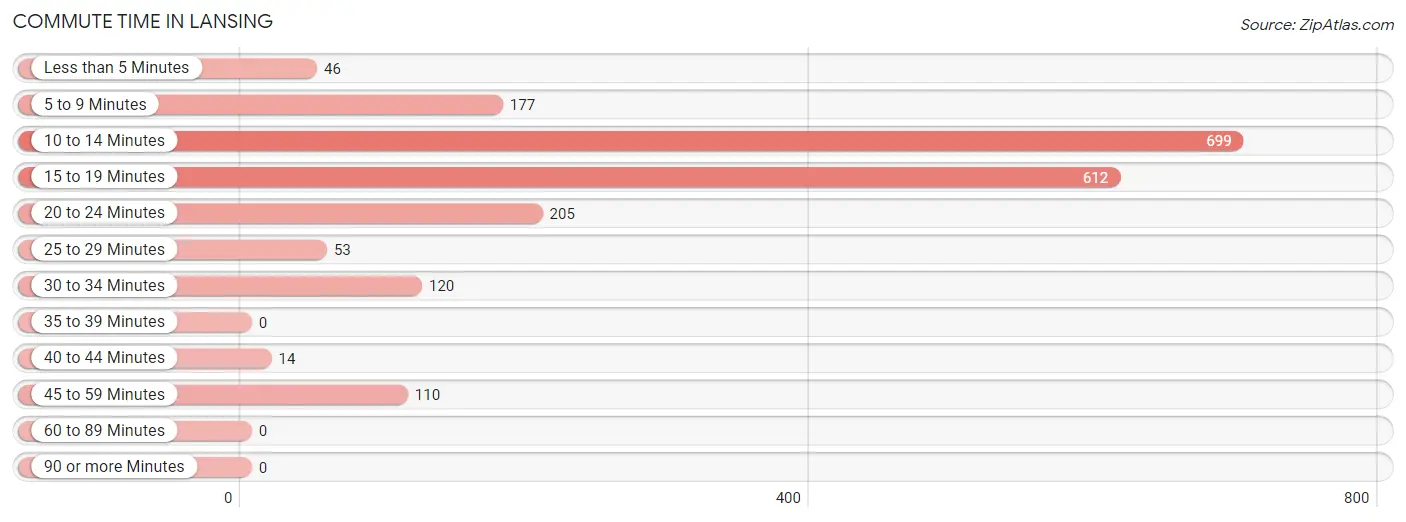
| Commute Time | # Commuters | % Commuters |
| Less than 5 Minutes | 46 | 2.3% |
| 5 to 9 Minutes | 177 | 8.7% |
| 10 to 14 Minutes | 699 | 34.3% |
| 15 to 19 Minutes | 612 | 30.1% |
| 20 to 24 Minutes | 205 | 10.1% |
| 25 to 29 Minutes | 53 | 2.6% |
| 30 to 34 Minutes | 120 | 5.9% |
| 35 to 39 Minutes | 0 | 0.0% |
| 40 to 44 Minutes | 14 | 0.7% |
| 45 to 59 Minutes | 110 | 5.4% |
| 60 to 89 Minutes | 0 | 0.0% |
| 90 or more Minutes | 0 | 0.0% |
Commute Time by Sex in Lansing
The most common commute times in Lansing are 15 to 19 minutes (442 commuters, 38.9%) for males and 10 to 14 minutes (282 commuters, 31.3%) for females.
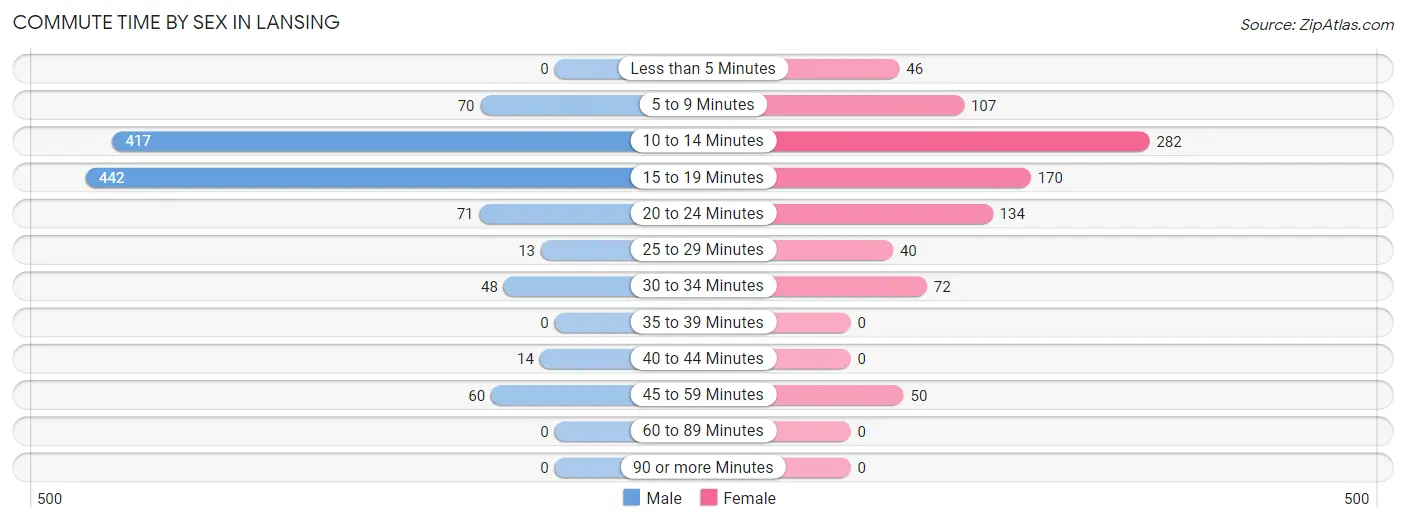
| Commute Time | Male | Female |
| Less than 5 Minutes | 0 (0.0%) | 46 (5.1%) |
| 5 to 9 Minutes | 70 (6.2%) | 107 (11.9%) |
| 10 to 14 Minutes | 417 (36.7%) | 282 (31.3%) |
| 15 to 19 Minutes | 442 (38.9%) | 170 (18.9%) |
| 20 to 24 Minutes | 71 (6.3%) | 134 (14.9%) |
| 25 to 29 Minutes | 13 (1.1%) | 40 (4.4%) |
| 30 to 34 Minutes | 48 (4.2%) | 72 (8.0%) |
| 35 to 39 Minutes | 0 (0.0%) | 0 (0.0%) |
| 40 to 44 Minutes | 14 (1.2%) | 0 (0.0%) |
| 45 to 59 Minutes | 60 (5.3%) | 50 (5.6%) |
| 60 to 89 Minutes | 0 (0.0%) | 0 (0.0%) |
| 90 or more Minutes | 0 (0.0%) | 0 (0.0%) |
Time of Departure to Work by Sex in Lansing
The most frequent times of departure to work in Lansing are 9:00 AM to 9:59 AM (204, 18.0%) for males and 9:00 AM to 9:59 AM (247, 27.4%) for females.
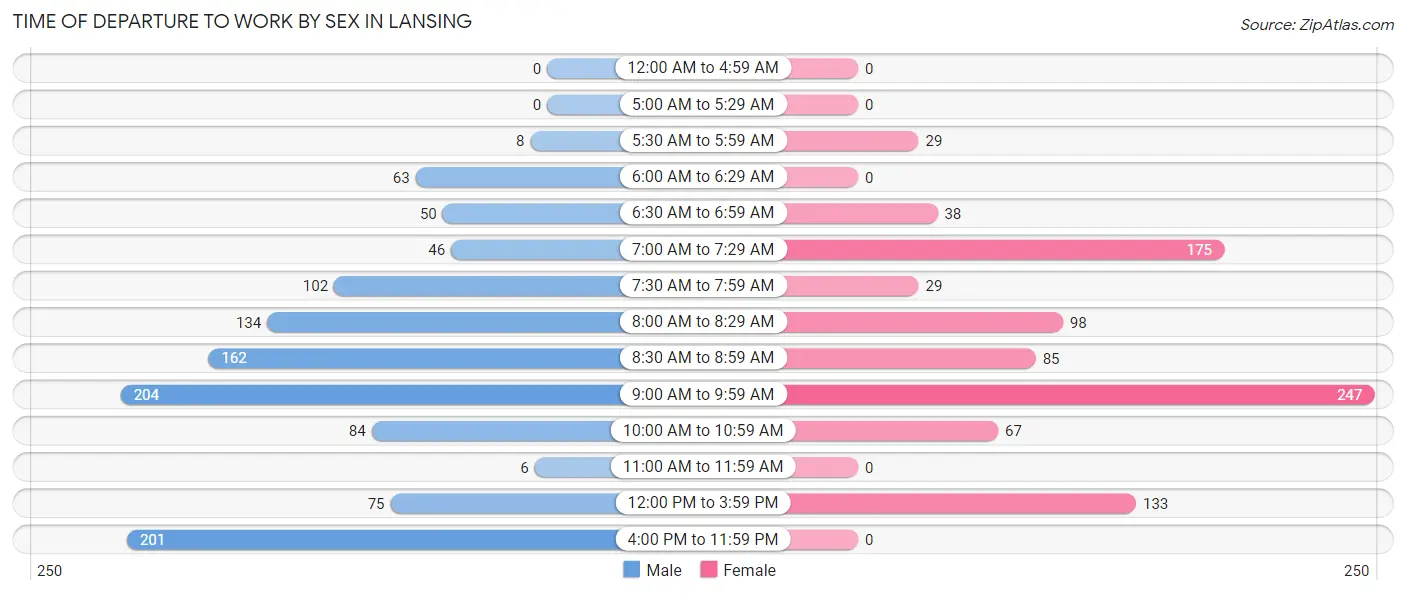
| Time of Departure | Male | Female |
| 12:00 AM to 4:59 AM | 0 (0.0%) | 0 (0.0%) |
| 5:00 AM to 5:29 AM | 0 (0.0%) | 0 (0.0%) |
| 5:30 AM to 5:59 AM | 8 (0.7%) | 29 (3.2%) |
| 6:00 AM to 6:29 AM | 63 (5.6%) | 0 (0.0%) |
| 6:30 AM to 6:59 AM | 50 (4.4%) | 38 (4.2%) |
| 7:00 AM to 7:29 AM | 46 (4.1%) | 175 (19.4%) |
| 7:30 AM to 7:59 AM | 102 (9.0%) | 29 (3.2%) |
| 8:00 AM to 8:29 AM | 134 (11.8%) | 98 (10.9%) |
| 8:30 AM to 8:59 AM | 162 (14.3%) | 85 (9.4%) |
| 9:00 AM to 9:59 AM | 204 (18.0%) | 247 (27.4%) |
| 10:00 AM to 10:59 AM | 84 (7.4%) | 67 (7.4%) |
| 11:00 AM to 11:59 AM | 6 (0.5%) | 0 (0.0%) |
| 12:00 PM to 3:59 PM | 75 (6.6%) | 133 (14.8%) |
| 4:00 PM to 11:59 PM | 201 (17.7%) | 0 (0.0%) |
| Total | 1,135 (100.0%) | 901 (100.0%) |
Housing Occupancy in Lansing
Occupancy by Ownership in Lansing
Of the total 1,705 dwellings in Lansing, owner-occupied units account for 557 (32.7%), while renter-occupied units make up 1,148 (67.3%).
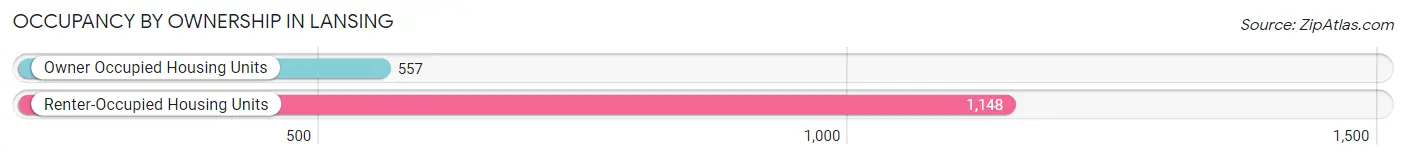
| Occupancy | # Housing Units | % Housing Units |
| Owner Occupied Housing Units | 557 | 32.7% |
| Renter-Occupied Housing Units | 1,148 | 67.3% |
| Total Occupied Housing Units | 1,705 | 100.0% |
Occupancy by Household Size in Lansing
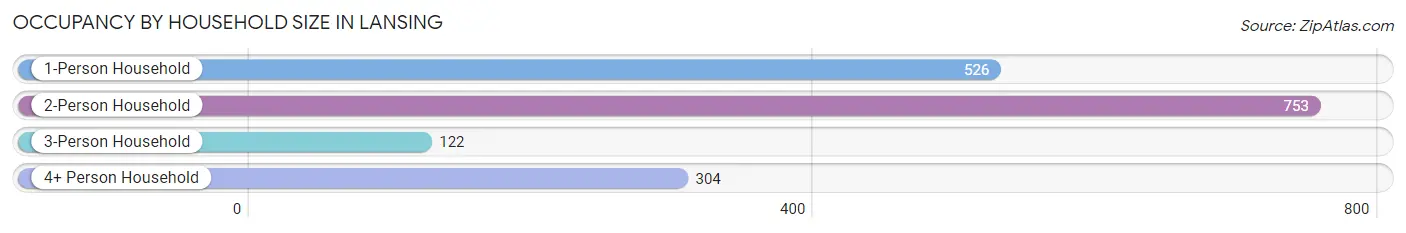
| Household Size | # Housing Units | % Housing Units |
| 1-Person Household | 526 | 30.8% |
| 2-Person Household | 753 | 44.2% |
| 3-Person Household | 122 | 7.2% |
| 4+ Person Household | 304 | 17.8% |
| Total Housing Units | 1,705 | 100.0% |
Occupancy by Ownership by Household Size in Lansing
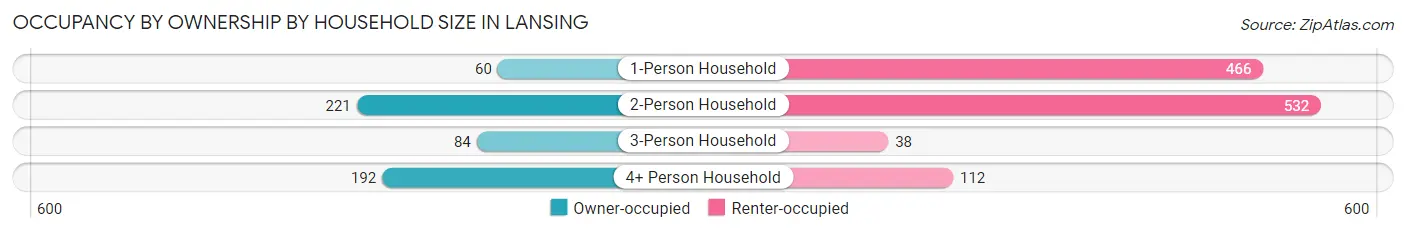
| Household Size | Owner-occupied | Renter-occupied |
| 1-Person Household | 60 (11.4%) | 466 (88.6%) |
| 2-Person Household | 221 (29.3%) | 532 (70.7%) |
| 3-Person Household | 84 (68.9%) | 38 (31.1%) |
| 4+ Person Household | 192 (63.2%) | 112 (36.8%) |
| Total Housing Units | 557 (32.7%) | 1,148 (67.3%) |
Occupancy by Educational Attainment in Lansing
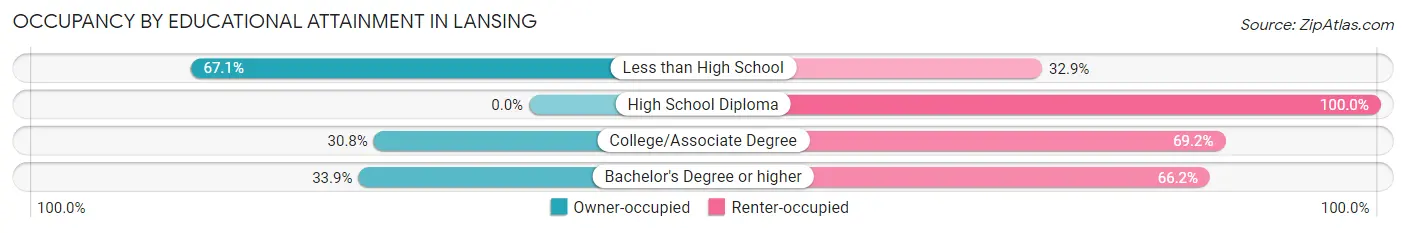
| Household Size | Owner-occupied | Renter-occupied |
| Less than High School | 53 (67.1%) | 26 (32.9%) |
| High School Diploma | 0 (0.0%) | 111 (100.0%) |
| College/Associate Degree | 89 (30.8%) | 200 (69.2%) |
| Bachelor's Degree or higher | 415 (33.9%) | 811 (66.1%) |
Occupancy by Age of Householder in Lansing
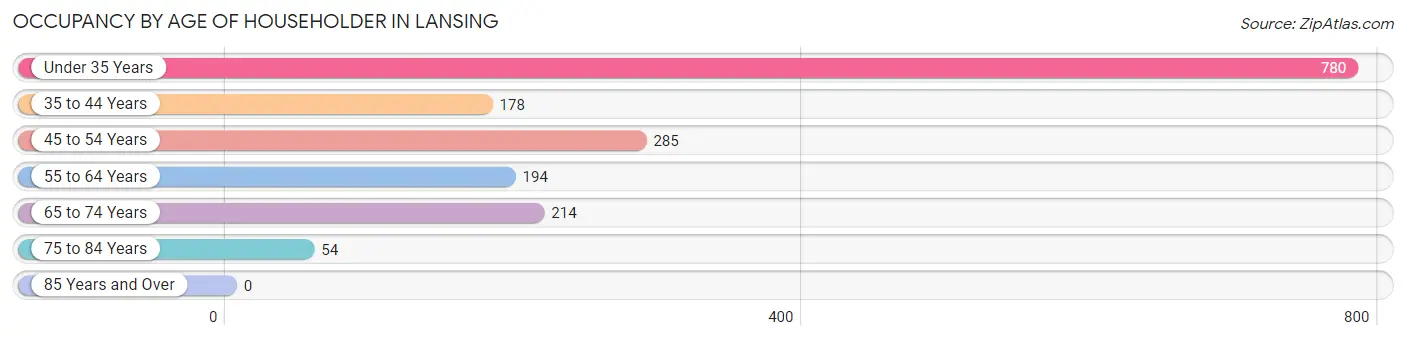
| Age Bracket | # Households | % Households |
| Under 35 Years | 780 | 45.8% |
| 35 to 44 Years | 178 | 10.4% |
| 45 to 54 Years | 285 | 16.7% |
| 55 to 64 Years | 194 | 11.4% |
| 65 to 74 Years | 214 | 12.6% |
| 75 to 84 Years | 54 | 3.2% |
| 85 Years and Over | 0 | 0.0% |
| Total | 1,705 | 100.0% |
Housing Finances in Lansing
Median Income by Occupancy in Lansing
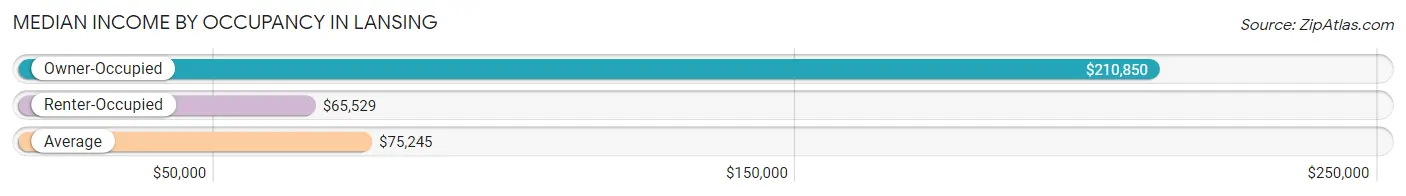
| Occupancy Type | # Households | Median Income |
| Owner-Occupied | 557 (32.7%) | $210,850 |
| Renter-Occupied | 1,148 (67.3%) | $65,529 |
| Average | 1,705 (100.0%) | $75,245 |
Occupancy by Householder Income Bracket in Lansing
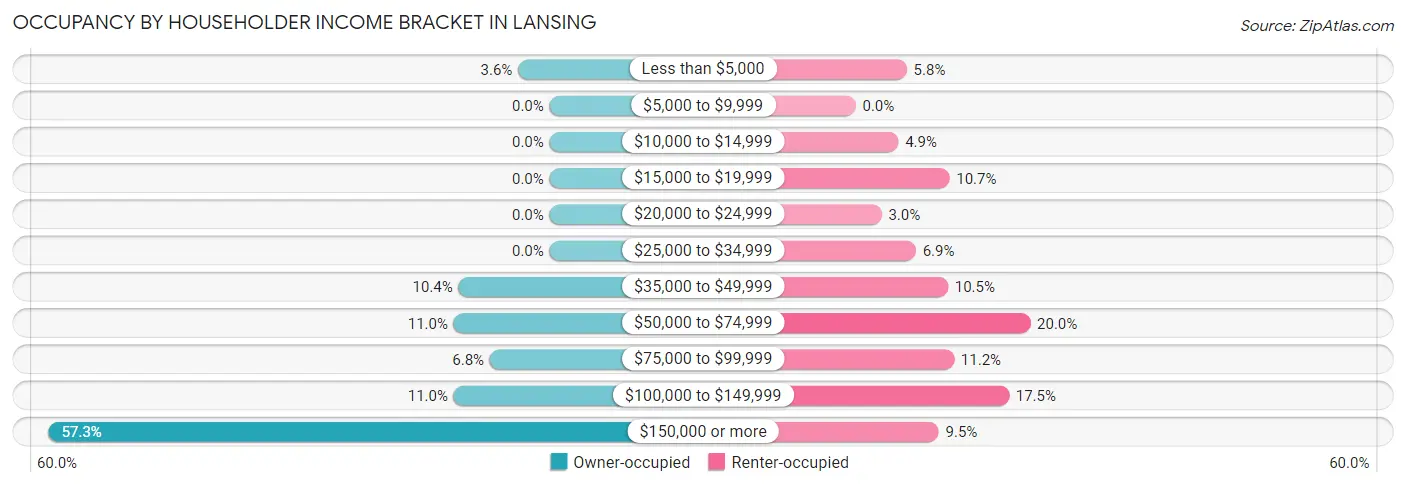
| Income Bracket | Owner-occupied | Renter-occupied |
| Less than $5,000 | 20 (3.6%) | 67 (5.8%) |
| $5,000 to $9,999 | 0 (0.0%) | 0 (0.0%) |
| $10,000 to $14,999 | 0 (0.0%) | 56 (4.9%) |
| $15,000 to $19,999 | 0 (0.0%) | 123 (10.7%) |
| $20,000 to $24,999 | 0 (0.0%) | 34 (3.0%) |
| $25,000 to $34,999 | 0 (0.0%) | 79 (6.9%) |
| $35,000 to $49,999 | 58 (10.4%) | 121 (10.5%) |
| $50,000 to $74,999 | 61 (11.0%) | 229 (20.0%) |
| $75,000 to $99,999 | 38 (6.8%) | 129 (11.2%) |
| $100,000 to $149,999 | 61 (11.0%) | 201 (17.5%) |
| $150,000 or more | 319 (57.3%) | 109 (9.5%) |
| Total | 557 (100.0%) | 1,148 (100.0%) |
Monthly Housing Cost Tiers in Lansing
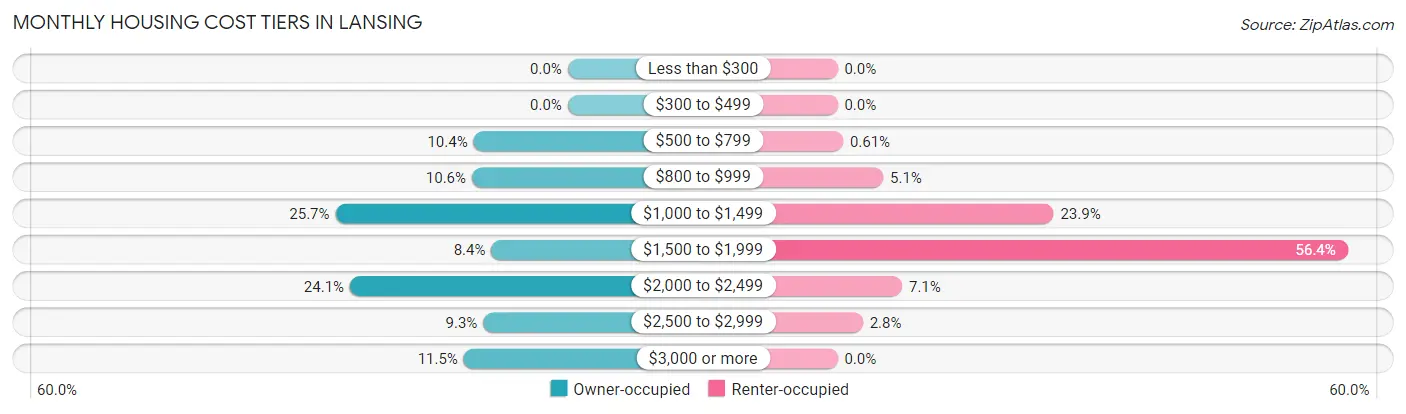
| Monthly Cost | Owner-occupied | Renter-occupied |
| Less than $300 | 0 (0.0%) | 0 (0.0%) |
| $300 to $499 | 0 (0.0%) | 0 (0.0%) |
| $500 to $799 | 58 (10.4%) | 7 (0.6%) |
| $800 to $999 | 59 (10.6%) | 58 (5.1%) |
| $1,000 to $1,499 | 143 (25.7%) | 274 (23.9%) |
| $1,500 to $1,999 | 47 (8.4%) | 647 (56.4%) |
| $2,000 to $2,499 | 134 (24.1%) | 82 (7.1%) |
| $2,500 to $2,999 | 52 (9.3%) | 32 (2.8%) |
| $3,000 or more | 64 (11.5%) | 0 (0.0%) |
| Total | 557 (100.0%) | 1,148 (100.0%) |
Physical Housing Characteristics in Lansing
Housing Structures in Lansing
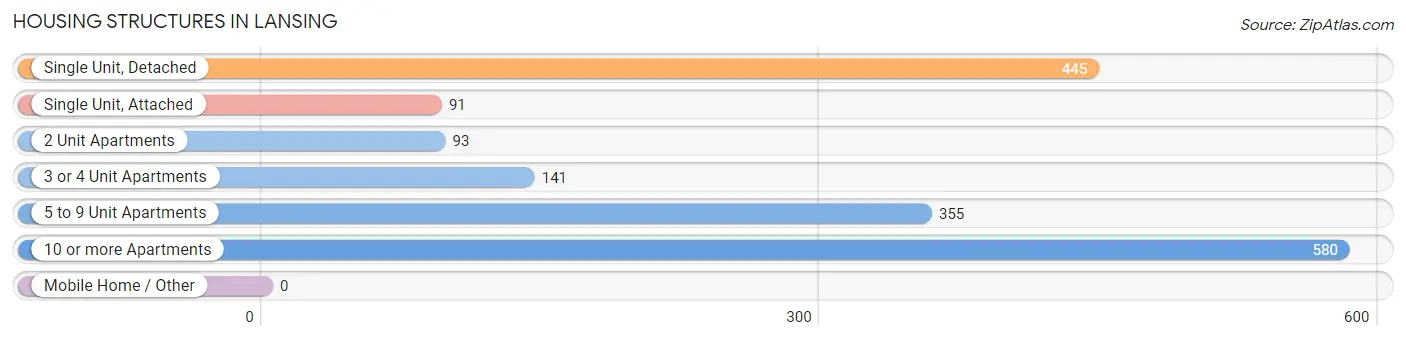
| Structure Type | # Housing Units | % Housing Units |
| Single Unit, Detached | 445 | 26.1% |
| Single Unit, Attached | 91 | 5.3% |
| 2 Unit Apartments | 93 | 5.4% |
| 3 or 4 Unit Apartments | 141 | 8.3% |
| 5 to 9 Unit Apartments | 355 | 20.8% |
| 10 or more Apartments | 580 | 34.0% |
| Mobile Home / Other | 0 | 0.0% |
| Total | 1,705 | 100.0% |
Housing Structures by Occupancy in Lansing
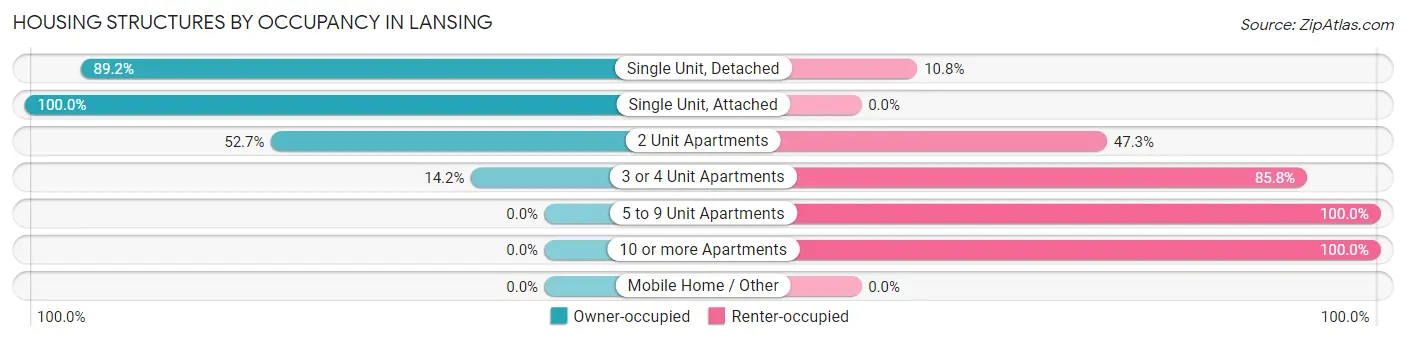
| Structure Type | Owner-occupied | Renter-occupied |
| Single Unit, Detached | 397 (89.2%) | 48 (10.8%) |
| Single Unit, Attached | 91 (100.0%) | 0 (0.0%) |
| 2 Unit Apartments | 49 (52.7%) | 44 (47.3%) |
| 3 or 4 Unit Apartments | 20 (14.2%) | 121 (85.8%) |
| 5 to 9 Unit Apartments | 0 (0.0%) | 355 (100.0%) |
| 10 or more Apartments | 0 (0.0%) | 580 (100.0%) |
| Mobile Home / Other | 0 (0.0%) | 0 (0.0%) |
| Total | 557 (32.7%) | 1,148 (67.3%) |
Housing Structures by Number of Rooms in Lansing
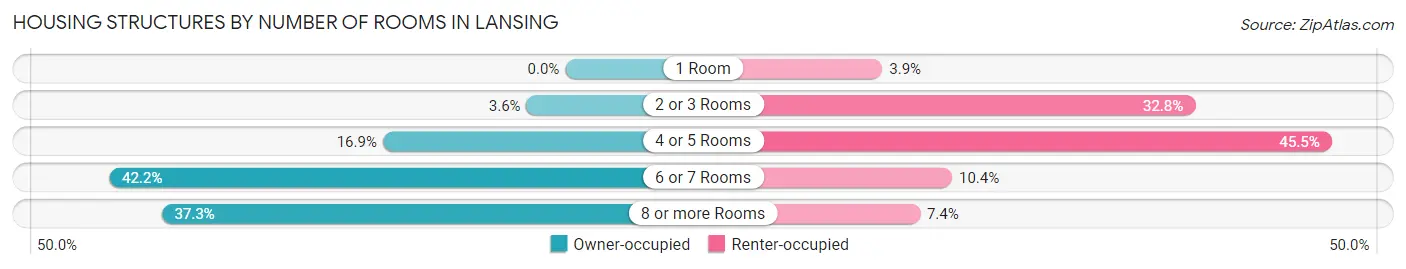
| Number of Rooms | Owner-occupied | Renter-occupied |
| 1 Room | 0 (0.0%) | 45 (3.9%) |
| 2 or 3 Rooms | 20 (3.6%) | 377 (32.8%) |
| 4 or 5 Rooms | 94 (16.9%) | 522 (45.5%) |
| 6 or 7 Rooms | 235 (42.2%) | 119 (10.4%) |
| 8 or more Rooms | 208 (37.3%) | 85 (7.4%) |
| Total | 557 (100.0%) | 1,148 (100.0%) |
Housing Structure by Heating Type in Lansing
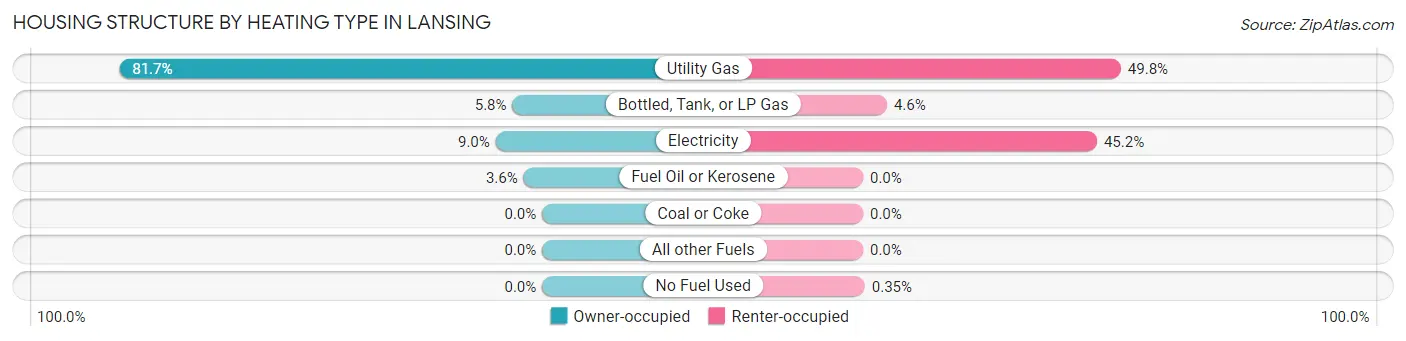
| Heating Type | Owner-occupied | Renter-occupied |
| Utility Gas | 455 (81.7%) | 572 (49.8%) |
| Bottled, Tank, or LP Gas | 32 (5.8%) | 53 (4.6%) |
| Electricity | 50 (9.0%) | 519 (45.2%) |
| Fuel Oil or Kerosene | 20 (3.6%) | 0 (0.0%) |
| Coal or Coke | 0 (0.0%) | 0 (0.0%) |
| All other Fuels | 0 (0.0%) | 0 (0.0%) |
| No Fuel Used | 0 (0.0%) | 4 (0.4%) |
| Total | 557 (100.0%) | 1,148 (100.0%) |
Household Vehicle Usage in Lansing
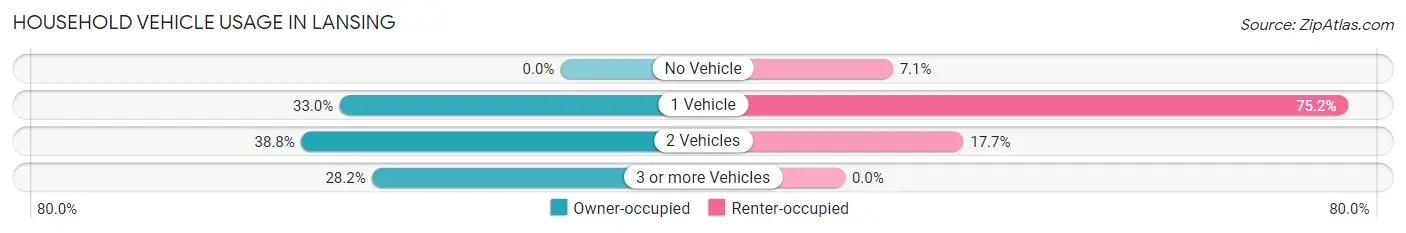
| Vehicles per Household | Owner-occupied | Renter-occupied |
| No Vehicle | 0 (0.0%) | 82 (7.1%) |
| 1 Vehicle | 184 (33.0%) | 863 (75.2%) |
| 2 Vehicles | 216 (38.8%) | 203 (17.7%) |
| 3 or more Vehicles | 157 (28.2%) | 0 (0.0%) |
| Total | 557 (100.0%) | 1,148 (100.0%) |
Real Estate & Mortgages in Lansing
Real Estate and Mortgage Overview in Lansing
| Characteristic | Without Mortgage | With Mortgage |
| Housing Units | 320 | 237 |
| Median Property Value | $408,100 | $347,100 |
| Median Household Income | $210,900 | $150 |
| Monthly Housing Costs | $1,083 | $64 |
| Real Estate Taxes | $9,600 | $0 |
Property Value by Mortgage Status in Lansing
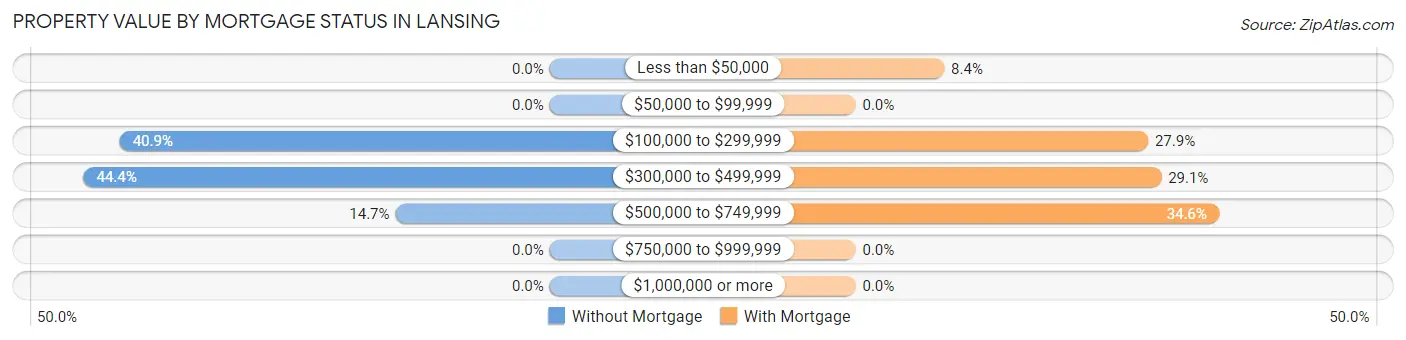
| Property Value | Without Mortgage | With Mortgage |
| Less than $50,000 | 0 (0.0%) | 20 (8.4%) |
| $50,000 to $99,999 | 0 (0.0%) | 0 (0.0%) |
| $100,000 to $299,999 | 131 (40.9%) | 66 (27.9%) |
| $300,000 to $499,999 | 142 (44.4%) | 69 (29.1%) |
| $500,000 to $749,999 | 47 (14.7%) | 82 (34.6%) |
| $750,000 to $999,999 | 0 (0.0%) | 0 (0.0%) |
| $1,000,000 or more | 0 (0.0%) | 0 (0.0%) |
| Total | 320 (100.0%) | 237 (100.0%) |
Household Income by Mortgage Status in Lansing
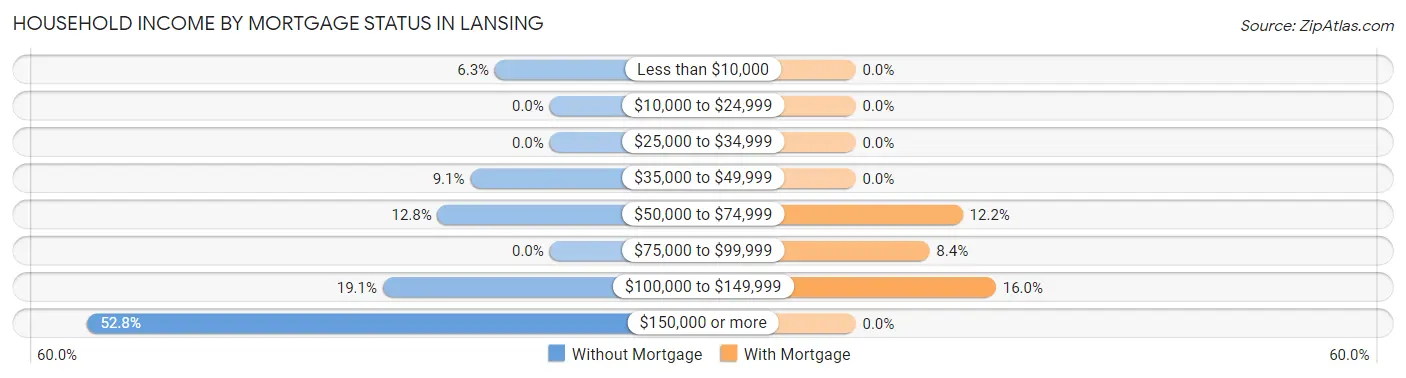
| Household Income | Without Mortgage | With Mortgage |
| Less than $10,000 | 20 (6.2%) | 0 (0.0%) |
| $10,000 to $24,999 | 0 (0.0%) | 0 (0.0%) |
| $25,000 to $34,999 | 0 (0.0%) | 0 (0.0%) |
| $35,000 to $49,999 | 29 (9.1%) | 0 (0.0%) |
| $50,000 to $74,999 | 41 (12.8%) | 29 (12.2%) |
| $75,000 to $99,999 | 0 (0.0%) | 20 (8.4%) |
| $100,000 to $149,999 | 61 (19.1%) | 38 (16.0%) |
| $150,000 or more | 169 (52.8%) | 0 (0.0%) |
| Total | 320 (100.0%) | 237 (100.0%) |
Property Value to Household Income Ratio in Lansing
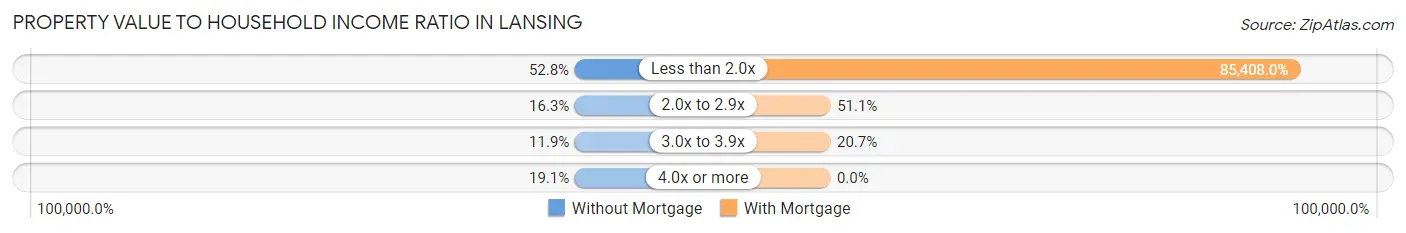
| Value-to-Income Ratio | Without Mortgage | With Mortgage |
| Less than 2.0x | 169 (52.8%) | 202,417 (85,408.0%) |
| 2.0x to 2.9x | 52 (16.3%) | 121 (51.0%) |
| 3.0x to 3.9x | 38 (11.9%) | 49 (20.7%) |
| 4.0x or more | 61 (19.1%) | 0 (0.0%) |
| Total | 320 (100.0%) | 237 (100.0%) |
Real Estate Taxes by Mortgage Status in Lansing
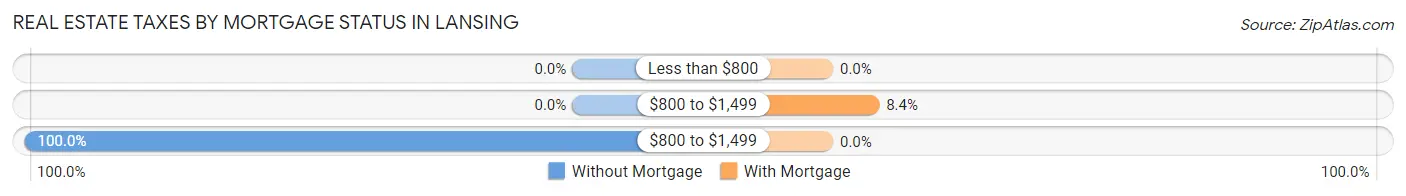
| Property Taxes | Without Mortgage | With Mortgage |
| Less than $800 | 0 (0.0%) | 0 (0.0%) |
| $800 to $1,499 | 0 (0.0%) | 20 (8.4%) |
| $800 to $1,499 | 320 (100.0%) | 0 (0.0%) |
| Total | 320 (100.0%) | 237 (100.0%) |
Health & Disability in Lansing
Health Insurance Coverage by Age in Lansing
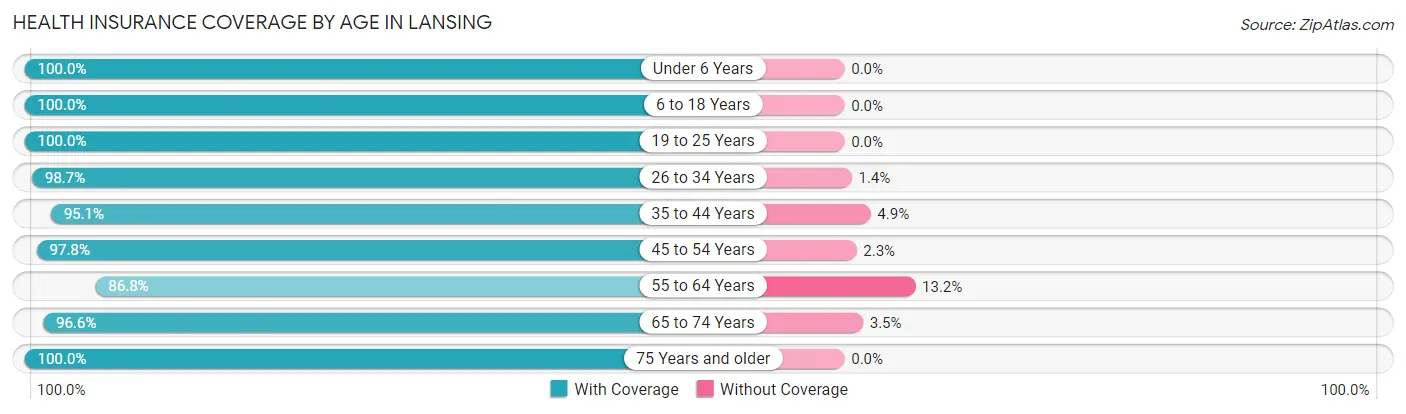
| Age Bracket | With Coverage | Without Coverage |
| Under 6 Years | 269 (100.0%) | 0 (0.0%) |
| 6 to 18 Years | 380 (100.0%) | 0 (0.0%) |
| 19 to 25 Years | 545 (100.0%) | 0 (0.0%) |
| 26 to 34 Years | 953 (98.7%) | 13 (1.3%) |
| 35 to 44 Years | 332 (95.1%) | 17 (4.9%) |
| 45 to 54 Years | 522 (97.8%) | 12 (2.2%) |
| 55 to 64 Years | 289 (86.8%) | 44 (13.2%) |
| 65 to 74 Years | 252 (96.6%) | 9 (3.5%) |
| 75 Years and older | 127 (100.0%) | 0 (0.0%) |
| Total | 3,669 (97.5%) | 95 (2.5%) |
Health Insurance Coverage by Citizenship Status in Lansing
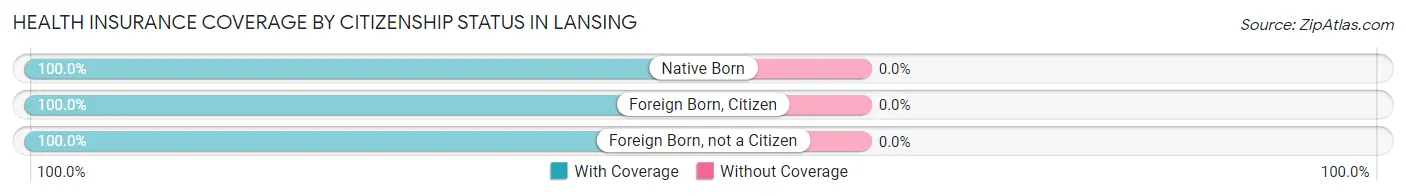
| Citizenship Status | With Coverage | Without Coverage |
| Native Born | 269 (100.0%) | 0 (0.0%) |
| Foreign Born, Citizen | 380 (100.0%) | 0 (0.0%) |
| Foreign Born, not a Citizen | 545 (100.0%) | 0 (0.0%) |
Health Insurance Coverage by Household Income in Lansing
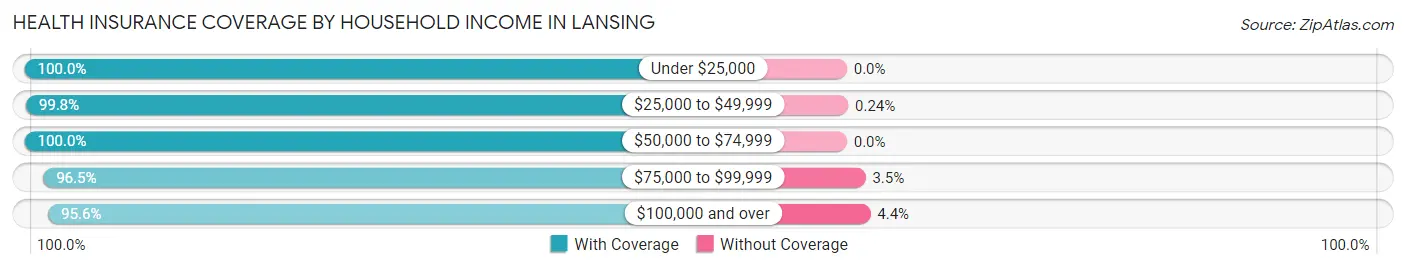
| Household Income | With Coverage | Without Coverage |
| Under $25,000 | 413 (100.0%) | 0 (0.0%) |
| $25,000 to $49,999 | 408 (99.8%) | 1 (0.2%) |
| $50,000 to $74,999 | 739 (100.0%) | 0 (0.0%) |
| $75,000 to $99,999 | 331 (96.5%) | 12 (3.5%) |
| $100,000 and over | 1,774 (95.6%) | 82 (4.4%) |
Public vs Private Health Insurance Coverage by Age in Lansing
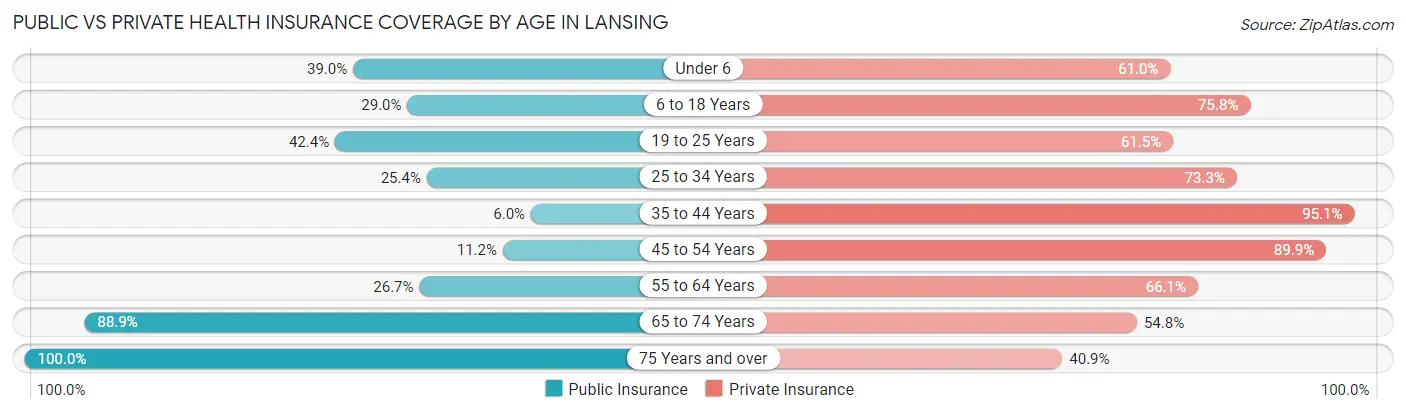
| Age Bracket | Public Insurance | Private Insurance |
| Under 6 | 105 (39.0%) | 164 (61.0%) |
| 6 to 18 Years | 110 (28.9%) | 288 (75.8%) |
| 19 to 25 Years | 231 (42.4%) | 335 (61.5%) |
| 25 to 34 Years | 245 (25.4%) | 708 (73.3%) |
| 35 to 44 Years | 21 (6.0%) | 332 (95.1%) |
| 45 to 54 Years | 60 (11.2%) | 480 (89.9%) |
| 55 to 64 Years | 89 (26.7%) | 220 (66.1%) |
| 65 to 74 Years | 232 (88.9%) | 143 (54.8%) |
| 75 Years and over | 127 (100.0%) | 52 (40.9%) |
| Total | 1,220 (32.4%) | 2,722 (72.3%) |
Disability Status by Sex by Age in Lansing
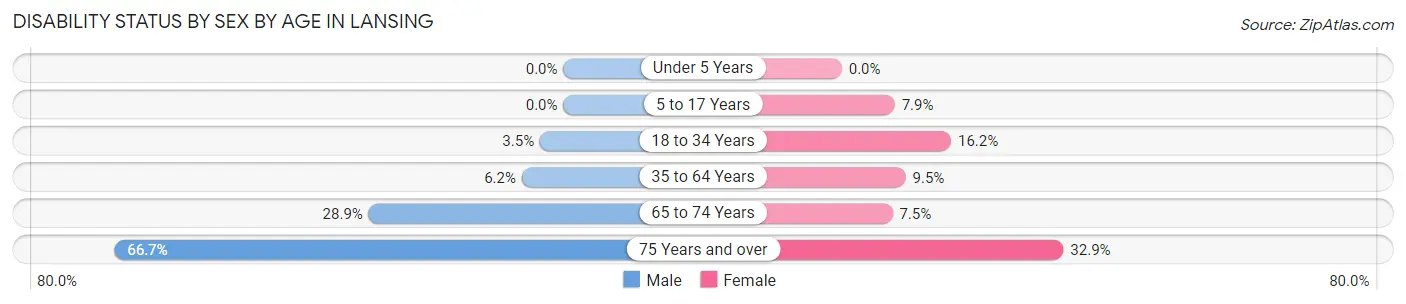
| Age Bracket | Male | Female |
| Under 5 Years | 0 (0.0%) | 0 (0.0%) |
| 5 to 17 Years | 0 (0.0%) | 18 (7.9%) |
| 18 to 34 Years | 33 (3.5%) | 104 (16.2%) |
| 35 to 64 Years | 34 (6.2%) | 63 (9.5%) |
| 65 to 74 Years | 37 (28.9%) | 10 (7.5%) |
| 75 Years and over | 32 (66.7%) | 26 (32.9%) |
Disability Class by Sex by Age in Lansing
Disability Class: Hearing Difficulty
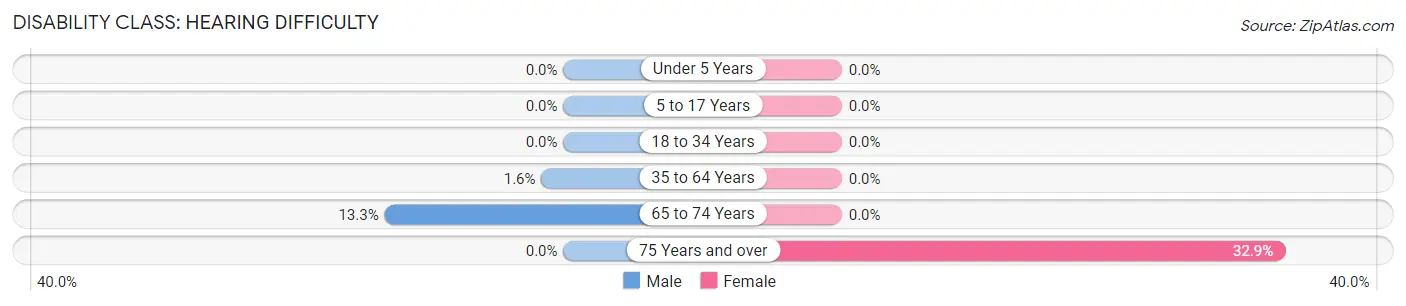
| Age Bracket | Male | Female |
| Under 5 Years | 0 (0.0%) | 0 (0.0%) |
| 5 to 17 Years | 0 (0.0%) | 0 (0.0%) |
| 18 to 34 Years | 0 (0.0%) | 0 (0.0%) |
| 35 to 64 Years | 9 (1.6%) | 0 (0.0%) |
| 65 to 74 Years | 17 (13.3%) | 0 (0.0%) |
| 75 Years and over | 0 (0.0%) | 26 (32.9%) |
Disability Class: Vision Difficulty
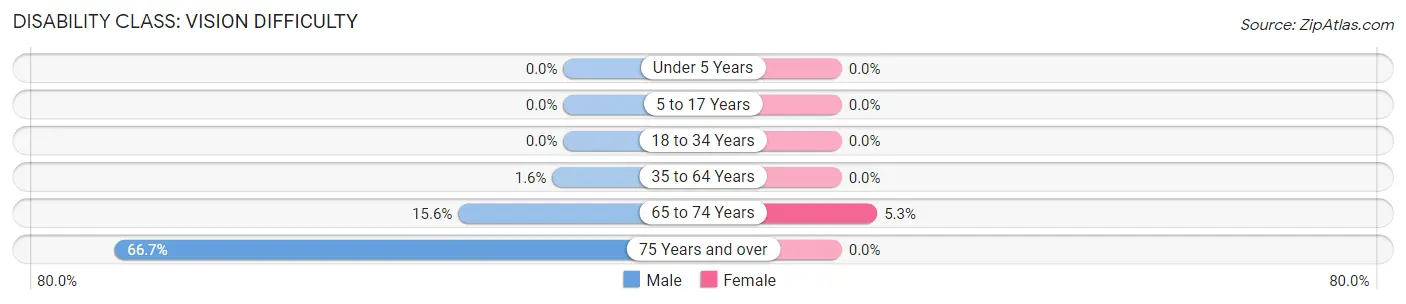
| Age Bracket | Male | Female |
| Under 5 Years | 0 (0.0%) | 0 (0.0%) |
| 5 to 17 Years | 0 (0.0%) | 0 (0.0%) |
| 18 to 34 Years | 0 (0.0%) | 0 (0.0%) |
| 35 to 64 Years | 9 (1.6%) | 0 (0.0%) |
| 65 to 74 Years | 20 (15.6%) | 7 (5.3%) |
| 75 Years and over | 32 (66.7%) | 0 (0.0%) |
Disability Class: Cognitive Difficulty
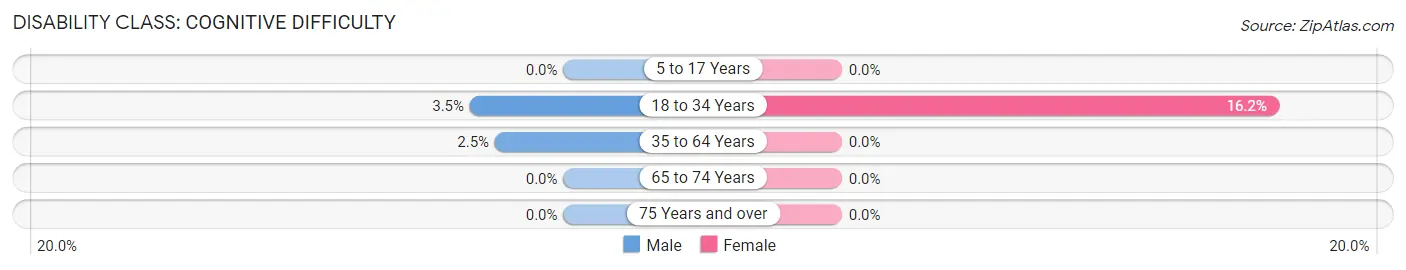
| Age Bracket | Male | Female |
| 5 to 17 Years | 0 (0.0%) | 0 (0.0%) |
| 18 to 34 Years | 33 (3.5%) | 104 (16.2%) |
| 35 to 64 Years | 14 (2.5%) | 0 (0.0%) |
| 65 to 74 Years | 0 (0.0%) | 0 (0.0%) |
| 75 Years and over | 0 (0.0%) | 0 (0.0%) |
Disability Class: Ambulatory Difficulty
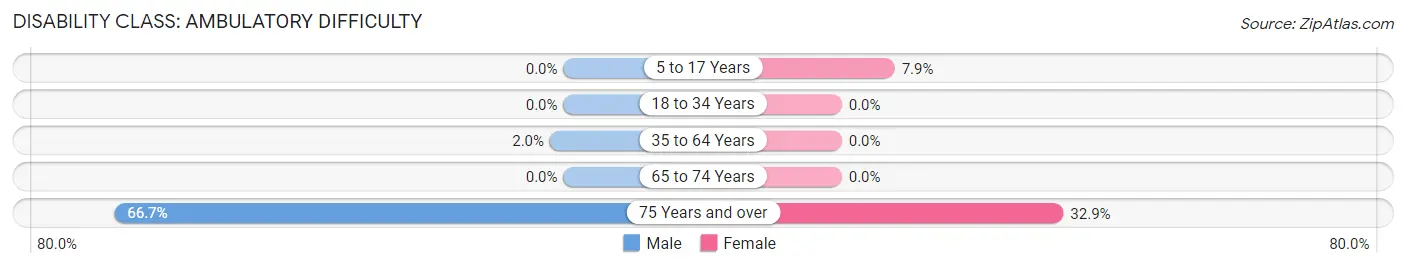
| Age Bracket | Male | Female |
| 5 to 17 Years | 0 (0.0%) | 18 (7.9%) |
| 18 to 34 Years | 0 (0.0%) | 0 (0.0%) |
| 35 to 64 Years | 11 (2.0%) | 0 (0.0%) |
| 65 to 74 Years | 0 (0.0%) | 0 (0.0%) |
| 75 Years and over | 32 (66.7%) | 26 (32.9%) |
Disability Class: Self-Care Difficulty
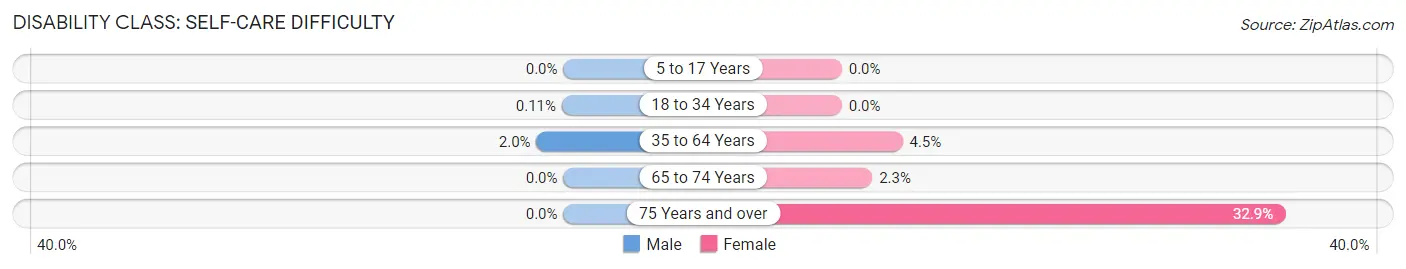
| Age Bracket | Male | Female |
| 5 to 17 Years | 0 (0.0%) | 0 (0.0%) |
| 18 to 34 Years | 1 (0.1%) | 0 (0.0%) |
| 35 to 64 Years | 11 (2.0%) | 30 (4.5%) |
| 65 to 74 Years | 0 (0.0%) | 3 (2.3%) |
| 75 Years and over | 0 (0.0%) | 26 (32.9%) |
Technology Access in Lansing
Computing Device Access in Lansing
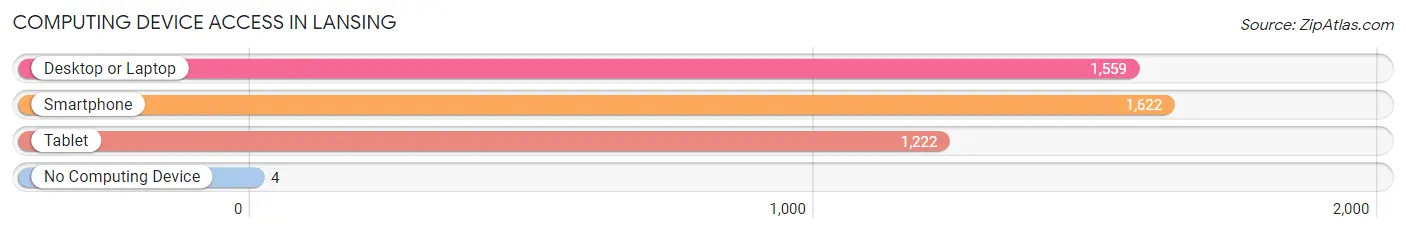
| Device Type | # Households | % Households |
| Desktop or Laptop | 1,559 | 91.4% |
| Smartphone | 1,622 | 95.1% |
| Tablet | 1,222 | 71.7% |
| No Computing Device | 4 | 0.2% |
| Total | 1,705 | 100.0% |
Internet Access in Lansing
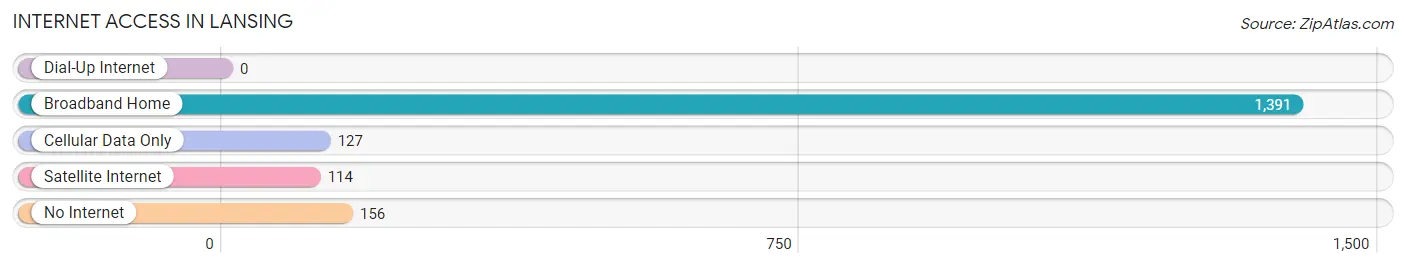
| Internet Type | # Households | % Households |
| Dial-Up Internet | 0 | 0.0% |
| Broadband Home | 1,391 | 81.6% |
| Cellular Data Only | 127 | 7.4% |
| Satellite Internet | 114 | 6.7% |
| No Internet | 156 | 9.1% |
| Total | 1,705 | 100.0% |
Lansing Summary
Lansing is a town located in the Finger Lakes region of New York State. It is situated in the northwest corner of Tompkins County, and is bordered by the towns of Ithaca, Dryden, Groton, and Newfield. The town has a population of approximately 11,000 people, and is home to several small villages and hamlets, including Lansing, Lansing Station, and Myers Corner.
History
The area that is now Lansing was originally inhabited by the Cayuga Nation, a member of the Iroquois Confederacy. The first European settlers arrived in the area in the late 1700s, and the town was officially established in 1817. The town was named after John Lansing, Jr., a prominent lawyer and politician from Albany.
In the early 19th century, Lansing was a rural farming community, and the primary crops were wheat, corn, and potatoes. The town also had several mills, including a grist mill, a saw mill, and a woolen mill. In the late 19th century, the town began to develop into a more industrial community, with several factories and businesses opening in the area.
Geography
Lansing is located in the Finger Lakes region of New York State. The town is situated in the northwest corner of Tompkins County, and is bordered by the towns of Ithaca, Dryden, Groton, and Newfield. The town has a total area of 33.2 square miles, of which 32.9 square miles is land and 0.3 square miles is water.
The town is located in the Finger Lakes region of New York State, and is situated on the northern shore of Cayuga Lake. The town is home to several small villages and hamlets, including Lansing, Lansing Station, and Myers Corner.
Economy
Lansing is a primarily residential community, and the town’s economy is largely based on tourism and agriculture. The town is home to several wineries, and is a popular destination for wine tasting and other recreational activities. The town is also home to several small businesses, including restaurants, retail stores, and professional services.
Demographics
As of the 2010 census, the town had a population of 11,033 people. The racial makeup of the town was 94.2% White, 2.2% African American, 0.4% Native American, 1.2% Asian, 0.1% Pacific Islander, 0.7% from other races, and 1.2% from two or more races. Hispanic or Latino of any race were 3.2% of the population.
The median household income in the town was $50,945, and the median family income was $62,917. The per capita income for the town was $25,945. About 6.2% of families and 9.2% of the population were below the poverty line, including 11.2% of those under age 18 and 5.2% of those age 65 or over.
Common Questions
What is the Total Population of Lansing?
Total Population of Lansing is 3,814.
What is the Total Male Population of Lansing?
Total Male Population of Lansing is 2,006.
What is the Total Female Population of Lansing?
Total Female Population of Lansing is 1,808.
What is the Ratio of Males per 100 Females in Lansing?
There are 110.95 Males per 100 Females in Lansing.
What is the Ratio of Females per 100 Males in Lansing?
There are 90.13 Females per 100 Males in Lansing.
What is the Median Population Age in Lansing?
Median Population Age in Lansing is 31.2 Years.
What is the Average Family Size in Lansing
Average Family Size in Lansing is 2.7 People.
What is the Average Household Size in Lansing
Average Household Size in Lansing is 2.2 People.
What is Per Capita Income in Lansing?
Per Capita income in Lansing is $59,542.
What is the Median Family Income in Lansing?
Median Family Income in Lansing is $121,776.
What is the Median Household income in Lansing?
Median Household Income in Lansing is $75,245.
What is Income or Wage Gap in Lansing?
Income or Wage Gap in Lansing is 0.3%.
Women in Lansing earn 99.7 cents for every dollar earned by a man.
What is Inequality or Gini Index in Lansing?
Inequality or Gini Index in Lansing is 0.55.
How Large is the Labor Force in Lansing?
There are 2,400 People in the Labor Forcein in Lansing.
What is the Percentage of People in the Labor Force in Lansing?
72.7% of People are in the Labor Force in Lansing.
What is the Unemployment Rate in Lansing?
Unemployment Rate in Lansing is 3.8%.