Cities with the Most Immigrants from Barbados in New York
RELATED REPORTS & OPTIONS
Barbados
New York
Compare Cities
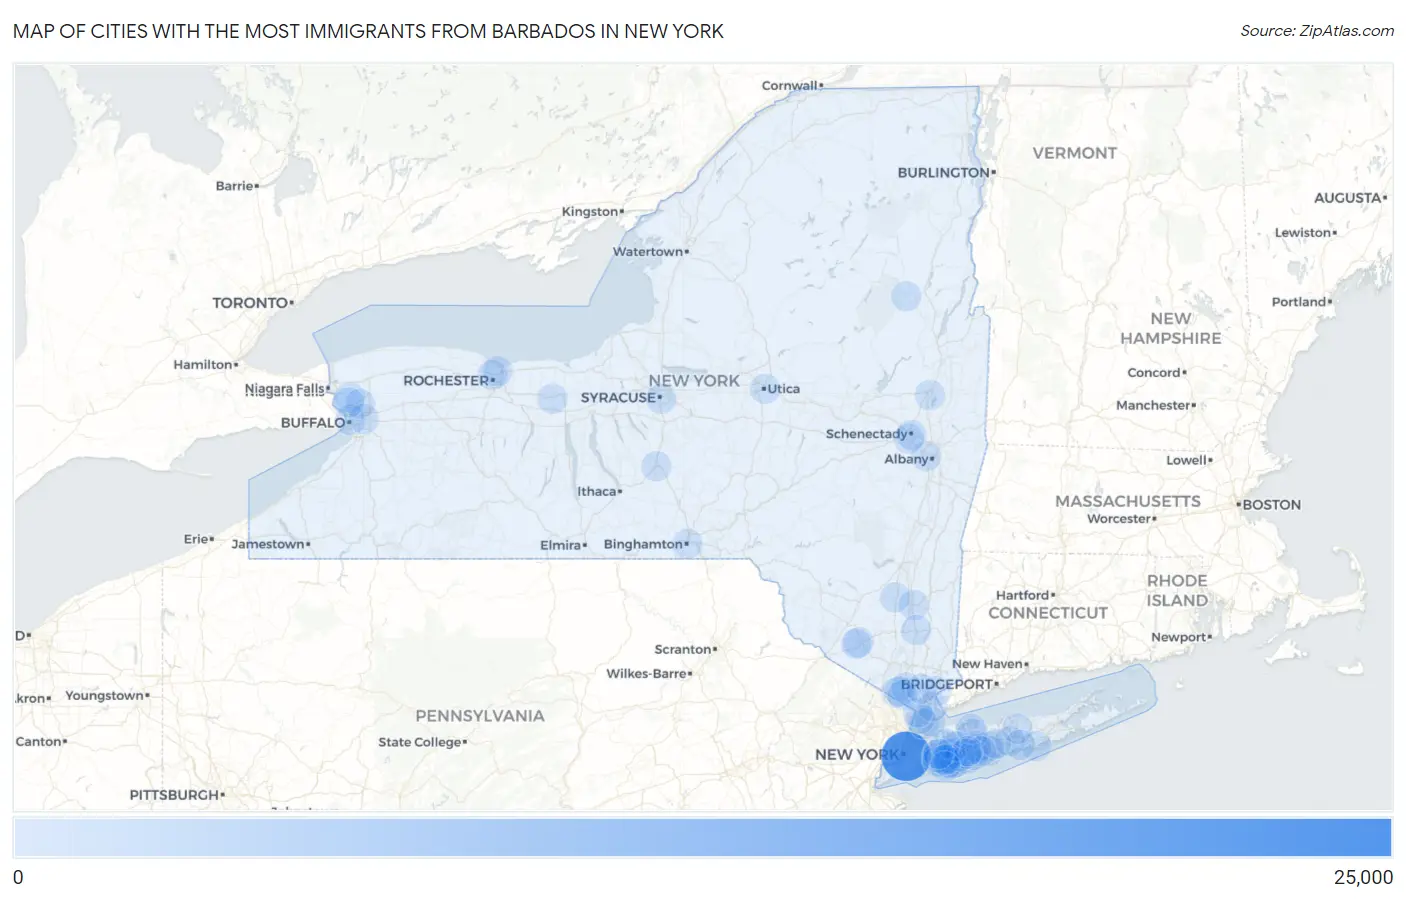
Map of Cities with the Most Immigrants from Barbados in New York
0
25,000
Cities with the Most Immigrants from Barbados in New York
| City | Barbados | vs State | vs National | |
| 1. | New York | 21,730 | 25,124(86.49%)#1 | 51,525(42.17%)#1 |
| 2. | Hempstead | 277 | 25,124(1.10%)#2 | 51,525(0.54%)#10 |
| 3. | Roosevelt | 267 | 25,124(1.06%)#3 | 51,525(0.52%)#13 |
| 4. | Mount Vernon | 233 | 25,124(0.93%)#4 | 51,525(0.45%)#17 |
| 5. | Freeport | 185 | 25,124(0.74%)#5 | 51,525(0.36%)#25 |
| 6. | Elmont | 166 | 25,124(0.66%)#6 | 51,525(0.32%)#30 |
| 7. | New Rochelle | 123 | 25,124(0.49%)#7 | 51,525(0.24%)#42 |
| 8. | Mechanicstown | 120 | 25,124(0.48%)#8 | 51,525(0.23%)#44 |
| 9. | Valley Stream | 113 | 25,124(0.45%)#9 | 51,525(0.22%)#50 |
| 10. | Baldwin | 109 | 25,124(0.43%)#10 | 51,525(0.21%)#54 |
| 11. | Yonkers | 86 | 25,124(0.34%)#11 | 51,525(0.17%)#66 |
| 12. | Bay Shore | 65 | 25,124(0.26%)#12 | 51,525(0.13%)#87 |
| 13. | East Meadow | 62 | 25,124(0.25%)#13 | 51,525(0.12%)#96 |
| 14. | Lakeview | 62 | 25,124(0.25%)#14 | 51,525(0.12%)#97 |
| 15. | Wheatley Heights | 59 | 25,124(0.23%)#15 | 51,525(0.11%)#106 |
| 16. | Albany | 58 | 25,124(0.23%)#16 | 51,525(0.11%)#109 |
| 17. | Poughkeepsie | 56 | 25,124(0.22%)#17 | 51,525(0.11%)#113 |
| 18. | Mastic Beach | 56 | 25,124(0.22%)#18 | 51,525(0.11%)#114 |
| 19. | Syracuse | 53 | 25,124(0.21%)#19 | 51,525(0.10%)#120 |
| 20. | Buffalo | 52 | 25,124(0.21%)#20 | 51,525(0.10%)#123 |
| 21. | North Valley Stream | 44 | 25,124(0.18%)#21 | 51,525(0.09%)#147 |
| 22. | Uniondale | 42 | 25,124(0.17%)#22 | 51,525(0.08%)#154 |
| 23. | North Tonawanda | 39 | 25,124(0.16%)#23 | 51,525(0.08%)#159 |
| 24. | New Paltz | 39 | 25,124(0.16%)#24 | 51,525(0.08%)#161 |
| 25. | University At Buffalo | 37 | 25,124(0.15%)#25 | 51,525(0.07%)#167 |
| 26. | Middletown | 29 | 25,124(0.12%)#26 | 51,525(0.06%)#206 |
| 27. | Cortland | 29 | 25,124(0.12%)#27 | 51,525(0.06%)#207 |
| 28. | North Bay Shore | 28 | 25,124(0.11%)#28 | 51,525(0.05%)#213 |
| 29. | Holbrook | 24 | 25,124(0.10%)#29 | 51,525(0.05%)#241 |
| 30. | Coram | 22 | 25,124(0.09%)#30 | 51,525(0.04%)#256 |
| 31. | White Plains | 21 | 25,124(0.08%)#31 | 51,525(0.04%)#263 |
| 32. | Wyandanch | 21 | 25,124(0.08%)#32 | 51,525(0.04%)#268 |
| 33. | Rochester | 20 | 25,124(0.08%)#33 | 51,525(0.04%)#269 |
| 34. | Hicksville | 20 | 25,124(0.08%)#34 | 51,525(0.04%)#273 |
| 35. | East Massapequa | 20 | 25,124(0.08%)#35 | 51,525(0.04%)#276 |
| 36. | Rotterdam | 19 | 25,124(0.08%)#36 | 51,525(0.04%)#289 |
| 37. | East Patchogue | 19 | 25,124(0.08%)#37 | 51,525(0.04%)#290 |
| 38. | Irondequoit | 17 | 25,124(0.07%)#38 | 51,525(0.03%)#306 |
| 39. | North Lindenhurst | 17 | 25,124(0.07%)#39 | 51,525(0.03%)#308 |
| 40. | North Wantagh | 16 | 25,124(0.06%)#40 | 51,525(0.03%)#318 |
| 41. | Monsey | 15 | 25,124(0.06%)#41 | 51,525(0.03%)#329 |
| 42. | Hillcrest | 15 | 25,124(0.06%)#42 | 51,525(0.03%)#332 |
| 43. | Armonk | 15 | 25,124(0.06%)#43 | 51,525(0.03%)#333 |
| 44. | Merrick | 14 | 25,124(0.06%)#44 | 51,525(0.03%)#341 |
| 45. | Huntington Station | 13 | 25,124(0.05%)#45 | 51,525(0.03%)#353 |
| 46. | New Cassel | 13 | 25,124(0.05%)#46 | 51,525(0.03%)#357 |
| 47. | Fishkill | 13 | 25,124(0.05%)#47 | 51,525(0.03%)#365 |
| 48. | Cheektowaga | 12 | 25,124(0.05%)#48 | 51,525(0.02%)#369 |
| 49. | Schenectady | 12 | 25,124(0.05%)#49 | 51,525(0.02%)#370 |
| 50. | Huntington | 12 | 25,124(0.05%)#50 | 51,525(0.02%)#380 |
| 51. | North Babylon | 12 | 25,124(0.05%)#51 | 51,525(0.02%)#381 |
| 52. | South Farmingdale | 12 | 25,124(0.05%)#52 | 51,525(0.02%)#382 |
| 53. | Farmingdale | 12 | 25,124(0.05%)#53 | 51,525(0.02%)#383 |
| 54. | Roslyn Heights | 10 | 25,124(0.04%)#54 | 51,525(0.02%)#417 |
| 55. | South Hempstead | 10 | 25,124(0.04%)#55 | 51,525(0.02%)#419 |
| 56. | New City | 9 | 25,124(0.04%)#56 | 51,525(0.02%)#433 |
| 57. | Rockville Centre | 8 | 25,124(0.03%)#57 | 51,525(0.02%)#455 |
| 58. | Nanuet | 8 | 25,124(0.03%)#58 | 51,525(0.02%)#456 |
| 59. | Hastings On Hudson | 7 | 25,124(0.03%)#59 | 51,525(0.01%)#476 |
| 60. | Central Islip | 6 | 25,124(0.02%)#60 | 51,525(0.01%)#489 |
| 61. | Fairview Cdp Westchester County | 6 | 25,124(0.02%)#61 | 51,525(0.01%)#493 |
| 62. | Binghamton | 5 | 25,124(0.02%)#62 | 51,525(0.01%)#504 |
| 63. | Oceanside | 4 | 25,124(0.02%)#63 | 51,525(0.01%)#517 |
| 64. | Saratoga Springs | 3 | 25,124(0.01%)#64 | 51,525(0.01%)#524 |
| 65. | Newark | 3 | 25,124(0.01%)#65 | 51,525(0.01%)#525 |
| 66. | Briarcliff Manor | 3 | 25,124(0.01%)#66 | 51,525(0.01%)#526 |
| 67. | South Floral Park | 3 | 25,124(0.01%)#67 | 51,525(0.01%)#531 |
| 68. | North Creek | 3 | 25,124(0.01%)#68 | 51,525(0.01%)#532 |
| 69. | Utica | 1 | 25,124(0.00%)#69 | 51,525(0.00%)#550 |
| 70. | Tonawanda | 1 | 25,124(0.00%)#70 | 51,525(0.00%)#551 |
Common Questions
What are the Top 10 Cities with the Most Immigrants from Barbados in New York?
Top 10 Cities with the Most Immigrants from Barbados in New York are:
#1
21,730
#2
277
#3
267
#4
233
#5
185
#6
166
#7
123
#8
120
#9
113
#10
109
What city has the Most Immigrants from Barbados in New York?
New York has the Most Immigrants from Barbados in New York with 21,730.
What is the Total Immigrants from Barbados in the State of New York?
Total Immigrants from Barbados in New York is 25,124.
What is the Total Immigrants from Barbados in the United States?
Total Immigrants from Barbados in the United States is 51,525.