Cities with the Highest Percentage of Immigrants from Caribbean in New York
RELATED REPORTS & OPTIONS
Caribbean
New York
Compare Cities
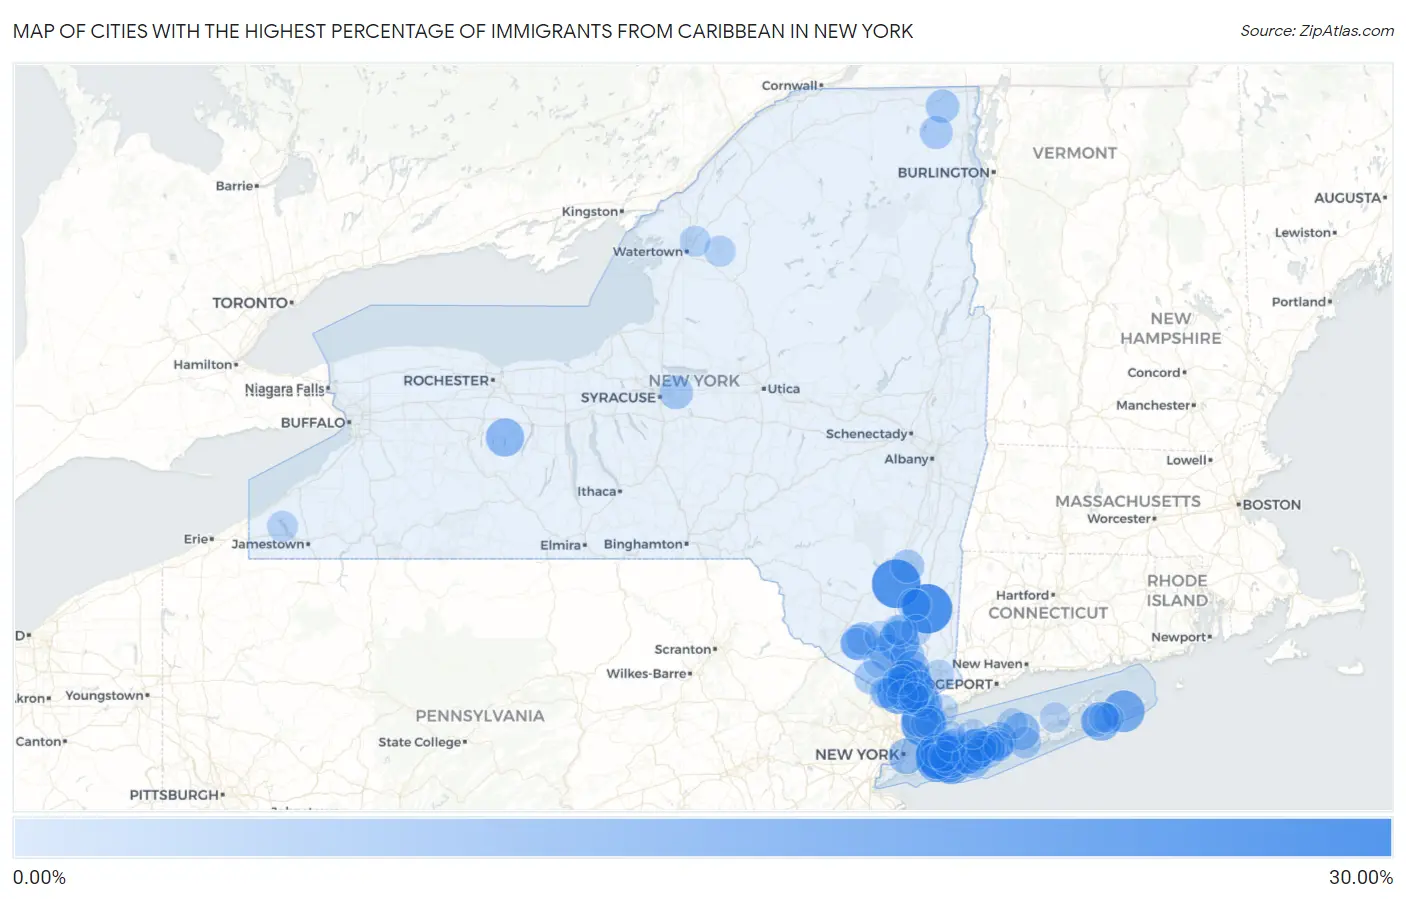
Map of Cities with the Highest Percentage of Immigrants from Caribbean in New York
0.00%
30.00%
Cities with the Highest Percentage of Immigrants from Caribbean in New York
| City | Caribbean | vs State | vs National | |
| 1. | Freedom Plains | 25.74% | 5.41%(+20.3)#-1 | 1.37%(+24.4)#0 |
| 2. | Tillson | 24.75% | 5.41%(+19.3)#0 | 1.37%(+23.4)#1 |
| 3. | Haverstraw | 21.11% | 5.41%(+15.7)#1 | 1.37%(+19.7)#2 |
| 4. | Mount Vernon | 20.77% | 5.41%(+15.4)#2 | 1.37%(+19.4)#3 |
| 5. | South Floral Park | 19.29% | 5.41%(+13.9)#3 | 1.37%(+17.9)#4 |
| 6. | North Valley Stream | 18.76% | 5.41%(+13.4)#4 | 1.37%(+17.4)#5 |
| 7. | Elmont | 18.28% | 5.41%(+12.9)#5 | 1.37%(+16.9)#6 |
| 8. | Spring Valley | 18.17% | 5.41%(+12.8)#136 | 1.37%(+16.8)#2,293 |
| 9. | Lakeview | 17.28% | 5.41%(+11.9)#137 | 1.37%(+15.9)#2,294 |
| 10. | Napeague | 16.88% | 5.41%(+11.5)#138 | 1.37%(+15.5)#2,295 |
| 11. | Vails Gate | 15.93% | 5.41%(+10.5)#139 | 1.37%(+14.6)#2,296 |
| 12. | Freeport | 15.62% | 5.41%(+10.2)#140 | 1.37%(+14.2)#2,383 |
| 13. | Wyandanch | 14.89% | 5.41%(+9.48)#141 | 1.37%(+13.5)#2,384 |
| 14. | Baldwin | 14.62% | 5.41%(+9.21)#142 | 1.37%(+13.2)#2,385 |
| 15. | Sleepy Hollow | 13.84% | 5.41%(+8.44)#143 | 1.37%(+12.5)#2,386 |
| 16. | West Haverstraw | 13.73% | 5.41%(+8.32)#144 | 1.37%(+12.4)#2,387 |
| 17. | Sagaponack | 13.66% | 5.41%(+8.26)#145 | 1.37%(+12.3)#2,388 |
| 18. | Roosevelt | 13.46% | 5.41%(+8.06)#146 | 1.37%(+12.1)#2,389 |
| 19. | South Valley Stream | 13.14% | 5.41%(+7.74)#147 | 1.37%(+11.8)#2,390 |
| 20. | Honeoye | 12.63% | 5.41%(+7.22)#148 | 1.37%(+11.3)#2,391 |
| 21. | Swan Lake | 12.45% | 5.41%(+7.04)#149 | 1.37%(+11.1)#2,392 |
| 22. | North Amityville | 12.04% | 5.41%(+6.63)#150 | 1.37%(+10.7)#2,393 |
| 23. | Hempstead | 11.66% | 5.41%(+6.26)#151 | 1.37%(+10.3)#2,394 |
| 24. | Gordon Heights | 11.37% | 5.41%(+5.97)#152 | 1.37%(+10.0)#2,395 |
| 25. | Yonkers | 11.37% | 5.41%(+5.96)#153 | 1.37%(+9.99)#2,396 |
| 26. | Uniondale | 11.05% | 5.41%(+5.64)#154 | 1.37%(+9.68)#2,397 |
| 27. | Mountain Lodge Park | 10.90% | 5.41%(+5.49)#155 | 1.37%(+9.53)#2,398 |
| 28. | Hillcrest | 10.80% | 5.41%(+5.39)#156 | 1.37%(+9.42)#2,399 |
| 29. | Islandia | 10.31% | 5.41%(+4.91)#157 | 1.37%(+8.94)#2,400 |
| 30. | Valley Stream | 10.22% | 5.41%(+4.81)#158 | 1.37%(+8.84)#2,401 |
| 31. | Mechanicstown | 10.10% | 5.41%(+4.70)#159 | 1.37%(+8.73)#2,402 |
| 32. | Copiague | 9.94% | 5.41%(+4.53)#160 | 1.37%(+8.57)#2,403 |
| 33. | New York | 9.82% | 5.41%(+4.42)#161 | 1.37%(+8.45)#2,404 |
| 34. | New Cassel | 9.25% | 5.41%(+3.85)#162 | 1.37%(+7.88)#2,405 |
| 35. | Brentwood | 9.13% | 5.41%(+3.72)#163 | 1.37%(+7.75)#2,406 |
| 36. | South Hempstead | 8.87% | 5.41%(+3.46)#164 | 1.37%(+7.50)#2,407 |
| 37. | Wheatley Heights | 8.54% | 5.41%(+3.14)#165 | 1.37%(+7.17)#2,408 |
| 38. | Highland Falls | 8.33% | 5.41%(+2.93)#166 | 1.37%(+6.96)#2,409 |
| 39. | Fairview Cdp Westchester County | 8.31% | 5.41%(+2.90)#167 | 1.37%(+6.93)#2,410 |
| 40. | Elmsford | 8.11% | 5.41%(+2.70)#168 | 1.37%(+6.74)#2,411 |
| 41. | Central Islip | 7.73% | 5.41%(+2.32)#169 | 1.37%(+6.36)#2,412 |
| 42. | Greenwood Lake | 7.66% | 5.41%(+2.26)#170 | 1.37%(+6.29)#2,413 |
| 43. | Minoa | 7.53% | 5.41%(+2.12)#171 | 1.37%(+6.16)#2,414 |
| 44. | Altona | 7.46% | 5.41%(+2.05)#172 | 1.37%(+6.09)#2,415 |
| 45. | East Kingston | 7.36% | 5.41%(+1.96)#173 | 1.37%(+5.99)#2,416 |
| 46. | Peekskill | 7.23% | 5.41%(+1.83)#174 | 1.37%(+5.86)#2,417 |
| 47. | Dannemora | 6.94% | 5.41%(+1.53)#175 | 1.37%(+5.57)#2,418 |
| 48. | Scotchtown | 6.93% | 5.41%(+1.52)#176 | 1.37%(+5.55)#2,419 |
| 49. | Balmville | 6.90% | 5.41%(+1.50)#177 | 1.37%(+5.53)#2,420 |
| 50. | North Bay Shore | 6.88% | 5.41%(+1.48)#178 | 1.37%(+5.51)#2,421 |
| 51. | South Nyack | 6.70% | 5.41%(+1.30)#179 | 1.37%(+5.33)#2,422 |
| 52. | Poughkeepsie | 6.57% | 5.41%(+1.16)#180 | 1.37%(+5.20)#2,423 |
| 53. | Bay Shore | 6.52% | 5.41%(+1.12)#181 | 1.37%(+5.15)#2,424 |
| 54. | West Nyack | 6.50% | 5.41%(+1.10)#182 | 1.37%(+5.13)#2,425 |
| 55. | Baywood | 6.46% | 5.41%(+1.05)#183 | 1.37%(+5.09)#2,426 |
| 56. | Sleepy Hollow Lake | 6.17% | 5.41%(+0.768)#184 | 1.37%(+4.80)#2,427 |
| 57. | New Hempstead | 5.96% | 5.41%(+0.559)#185 | 1.37%(+4.59)#2,428 |
| 58. | Bellerose | 5.71% | 5.41%(+0.300)#186 | 1.37%(+4.33)#2,429 |
| 59. | New City | 5.59% | 5.41%(+0.186)#187 | 1.37%(+4.22)#2,430 |
| 60. | North Bellport | 5.57% | 5.41%(+0.159)#188 | 1.37%(+4.19)#2,431 |
| 61. | Mount Ivy | 5.52% | 5.41%(+0.118)#189 | 1.37%(+4.15)#2,432 |
| 62. | Middletown | 5.40% | 5.41%(-0.006)#190 | 1.37%(+4.03)#2,433 |
| 63. | Bridgehampton | 5.36% | 5.41%(-0.046)#191 | 1.37%(+3.99)#2,434 |
| 64. | North Babylon | 5.23% | 5.41%(-0.175)#192 | 1.37%(+3.86)#2,435 |
| 65. | West Babylon | 5.18% | 5.41%(-0.224)#193 | 1.37%(+3.81)#2,436 |
| 66. | Westbury | 4.95% | 5.41%(-0.452)#194 | 1.37%(+3.58)#2,437 |
| 67. | West Carthage | 4.84% | 5.41%(-0.565)#195 | 1.37%(+3.47)#2,438 |
| 68. | Stony Point | 4.80% | 5.41%(-0.602)#196 | 1.37%(+3.43)#2,439 |
| 69. | Walton Park | 4.66% | 5.41%(-0.743)#197 | 1.37%(+3.29)#2,440 |
| 70. | Port Chester | 4.60% | 5.41%(-0.806)#198 | 1.37%(+3.23)#2,441 |
| 71. | Tarrytown | 4.58% | 5.41%(-0.828)#199 | 1.37%(+3.20)#2,442 |
| 72. | Suffern | 4.57% | 5.41%(-0.835)#200 | 1.37%(+3.20)#2,443 |
| 73. | Arlington | 4.53% | 5.41%(-0.873)#201 | 1.37%(+3.16)#2,444 |
| 74. | Calcium | 4.53% | 5.41%(-0.878)#202 | 1.37%(+3.16)#2,445 |
| 75. | Maybrook | 4.47% | 5.41%(-0.940)#203 | 1.37%(+3.09)#2,446 |
| 76. | New Rochelle | 4.44% | 5.41%(-0.965)#204 | 1.37%(+3.07)#2,447 |
| 77. | Chautauqua | 4.43% | 5.41%(-0.978)#205 | 1.37%(+3.06)#2,448 |
| 78. | East Massapequa | 4.42% | 5.41%(-0.982)#206 | 1.37%(+3.05)#2,449 |
| 79. | Hillburn | 4.42% | 5.41%(-0.985)#207 | 1.37%(+3.05)#2,450 |
| 80. | Terryville | 4.41% | 5.41%(-0.998)#208 | 1.37%(+3.04)#2,451 |
| 81. | Pelham | 4.38% | 5.41%(-1.03)#209 | 1.37%(+3.01)#2,452 |
| 82. | West Hempstead | 4.38% | 5.41%(-1.03)#210 | 1.37%(+3.01)#2,453 |
| 83. | Pomona | 4.35% | 5.41%(-1.05)#211 | 1.37%(+2.98)#2,454 |
| 84. | Old Brookville | 4.25% | 5.41%(-1.15)#212 | 1.37%(+2.88)#2,455 |
| 85. | Bedford Hills | 4.17% | 5.41%(-1.24)#213 | 1.37%(+2.79)#2,456 |
| 86. | New Hackensack | 4.14% | 5.41%(-1.27)#214 | 1.37%(+2.77)#2,457 |
| 87. | Upper Nyack | 4.11% | 5.41%(-1.30)#215 | 1.37%(+2.74)#2,458 |
| 88. | Deer Park | 4.11% | 5.41%(-1.30)#216 | 1.37%(+2.73)#2,459 |
| 89. | Fishkill | 4.09% | 5.41%(-1.32)#217 | 1.37%(+2.72)#2,460 |
| 90. | East Hampton | 4.02% | 5.41%(-1.39)#218 | 1.37%(+2.64)#2,461 |
| 91. | Tuxedo | 4.00% | 5.41%(-1.40)#219 | 1.37%(+2.63)#2,462 |
| 92. | Thiells | 3.96% | 5.41%(-1.44)#220 | 1.37%(+2.59)#2,463 |
| 93. | Nanuet | 3.92% | 5.41%(-1.48)#221 | 1.37%(+2.55)#2,464 |
| 94. | Huntington Station | 3.87% | 5.41%(-1.53)#222 | 1.37%(+2.50)#2,465 |
| 95. | Gardnertown | 3.85% | 5.41%(-1.55)#223 | 1.37%(+2.48)#2,466 |
| 96. | Ossining | 3.85% | 5.41%(-1.56)#224 | 1.37%(+2.48)#2,467 |
| 97. | Nyack | 3.83% | 5.41%(-1.58)#225 | 1.37%(+2.45)#2,468 |
| 98. | North Great River | 3.80% | 5.41%(-1.60)#226 | 1.37%(+2.43)#2,469 |
| 99. | Riverhead | 3.77% | 5.41%(-1.64)#227 | 1.37%(+2.39)#2,470 |
| 100. | Wainscott | 3.76% | 5.41%(-1.64)#228 | 1.37%(+2.39)#2,471 |
Common Questions
What are the Top 10 Cities with the Highest Percentage of Immigrants from Caribbean in New York?
Top 10 Cities with the Highest Percentage of Immigrants from Caribbean in New York are:
#1
25.74%
#2
24.75%
#3
21.11%
#4
20.77%
#5
19.29%
#6
18.76%
#7
18.28%
#8
18.17%
#9
17.28%
#10
16.88%
What city has the Highest Percentage of Immigrants from Caribbean in New York?
Freedom Plains has the Highest Percentage of Immigrants from Caribbean in New York with 25.74%.
What is the Percentage of Immigrants from Caribbean in the State of New York?
Percentage of Immigrants from Caribbean in New York is 5.41%.
What is the Percentage of Immigrants from Caribbean in the United States?
Percentage of Immigrants from Caribbean in the United States is 1.37%.