New Windsor, NY
New Windsor Map
New Windsor Overview
8,788
TOTAL POPULATION
4,173
MALE POPULATION
4,615
FEMALE POPULATION
90.42
MALES / 100 FEMALES
110.59
FEMALES / 100 MALES
40.9
MEDIAN AGE
3.2
AVG FAMILY SIZE
2.6
AVG HOUSEHOLD SIZE
$41,043
PER CAPITA INCOME
$105,431
AVG FAMILY INCOME
$82,120
AVG HOUSEHOLD INCOME
44.2%
WAGE / INCOME GAP [ % ]
55.8¢/ $1
WAGE / INCOME GAP [ $ ]
0.44
INEQUALITY / GINI INDEX
4,866
LABOR FORCE [ PEOPLE ]
65.0%
PERCENT IN LABOR FORCE
10.7%
UNEMPLOYMENT RATE
New Windsor Zip Codes
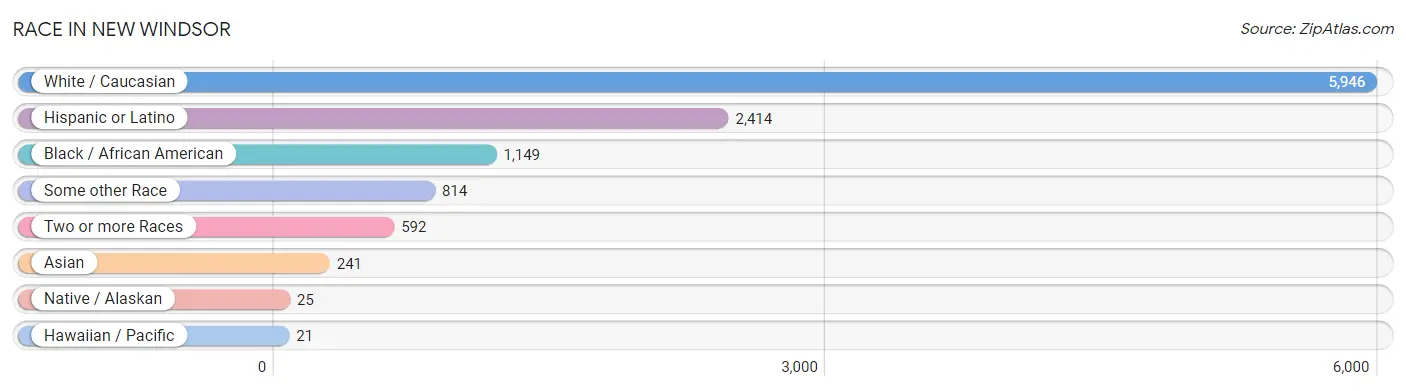
Race in New Windsor
The most populous races in New Windsor are White / Caucasian (5,946 | 67.7%), Hispanic or Latino (2,414 | 27.5%), and Black / African American (1,149 | 13.1%).
| Race | # Population | % Population |
| Asian | 241 | 2.7% |
| Black / African American | 1,149 | 13.1% |
| Hawaiian / Pacific | 21 | 0.2% |
| Hispanic or Latino | 2,414 | 27.5% |
| Native / Alaskan | 25 | 0.3% |
| White / Caucasian | 5,946 | 67.7% |
| Two or more Races | 592 | 6.7% |
| Some other Race | 814 | 9.3% |
| Total | 8,788 | 100.0% |
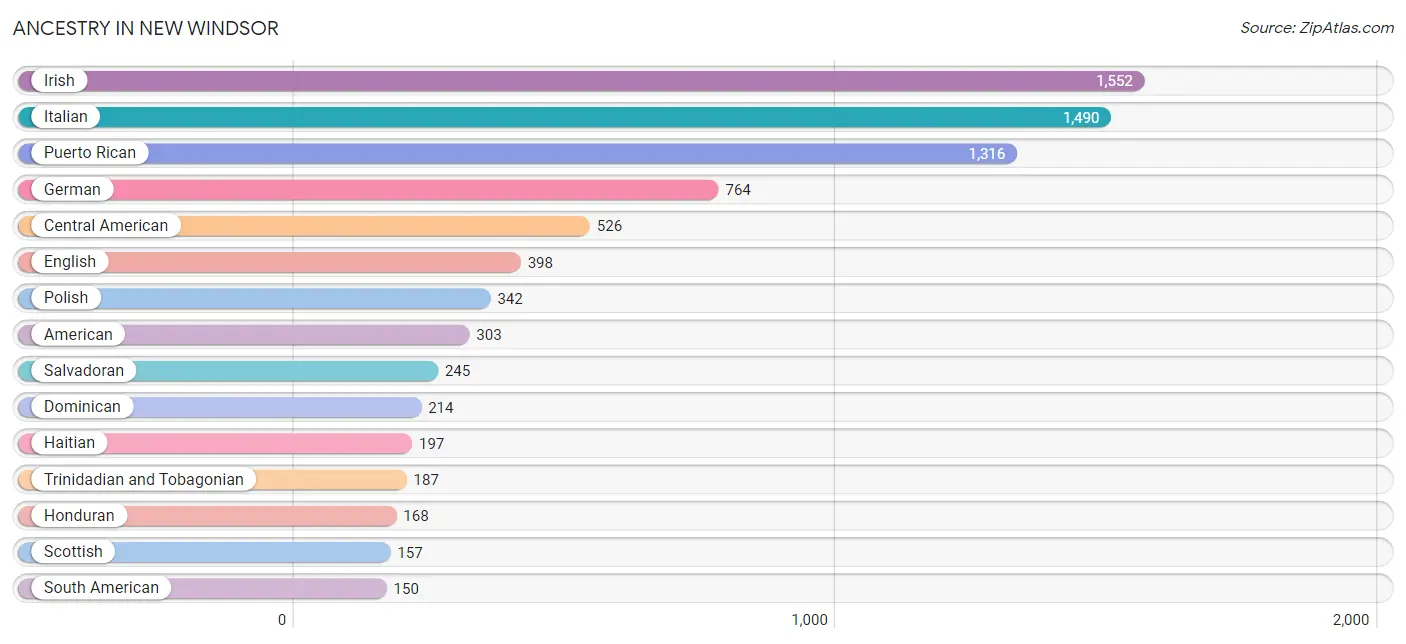
Ancestry in New Windsor
The most populous ancestries reported in New Windsor are Irish (1,552 | 17.7%), Italian (1,490 | 17.0%), Puerto Rican (1,316 | 15.0%), German (764 | 8.7%), and Central American (526 | 6.0%), together accounting for 64.3% of all New Windsor residents.
| Ancestry | # Population | % Population |
| African | 52 | 0.6% |
| Albanian | 60 | 0.7% |
| American | 303 | 3.5% |
| Arab | 48 | 0.5% |
| Austrian | 36 | 0.4% |
| Brazilian | 10 | 0.1% |
| British | 15 | 0.2% |
| Burmese | 21 | 0.2% |
| Central American | 526 | 6.0% |
| Central American Indian | 25 | 0.3% |
| Colombian | 7 | 0.1% |
| Croatian | 16 | 0.2% |
| Cuban | 22 | 0.3% |
| Czech | 9 | 0.1% |
| Czechoslovakian | 7 | 0.1% |
| Danish | 26 | 0.3% |
| Dominican | 214 | 2.4% |
| Dutch | 38 | 0.4% |
| Eastern European | 11 | 0.1% |
| English | 398 | 4.5% |
| European | 116 | 1.3% |
| French | 62 | 0.7% |
| French Canadian | 9 | 0.1% |
| German | 764 | 8.7% |
| Greek | 34 | 0.4% |
| Guatemalan | 70 | 0.8% |
| Haitian | 197 | 2.2% |
| Honduran | 168 | 1.9% |
| Hungarian | 29 | 0.3% |
| Indian (Asian) | 7 | 0.1% |
| Irish | 1,552 | 17.7% |
| Iroquois | 51 | 0.6% |
| Italian | 1,490 | 17.0% |
| Jamaican | 57 | 0.6% |
| Korean | 102 | 1.2% |
| Lithuanian | 16 | 0.2% |
| Mexican | 47 | 0.5% |
| Nicaraguan | 43 | 0.5% |
| Nigerian | 9 | 0.1% |
| Norwegian | 102 | 1.2% |
| Pennsylvania German | 7 | 0.1% |
| Peruvian | 143 | 1.6% |
| Polish | 342 | 3.9% |
| Puerto Rican | 1,316 | 15.0% |
| Russian | 123 | 1.4% |
| Salvadoran | 245 | 2.8% |
| Samoan | 21 | 0.2% |
| Scandinavian | 6 | 0.1% |
| Scotch-Irish | 20 | 0.2% |
| Scottish | 157 | 1.8% |
| Sioux | 10 | 0.1% |
| Slavic | 8 | 0.1% |
| Slovak | 33 | 0.4% |
| South American | 150 | 1.7% |
| Sri Lankan | 144 | 1.6% |
| Subsaharan African | 61 | 0.7% |
| Swedish | 87 | 1.0% |
| Trinidadian and Tobagonian | 187 | 2.1% |
| Turkish | 12 | 0.1% |
| West Indian | 10 | 0.1% | View All 60 Rows |
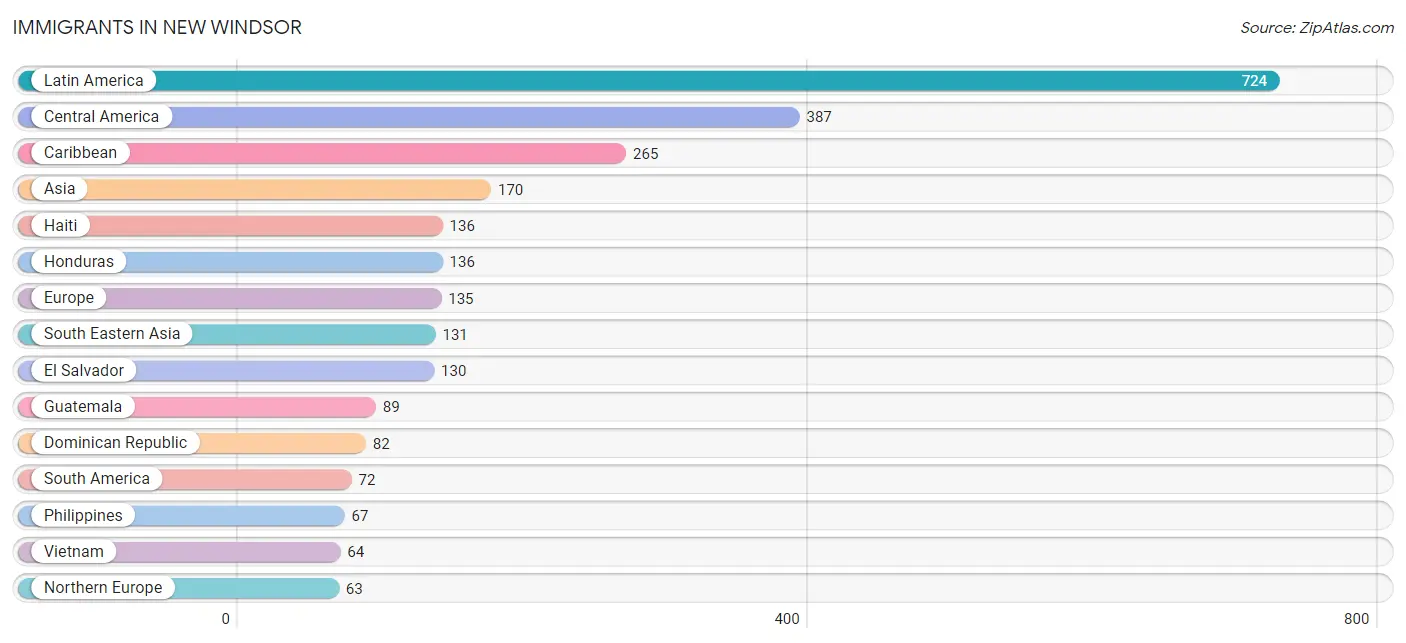
Immigrants in New Windsor
The most numerous immigrant groups reported in New Windsor came from Latin America (724 | 8.2%), Central America (387 | 4.4%), Caribbean (265 | 3.0%), Asia (170 | 1.9%), and Haiti (136 | 1.5%), together accounting for 19.1% of all New Windsor residents.
| Immigration Origin | # Population | % Population |
| Africa | 42 | 0.5% |
| Albania | 20 | 0.2% |
| Asia | 170 | 1.9% |
| Austria | 14 | 0.2% |
| Brazil | 22 | 0.3% |
| Canada | 6 | 0.1% |
| Caribbean | 265 | 3.0% |
| Central America | 387 | 4.4% |
| China | 6 | 0.1% |
| Colombia | 5 | 0.1% |
| Dominican Republic | 82 | 0.9% |
| Eastern Asia | 6 | 0.1% |
| Eastern Europe | 48 | 0.5% |
| El Salvador | 130 | 1.5% |
| England | 6 | 0.1% |
| Europe | 135 | 1.5% |
| Germany | 10 | 0.1% |
| Ghana | 33 | 0.4% |
| Guatemala | 89 | 1.0% |
| Haiti | 136 | 1.5% |
| Honduras | 136 | 1.5% |
| Ireland | 45 | 0.5% |
| Jamaica | 22 | 0.3% |
| Jordan | 7 | 0.1% |
| Latin America | 724 | 8.2% |
| Mexico | 17 | 0.2% |
| Nicaragua | 15 | 0.2% |
| Nigeria | 9 | 0.1% |
| Northern Europe | 63 | 0.7% |
| Norway | 3 | 0.0% |
| Peru | 45 | 0.5% |
| Philippines | 67 | 0.8% |
| Poland | 18 | 0.2% |
| Russia | 10 | 0.1% |
| South America | 72 | 0.8% |
| South Eastern Asia | 131 | 1.5% |
| Sweden | 9 | 0.1% |
| Trinidad and Tobago | 25 | 0.3% |
| Turkey | 19 | 0.2% |
| Vietnam | 64 | 0.7% |
| Western Africa | 42 | 0.5% |
| Western Asia | 26 | 0.3% |
| Western Europe | 24 | 0.3% | View All 43 Rows |
Sex and Age in New Windsor
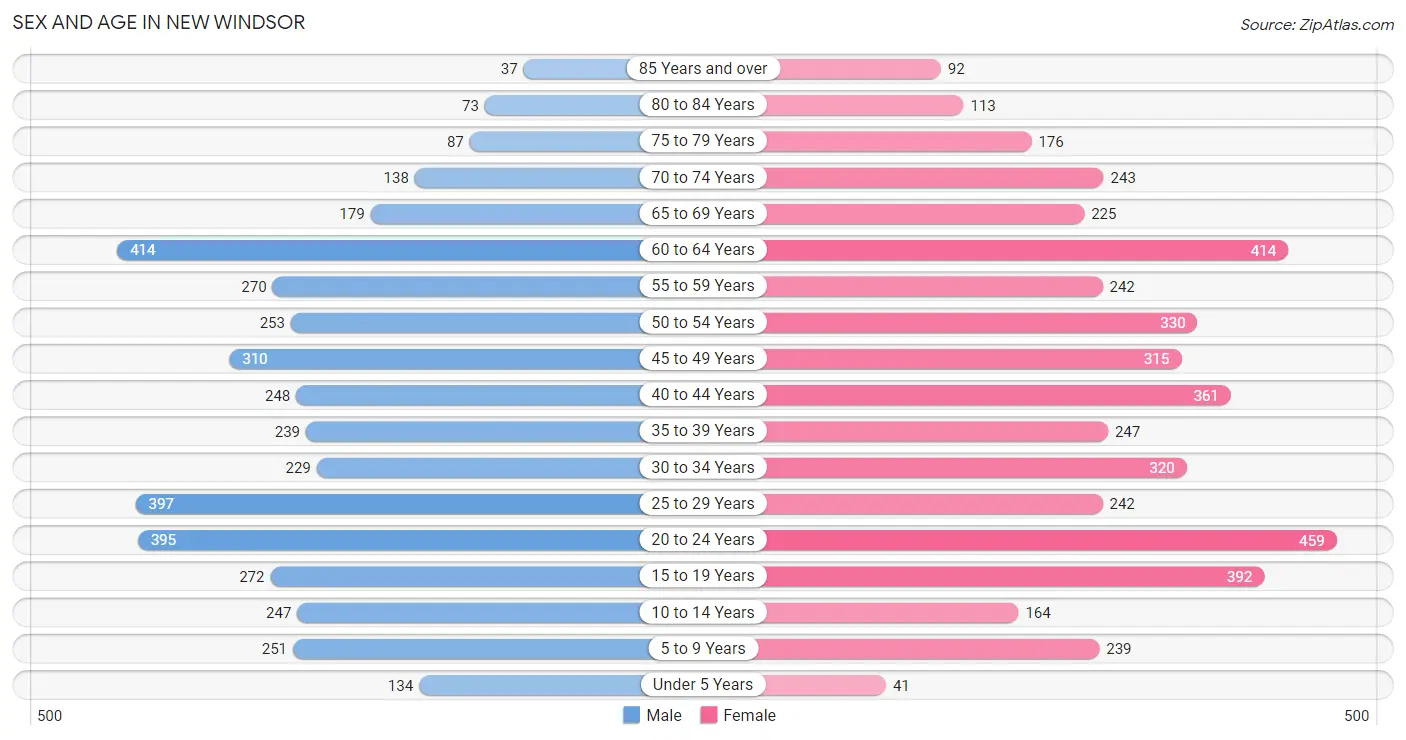
Sex and Age in New Windsor
The most populous age groups in New Windsor are 60 to 64 Years (414 | 9.9%) for men and 20 to 24 Years (459 | 10.0%) for women.
| Age Bracket | Male | Female |
| Under 5 Years | 134 (3.2%) | 41 (0.9%) |
| 5 to 9 Years | 251 (6.0%) | 239 (5.2%) |
| 10 to 14 Years | 247 (5.9%) | 164 (3.5%) |
| 15 to 19 Years | 272 (6.5%) | 392 (8.5%) |
| 20 to 24 Years | 395 (9.5%) | 459 (10.0%) |
| 25 to 29 Years | 397 (9.5%) | 242 (5.2%) |
| 30 to 34 Years | 229 (5.5%) | 320 (6.9%) |
| 35 to 39 Years | 239 (5.7%) | 247 (5.3%) |
| 40 to 44 Years | 248 (5.9%) | 361 (7.8%) |
| 45 to 49 Years | 310 (7.4%) | 315 (6.8%) |
| 50 to 54 Years | 253 (6.1%) | 330 (7.1%) |
| 55 to 59 Years | 270 (6.5%) | 242 (5.2%) |
| 60 to 64 Years | 414 (9.9%) | 414 (9.0%) |
| 65 to 69 Years | 179 (4.3%) | 225 (4.9%) |
| 70 to 74 Years | 138 (3.3%) | 243 (5.3%) |
| 75 to 79 Years | 87 (2.1%) | 176 (3.8%) |
| 80 to 84 Years | 73 (1.8%) | 113 (2.5%) |
| 85 Years and over | 37 (0.9%) | 92 (2.0%) |
| Total | 4,173 (100.0%) | 4,615 (100.0%) |
Families and Households in New Windsor
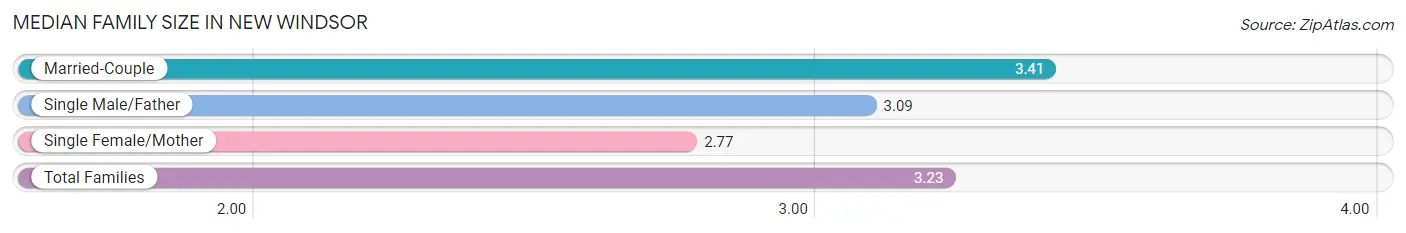
Median Family Size in New Windsor
The median family size in New Windsor is 3.23 persons per family, with married-couple families (1,454 | 68.1%) accounting for the largest median family size of 3.41 persons per family. On the other hand, single female/mother families (573 | 26.9%) represent the smallest median family size with 2.77 persons per family.
| Family Type | # Families | Family Size |
| Married-Couple | 1,454 (68.1%) | 3.41 |
| Single Male/Father | 107 (5.0%) | 3.09 |
| Single Female/Mother | 573 (26.9%) | 2.77 |
| Total Families | 2,134 (100.0%) | 3.23 |
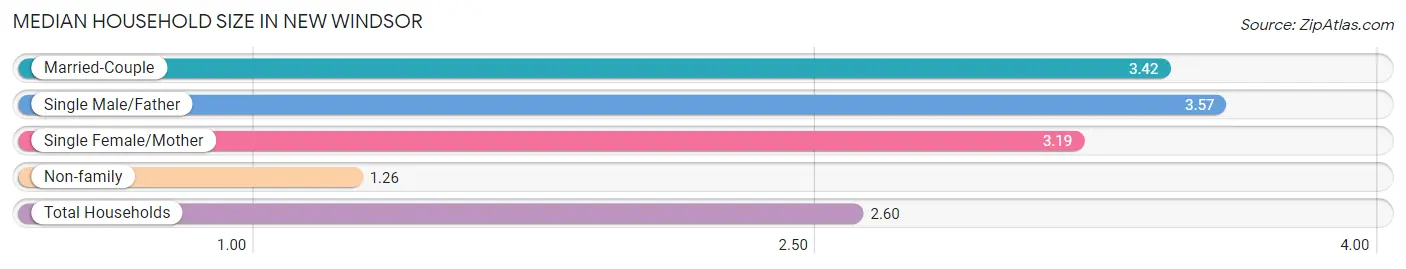
Median Household Size in New Windsor
The median household size in New Windsor is 2.60 persons per household, with single male/father households (107 | 3.2%) accounting for the largest median household size of 3.57 persons per household. non-family households (1,232 | 36.6%) represent the smallest median household size with 1.26 persons per household.
| Household Type | # Households | Household Size |
| Married-Couple | 1,454 (43.2%) | 3.42 |
| Single Male/Father | 107 (3.2%) | 3.57 |
| Single Female/Mother | 573 (17.0%) | 3.19 |
| Non-family | 1,232 (36.6%) | 1.26 |
| Total Households | 3,366 (100.0%) | 2.60 |
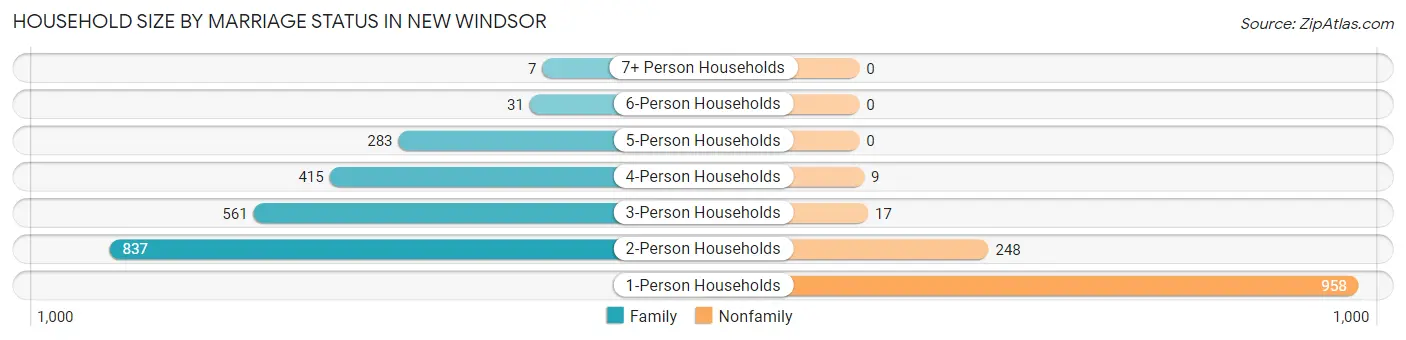
Household Size by Marriage Status in New Windsor
Out of a total of 3,366 households in New Windsor, 2,134 (63.4%) are family households, while 1,232 (36.6%) are nonfamily households. The most numerous type of family households are 2-person households, comprising 837, and the most common type of nonfamily households are 1-person households, comprising 958.
| Household Size | Family Households | Nonfamily Households |
| 1-Person Households | - | 958 (28.5%) |
| 2-Person Households | 837 (24.9%) | 248 (7.4%) |
| 3-Person Households | 561 (16.7%) | 17 (0.5%) |
| 4-Person Households | 415 (12.3%) | 9 (0.3%) |
| 5-Person Households | 283 (8.4%) | 0 (0.0%) |
| 6-Person Households | 31 (0.9%) | 0 (0.0%) |
| 7+ Person Households | 7 (0.2%) | 0 (0.0%) |
| Total | 2,134 (63.4%) | 1,232 (36.6%) |
Female Fertility in New Windsor
Fertility by Age in New Windsor
Average fertility rate in New Windsor is 6.0 births per 1,000 women. Women in the age bracket of 20 to 34 years have the highest fertility rate with 15.0 births per 1,000 women. Women in the age bracket of 20 to 34 years acount for 100.0% of all women with births.
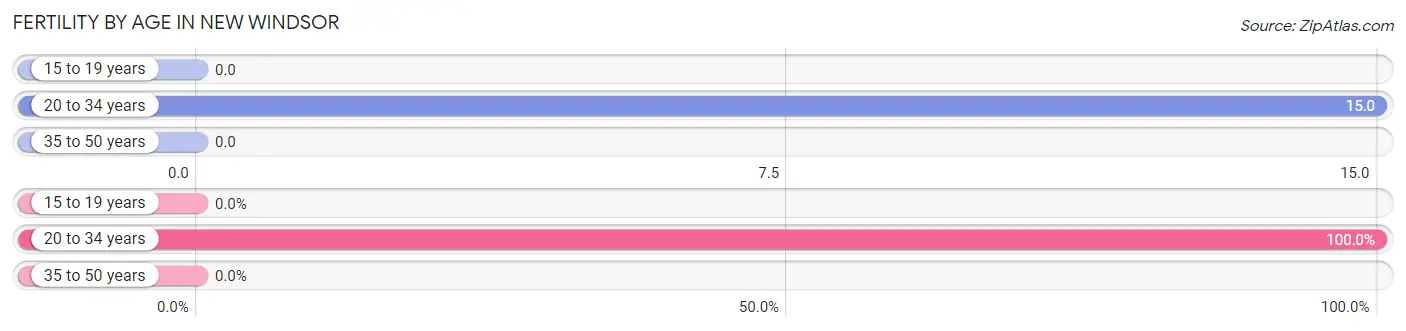
| Age Bracket | Women with Births | Births / 1,000 Women |
| 15 to 19 years | 0 (0.0%) | 0.0 |
| 20 to 34 years | 15 (100.0%) | 15.0 |
| 35 to 50 years | 0 (0.0%) | 0.0 |
| Total | 15 (100.0%) | 6.0 |
Fertility by Age by Marriage Status in New Windsor
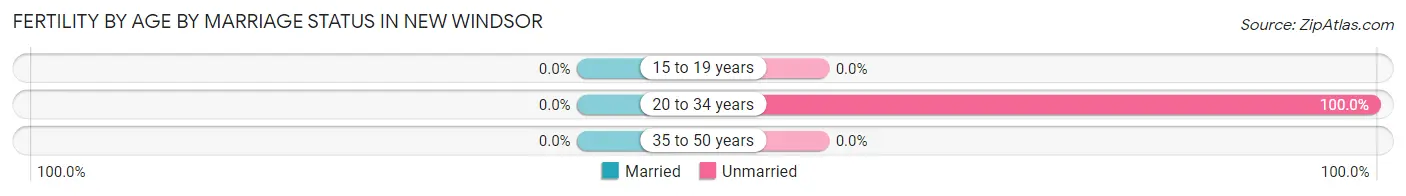
| Age Bracket | Married | Unmarried |
| 15 to 19 years | 0 (0.0%) | 0 (0.0%) |
| 20 to 34 years | 0 (0.0%) | 15 (100.0%) |
| 35 to 50 years | 0 (0.0%) | 0 (0.0%) |
| Total | 0 (0.0%) | 15 (100.0%) |
Fertility by Education in New Windsor
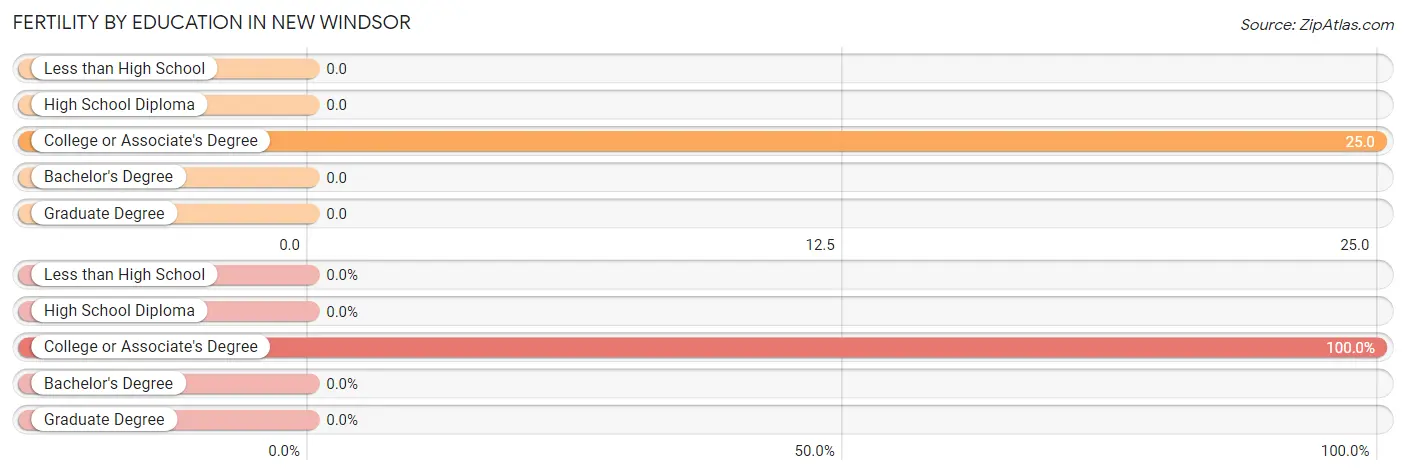
| Educational Attainment | Women with Births | Births / 1,000 Women |
| Less than High School | 0 (0.0%) | 0.0 |
| High School Diploma | 0 (0.0%) | 0.0 |
| College or Associate's Degree | 15 (100.0%) | 25.0 |
| Bachelor's Degree | 0 (0.0%) | 0.0 |
| Graduate Degree | 0 (0.0%) | 0.0 |
| Total | 15 (100.0%) | 6.0 |
Fertility by Education by Marriage Status in New Windsor
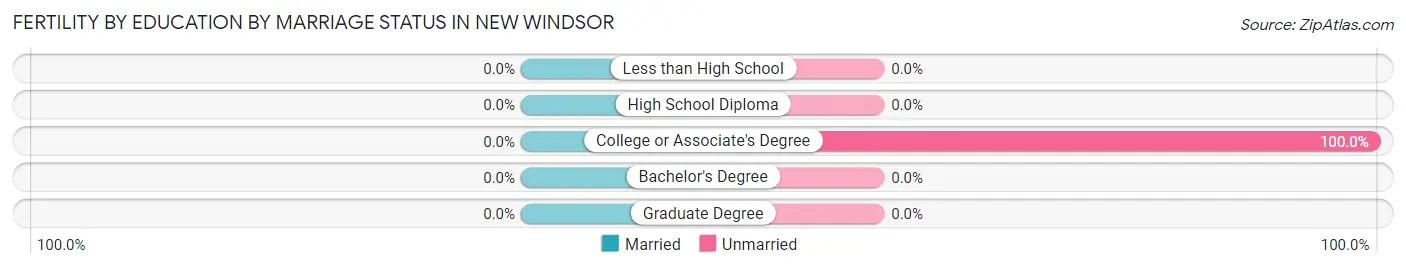
| Educational Attainment | Married | Unmarried |
| Less than High School | 0 (0.0%) | 0 (0.0%) |
| High School Diploma | 0 (0.0%) | 0 (0.0%) |
| College or Associate's Degree | 0 (0.0%) | 15 (100.0%) |
| Bachelor's Degree | 0 (0.0%) | 0 (0.0%) |
| Graduate Degree | 0 (0.0%) | 0 (0.0%) |
| Total | 0 (0.0%) | 15 (100.0%) |
Income in New Windsor
Income Overview in New Windsor
Per Capita Income in New Windsor is $41,043, while median incomes of families and households are $105,431 and $82,120 respectively.
| Characteristic | Number | Measure |
| Per Capita Income | 8,788 | $41,043 |
| Median Family Income | 2,134 | $105,431 |
| Mean Family Income | 2,134 | $120,147 |
| Median Household Income | 3,366 | $82,120 |
| Mean Household Income | 3,366 | $102,681 |
| Income Deficit | 2,134 | $0 |
| Wage / Income Gap (%) | 8,788 | 44.22% |
| Wage / Income Gap ($) | 8,788 | 55.78¢ per $1 |
| Gini / Inequality Index | 8,788 | 0.44 |
Earnings by Sex in New Windsor
Average Earnings in New Windsor are $45,716, $63,018 for men and $35,154 for women, a difference of 44.2%.
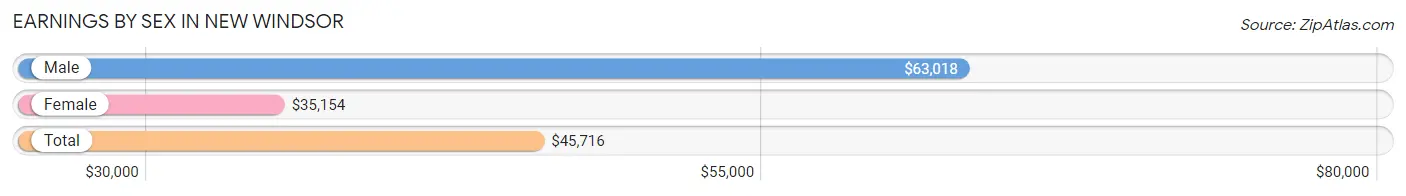
| Sex | Number | Average Earnings |
| Male | 2,435 (48.8%) | $63,018 |
| Female | 2,551 (51.2%) | $35,154 |
| Total | 4,986 (100.0%) | $45,716 |
Earnings by Sex by Income Bracket in New Windsor
The most common earnings brackets in New Windsor are $100,000+ for men (429 | 17.6%) and $75,000 to $99,999 for women (337 | 13.2%).
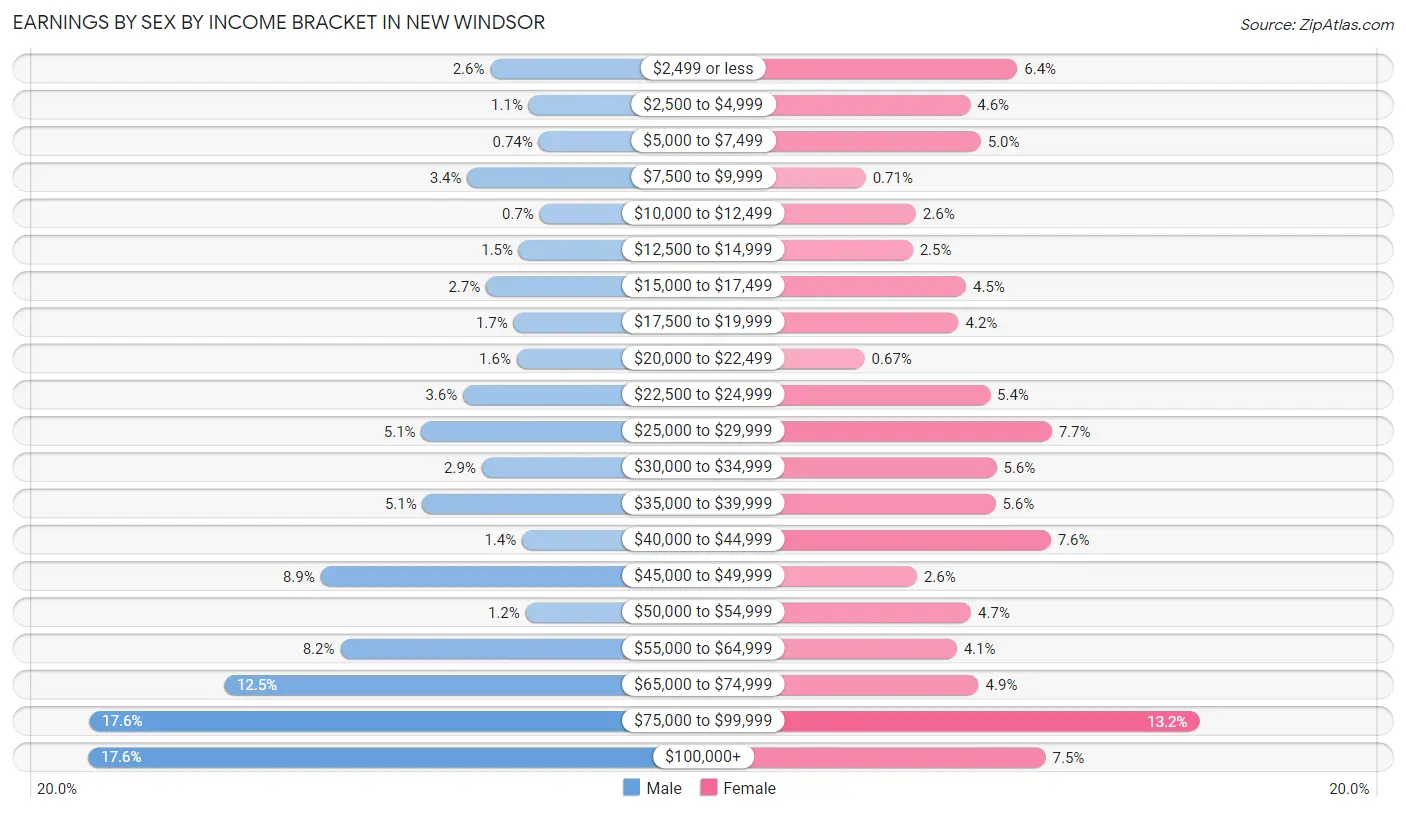
| Income | Male | Female |
| $2,499 or less | 62 (2.5%) | 163 (6.4%) |
| $2,500 to $4,999 | 27 (1.1%) | 118 (4.6%) |
| $5,000 to $7,499 | 18 (0.7%) | 128 (5.0%) |
| $7,500 to $9,999 | 83 (3.4%) | 18 (0.7%) |
| $10,000 to $12,499 | 17 (0.7%) | 66 (2.6%) |
| $12,500 to $14,999 | 36 (1.5%) | 63 (2.5%) |
| $15,000 to $17,499 | 66 (2.7%) | 114 (4.5%) |
| $17,500 to $19,999 | 41 (1.7%) | 107 (4.2%) |
| $20,000 to $22,499 | 38 (1.6%) | 17 (0.7%) |
| $22,500 to $24,999 | 87 (3.6%) | 137 (5.4%) |
| $25,000 to $29,999 | 125 (5.1%) | 196 (7.7%) |
| $30,000 to $34,999 | 70 (2.9%) | 143 (5.6%) |
| $35,000 to $39,999 | 124 (5.1%) | 142 (5.6%) |
| $40,000 to $44,999 | 33 (1.4%) | 195 (7.6%) |
| $45,000 to $49,999 | 217 (8.9%) | 67 (2.6%) |
| $50,000 to $54,999 | 30 (1.2%) | 119 (4.7%) |
| $55,000 to $64,999 | 199 (8.2%) | 105 (4.1%) |
| $65,000 to $74,999 | 305 (12.5%) | 126 (4.9%) |
| $75,000 to $99,999 | 428 (17.6%) | 337 (13.2%) |
| $100,000+ | 429 (17.6%) | 190 (7.4%) |
| Total | 2,435 (100.0%) | 2,551 (100.0%) |
Earnings by Sex by Educational Attainment in New Windsor
Average earnings in New Windsor are $70,219 for men and $38,656 for women, a difference of 45.0%. Men with an educational attainment of graduate degree enjoy the highest average annual earnings of $101,389, while those with high school diploma education earn the least with $60,735. Women with an educational attainment of graduate degree earn the most with the average annual earnings of $58,229, while those with less than high school education have the smallest earnings of $16,738.
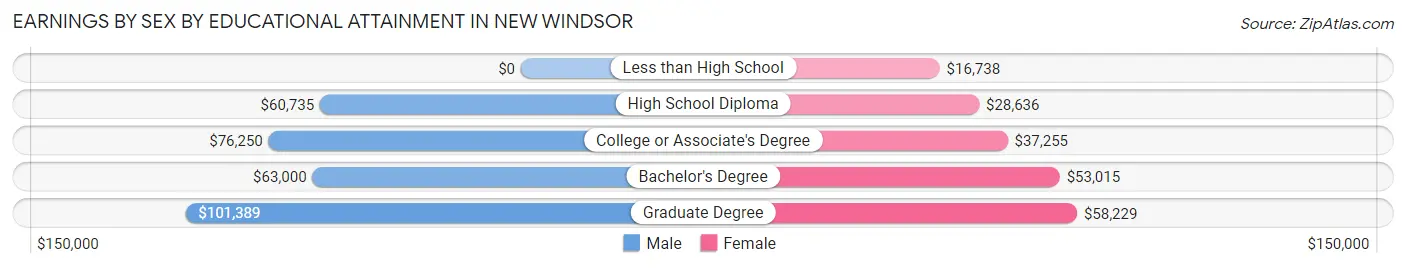
| Educational Attainment | Male Income | Female Income |
| Less than High School | - | - |
| High School Diploma | $60,735 | $28,636 |
| College or Associate's Degree | $76,250 | $37,255 |
| Bachelor's Degree | $63,000 | $53,015 |
| Graduate Degree | $101,389 | $58,229 |
| Total | $70,219 | $38,656 |
Family Income in New Windsor
Family Income Brackets in New Windsor
According to the New Windsor family income data, there are 489 families falling into the $100,000 to $149,999 income range, which is the most common income bracket and makes up 22.9% of all families. Conversely, the less than $10,000 income bracket is the least frequent group with only 38 families (1.8%) belonging to this category.
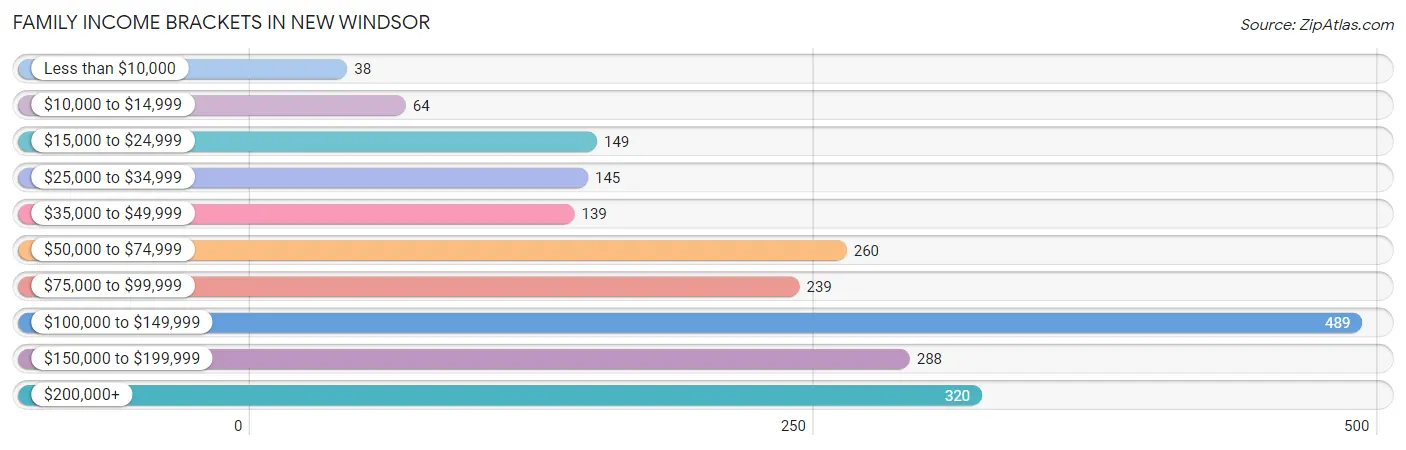
| Income Bracket | # Families | % Families |
| Less than $10,000 | 38 | 1.8% |
| $10,000 to $14,999 | 64 | 3.0% |
| $15,000 to $24,999 | 149 | 7.0% |
| $25,000 to $34,999 | 145 | 6.8% |
| $35,000 to $49,999 | 139 | 6.5% |
| $50,000 to $74,999 | 260 | 12.2% |
| $75,000 to $99,999 | 239 | 11.2% |
| $100,000 to $149,999 | 489 | 22.9% |
| $150,000 to $199,999 | 288 | 13.5% |
| $200,000+ | 320 | 15.0% |
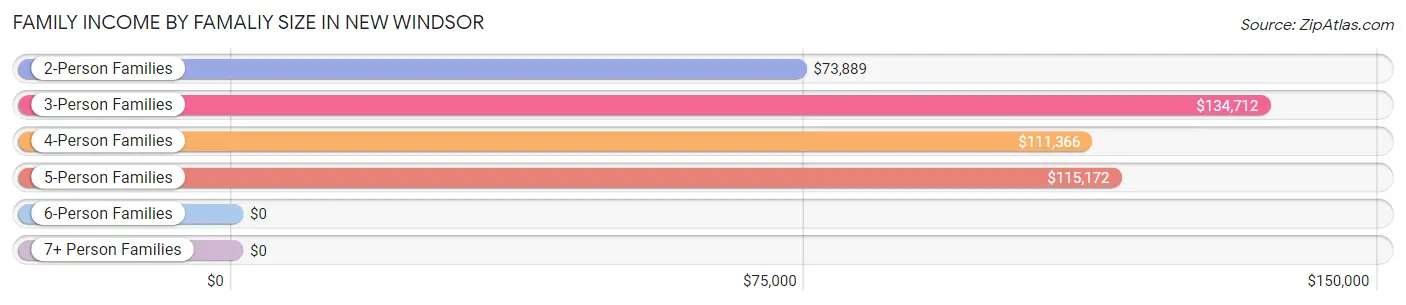
Family Income by Famaliy Size in New Windsor
3-person families (593 | 27.8%) account for the highest median family income in New Windsor with $134,712 per family, while 3-person families (593 | 27.8%) have the highest median income of $44,904 per family member.
| Income Bracket | # Families | Median Income |
| 2-Person Families | 914 (42.8%) | $73,889 |
| 3-Person Families | 593 (27.8%) | $134,712 |
| 4-Person Families | 399 (18.7%) | $111,366 |
| 5-Person Families | 190 (8.9%) | $115,172 |
| 6-Person Families | 31 (1.5%) | $0 |
| 7+ Person Families | 7 (0.3%) | $0 |
| Total | 2,134 (100.0%) | $105,431 |
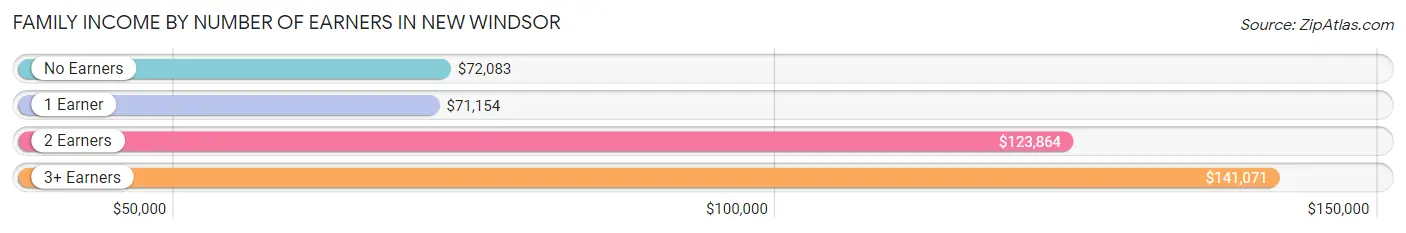
Family Income by Number of Earners in New Windsor
The median family income in New Windsor is $105,431, with families comprising 3+ earners (362) having the highest median family income of $141,071, while families with 1 earner (704) have the lowest median family income of $71,154, accounting for 17.0% and 33.0% of families, respectively.
| Number of Earners | # Families | Median Income |
| No Earners | 210 (9.8%) | $72,083 |
| 1 Earner | 704 (33.0%) | $71,154 |
| 2 Earners | 858 (40.2%) | $123,864 |
| 3+ Earners | 362 (17.0%) | $141,071 |
| Total | 2,134 (100.0%) | $105,431 |
Household Income in New Windsor
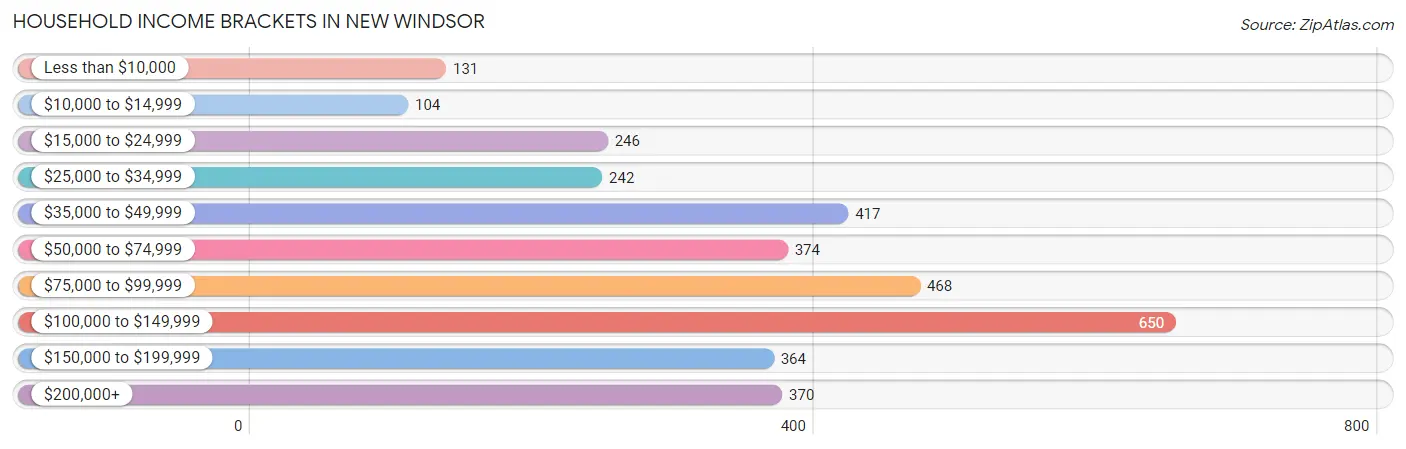
Household Income Brackets in New Windsor
With 650 households falling in the category, the $100,000 to $149,999 income range is the most frequent in New Windsor, accounting for 19.3% of all households. In contrast, only 104 households (3.1%) fall into the $10,000 to $14,999 income bracket, making it the least populous group.
| Income Bracket | # Households | % Households |
| Less than $10,000 | 131 | 3.9% |
| $10,000 to $14,999 | 104 | 3.1% |
| $15,000 to $24,999 | 246 | 7.3% |
| $25,000 to $34,999 | 242 | 7.2% |
| $35,000 to $49,999 | 417 | 12.4% |
| $50,000 to $74,999 | 374 | 11.1% |
| $75,000 to $99,999 | 468 | 13.9% |
| $100,000 to $149,999 | 650 | 19.3% |
| $150,000 to $199,999 | 364 | 10.8% |
| $200,000+ | 370 | 11.0% |
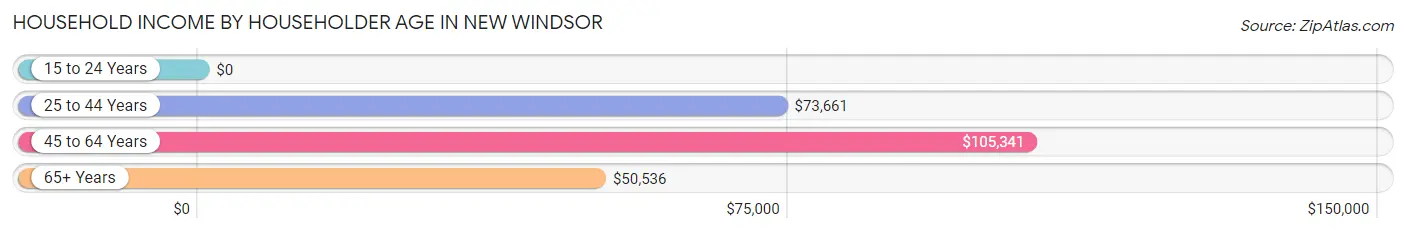
Household Income by Householder Age in New Windsor
The median household income in New Windsor is $82,120, with the highest median household income of $105,341 found in the 45 to 64 years age bracket for the primary householder. A total of 1,506 households (44.7%) fall into this category. Meanwhile, the 15 to 24 years age bracket for the primary householder has the lowest median household income of $0, with 26 households (0.8%) in this group.
| Income Bracket | # Households | Median Income |
| 15 to 24 Years | 26 (0.8%) | $0 |
| 25 to 44 Years | 931 (27.7%) | $73,661 |
| 45 to 64 Years | 1,506 (44.7%) | $105,341 |
| 65+ Years | 903 (26.8%) | $50,536 |
| Total | 3,366 (100.0%) | $82,120 |
Poverty in New Windsor
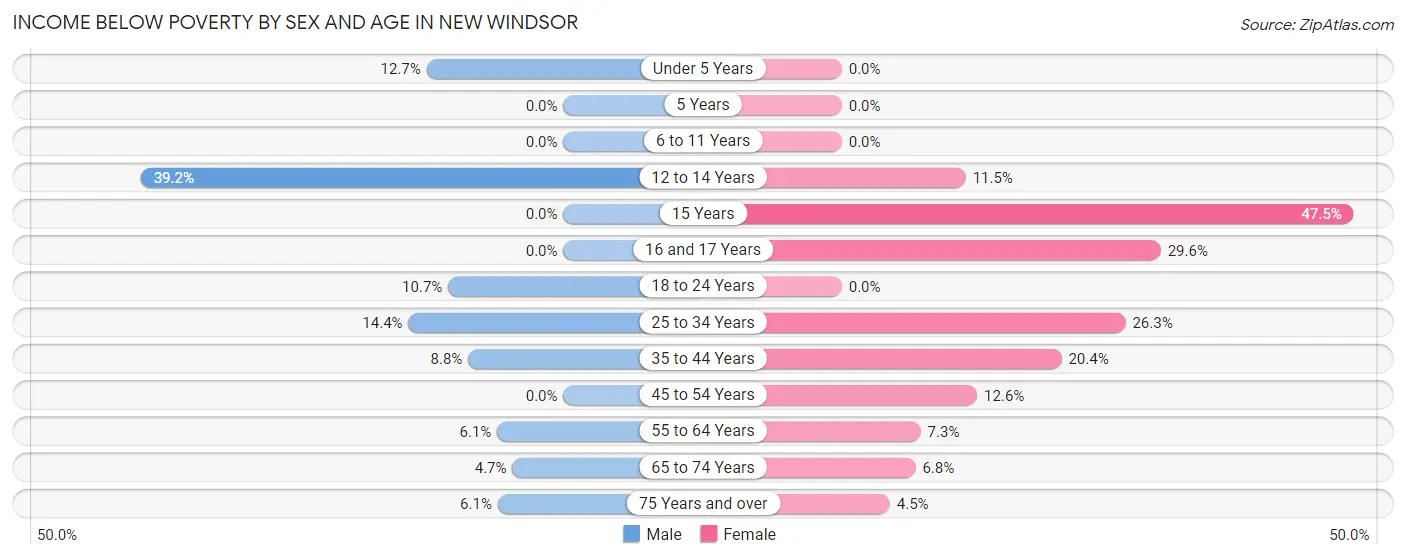
Income Below Poverty by Sex and Age in New Windsor
With 7.6% poverty level for males and 13.0% for females among the residents of New Windsor, 12 to 14 year old males and 15 year old females are the most vulnerable to poverty, with 40 males (39.2%) and 95 females (47.5%) in their respective age groups living below the poverty level.
| Age Bracket | Male | Female |
| Under 5 Years | 17 (12.7%) | 0 (0.0%) |
| 5 Years | 0 (0.0%) | 0 (0.0%) |
| 6 to 11 Years | 0 (0.0%) | 0 (0.0%) |
| 12 to 14 Years | 40 (39.2%) | 13 (11.5%) |
| 15 Years | 0 (0.0%) | 95 (47.5%) |
| 16 and 17 Years | 0 (0.0%) | 37 (29.6%) |
| 18 to 24 Years | 59 (10.7%) | 0 (0.0%) |
| 25 to 34 Years | 90 (14.4%) | 148 (26.3%) |
| 35 to 44 Years | 43 (8.8%) | 124 (20.4%) |
| 45 to 54 Years | 0 (0.0%) | 81 (12.6%) |
| 55 to 64 Years | 42 (6.1%) | 48 (7.3%) |
| 65 to 74 Years | 15 (4.7%) | 32 (6.8%) |
| 75 Years and over | 12 (6.1%) | 17 (4.5%) |
| Total | 318 (7.6%) | 595 (13.0%) |
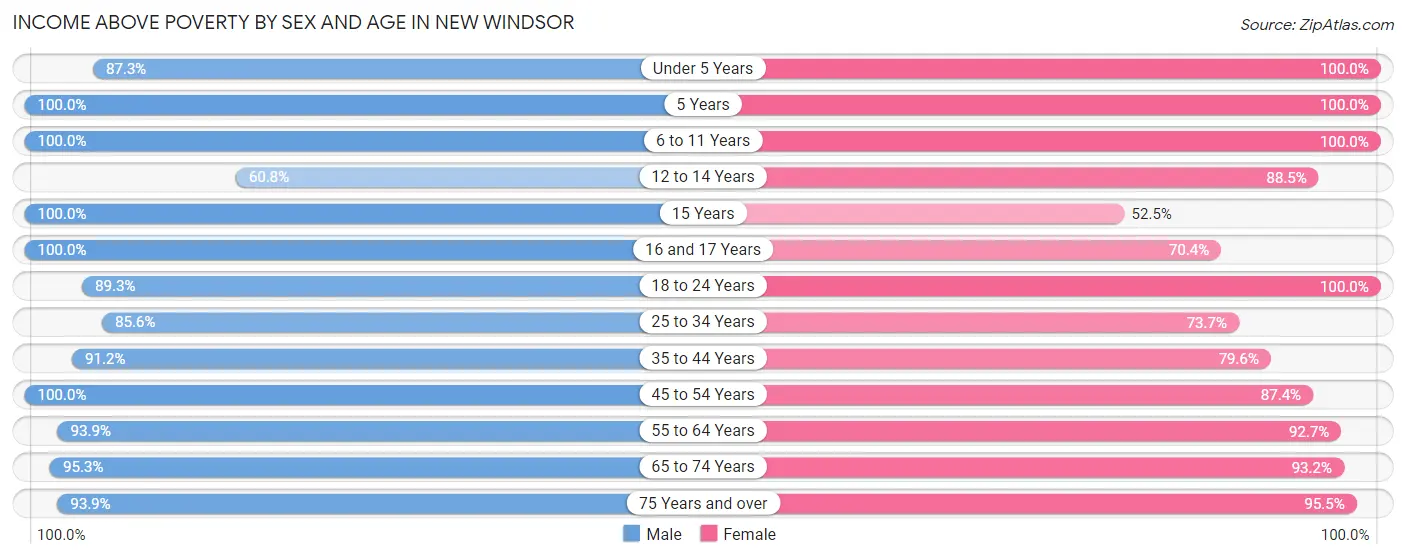
Income Above Poverty by Sex and Age in New Windsor
According to the poverty statistics in New Windsor, males aged 5 years and females aged under 5 years are the age groups that are most secure financially, with 100.0% of males and 100.0% of females in these age groups living above the poverty line.
| Age Bracket | Male | Female |
| Under 5 Years | 117 (87.3%) | 41 (100.0%) |
| 5 Years | 34 (100.0%) | 86 (100.0%) |
| 6 to 11 Years | 361 (100.0%) | 195 (100.0%) |
| 12 to 14 Years | 62 (60.8%) | 100 (88.5%) |
| 15 Years | 24 (100.0%) | 105 (52.5%) |
| 16 and 17 Years | 90 (100.0%) | 88 (70.4%) |
| 18 to 24 Years | 493 (89.3%) | 504 (100.0%) |
| 25 to 34 Years | 536 (85.6%) | 414 (73.7%) |
| 35 to 44 Years | 444 (91.2%) | 484 (79.6%) |
| 45 to 54 Years | 563 (100.0%) | 564 (87.4%) |
| 55 to 64 Years | 642 (93.9%) | 608 (92.7%) |
| 65 to 74 Years | 302 (95.3%) | 436 (93.2%) |
| 75 Years and over | 185 (93.9%) | 364 (95.5%) |
| Total | 3,853 (92.4%) | 3,989 (87.0%) |
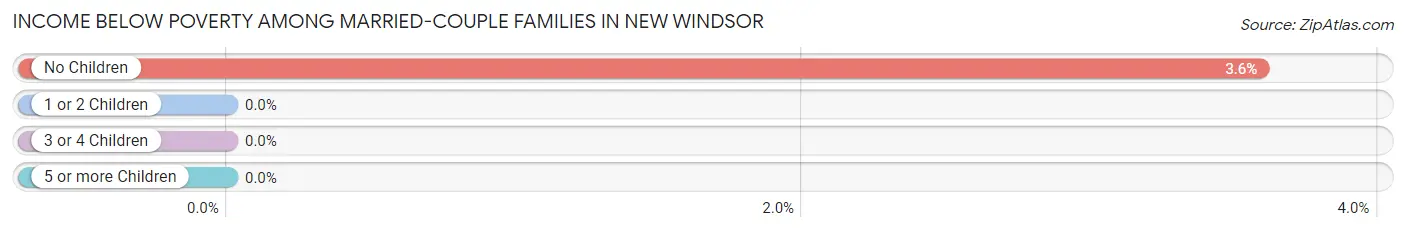
Income Below Poverty Among Married-Couple Families in New Windsor
The poverty statistics for married-couple families in New Windsor show that 2.3% or 34 of the total 1,454 families live below the poverty line. Families with no children have the highest poverty rate of 3.6%, comprising of 34 families. On the other hand, families with 1 or 2 children have the lowest poverty rate of 0.0%, which includes 0 families.
| Children | Above Poverty | Below Poverty |
| No Children | 912 (96.4%) | 34 (3.6%) |
| 1 or 2 Children | 367 (100.0%) | 0 (0.0%) |
| 3 or 4 Children | 141 (100.0%) | 0 (0.0%) |
| 5 or more Children | 0 (0.0%) | 0 (0.0%) |
| Total | 1,420 (97.7%) | 34 (2.3%) |
Income Below Poverty Among Single-Parent Households in New Windsor
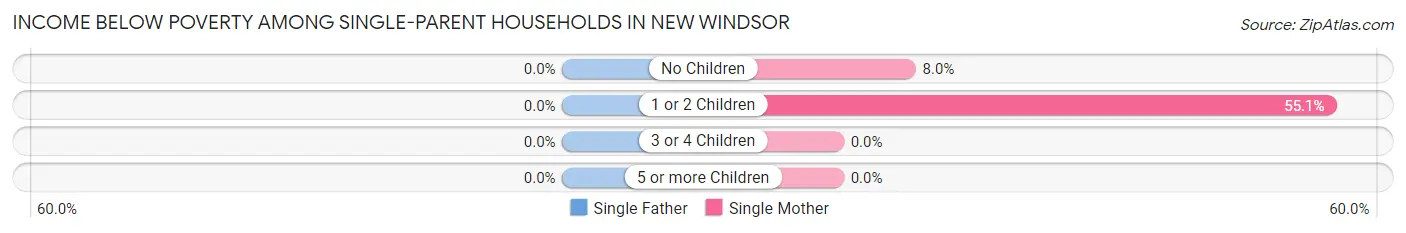
| Children | Single Father | Single Mother |
| No Children | 0 (0.0%) | 23 (8.0%) |
| 1 or 2 Children | 0 (0.0%) | 158 (55.0%) |
| 3 or 4 Children | 0 (0.0%) | 0 (0.0%) |
| 5 or more Children | 0 (0.0%) | 0 (0.0%) |
| Total | 0 (0.0%) | 181 (31.6%) |
Income Below Poverty Among Married-Couple vs Single-Parent Households in New Windsor
The poverty data for New Windsor shows that 34 of the married-couple family households (2.3%) and 181 of the single-parent households (26.6%) are living below the poverty level. Within the married-couple family households, those with no children have the highest poverty rate, with 34 households (3.6%) falling below the poverty line. Among the single-parent households, those with 1 or 2 children have the highest poverty rate, with 158 household (46.6%) living below poverty.
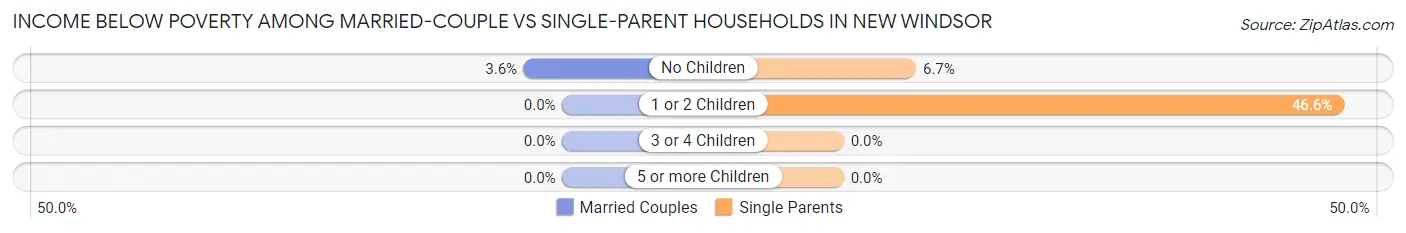
| Children | Married-Couple Families | Single-Parent Households |
| No Children | 34 (3.6%) | 23 (6.7%) |
| 1 or 2 Children | 0 (0.0%) | 158 (46.6%) |
| 3 or 4 Children | 0 (0.0%) | 0 (0.0%) |
| 5 or more Children | 0 (0.0%) | 0 (0.0%) |
| Total | 34 (2.3%) | 181 (26.6%) |
Employment Characteristics in New Windsor
Employment by Class of Employer in New Windsor
Among the 4,281 employed individuals in New Windsor, private company employees (2,635 | 61.6%), not-for-profit organizations (517 | 12.1%), and local government employees (442 | 10.3%) make up the most common classes of employment.
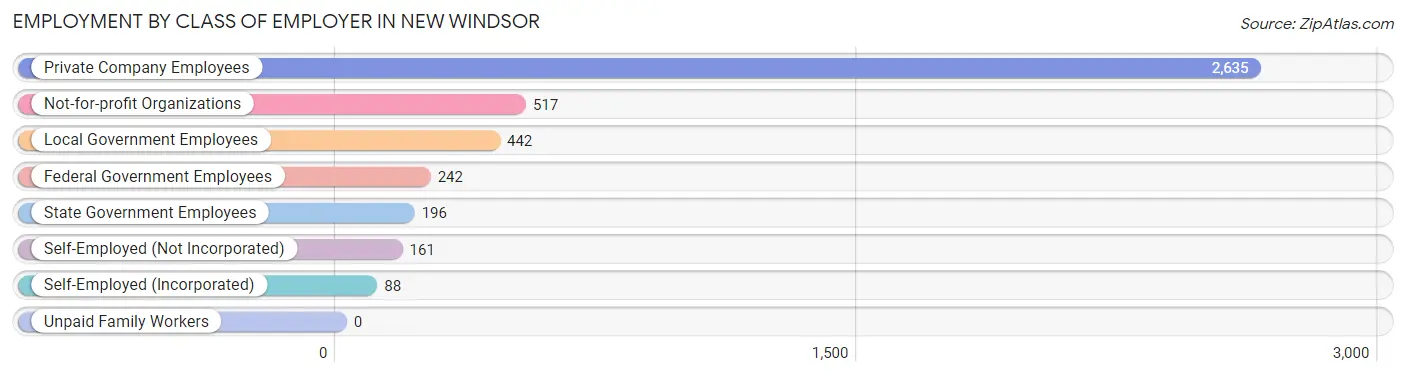
| Employer Class | # Employees | % Employees |
| Private Company Employees | 2,635 | 61.6% |
| Self-Employed (Incorporated) | 88 | 2.1% |
| Self-Employed (Not Incorporated) | 161 | 3.8% |
| Not-for-profit Organizations | 517 | 12.1% |
| Local Government Employees | 442 | 10.3% |
| State Government Employees | 196 | 4.6% |
| Federal Government Employees | 242 | 5.7% |
| Unpaid Family Workers | 0 | 0.0% |
| Total | 4,281 | 100.0% |
Employment Status by Age in New Windsor
According to the labor force statistics for New Windsor, out of the total population over 16 years of age (7,486), 65.0% or 4,866 individuals are in the labor force, with 10.7% or 521 of them unemployed. The age group with the highest labor force participation rate is 35 to 44 years, with 89.4% or 979 individuals in the labor force. Within the labor force, the 20 to 24 years age range has the highest percentage of unemployed individuals, with 46.0% or 275 of them being unemployed.
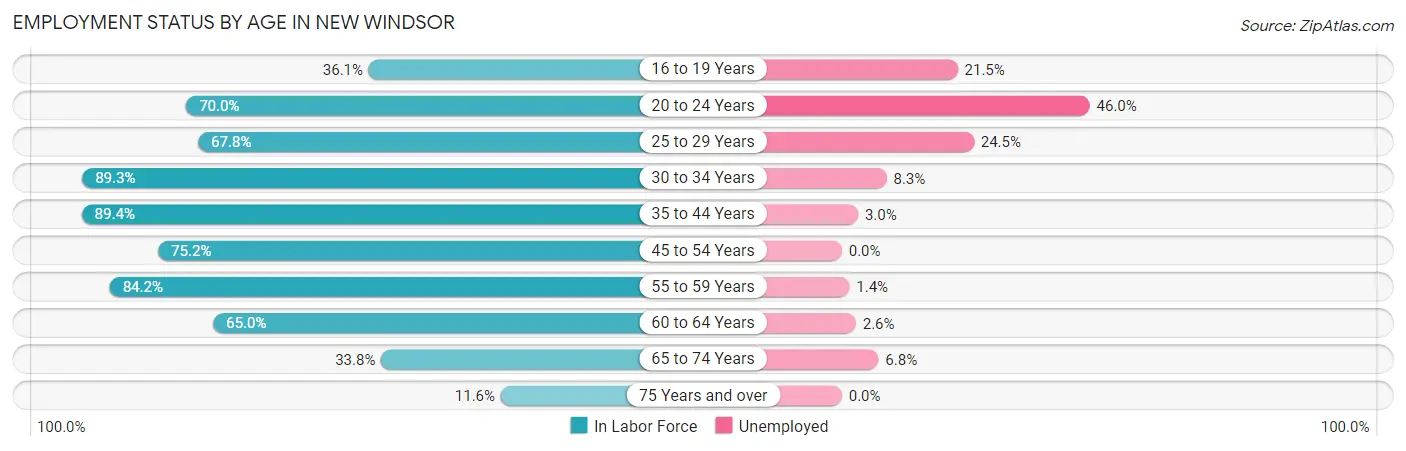
| Age Bracket | In Labor Force | Unemployed |
| 16 to 19 Years | 158 (36.1%) | 34 (21.5%) |
| 20 to 24 Years | 598 (70.0%) | 275 (46.0%) |
| 25 to 29 Years | 433 (67.8%) | 106 (24.5%) |
| 30 to 34 Years | 490 (89.3%) | 41 (8.3%) |
| 35 to 44 Years | 979 (89.4%) | 29 (3.0%) |
| 45 to 54 Years | 908 (75.2%) | 0 (0.0%) |
| 55 to 59 Years | 431 (84.2%) | 6 (1.4%) |
| 60 to 64 Years | 538 (65.0%) | 14 (2.6%) |
| 65 to 74 Years | 265 (33.8%) | 18 (6.8%) |
| 75 Years and over | 67 (11.6%) | 0 (0.0%) |
| Total | 4,866 (65.0%) | 521 (10.7%) |
Employment Status by Educational Attainment in New Windsor
According to labor force statistics for New Windsor, 78.2% of individuals (3,778) out of the total population between 25 and 64 years of age (4,831) are in the labor force, with 5.2% or 196 of them being unemployed. The group with the highest labor force participation rate are those with the educational attainment of college / associate degree, with 83.4% or 1,079 individuals in the labor force. Within the labor force, individuals with high school diploma education have the highest percentage of unemployment, with 8.0% or 96 of them being unemployed.
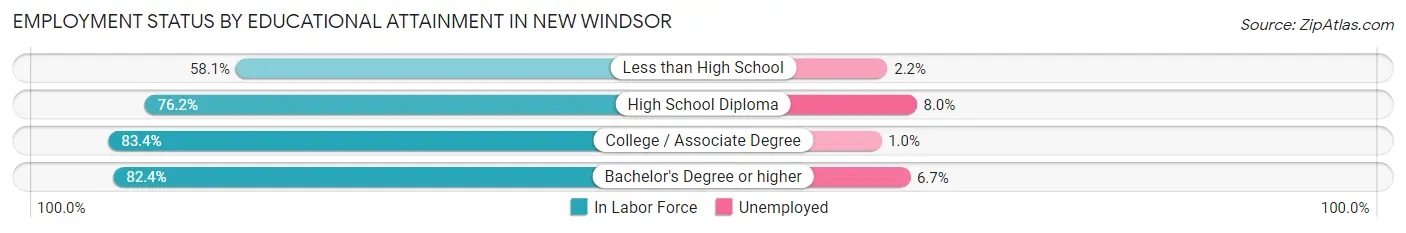
| Educational Attainment | In Labor Force | Unemployed |
| Less than High School | 279 (58.1%) | 11 (2.2%) |
| High School Diploma | 1,195 (76.2%) | 125 (8.0%) |
| College / Associate Degree | 1,079 (83.4%) | 13 (1.0%) |
| Bachelor's Degree or higher | 1,227 (82.4%) | 100 (6.7%) |
| Total | 3,778 (78.2%) | 251 (5.2%) |
Employment Occupations by Sex in New Windsor
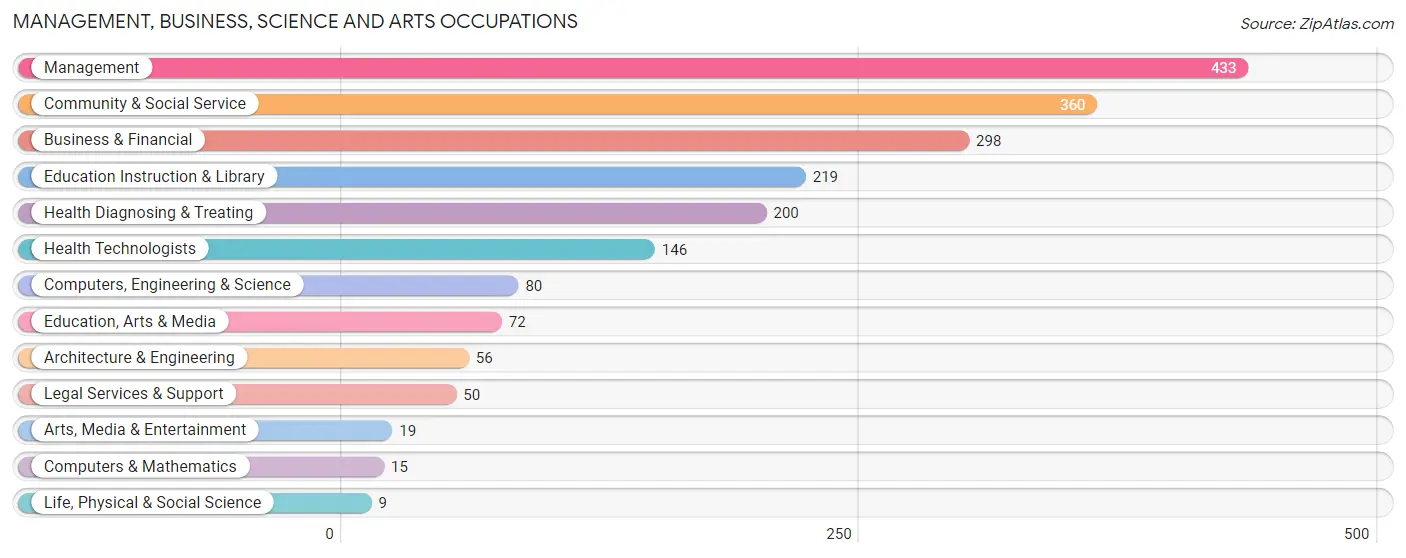
Management, Business, Science and Arts Occupations
The most common Management, Business, Science and Arts occupations in New Windsor are Management (433 | 10.1%), Community & Social Service (360 | 8.4%), Business & Financial (298 | 6.9%), Education Instruction & Library (219 | 5.1%), and Health Diagnosing & Treating (200 | 4.6%).
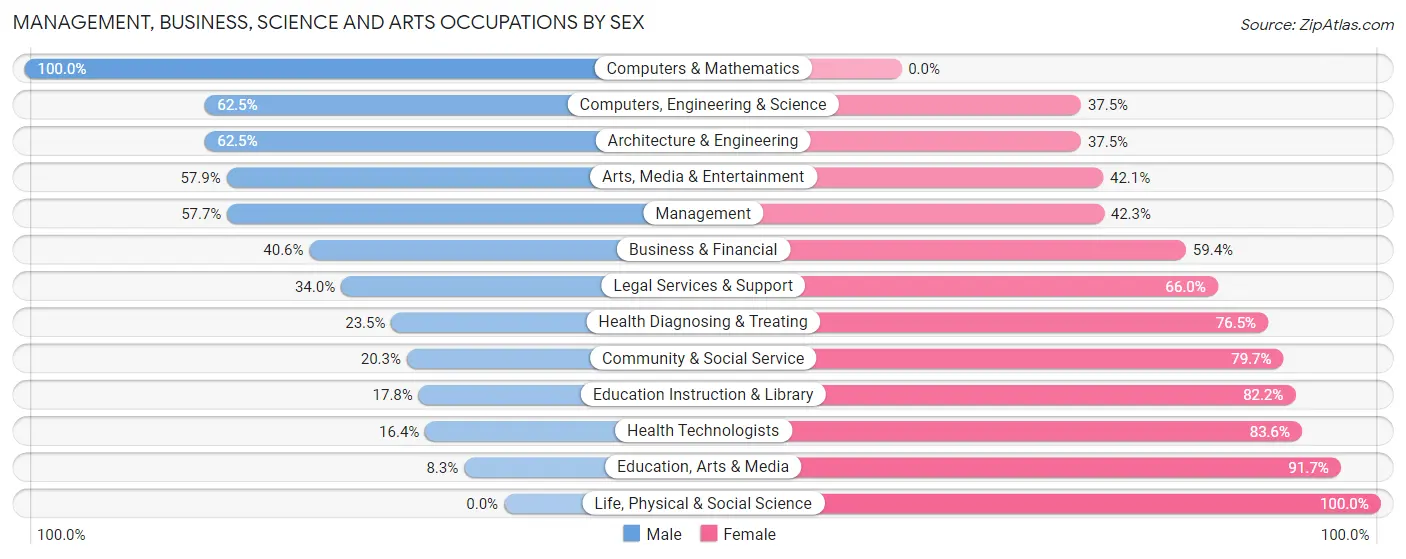
Management, Business, Science and Arts Occupations by Sex
Within the Management, Business, Science and Arts occupations in New Windsor, the most male-oriented occupations are Computers & Mathematics (100.0%), Computers, Engineering & Science (62.5%), and Architecture & Engineering (62.5%), while the most female-oriented occupations are Life, Physical & Social Science (100.0%), Education, Arts & Media (91.7%), and Health Technologists (83.6%).
| Occupation | Male | Female |
| Management | 250 (57.7%) | 183 (42.3%) |
| Business & Financial | 121 (40.6%) | 177 (59.4%) |
| Computers, Engineering & Science | 50 (62.5%) | 30 (37.5%) |
| Computers & Mathematics | 15 (100.0%) | 0 (0.0%) |
| Architecture & Engineering | 35 (62.5%) | 21 (37.5%) |
| Life, Physical & Social Science | 0 (0.0%) | 9 (100.0%) |
| Community & Social Service | 73 (20.3%) | 287 (79.7%) |
| Education, Arts & Media | 6 (8.3%) | 66 (91.7%) |
| Legal Services & Support | 17 (34.0%) | 33 (66.0%) |
| Education Instruction & Library | 39 (17.8%) | 180 (82.2%) |
| Arts, Media & Entertainment | 11 (57.9%) | 8 (42.1%) |
| Health Diagnosing & Treating | 47 (23.5%) | 153 (76.5%) |
| Health Technologists | 24 (16.4%) | 122 (83.6%) |
| Total (Category) | 541 (39.5%) | 830 (60.5%) |
| Total (Overall) | 2,143 (49.8%) | 2,159 (50.2%) |
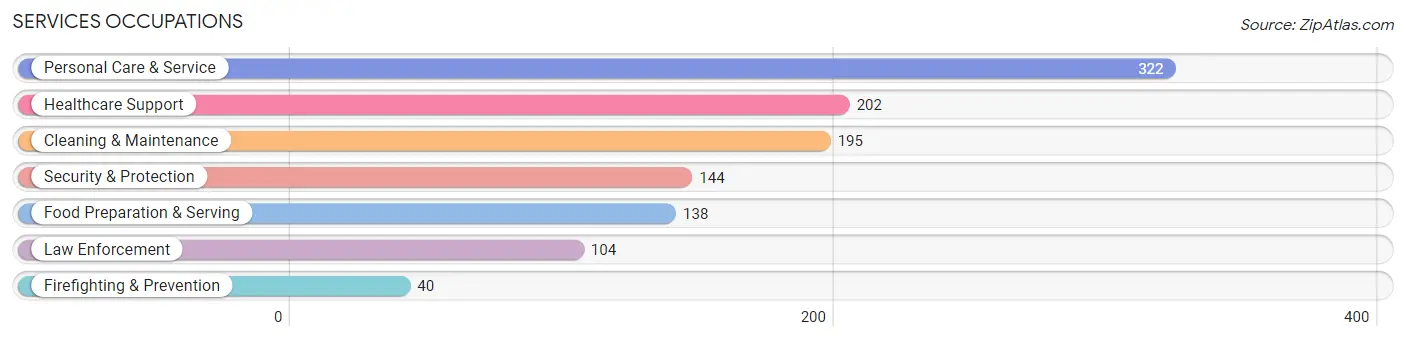
Services Occupations
The most common Services occupations in New Windsor are Personal Care & Service (322 | 7.5%), Healthcare Support (202 | 4.7%), Cleaning & Maintenance (195 | 4.5%), Security & Protection (144 | 3.4%), and Food Preparation & Serving (138 | 3.2%).
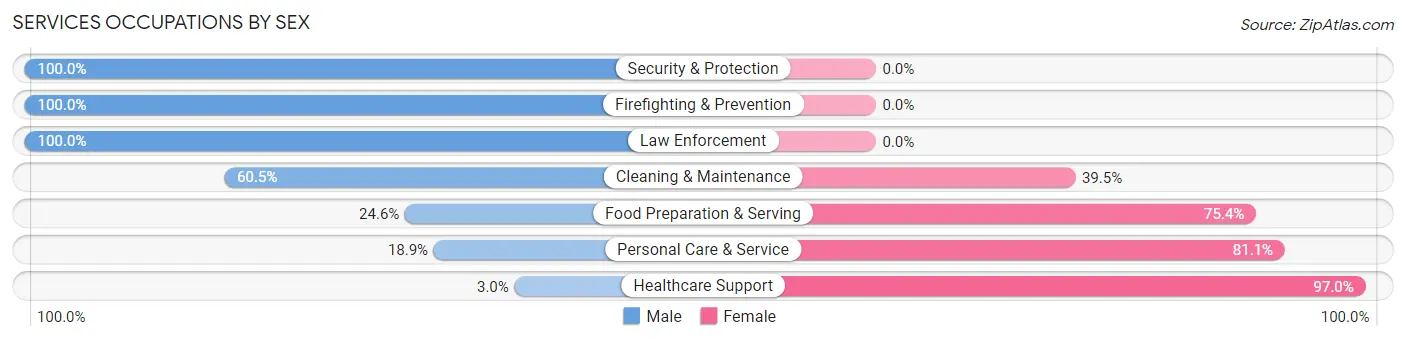
Services Occupations by Sex
Within the Services occupations in New Windsor, the most male-oriented occupations are Security & Protection (100.0%), Firefighting & Prevention (100.0%), and Law Enforcement (100.0%), while the most female-oriented occupations are Healthcare Support (97.0%), Personal Care & Service (81.1%), and Food Preparation & Serving (75.4%).
| Occupation | Male | Female |
| Healthcare Support | 6 (3.0%) | 196 (97.0%) |
| Security & Protection | 144 (100.0%) | 0 (0.0%) |
| Firefighting & Prevention | 40 (100.0%) | 0 (0.0%) |
| Law Enforcement | 104 (100.0%) | 0 (0.0%) |
| Food Preparation & Serving | 34 (24.6%) | 104 (75.4%) |
| Cleaning & Maintenance | 118 (60.5%) | 77 (39.5%) |
| Personal Care & Service | 61 (18.9%) | 261 (81.1%) |
| Total (Category) | 363 (36.3%) | 638 (63.7%) |
| Total (Overall) | 2,143 (49.8%) | 2,159 (50.2%) |
Sales and Office Occupations
The most common Sales and Office occupations in New Windsor are Office & Administration (576 | 13.4%), and Sales & Related (472 | 11.0%).

Sales and Office Occupations by Sex

| Occupation | Male | Female |
| Sales & Related | 338 (71.6%) | 134 (28.4%) |
| Office & Administration | 86 (14.9%) | 490 (85.1%) |
| Total (Category) | 424 (40.5%) | 624 (59.5%) |
| Total (Overall) | 2,143 (49.8%) | 2,159 (50.2%) |
Natural Resources, Construction and Maintenance Occupations
The most common Natural Resources, Construction and Maintenance occupations in New Windsor are Installation, Maintenance & Repair (239 | 5.6%), and Construction & Extraction (149 | 3.5%).
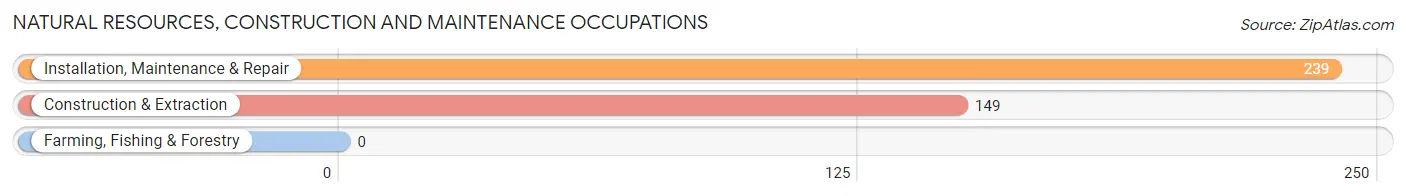
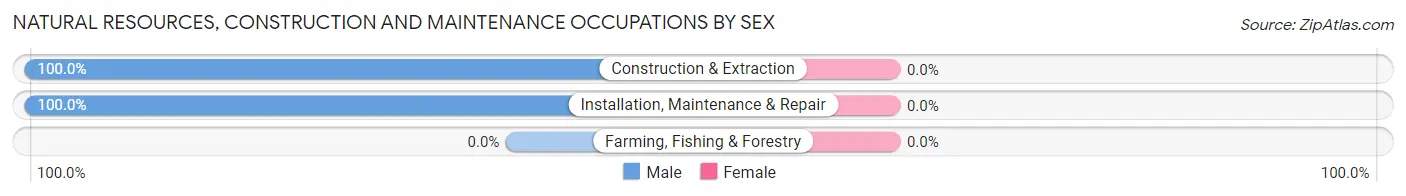
Natural Resources, Construction and Maintenance Occupations by Sex
| Occupation | Male | Female |
| Farming, Fishing & Forestry | 0 (0.0%) | 0 (0.0%) |
| Construction & Extraction | 149 (100.0%) | 0 (0.0%) |
| Installation, Maintenance & Repair | 239 (100.0%) | 0 (0.0%) |
| Total (Category) | 388 (100.0%) | 0 (0.0%) |
| Total (Overall) | 2,143 (49.8%) | 2,159 (50.2%) |
Production, Transportation and Moving Occupations
The most common Production, Transportation and Moving occupations in New Windsor are Material Moving (209 | 4.9%), Transportation (175 | 4.1%), and Production (110 | 2.6%).
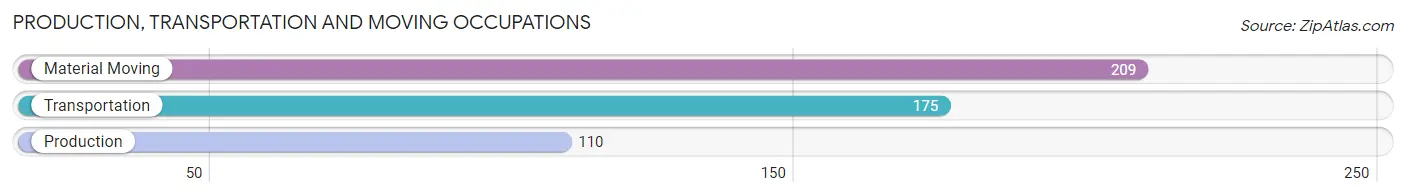
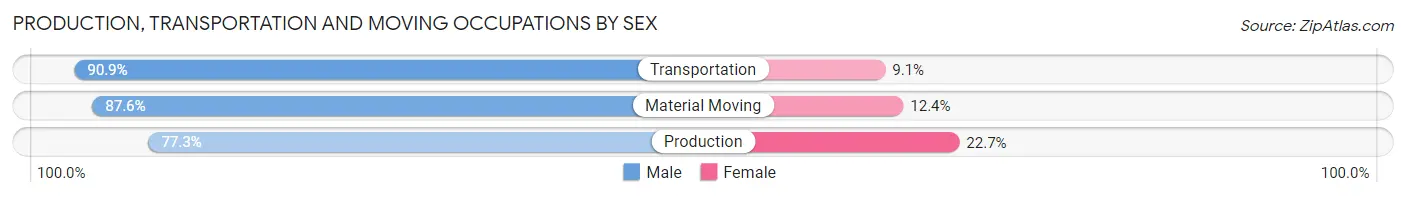
Production, Transportation and Moving Occupations by Sex
| Occupation | Male | Female |
| Production | 85 (77.3%) | 25 (22.7%) |
| Transportation | 159 (90.9%) | 16 (9.1%) |
| Material Moving | 183 (87.6%) | 26 (12.4%) |
| Total (Category) | 427 (86.4%) | 67 (13.6%) |
| Total (Overall) | 2,143 (49.8%) | 2,159 (50.2%) |
Employment Industries by Sex in New Windsor
Employment Industries in New Windsor
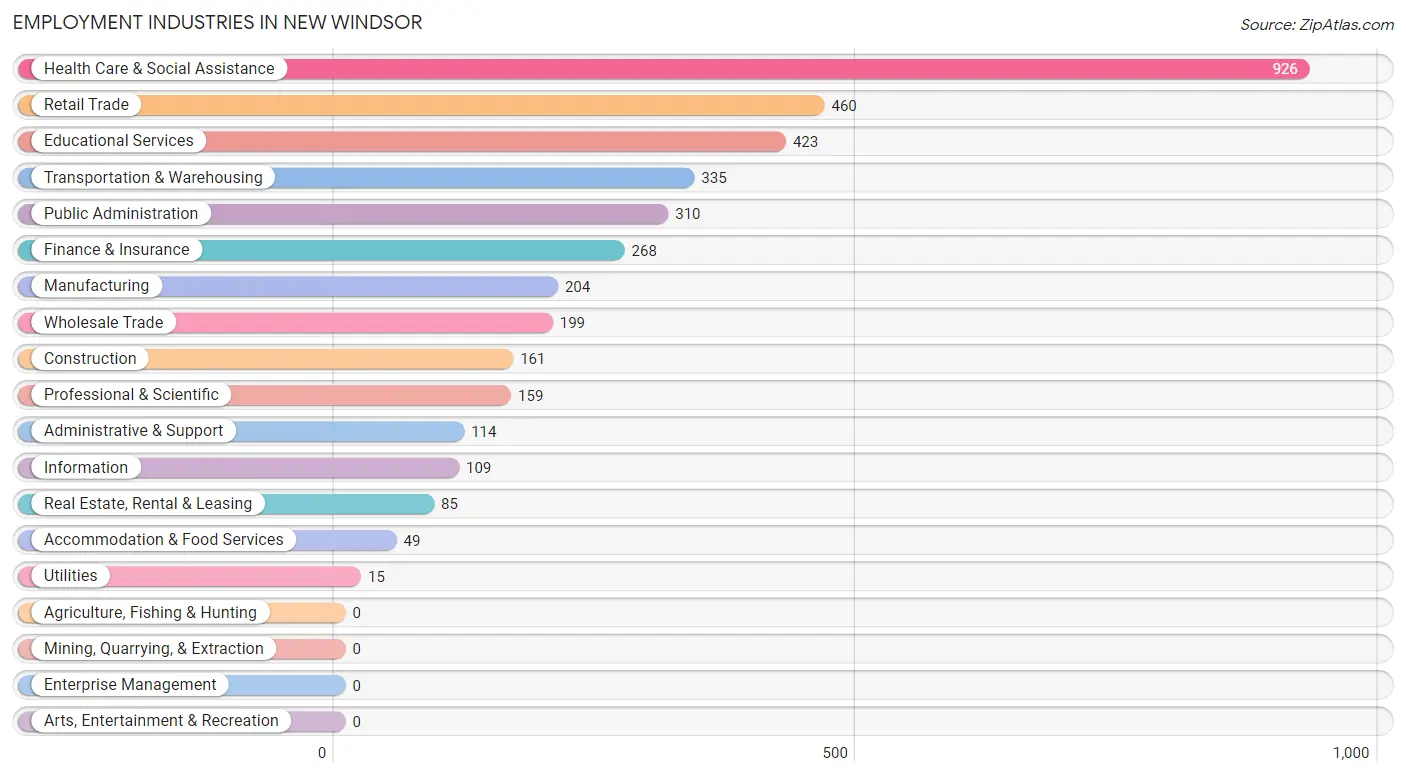
The major employment industries in New Windsor include Health Care & Social Assistance (926 | 21.5%), Retail Trade (460 | 10.7%), Educational Services (423 | 9.8%), Transportation & Warehousing (335 | 7.8%), and Public Administration (310 | 7.2%).
Employment Industries by Sex in New Windsor
The New Windsor industries that see more men than women are Construction (92.5%), Wholesale Trade (89.4%), and Real Estate, Rental & Leasing (76.5%), whereas the industries that tend to have a higher number of women are Utilities (100.0%), Health Care & Social Assistance (80.6%), and Educational Services (74.7%).
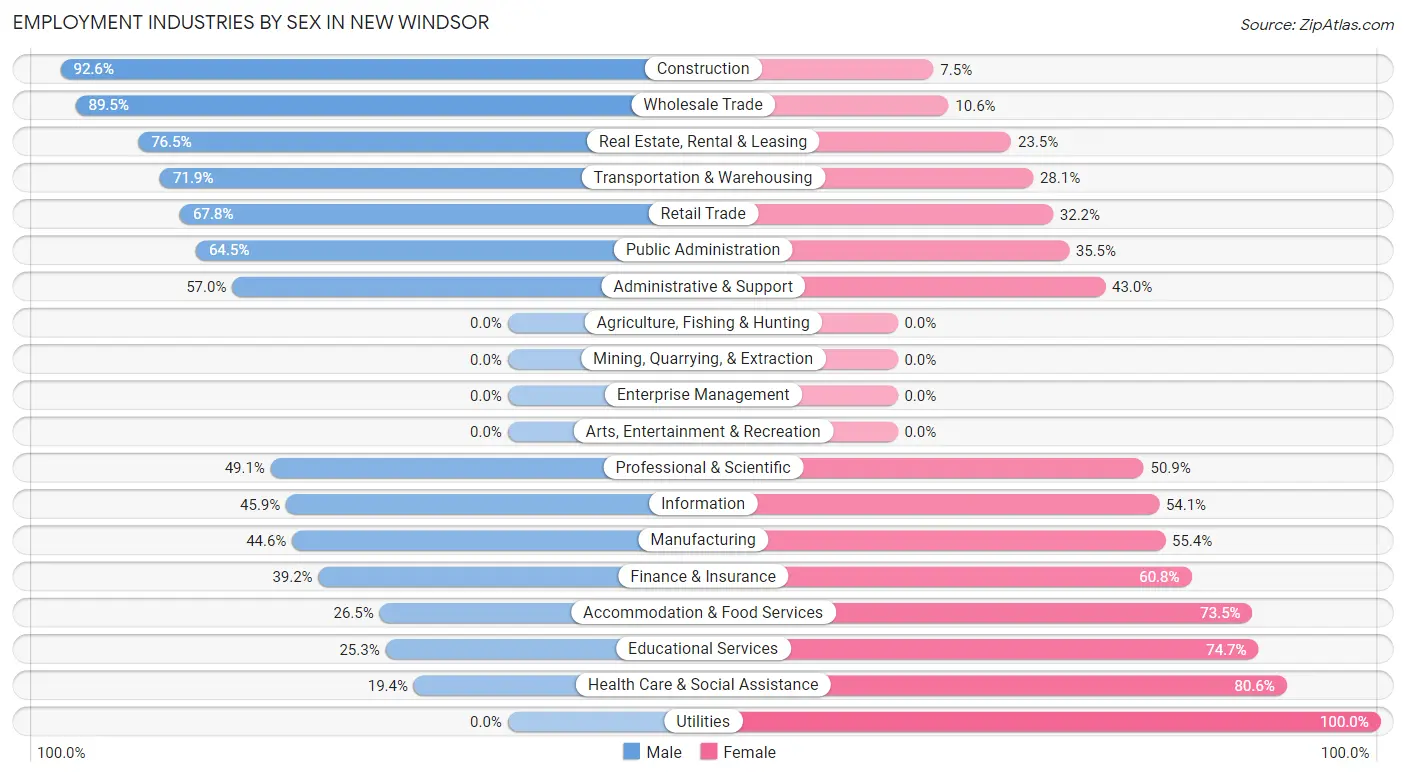
| Industry | Male | Female |
| Agriculture, Fishing & Hunting | 0 (0.0%) | 0 (0.0%) |
| Mining, Quarrying, & Extraction | 0 (0.0%) | 0 (0.0%) |
| Construction | 149 (92.5%) | 12 (7.4%) |
| Manufacturing | 91 (44.6%) | 113 (55.4%) |
| Wholesale Trade | 178 (89.4%) | 21 (10.5%) |
| Retail Trade | 312 (67.8%) | 148 (32.2%) |
| Transportation & Warehousing | 241 (71.9%) | 94 (28.1%) |
| Utilities | 0 (0.0%) | 15 (100.0%) |
| Information | 50 (45.9%) | 59 (54.1%) |
| Finance & Insurance | 105 (39.2%) | 163 (60.8%) |
| Real Estate, Rental & Leasing | 65 (76.5%) | 20 (23.5%) |
| Professional & Scientific | 78 (49.1%) | 81 (50.9%) |
| Enterprise Management | 0 (0.0%) | 0 (0.0%) |
| Administrative & Support | 65 (57.0%) | 49 (43.0%) |
| Educational Services | 107 (25.3%) | 316 (74.7%) |
| Health Care & Social Assistance | 180 (19.4%) | 746 (80.6%) |
| Arts, Entertainment & Recreation | 0 (0.0%) | 0 (0.0%) |
| Accommodation & Food Services | 13 (26.5%) | 36 (73.5%) |
| Public Administration | 200 (64.5%) | 110 (35.5%) |
| Total | 2,143 (49.8%) | 2,159 (50.2%) |
Education in New Windsor
School Enrollment in New Windsor
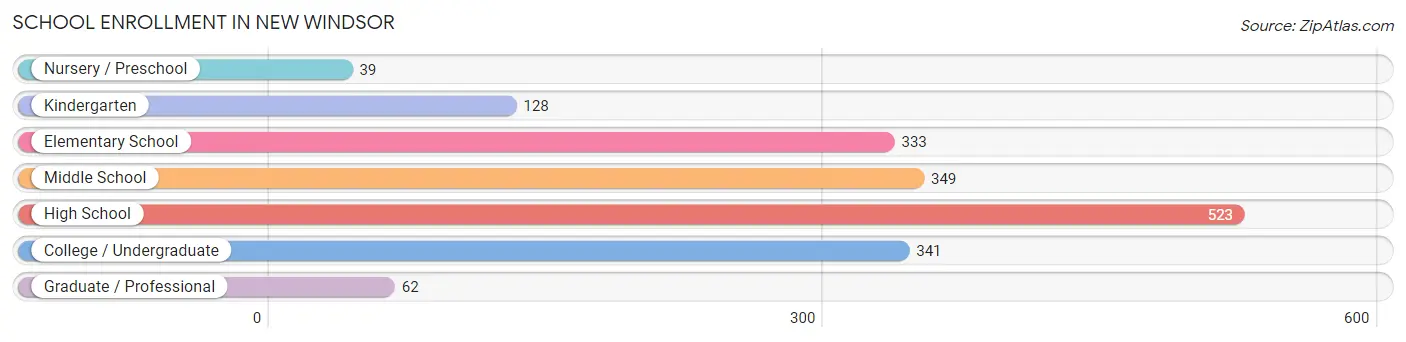
The most common levels of schooling among the 1,775 students in New Windsor are high school (523 | 29.5%), middle school (349 | 19.7%), and college / undergraduate (341 | 19.2%).
| School Level | # Students | % Students |
| Nursery / Preschool | 39 | 2.2% |
| Kindergarten | 128 | 7.2% |
| Elementary School | 333 | 18.8% |
| Middle School | 349 | 19.7% |
| High School | 523 | 29.5% |
| College / Undergraduate | 341 | 19.2% |
| Graduate / Professional | 62 | 3.5% |
| Total | 1,775 | 100.0% |
School Enrollment by Age by Funding Source in New Windsor
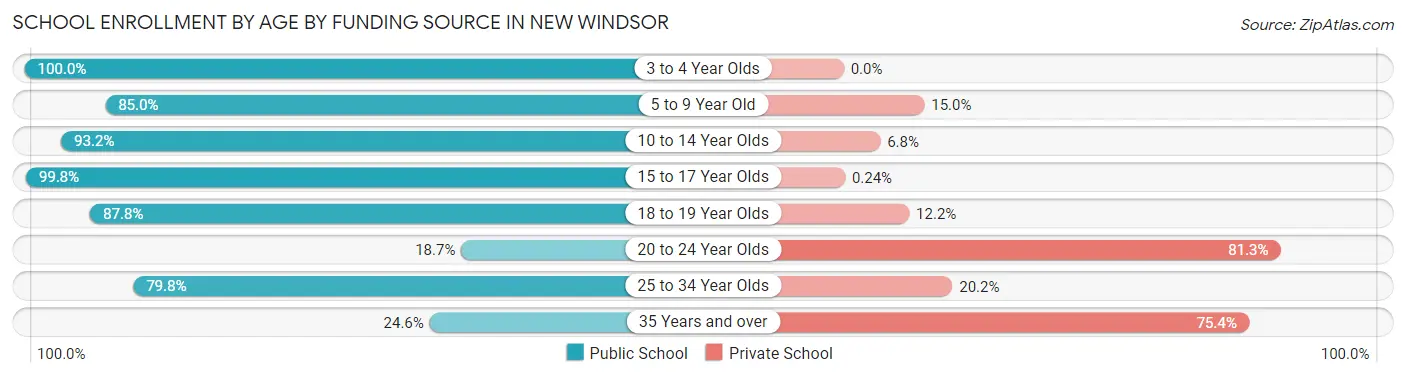
Out of a total of 1,775 students who are enrolled in schools in New Windsor, 366 (20.6%) attend a private institution, while the remaining 1,409 (79.4%) are enrolled in public schools. The age group of 20 to 24 year olds has the highest likelihood of being enrolled in private schools, with 196 (81.3% in the age bracket) enrolled. Conversely, the age group of 3 to 4 year olds has the lowest likelihood of being enrolled in a private school, with 9 (100.0% in the age bracket) attending a public institution.
| Age Bracket | Public School | Private School |
| 3 to 4 Year Olds | 9 (100.0%) | 0 (0.0%) |
| 5 to 9 Year Old | 396 (85.0%) | 70 (15.0%) |
| 10 to 14 Year Olds | 383 (93.2%) | 28 (6.8%) |
| 15 to 17 Year Olds | 424 (99.8%) | 1 (0.2%) |
| 18 to 19 Year Olds | 72 (87.8%) | 10 (12.2%) |
| 20 to 24 Year Olds | 45 (18.7%) | 196 (81.3%) |
| 25 to 34 Year Olds | 67 (79.8%) | 17 (20.2%) |
| 35 Years and over | 14 (24.6%) | 43 (75.4%) |
| Total | 1,409 (79.4%) | 366 (20.6%) |
Educational Attainment by Field of Study in New Windsor
Education (394 | 18.2%), business (241 | 11.1%), social sciences (239 | 11.0%), arts & humanities (213 | 9.8%), and science & technology (185 | 8.6%) are the most common fields of study among 2,164 individuals in New Windsor who have obtained a bachelor's degree or higher.
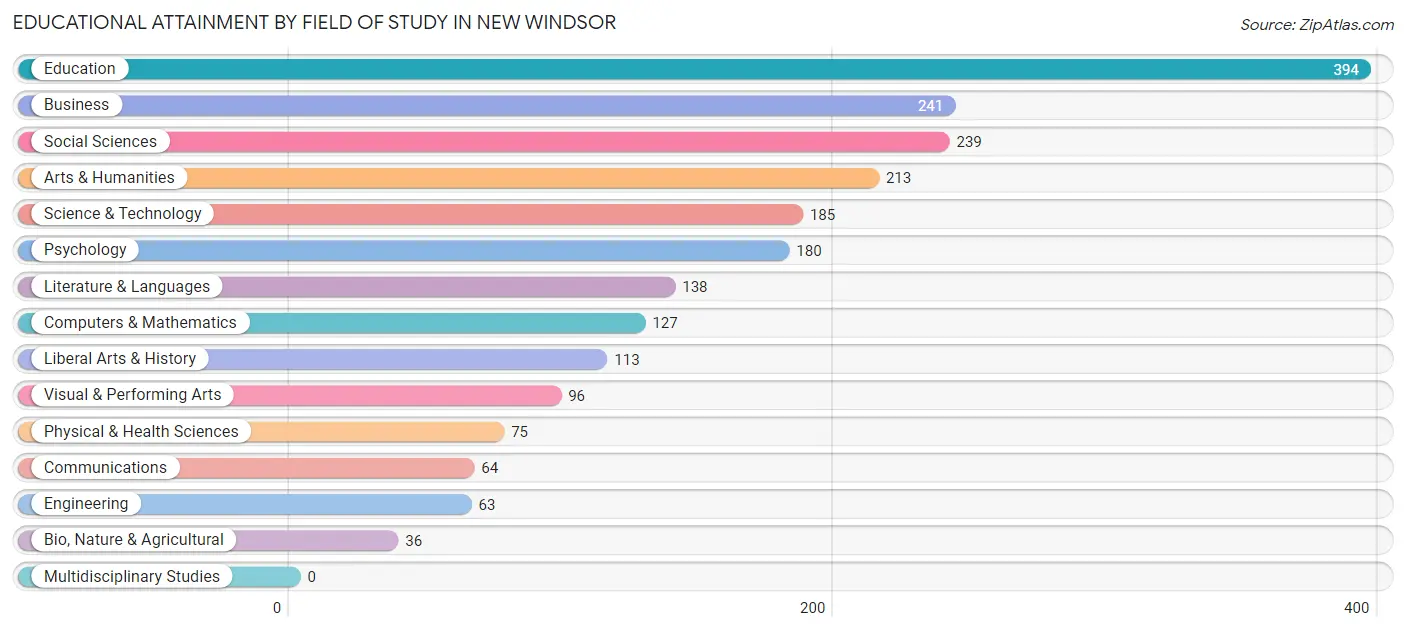
| Field of Study | # Graduates | % Graduates |
| Computers & Mathematics | 127 | 5.9% |
| Bio, Nature & Agricultural | 36 | 1.7% |
| Physical & Health Sciences | 75 | 3.5% |
| Psychology | 180 | 8.3% |
| Social Sciences | 239 | 11.0% |
| Engineering | 63 | 2.9% |
| Multidisciplinary Studies | 0 | 0.0% |
| Science & Technology | 185 | 8.6% |
| Business | 241 | 11.1% |
| Education | 394 | 18.2% |
| Literature & Languages | 138 | 6.4% |
| Liberal Arts & History | 113 | 5.2% |
| Visual & Performing Arts | 96 | 4.4% |
| Communications | 64 | 3.0% |
| Arts & Humanities | 213 | 9.8% |
| Total | 2,164 | 100.0% |
Transportation & Commute in New Windsor
Vehicle Availability by Sex in New Windsor
The most prevalent vehicle ownership categories in New Windsor are males with 2 vehicles (883, accounting for 41.9%) and females with 2 vehicles (859, making up 41.0%).
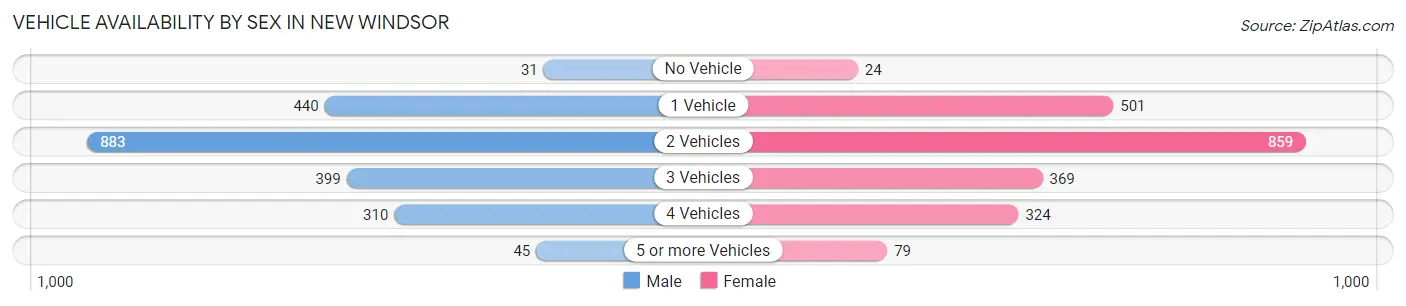
| Vehicles Available | Male | Female |
| No Vehicle | 31 (1.5%) | 24 (1.1%) |
| 1 Vehicle | 440 (20.9%) | 501 (23.2%) |
| 2 Vehicles | 883 (41.9%) | 859 (39.8%) |
| 3 Vehicles | 399 (18.9%) | 369 (17.1%) |
| 4 Vehicles | 310 (14.7%) | 324 (15.0%) |
| 5 or more Vehicles | 45 (2.1%) | 79 (3.7%) |
| Total | 2,108 (100.0%) | 2,156 (100.0%) |
Commute Time in New Windsor
The most frequently occuring commute durations in New Windsor are 15 to 19 minutes (599 commuters, 15.3%), 20 to 24 minutes (539 commuters, 13.8%), and 30 to 34 minutes (512 commuters, 13.1%).
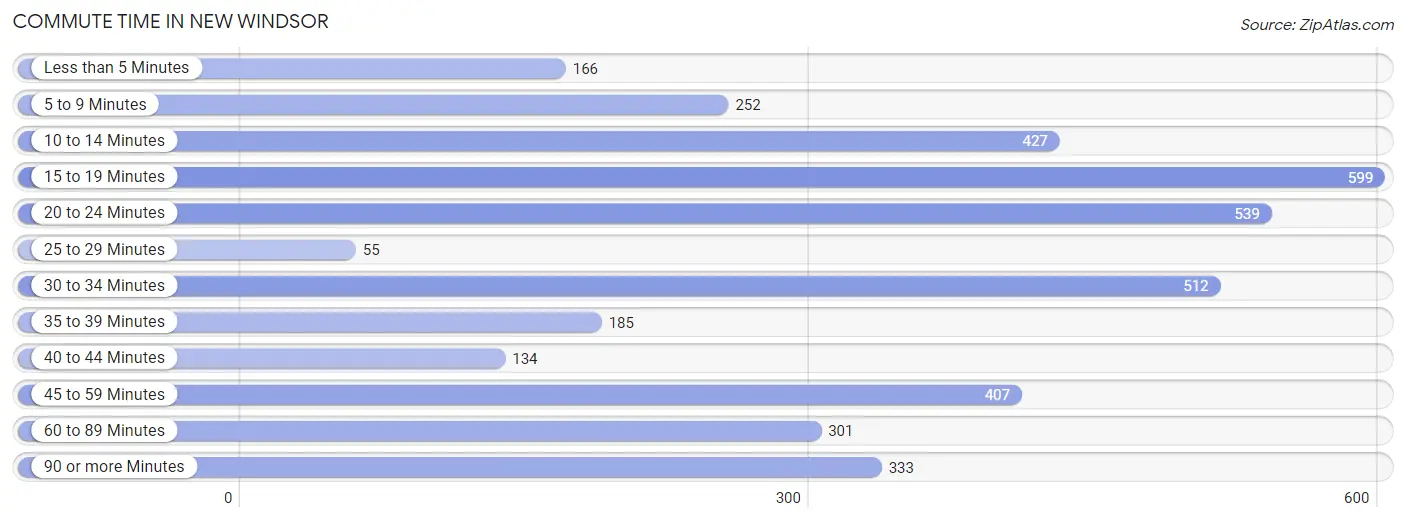
| Commute Time | # Commuters | % Commuters |
| Less than 5 Minutes | 166 | 4.3% |
| 5 to 9 Minutes | 252 | 6.5% |
| 10 to 14 Minutes | 427 | 10.9% |
| 15 to 19 Minutes | 599 | 15.3% |
| 20 to 24 Minutes | 539 | 13.8% |
| 25 to 29 Minutes | 55 | 1.4% |
| 30 to 34 Minutes | 512 | 13.1% |
| 35 to 39 Minutes | 185 | 4.7% |
| 40 to 44 Minutes | 134 | 3.4% |
| 45 to 59 Minutes | 407 | 10.4% |
| 60 to 89 Minutes | 301 | 7.7% |
| 90 or more Minutes | 333 | 8.5% |
Commute Time by Sex in New Windsor
The most common commute times in New Windsor are 30 to 34 minutes (322 commuters, 16.3%) for males and 15 to 19 minutes (382 commuters, 19.7%) for females.
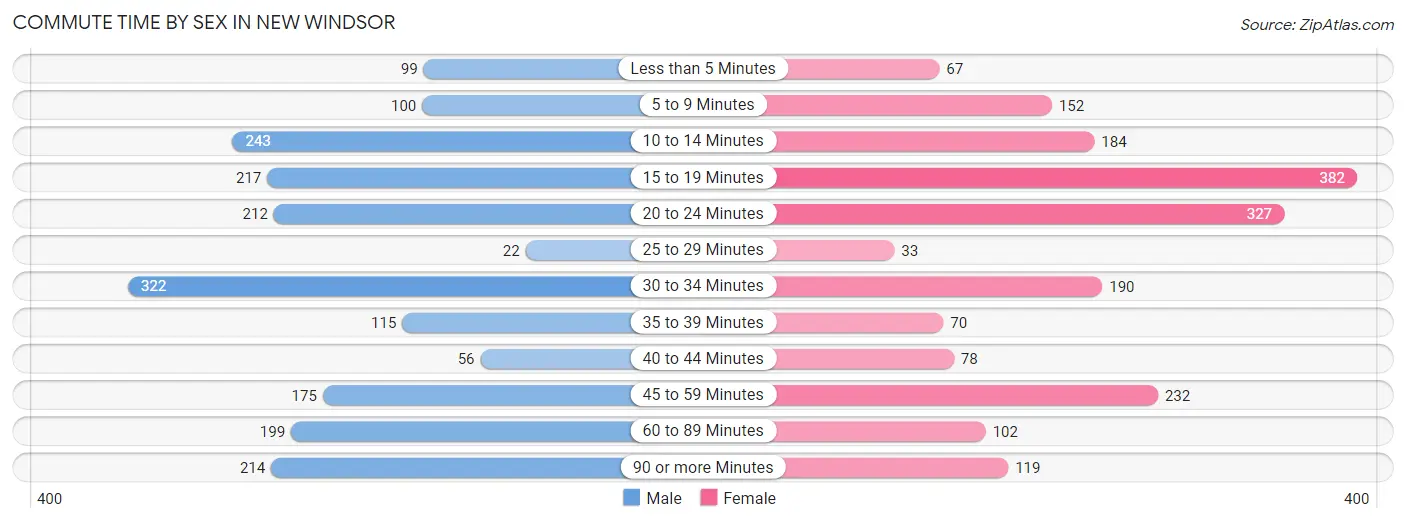
| Commute Time | Male | Female |
| Less than 5 Minutes | 99 (5.0%) | 67 (3.5%) |
| 5 to 9 Minutes | 100 (5.1%) | 152 (7.9%) |
| 10 to 14 Minutes | 243 (12.3%) | 184 (9.5%) |
| 15 to 19 Minutes | 217 (11.0%) | 382 (19.7%) |
| 20 to 24 Minutes | 212 (10.7%) | 327 (16.9%) |
| 25 to 29 Minutes | 22 (1.1%) | 33 (1.7%) |
| 30 to 34 Minutes | 322 (16.3%) | 190 (9.8%) |
| 35 to 39 Minutes | 115 (5.8%) | 70 (3.6%) |
| 40 to 44 Minutes | 56 (2.8%) | 78 (4.0%) |
| 45 to 59 Minutes | 175 (8.9%) | 232 (12.0%) |
| 60 to 89 Minutes | 199 (10.1%) | 102 (5.3%) |
| 90 or more Minutes | 214 (10.8%) | 119 (6.1%) |
Time of Departure to Work by Sex in New Windsor
The most frequent times of departure to work in New Windsor are 6:00 AM to 6:29 AM (316, 16.0%) for males and 7:30 AM to 7:59 AM (397, 20.5%) for females.
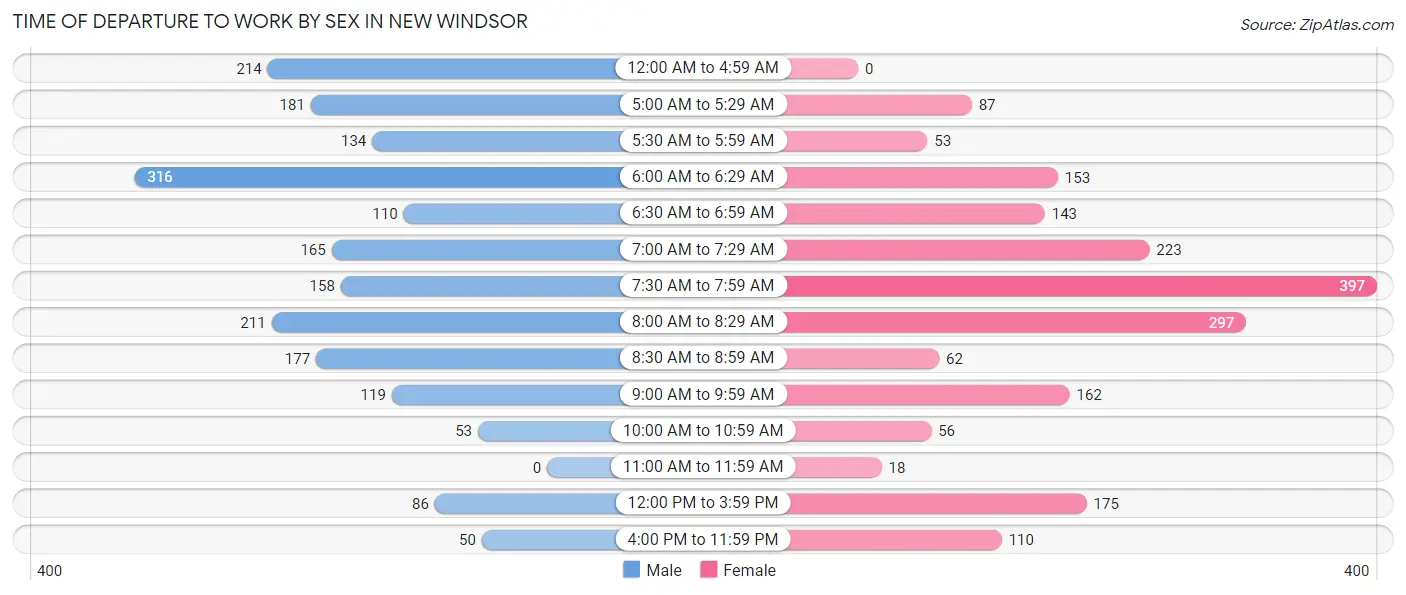
| Time of Departure | Male | Female |
| 12:00 AM to 4:59 AM | 214 (10.8%) | 0 (0.0%) |
| 5:00 AM to 5:29 AM | 181 (9.2%) | 87 (4.5%) |
| 5:30 AM to 5:59 AM | 134 (6.8%) | 53 (2.7%) |
| 6:00 AM to 6:29 AM | 316 (16.0%) | 153 (7.9%) |
| 6:30 AM to 6:59 AM | 110 (5.6%) | 143 (7.4%) |
| 7:00 AM to 7:29 AM | 165 (8.4%) | 223 (11.5%) |
| 7:30 AM to 7:59 AM | 158 (8.0%) | 397 (20.5%) |
| 8:00 AM to 8:29 AM | 211 (10.7%) | 297 (15.3%) |
| 8:30 AM to 8:59 AM | 177 (9.0%) | 62 (3.2%) |
| 9:00 AM to 9:59 AM | 119 (6.0%) | 162 (8.4%) |
| 10:00 AM to 10:59 AM | 53 (2.7%) | 56 (2.9%) |
| 11:00 AM to 11:59 AM | 0 (0.0%) | 18 (0.9%) |
| 12:00 PM to 3:59 PM | 86 (4.4%) | 175 (9.0%) |
| 4:00 PM to 11:59 PM | 50 (2.5%) | 110 (5.7%) |
| Total | 1,974 (100.0%) | 1,936 (100.0%) |
Housing Occupancy in New Windsor
Occupancy by Ownership in New Windsor
Of the total 3,366 dwellings in New Windsor, owner-occupied units account for 2,412 (71.7%), while renter-occupied units make up 954 (28.3%).
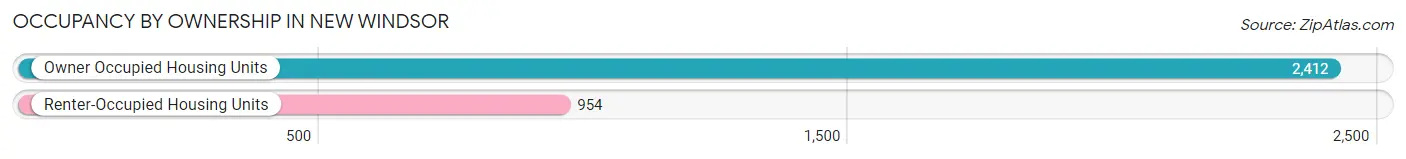
| Occupancy | # Housing Units | % Housing Units |
| Owner Occupied Housing Units | 2,412 | 71.7% |
| Renter-Occupied Housing Units | 954 | 28.3% |
| Total Occupied Housing Units | 3,366 | 100.0% |
Occupancy by Household Size in New Windsor
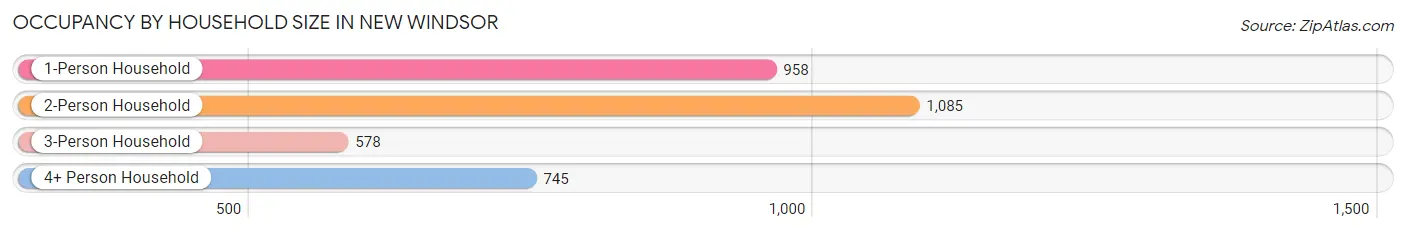
| Household Size | # Housing Units | % Housing Units |
| 1-Person Household | 958 | 28.5% |
| 2-Person Household | 1,085 | 32.2% |
| 3-Person Household | 578 | 17.2% |
| 4+ Person Household | 745 | 22.1% |
| Total Housing Units | 3,366 | 100.0% |
Occupancy by Ownership by Household Size in New Windsor
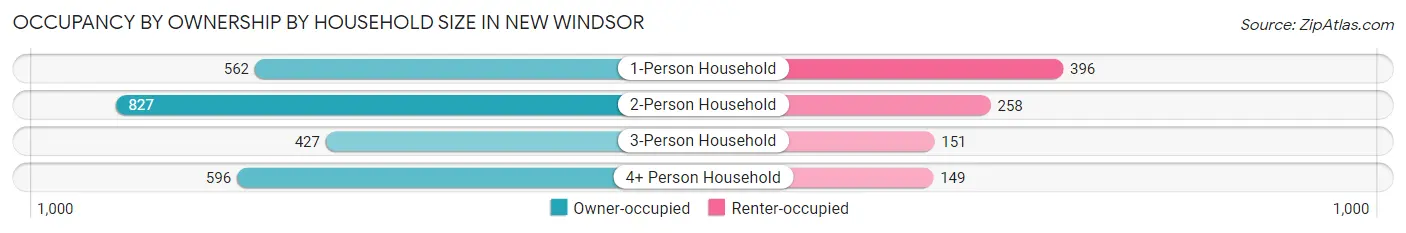
| Household Size | Owner-occupied | Renter-occupied |
| 1-Person Household | 562 (58.7%) | 396 (41.3%) |
| 2-Person Household | 827 (76.2%) | 258 (23.8%) |
| 3-Person Household | 427 (73.9%) | 151 (26.1%) |
| 4+ Person Household | 596 (80.0%) | 149 (20.0%) |
| Total Housing Units | 2,412 (71.7%) | 954 (28.3%) |
Occupancy by Educational Attainment in New Windsor
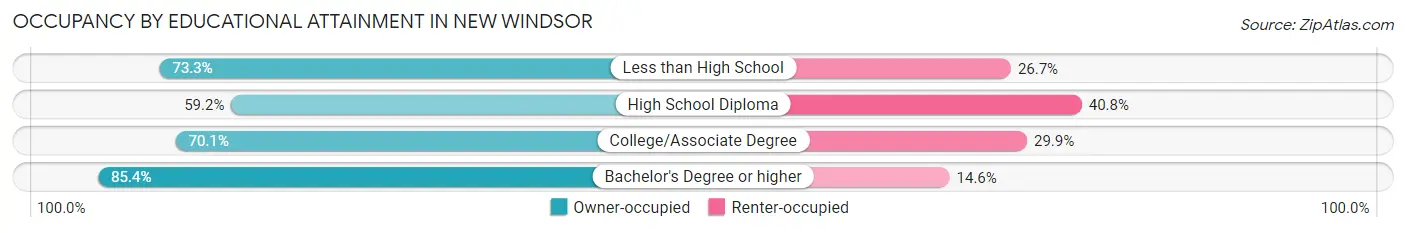
| Household Size | Owner-occupied | Renter-occupied |
| Less than High School | 255 (73.3%) | 93 (26.7%) |
| High School Diploma | 658 (59.2%) | 453 (40.8%) |
| College/Associate Degree | 595 (70.1%) | 254 (29.9%) |
| Bachelor's Degree or higher | 904 (85.4%) | 154 (14.6%) |
Occupancy by Age of Householder in New Windsor
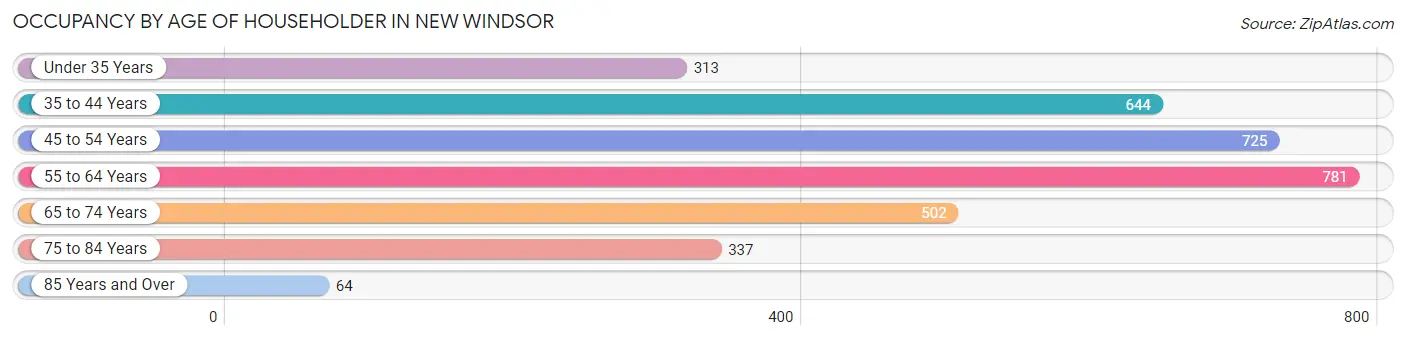
| Age Bracket | # Households | % Households |
| Under 35 Years | 313 | 9.3% |
| 35 to 44 Years | 644 | 19.1% |
| 45 to 54 Years | 725 | 21.5% |
| 55 to 64 Years | 781 | 23.2% |
| 65 to 74 Years | 502 | 14.9% |
| 75 to 84 Years | 337 | 10.0% |
| 85 Years and Over | 64 | 1.9% |
| Total | 3,366 | 100.0% |
Housing Finances in New Windsor
Median Income by Occupancy in New Windsor
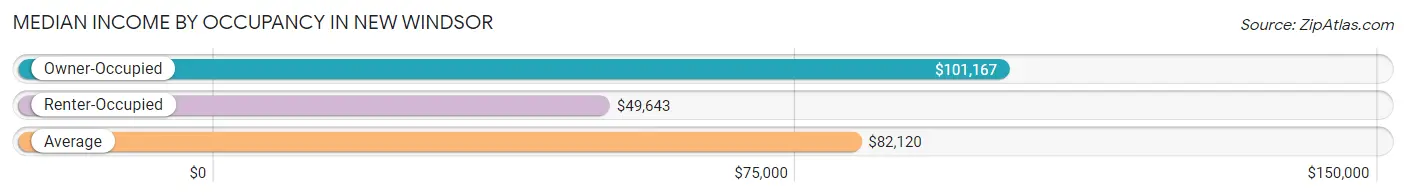
| Occupancy Type | # Households | Median Income |
| Owner-Occupied | 2,412 (71.7%) | $101,167 |
| Renter-Occupied | 954 (28.3%) | $49,643 |
| Average | 3,366 (100.0%) | $82,120 |
Occupancy by Householder Income Bracket in New Windsor
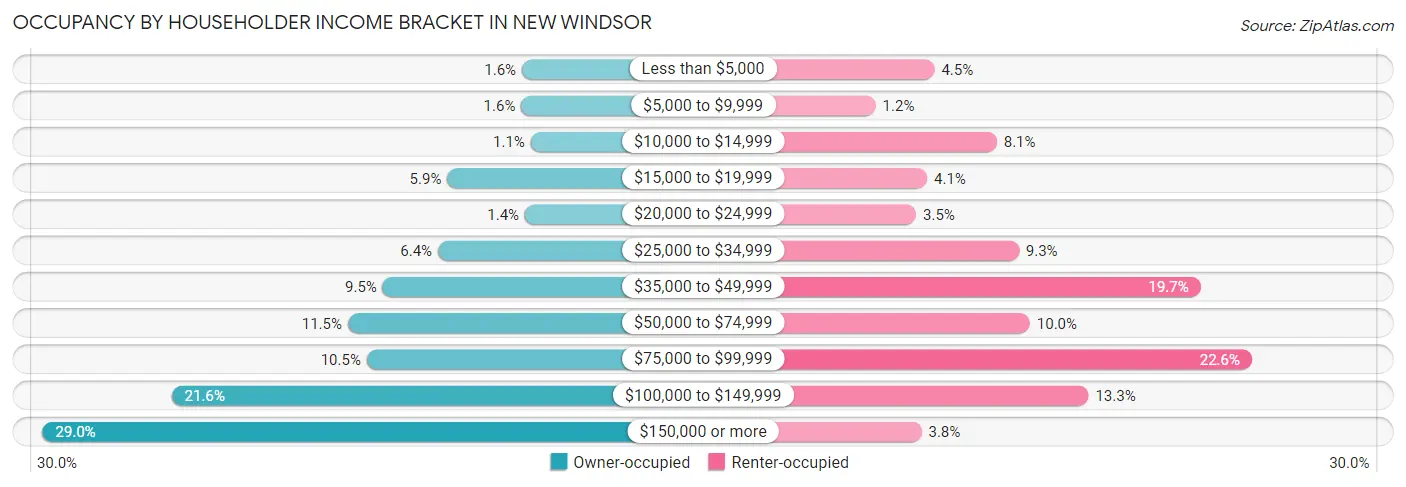
| Income Bracket | Owner-occupied | Renter-occupied |
| Less than $5,000 | 38 (1.6%) | 43 (4.5%) |
| $5,000 to $9,999 | 39 (1.6%) | 11 (1.1%) |
| $10,000 to $14,999 | 26 (1.1%) | 77 (8.1%) |
| $15,000 to $19,999 | 141 (5.9%) | 39 (4.1%) |
| $20,000 to $24,999 | 34 (1.4%) | 33 (3.5%) |
| $25,000 to $34,999 | 154 (6.4%) | 89 (9.3%) |
| $35,000 to $49,999 | 230 (9.5%) | 188 (19.7%) |
| $50,000 to $74,999 | 278 (11.5%) | 95 (10.0%) |
| $75,000 to $99,999 | 252 (10.4%) | 216 (22.6%) |
| $100,000 to $149,999 | 521 (21.6%) | 127 (13.3%) |
| $150,000 or more | 699 (29.0%) | 36 (3.8%) |
| Total | 2,412 (100.0%) | 954 (100.0%) |
Monthly Housing Cost Tiers in New Windsor
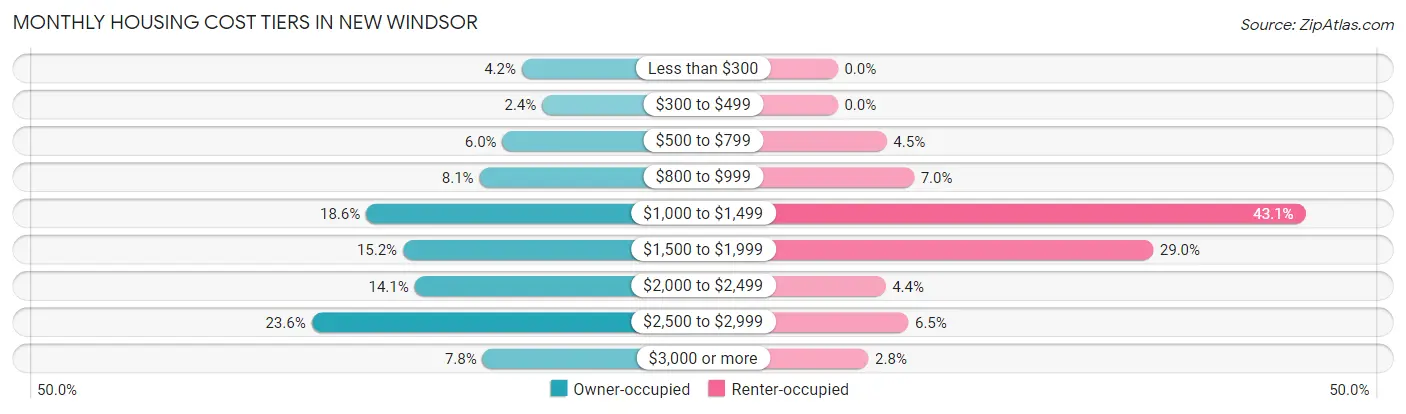
| Monthly Cost | Owner-occupied | Renter-occupied |
| Less than $300 | 102 (4.2%) | 0 (0.0%) |
| $300 to $499 | 57 (2.4%) | 0 (0.0%) |
| $500 to $799 | 145 (6.0%) | 43 (4.5%) |
| $800 to $999 | 196 (8.1%) | 67 (7.0%) |
| $1,000 to $1,499 | 448 (18.6%) | 411 (43.1%) |
| $1,500 to $1,999 | 366 (15.2%) | 277 (29.0%) |
| $2,000 to $2,499 | 340 (14.1%) | 42 (4.4%) |
| $2,500 to $2,999 | 569 (23.6%) | 62 (6.5%) |
| $3,000 or more | 189 (7.8%) | 27 (2.8%) |
| Total | 2,412 (100.0%) | 954 (100.0%) |
Physical Housing Characteristics in New Windsor
Housing Structures in New Windsor
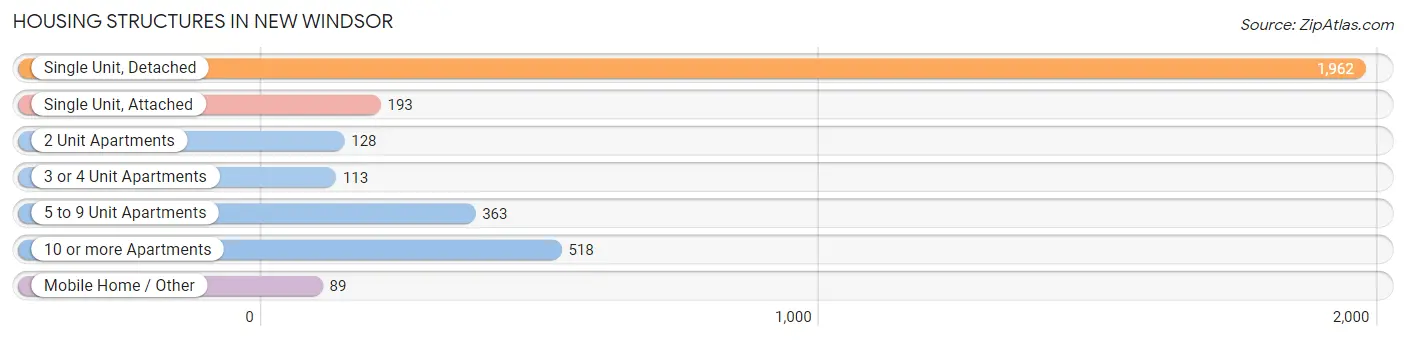
| Structure Type | # Housing Units | % Housing Units |
| Single Unit, Detached | 1,962 | 58.3% |
| Single Unit, Attached | 193 | 5.7% |
| 2 Unit Apartments | 128 | 3.8% |
| 3 or 4 Unit Apartments | 113 | 3.4% |
| 5 to 9 Unit Apartments | 363 | 10.8% |
| 10 or more Apartments | 518 | 15.4% |
| Mobile Home / Other | 89 | 2.6% |
| Total | 3,366 | 100.0% |
Housing Structures by Occupancy in New Windsor
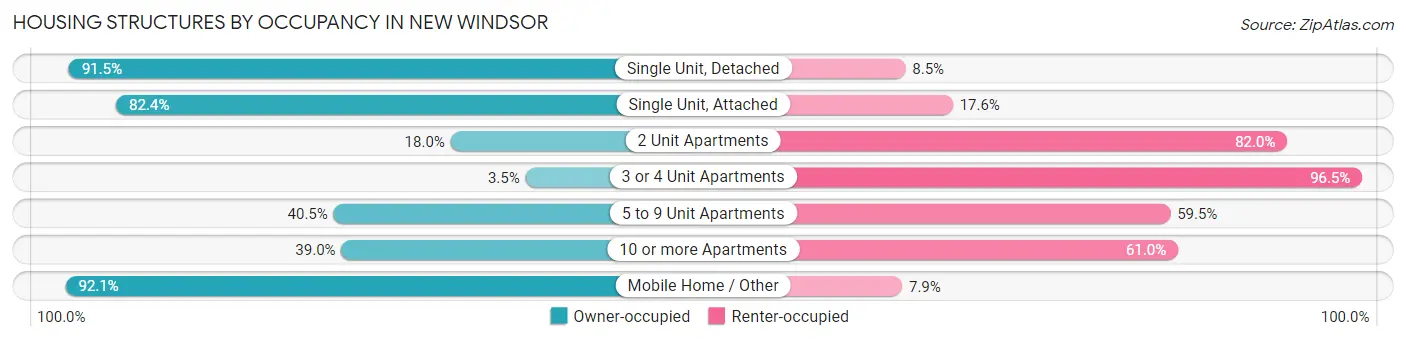
| Structure Type | Owner-occupied | Renter-occupied |
| Single Unit, Detached | 1,795 (91.5%) | 167 (8.5%) |
| Single Unit, Attached | 159 (82.4%) | 34 (17.6%) |
| 2 Unit Apartments | 23 (18.0%) | 105 (82.0%) |
| 3 or 4 Unit Apartments | 4 (3.5%) | 109 (96.5%) |
| 5 to 9 Unit Apartments | 147 (40.5%) | 216 (59.5%) |
| 10 or more Apartments | 202 (39.0%) | 316 (61.0%) |
| Mobile Home / Other | 82 (92.1%) | 7 (7.9%) |
| Total | 2,412 (71.7%) | 954 (28.3%) |
Housing Structures by Number of Rooms in New Windsor
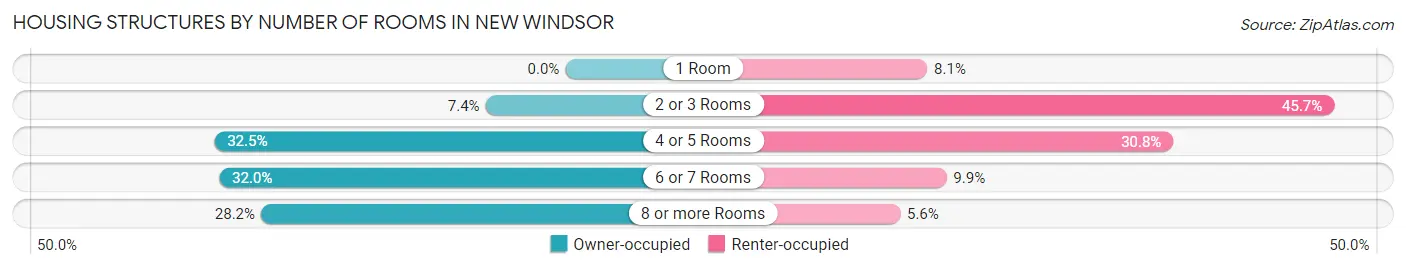
| Number of Rooms | Owner-occupied | Renter-occupied |
| 1 Room | 0 (0.0%) | 77 (8.1%) |
| 2 or 3 Rooms | 178 (7.4%) | 436 (45.7%) |
| 4 or 5 Rooms | 783 (32.5%) | 294 (30.8%) |
| 6 or 7 Rooms | 772 (32.0%) | 94 (9.9%) |
| 8 or more Rooms | 679 (28.1%) | 53 (5.6%) |
| Total | 2,412 (100.0%) | 954 (100.0%) |
Housing Structure by Heating Type in New Windsor
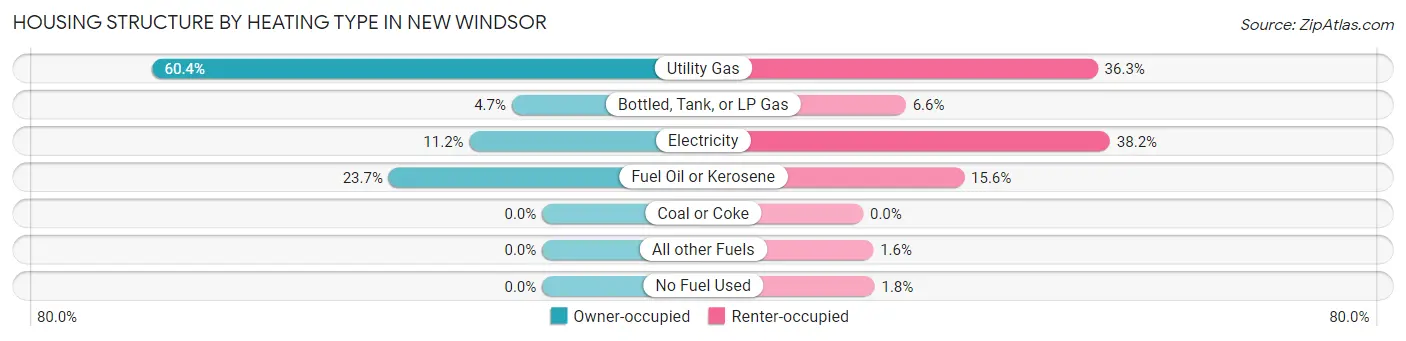
| Heating Type | Owner-occupied | Renter-occupied |
| Utility Gas | 1,456 (60.4%) | 346 (36.3%) |
| Bottled, Tank, or LP Gas | 113 (4.7%) | 63 (6.6%) |
| Electricity | 271 (11.2%) | 364 (38.2%) |
| Fuel Oil or Kerosene | 572 (23.7%) | 149 (15.6%) |
| Coal or Coke | 0 (0.0%) | 0 (0.0%) |
| All other Fuels | 0 (0.0%) | 15 (1.6%) |
| No Fuel Used | 0 (0.0%) | 17 (1.8%) |
| Total | 2,412 (100.0%) | 954 (100.0%) |
Household Vehicle Usage in New Windsor
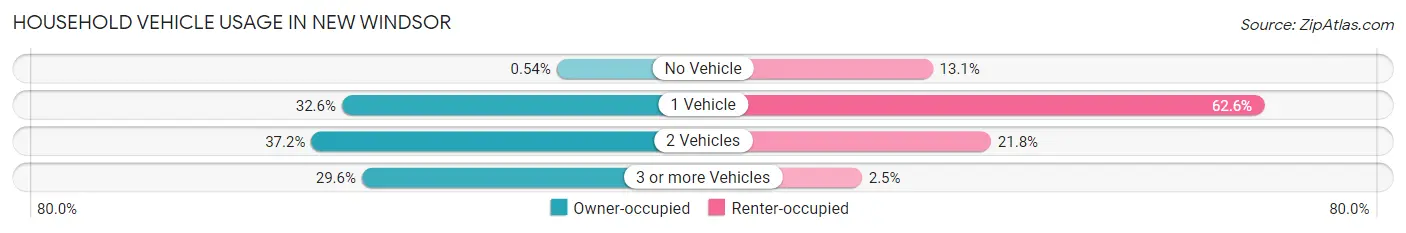
| Vehicles per Household | Owner-occupied | Renter-occupied |
| No Vehicle | 13 (0.5%) | 125 (13.1%) |
| 1 Vehicle | 787 (32.6%) | 597 (62.6%) |
| 2 Vehicles | 897 (37.2%) | 208 (21.8%) |
| 3 or more Vehicles | 715 (29.6%) | 24 (2.5%) |
| Total | 2,412 (100.0%) | 954 (100.0%) |
Real Estate & Mortgages in New Windsor
Real Estate and Mortgage Overview in New Windsor
| Characteristic | Without Mortgage | With Mortgage |
| Housing Units | 849 | 1,563 |
| Median Property Value | $288,600 | $309,800 |
| Median Household Income | $52,193 | $536 |
| Monthly Housing Costs | $1,037 | $189 |
| Real Estate Taxes | $6,485 | $0 |
Property Value by Mortgage Status in New Windsor
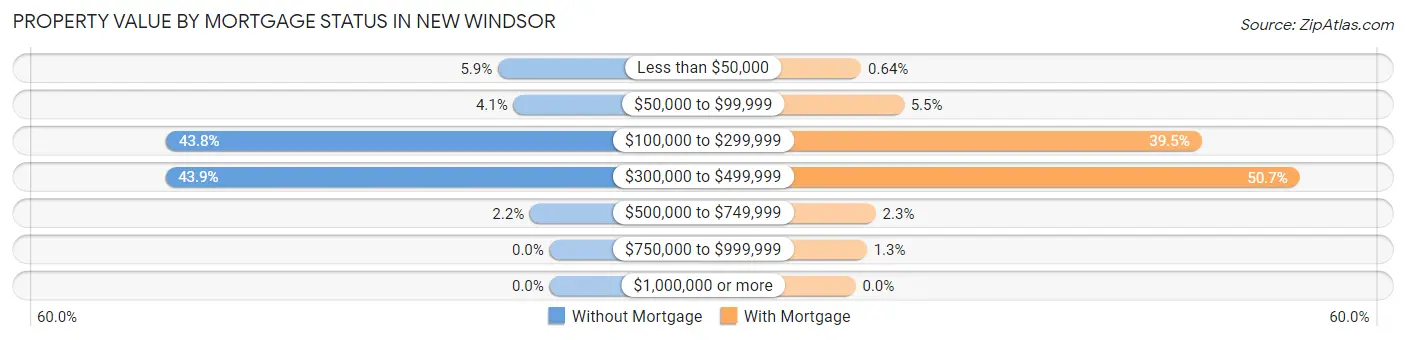
| Property Value | Without Mortgage | With Mortgage |
| Less than $50,000 | 50 (5.9%) | 10 (0.6%) |
| $50,000 to $99,999 | 35 (4.1%) | 86 (5.5%) |
| $100,000 to $299,999 | 372 (43.8%) | 618 (39.5%) |
| $300,000 to $499,999 | 373 (43.9%) | 793 (50.7%) |
| $500,000 to $749,999 | 19 (2.2%) | 36 (2.3%) |
| $750,000 to $999,999 | 0 (0.0%) | 20 (1.3%) |
| $1,000,000 or more | 0 (0.0%) | 0 (0.0%) |
| Total | 849 (100.0%) | 1,563 (100.0%) |
Household Income by Mortgage Status in New Windsor
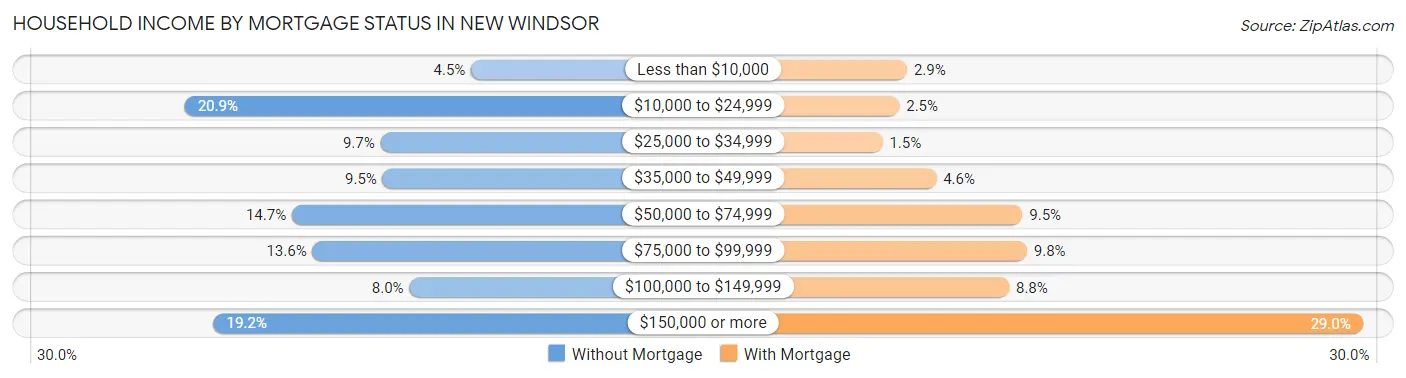
| Household Income | Without Mortgage | With Mortgage |
| Less than $10,000 | 38 (4.5%) | 46 (2.9%) |
| $10,000 to $24,999 | 177 (20.8%) | 39 (2.5%) |
| $25,000 to $34,999 | 82 (9.7%) | 24 (1.5%) |
| $35,000 to $49,999 | 81 (9.5%) | 72 (4.6%) |
| $50,000 to $74,999 | 125 (14.7%) | 149 (9.5%) |
| $75,000 to $99,999 | 115 (13.6%) | 153 (9.8%) |
| $100,000 to $149,999 | 68 (8.0%) | 137 (8.8%) |
| $150,000 or more | 163 (19.2%) | 453 (29.0%) |
| Total | 849 (100.0%) | 1,563 (100.0%) |
Property Value to Household Income Ratio in New Windsor
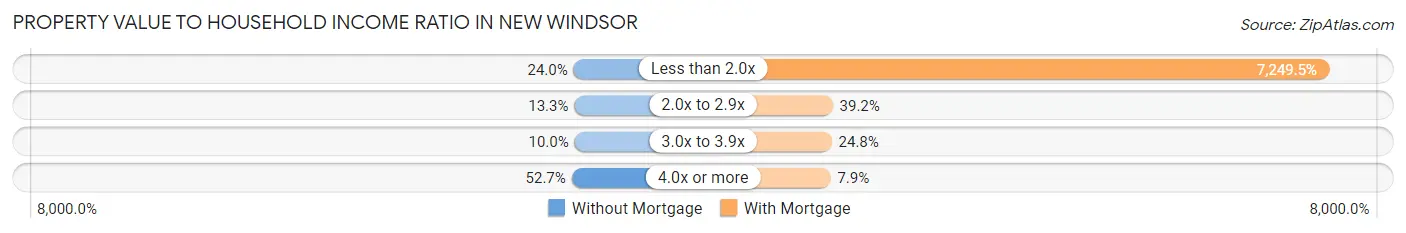
| Value-to-Income Ratio | Without Mortgage | With Mortgage |
| Less than 2.0x | 204 (24.0%) | 113,309 (7,249.5%) |
| 2.0x to 2.9x | 113 (13.3%) | 612 (39.2%) |
| 3.0x to 3.9x | 85 (10.0%) | 388 (24.8%) |
| 4.0x or more | 447 (52.6%) | 124 (7.9%) |
| Total | 849 (100.0%) | 1,563 (100.0%) |
Real Estate Taxes by Mortgage Status in New Windsor
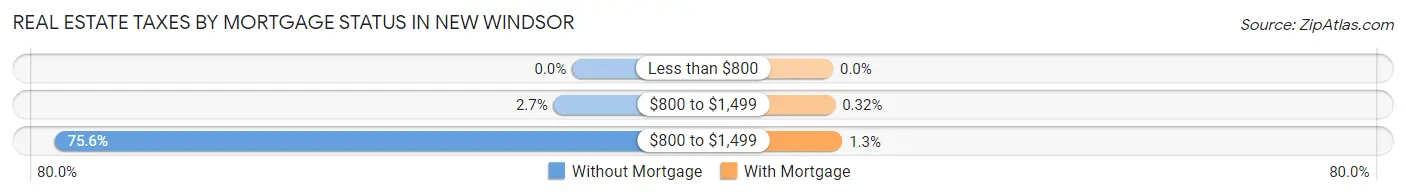
| Property Taxes | Without Mortgage | With Mortgage |
| Less than $800 | 0 (0.0%) | 0 (0.0%) |
| $800 to $1,499 | 23 (2.7%) | 5 (0.3%) |
| $800 to $1,499 | 642 (75.6%) | 21 (1.3%) |
| Total | 849 (100.0%) | 1,563 (100.0%) |
Health & Disability in New Windsor
Health Insurance Coverage by Age in New Windsor
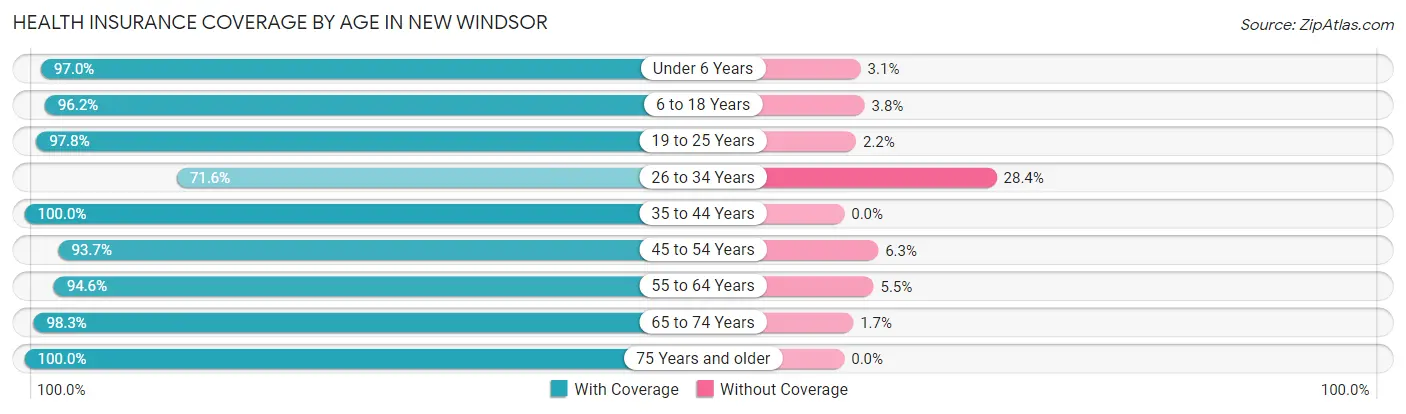
| Age Bracket | With Coverage | Without Coverage |
| Under 6 Years | 286 (97.0%) | 9 (3.0%) |
| 6 to 18 Years | 1,372 (96.2%) | 54 (3.8%) |
| 19 to 25 Years | 895 (97.8%) | 20 (2.2%) |
| 26 to 34 Years | 784 (71.6%) | 311 (28.4%) |
| 35 to 44 Years | 1,095 (100.0%) | 0 (0.0%) |
| 45 to 54 Years | 1,125 (93.7%) | 76 (6.3%) |
| 55 to 64 Years | 1,267 (94.6%) | 73 (5.4%) |
| 65 to 74 Years | 772 (98.3%) | 13 (1.7%) |
| 75 Years and older | 578 (100.0%) | 0 (0.0%) |
| Total | 8,174 (93.6%) | 556 (6.4%) |
Health Insurance Coverage by Citizenship Status in New Windsor
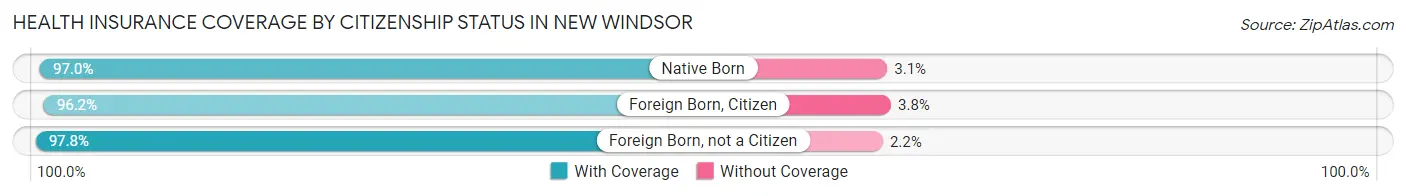
| Citizenship Status | With Coverage | Without Coverage |
| Native Born | 286 (97.0%) | 9 (3.0%) |
| Foreign Born, Citizen | 1,372 (96.2%) | 54 (3.8%) |
| Foreign Born, not a Citizen | 895 (97.8%) | 20 (2.2%) |
Health Insurance Coverage by Household Income in New Windsor
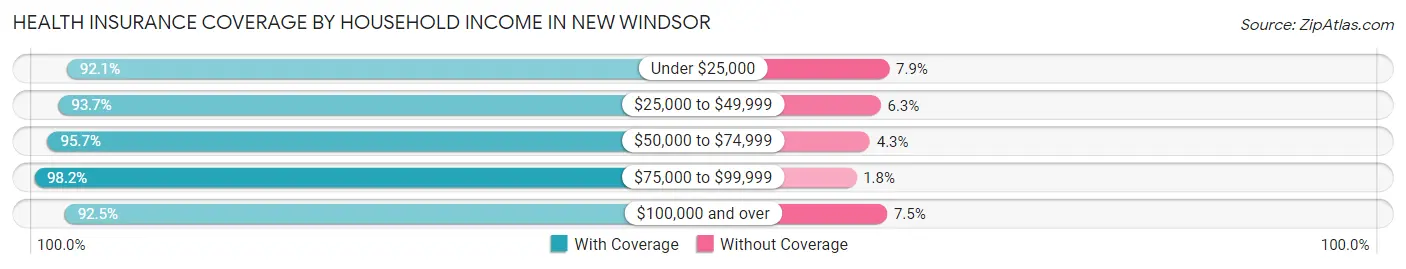
| Household Income | With Coverage | Without Coverage |
| Under $25,000 | 837 (92.1%) | 72 (7.9%) |
| $25,000 to $49,999 | 1,230 (93.7%) | 83 (6.3%) |
| $50,000 to $74,999 | 777 (95.7%) | 35 (4.3%) |
| $75,000 to $99,999 | 1,003 (98.2%) | 18 (1.8%) |
| $100,000 and over | 4,282 (92.5%) | 348 (7.5%) |
Public vs Private Health Insurance Coverage by Age in New Windsor
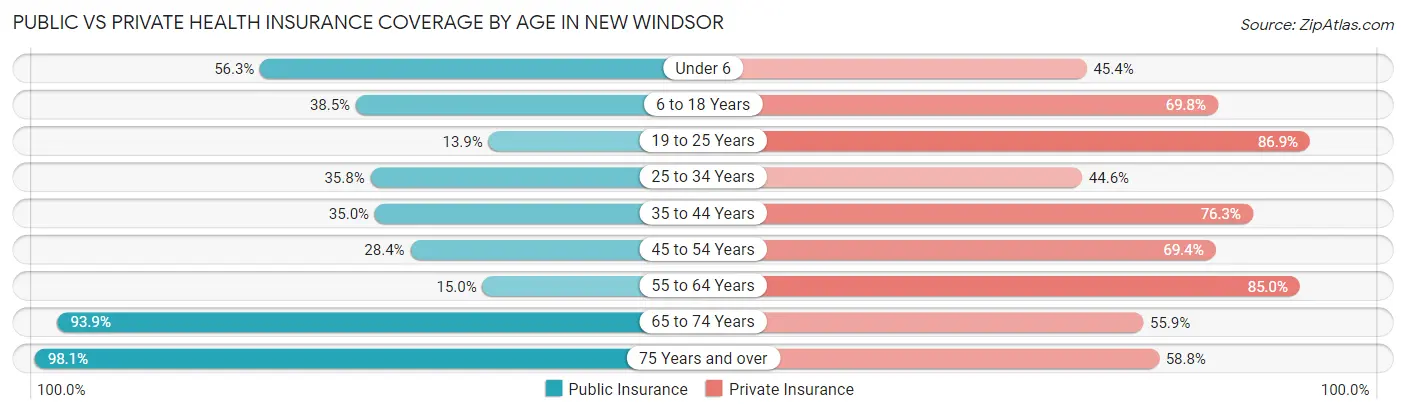
| Age Bracket | Public Insurance | Private Insurance |
| Under 6 | 166 (56.3%) | 134 (45.4%) |
| 6 to 18 Years | 549 (38.5%) | 995 (69.8%) |
| 19 to 25 Years | 127 (13.9%) | 795 (86.9%) |
| 25 to 34 Years | 392 (35.8%) | 488 (44.6%) |
| 35 to 44 Years | 383 (35.0%) | 835 (76.3%) |
| 45 to 54 Years | 341 (28.4%) | 833 (69.4%) |
| 55 to 64 Years | 201 (15.0%) | 1,139 (85.0%) |
| 65 to 74 Years | 737 (93.9%) | 439 (55.9%) |
| 75 Years and over | 567 (98.1%) | 340 (58.8%) |
| Total | 3,463 (39.7%) | 5,998 (68.7%) |
Disability Status by Sex by Age in New Windsor
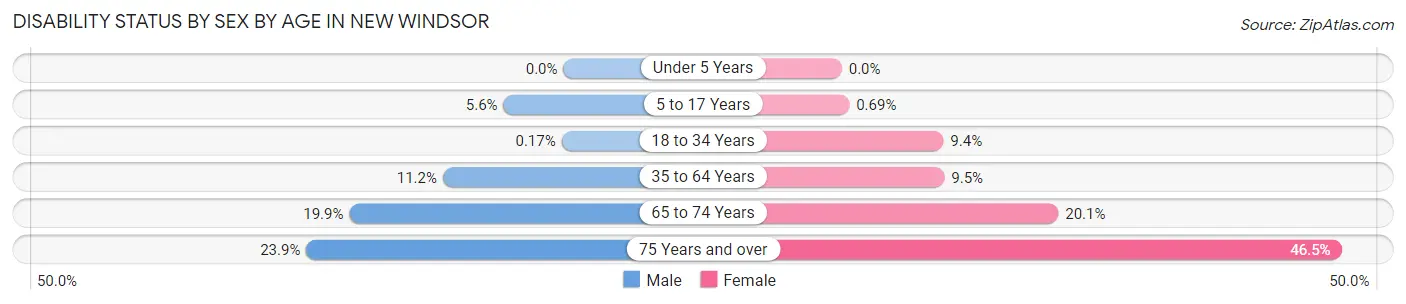
| Age Bracket | Male | Female |
| Under 5 Years | 0 (0.0%) | 0 (0.0%) |
| 5 to 17 Years | 34 (5.6%) | 5 (0.7%) |
| 18 to 34 Years | 2 (0.2%) | 99 (9.4%) |
| 35 to 64 Years | 194 (11.2%) | 181 (9.5%) |
| 65 to 74 Years | 63 (19.9%) | 94 (20.1%) |
| 75 Years and over | 47 (23.9%) | 177 (46.5%) |
Disability Class by Sex by Age in New Windsor
Disability Class: Hearing Difficulty
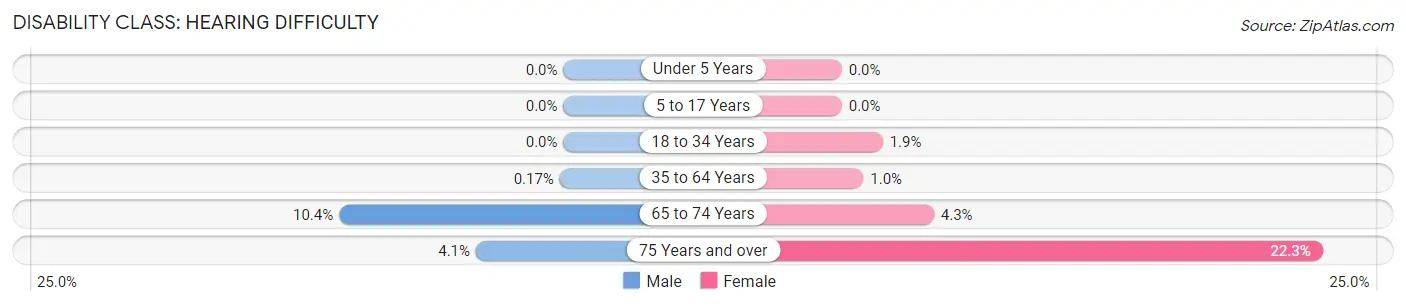
| Age Bracket | Male | Female |
| Under 5 Years | 0 (0.0%) | 0 (0.0%) |
| 5 to 17 Years | 0 (0.0%) | 0 (0.0%) |
| 18 to 34 Years | 0 (0.0%) | 20 (1.9%) |
| 35 to 64 Years | 3 (0.2%) | 19 (1.0%) |
| 65 to 74 Years | 33 (10.4%) | 20 (4.3%) |
| 75 Years and over | 8 (4.1%) | 85 (22.3%) |
Disability Class: Vision Difficulty
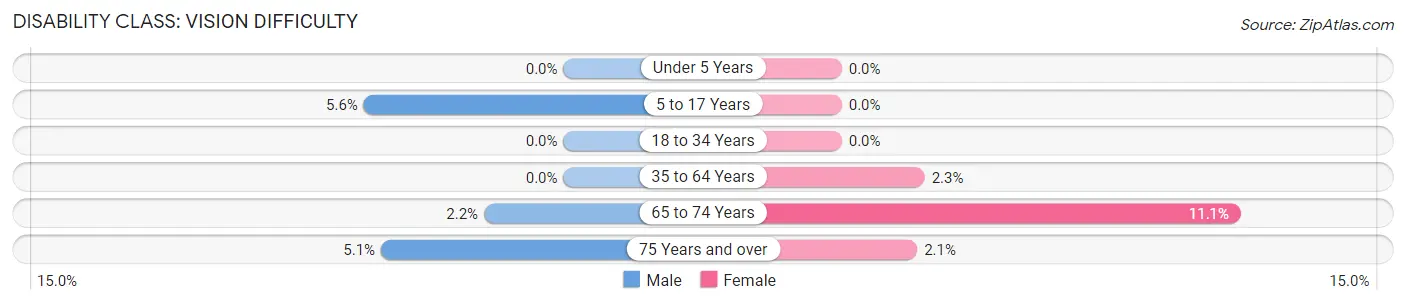
| Age Bracket | Male | Female |
| Under 5 Years | 0 (0.0%) | 0 (0.0%) |
| 5 to 17 Years | 34 (5.6%) | 0 (0.0%) |
| 18 to 34 Years | 0 (0.0%) | 0 (0.0%) |
| 35 to 64 Years | 0 (0.0%) | 44 (2.3%) |
| 65 to 74 Years | 7 (2.2%) | 52 (11.1%) |
| 75 Years and over | 10 (5.1%) | 8 (2.1%) |
Disability Class: Cognitive Difficulty
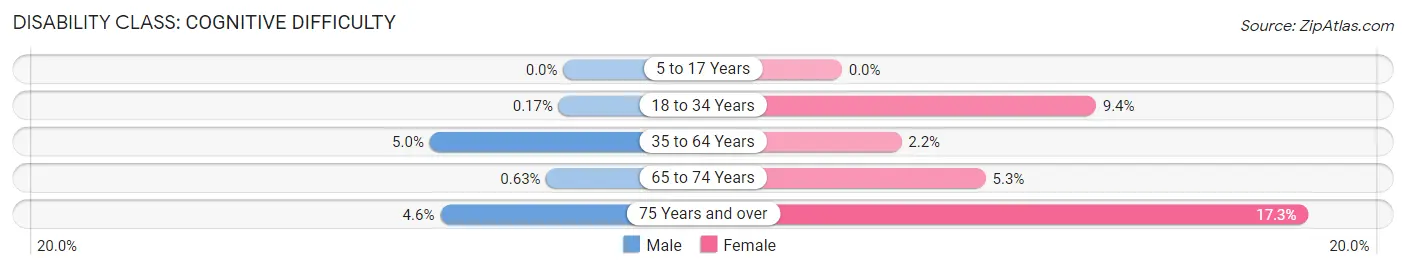
| Age Bracket | Male | Female |
| 5 to 17 Years | 0 (0.0%) | 0 (0.0%) |
| 18 to 34 Years | 2 (0.2%) | 99 (9.4%) |
| 35 to 64 Years | 86 (5.0%) | 42 (2.2%) |
| 65 to 74 Years | 2 (0.6%) | 25 (5.3%) |
| 75 Years and over | 9 (4.6%) | 66 (17.3%) |
Disability Class: Ambulatory Difficulty
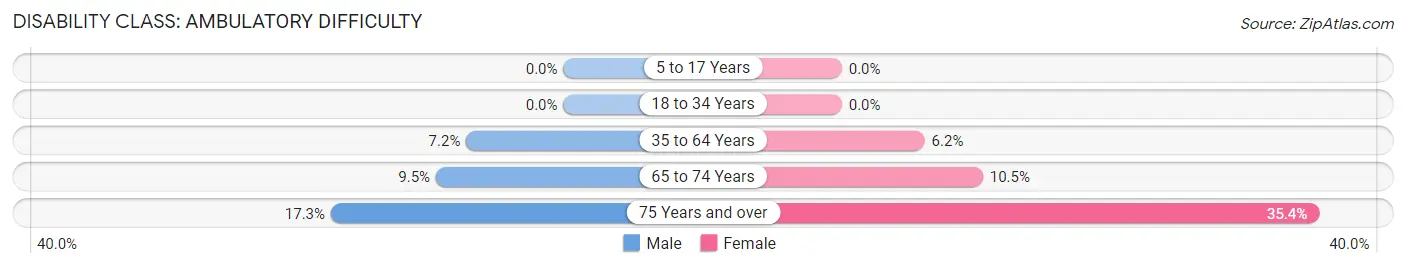
| Age Bracket | Male | Female |
| 5 to 17 Years | 0 (0.0%) | 0 (0.0%) |
| 18 to 34 Years | 0 (0.0%) | 0 (0.0%) |
| 35 to 64 Years | 125 (7.2%) | 117 (6.1%) |
| 65 to 74 Years | 30 (9.5%) | 49 (10.5%) |
| 75 Years and over | 34 (17.3%) | 135 (35.4%) |
Disability Class: Self-Care Difficulty
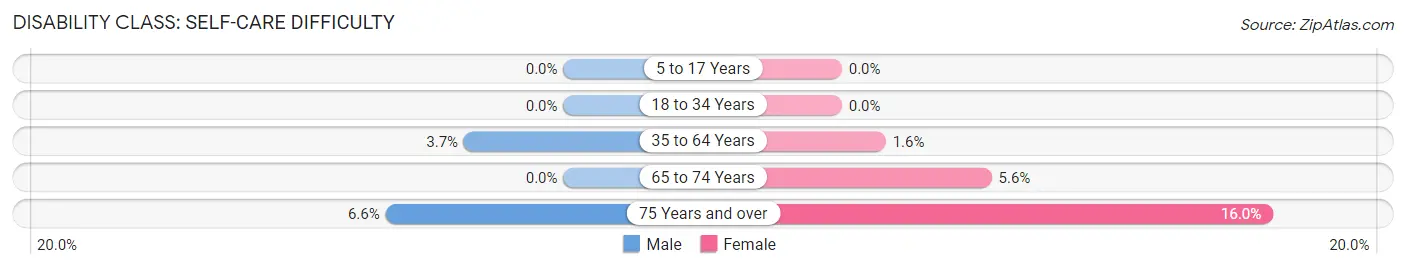
| Age Bracket | Male | Female |
| 5 to 17 Years | 0 (0.0%) | 0 (0.0%) |
| 18 to 34 Years | 0 (0.0%) | 0 (0.0%) |
| 35 to 64 Years | 64 (3.7%) | 31 (1.6%) |
| 65 to 74 Years | 0 (0.0%) | 26 (5.6%) |
| 75 Years and over | 13 (6.6%) | 61 (16.0%) |
Technology Access in New Windsor
Computing Device Access in New Windsor
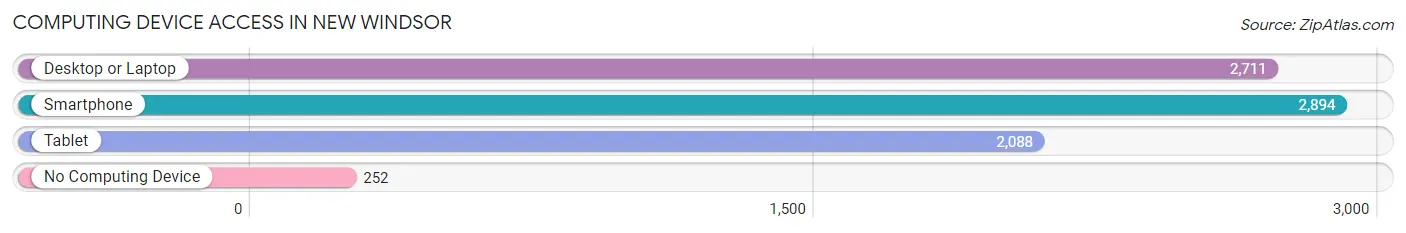
| Device Type | # Households | % Households |
| Desktop or Laptop | 2,711 | 80.5% |
| Smartphone | 2,894 | 86.0% |
| Tablet | 2,088 | 62.0% |
| No Computing Device | 252 | 7.5% |
| Total | 3,366 | 100.0% |
Internet Access in New Windsor
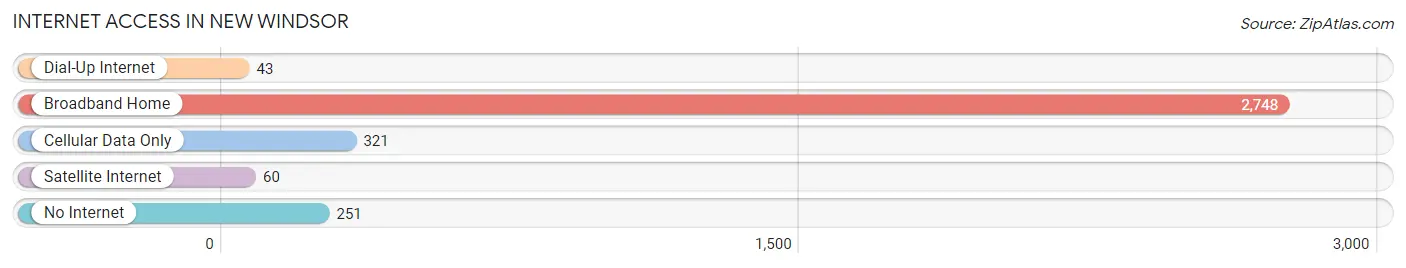
| Internet Type | # Households | % Households |
| Dial-Up Internet | 43 | 1.3% |
| Broadband Home | 2,748 | 81.6% |
| Cellular Data Only | 321 | 9.5% |
| Satellite Internet | 60 | 1.8% |
| No Internet | 251 | 7.5% |
| Total | 3,366 | 100.0% |
New Windsor Summary
New Windsor is a town located in Orange County, New York, United States. It is situated in the Hudson Valley region, approximately 60 miles north of New York City. The town was founded in 1763 and is named after Windsor, England. As of the 2010 census, the town had a population of 24,496.
Geography
New Windsor is located in the southeastern part of Orange County, bordered by the towns of Cornwall, Newburgh, and Woodbury. It is situated in the Hudson Valley region, approximately 60 miles north of New York City. The town covers an area of approximately 33.5 square miles and is located in the foothills of the Shawangunk Mountains. The town is home to several parks, including the New Windsor Cantonment State Historic Site, which is a preserved Revolutionary War encampment.
Climate
New Windsor has a humid continental climate, with cold winters and hot, humid summers. The average annual temperature is 48°F, with an average high of 68°F in July and an average low of 28°F in January. The average annual precipitation is 43 inches, with an average of 4 inches of snowfall per year.
Demographics
As of the 2010 census, the town had a population of 24,496. The racial makeup of the town was 87.3% White, 6.2% African American, 0.3% Native American, 2.2% Asian, 0.1% Pacific Islander, 1.7% from other races, and 2.3% from two or more races. Hispanic or Latino of any race were 8.2% of the population.
Economy
New Windsor is home to several major employers, including the United States Military Academy at West Point, the New York Air National Guard, and the Stewart International Airport. The town is also home to several large industrial and manufacturing companies, including the Pepsi Bottling Group, the New York State Department of Corrections, and the New York State Department of Environmental Conservation.
The town is also home to several small businesses, including restaurants, retail stores, and professional services. The town is also home to several wineries, including Brotherhood Winery, which is the oldest winery in the United States.
History
New Windsor was founded in 1763 by a group of settlers from Connecticut. The town was named after Windsor, England, and was originally part of the town of Cornwall. In 1783, the town was incorporated as the Town of New Windsor.
During the Revolutionary War, the town was the site of the New Windsor Cantonment, a military encampment of the Continental Army. The encampment was used as a staging area for the Battle of Yorktown in 1781.
In the 19th century, the town was an important center for the production of iron and steel. The town was also home to several mills, including the New Windsor Cotton Mill, which was the first cotton mill in the United States.
In the 20th century, the town continued to grow and develop. The town was home to several military installations, including the United States Military Academy at West Point and the New York Air National Guard. The town is also home to the Stewart International Airport, which opened in the late 1990s.
Common Questions
What is the Total Population of New Windsor?
Total Population of New Windsor is 8,788.
What is the Total Male Population of New Windsor?
Total Male Population of New Windsor is 4,173.
What is the Total Female Population of New Windsor?
Total Female Population of New Windsor is 4,615.
What is the Ratio of Males per 100 Females in New Windsor?
There are 90.42 Males per 100 Females in New Windsor.
What is the Ratio of Females per 100 Males in New Windsor?
There are 110.59 Females per 100 Males in New Windsor.
What is the Median Population Age in New Windsor?
Median Population Age in New Windsor is 40.9 Years.
What is the Average Family Size in New Windsor
Average Family Size in New Windsor is 3.2 People.
What is the Average Household Size in New Windsor
Average Household Size in New Windsor is 2.6 People.
What is Per Capita Income in New Windsor?
Per Capita income in New Windsor is $41,043.
What is the Median Family Income in New Windsor?
Median Family Income in New Windsor is $105,431.
What is the Median Household income in New Windsor?
Median Household Income in New Windsor is $82,120.
What is Income or Wage Gap in New Windsor?
Income or Wage Gap in New Windsor is 44.2%.
Women in New Windsor earn 55.8 cents for every dollar earned by a man.
What is Inequality or Gini Index in New Windsor?
Inequality or Gini Index in New Windsor is 0.44.
How Large is the Labor Force in New Windsor?
There are 4,866 People in the Labor Forcein in New Windsor.
What is the Percentage of People in the Labor Force in New Windsor?
65.0% of People are in the Labor Force in New Windsor.
What is the Unemployment Rate in New Windsor?
Unemployment Rate in New Windsor is 10.7%.