Cities with the Highest Percentage of Immigrants from Germany in New York
RELATED REPORTS & OPTIONS
Germany
New York
Compare Cities
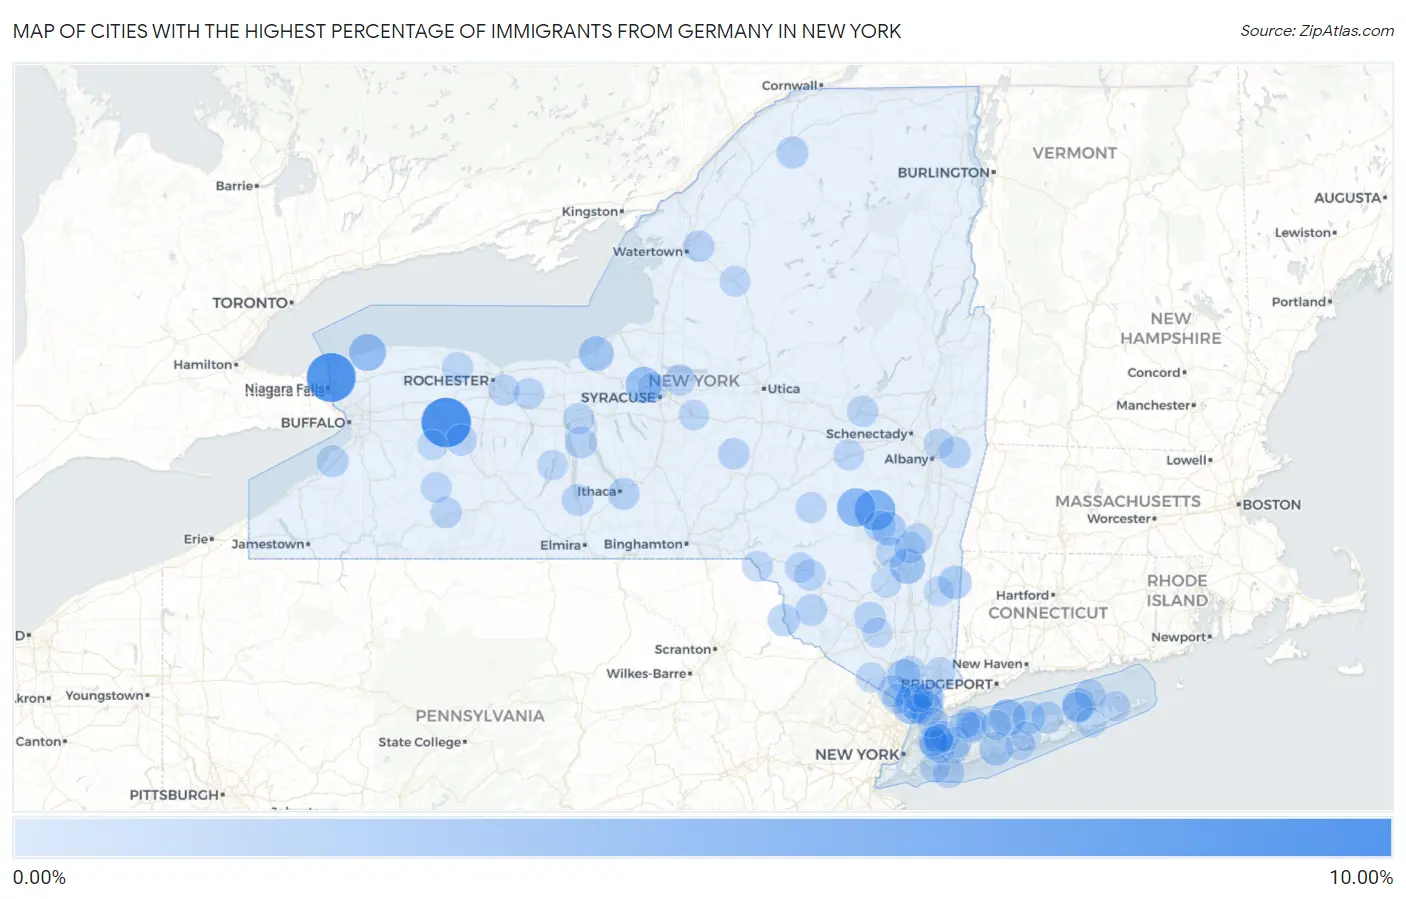
Map of Cities with the Highest Percentage of Immigrants from Germany in New York
0.00%
10.00%
Cities with the Highest Percentage of Immigrants from Germany in New York
| City | Germany | vs State | vs National | |
| 1. | Pavilion | 8.81% | 0.19%(+8.62)#1 | 0.16%(+8.65)#29 |
| 2. | Lewiston | 8.50% | 0.19%(+8.31)#2 | 0.16%(+8.34)#32 |
| 3. | Copake | 5.53% | 0.19%(+5.34)#3 | 0.16%(+5.37)#64 |
| 4. | Windham | 4.95% | 0.19%(+4.76)#4 | 0.16%(+4.79)#80 |
| 5. | Prattsville | 4.08% | 0.19%(+3.89)#5 | 0.16%(+3.92)#107 |
| 6. | Olcott | 3.46% | 0.19%(+3.26)#6 | 0.16%(+3.29)#129 |
| 7. | Seneca Knolls | 3.26% | 0.19%(+3.07)#7 | 0.16%(+3.10)#143 |
| 8. | Poquott | 3.25% | 0.19%(+3.06)#8 | 0.16%(+3.09)#144 |
| 9. | Sparkill | 3.20% | 0.19%(+3.01)#9 | 0.16%(+3.04)#145 |
| 10. | Grand View On Hudson | 2.83% | 0.19%(+2.64)#10 | 0.16%(+2.67)#173 |
| 11. | East Kingston | 2.76% | 0.19%(+2.57)#11 | 0.16%(+2.60)#184 |
| 12. | Fair Haven | 2.61% | 0.19%(+2.41)#12 | 0.16%(+2.44)#204 |
| 13. | Hartsdale | 2.34% | 0.19%(+2.14)#13 | 0.16%(+2.17)#231 |
| 14. | Stony Point | 2.22% | 0.19%(+2.02)#14 | 0.16%(+2.05)#251 |
| 15. | Tannersville | 2.15% | 0.19%(+1.95)#15 | 0.16%(+1.98)#261 |
| 16. | Islip Terrace | 2.07% | 0.19%(+1.87)#16 | 0.16%(+1.90)#275 |
| 17. | Amenia | 2.05% | 0.19%(+1.85)#17 | 0.16%(+1.88)#280 |
| 18. | Peconic | 2.02% | 0.19%(+1.82)#18 | 0.16%(+1.85)#284 |
| 19. | Fairview Cdp Westchester County | 1.99% | 0.19%(+1.80)#19 | 0.16%(+1.83)#288 |
| 20. | Shoreham | 1.69% | 0.19%(+1.50)#20 | 0.16%(+1.53)#378 |
| 21. | Narrowsburg | 1.59% | 0.19%(+1.39)#21 | 0.16%(+1.42)#423 |
| 22. | Varna | 1.57% | 0.19%(+1.38)#22 | 0.16%(+1.41)#435 |
| 23. | Viola | 1.56% | 0.19%(+1.36)#23 | 0.16%(+1.39)#442 |
| 24. | Valhalla | 1.47% | 0.19%(+1.28)#24 | 0.16%(+1.31)#468 |
| 25. | Hannawa Falls | 1.46% | 0.19%(+1.26)#25 | 0.16%(+1.29)#479 |
| 26. | Angola | 1.45% | 0.19%(+1.26)#26 | 0.16%(+1.29)#483 |
| 27. | Millwood | 1.44% | 0.19%(+1.24)#27 | 0.16%(+1.27)#492 |
| 28. | Baiting Hollow | 1.41% | 0.19%(+1.22)#28 | 0.16%(+1.25)#504 |
| 29. | East Ithaca | 1.41% | 0.19%(+1.21)#29 | 0.16%(+1.24)#510 |
| 30. | Hartwick Seminary | 1.37% | 0.19%(+1.18)#30 | 0.16%(+1.21)#529 |
| 31. | Smallwood | 1.35% | 0.19%(+1.16)#31 | 0.16%(+1.19)#538 |
| 32. | Watkins Glen | 1.35% | 0.19%(+1.16)#32 | 0.16%(+1.19)#540 |
| 33. | Hunter | 1.33% | 0.19%(+1.14)#33 | 0.16%(+1.17)#551 |
| 34. | Poestenkill | 1.33% | 0.19%(+1.13)#34 | 0.16%(+1.16)#554 |
| 35. | Romulus | 1.31% | 0.19%(+1.11)#35 | 0.16%(+1.14)#569 |
| 36. | Pine Bush | 1.27% | 0.19%(+1.07)#36 | 0.16%(+1.10)#594 |
| 37. | Black River | 1.27% | 0.19%(+1.07)#37 | 0.16%(+1.10)#596 |
| 38. | Sherburne | 1.26% | 0.19%(+1.07)#38 | 0.16%(+1.10)#597 |
| 39. | Saugerties | 1.23% | 0.19%(+1.04)#39 | 0.16%(+1.07)#613 |
| 40. | Lido Beach | 1.22% | 0.19%(+1.03)#40 | 0.16%(+1.06)#620 |
| 41. | Fonda | 1.21% | 0.19%(+1.02)#41 | 0.16%(+1.05)#627 |
| 42. | Round Top | 1.21% | 0.19%(+1.01)#42 | 0.16%(+1.04)#632 |
| 43. | Leicester | 1.18% | 0.19%(+0.985)#43 | 0.16%(+1.01)#652 |
| 44. | Waterloo | 1.18% | 0.19%(+0.984)#44 | 0.16%(+1.01)#653 |
| 45. | Bridgeport | 1.16% | 0.19%(+0.967)#45 | 0.16%(+0.997)#666 |
| 46. | Livingston Manor | 1.16% | 0.19%(+0.965)#46 | 0.16%(+0.995)#668 |
| 47. | Pittsford | 1.16% | 0.19%(+0.962)#47 | 0.16%(+0.992)#671 |
| 48. | Macedon | 1.14% | 0.19%(+0.945)#48 | 0.16%(+0.975)#681 |
| 49. | Greenport West | 1.12% | 0.19%(+0.927)#49 | 0.16%(+0.957)#695 |
| 50. | Angelica | 1.12% | 0.19%(+0.926)#50 | 0.16%(+0.956)#698 |
| 51. | Cutchogue | 1.11% | 0.19%(+0.917)#51 | 0.16%(+0.946)#705 |
| 52. | Jericho | 1.11% | 0.19%(+0.913)#52 | 0.16%(+0.942)#711 |
| 53. | Clarkson | 1.10% | 0.19%(+0.902)#53 | 0.16%(+0.931)#720 |
| 54. | Fillmore | 1.07% | 0.19%(+0.880)#54 | 0.16%(+0.910)#746 |
| 55. | Katonah | 1.06% | 0.19%(+0.863)#55 | 0.16%(+0.893)#760 |
| 56. | Buchanan | 1.06% | 0.19%(+0.863)#56 | 0.16%(+0.892)#761 |
| 57. | Woodstock | 1.04% | 0.19%(+0.851)#57 | 0.16%(+0.880)#775 |
| 58. | Sleepy Hollow Lake | 1.04% | 0.19%(+0.846)#58 | 0.16%(+0.875)#781 |
| 59. | Kensington | 1.04% | 0.19%(+0.844)#59 | 0.16%(+0.874)#785 |
| 60. | Bloomville | 1.03% | 0.19%(+0.841)#60 | 0.16%(+0.870)#790 |
| 61. | Hancock | 1.03% | 0.19%(+0.831)#61 | 0.16%(+0.861)#801 |
| 62. | Manhasset Hills | 1.02% | 0.19%(+0.831)#62 | 0.16%(+0.861)#802 |
| 63. | Lowville | 1.02% | 0.19%(+0.825)#63 | 0.16%(+0.855)#810 |
| 64. | Cobleskill | 1.01% | 0.19%(+0.818)#64 | 0.16%(+0.848)#817 |
| 65. | Baxter Estates | 0.96% | 0.19%(+0.765)#65 | 0.16%(+0.794)#874 |
| 66. | Eatons Neck | 0.95% | 0.19%(+0.760)#66 | 0.16%(+0.790)#881 |
| 67. | Germantown | 0.94% | 0.19%(+0.743)#67 | 0.16%(+0.772)#907 |
| 68. | Walworth | 0.92% | 0.19%(+0.731)#68 | 0.16%(+0.761)#919 |
| 69. | Roscoe | 0.90% | 0.19%(+0.711)#69 | 0.16%(+0.741)#955 |
| 70. | Salisbury | 0.90% | 0.19%(+0.708)#70 | 0.16%(+0.738)#963 |
| 71. | Cazenovia | 0.87% | 0.19%(+0.674)#71 | 0.16%(+0.704)#1,019 |
| 72. | University Gardens | 0.86% | 0.19%(+0.669)#72 | 0.16%(+0.699)#1,029 |
| 73. | Springs | 0.86% | 0.19%(+0.669)#73 | 0.16%(+0.698)#1,030 |
| 74. | Plandome Heights | 0.85% | 0.19%(+0.659)#74 | 0.16%(+0.689)#1,045 |
| 75. | Glenwood Landing | 0.84% | 0.19%(+0.646)#75 | 0.16%(+0.675)#1,068 |
| 76. | Hawthorne | 0.83% | 0.19%(+0.637)#76 | 0.16%(+0.667)#1,077 |
| 77. | Saddle Rock | 0.83% | 0.19%(+0.635)#77 | 0.16%(+0.664)#1,080 |
| 78. | Centerport | 0.83% | 0.19%(+0.634)#78 | 0.16%(+0.664)#1,081 |
| 79. | Greenwood Lake | 0.83% | 0.19%(+0.632)#79 | 0.16%(+0.662)#1,085 |
| 80. | Keuka Park | 0.82% | 0.19%(+0.631)#80 | 0.16%(+0.660)#1,092 |
| 81. | Chestnut Ridge | 0.82% | 0.19%(+0.629)#81 | 0.16%(+0.658)#1,096 |
| 82. | Dobbs Ferry | 0.81% | 0.19%(+0.620)#82 | 0.16%(+0.650)#1,106 |
| 83. | Clifton Gardens | 0.81% | 0.19%(+0.620)#83 | 0.16%(+0.649)#1,107 |
| 84. | Larchmont | 0.81% | 0.19%(+0.616)#84 | 0.16%(+0.645)#1,113 |
| 85. | Green Island | 0.81% | 0.19%(+0.615)#85 | 0.16%(+0.645)#1,114 |
| 86. | Millbrook | 0.80% | 0.19%(+0.602)#86 | 0.16%(+0.632)#1,137 |
| 87. | Stone Ridge | 0.79% | 0.19%(+0.596)#87 | 0.16%(+0.625)#1,156 |
| 88. | Sleepy Hollow | 0.79% | 0.19%(+0.595)#88 | 0.16%(+0.625)#1,158 |
| 89. | Halesite | 0.79% | 0.19%(+0.593)#89 | 0.16%(+0.622)#1,164 |
| 90. | Lloyd Harbor | 0.78% | 0.19%(+0.590)#90 | 0.16%(+0.620)#1,169 |
| 91. | Water Mill | 0.78% | 0.19%(+0.586)#91 | 0.16%(+0.616)#1,175 |
| 92. | East Patchogue | 0.77% | 0.19%(+0.576)#92 | 0.16%(+0.605)#1,191 |
| 93. | Montgomery | 0.76% | 0.19%(+0.570)#93 | 0.16%(+0.600)#1,202 |
| 94. | Plandome Manor | 0.75% | 0.19%(+0.558)#94 | 0.16%(+0.588)#1,221 |
| 95. | Warsaw | 0.75% | 0.19%(+0.555)#95 | 0.16%(+0.585)#1,226 |
| 96. | Cedarhurst | 0.74% | 0.19%(+0.545)#96 | 0.16%(+0.575)#1,252 |
| 97. | Yaphank | 0.74% | 0.19%(+0.545)#97 | 0.16%(+0.574)#1,254 |
| 98. | Chelsea Cove | 0.73% | 0.19%(+0.536)#98 | 0.16%(+0.566)#1,276 |
| 99. | Liverpool | 0.73% | 0.19%(+0.536)#99 | 0.16%(+0.565)#1,282 |
| 100. | Nissequogue | 0.72% | 0.19%(+0.529)#100 | 0.16%(+0.558)#1,293 |
Common Questions
What are the Top 10 Cities with the Highest Percentage of Immigrants from Germany in New York?
Top 10 Cities with the Highest Percentage of Immigrants from Germany in New York are:
#1
8.81%
#2
8.50%
#3
4.95%
#4
4.08%
#5
3.46%
#6
3.26%
#7
3.25%
#8
3.20%
#9
2.83%
#10
2.76%
What city has the Highest Percentage of Immigrants from Germany in New York?
Pavilion has the Highest Percentage of Immigrants from Germany in New York with 8.81%.
What is the Percentage of Immigrants from Germany in the State of New York?
Percentage of Immigrants from Germany in New York is 0.19%.
What is the Percentage of Immigrants from Germany in the United States?
Percentage of Immigrants from Germany in the United States is 0.16%.