Holtsville, NY
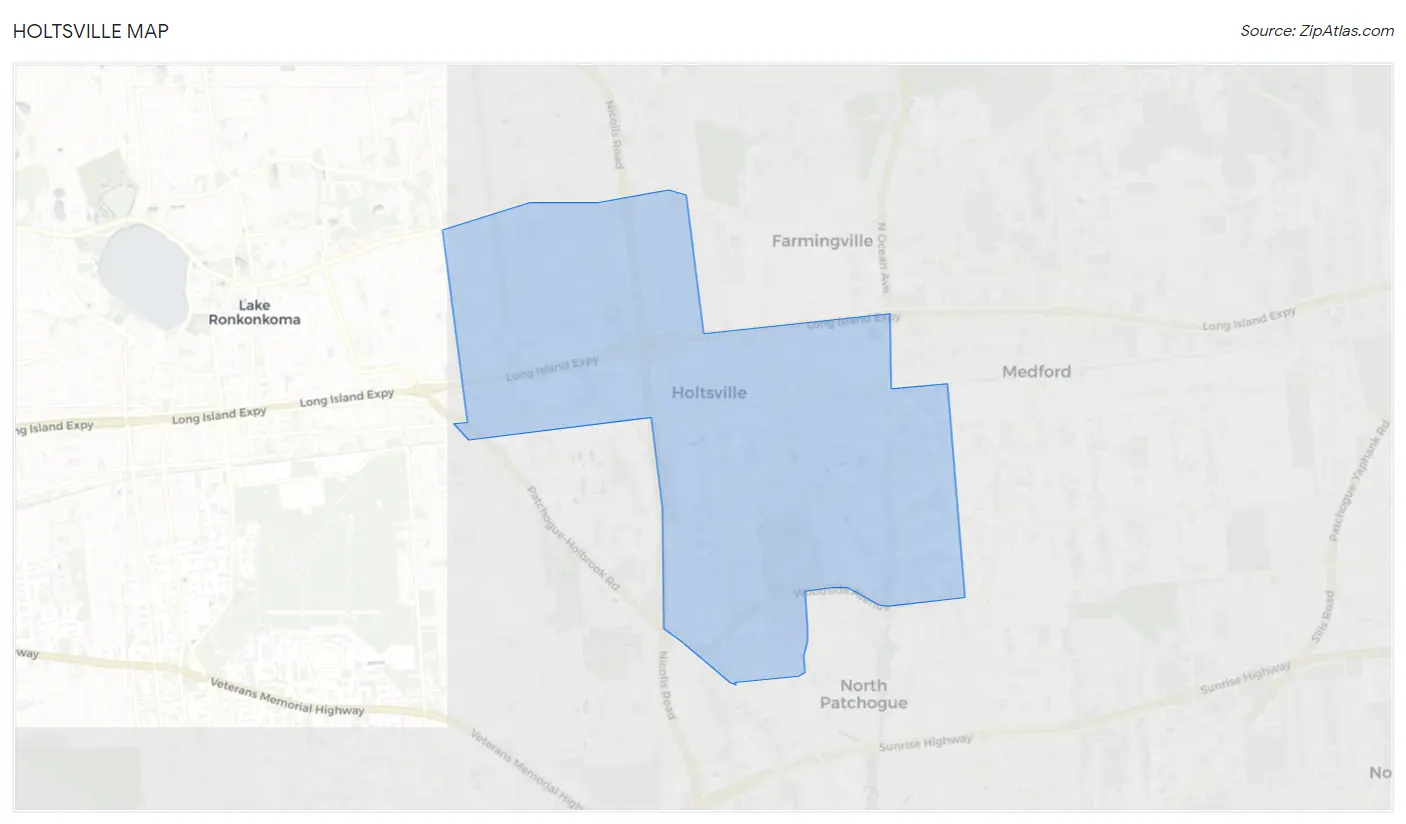
Holtsville Map
Holtsville Overview
19,597
TOTAL POPULATION
9,799
MALE POPULATION
9,798
FEMALE POPULATION
100.01
MALES / 100 FEMALES
99.99
FEMALES / 100 MALES
39.4
MEDIAN AGE
3.5
AVG FAMILY SIZE
3.0
AVG HOUSEHOLD SIZE
$49,255
PER CAPITA INCOME
$144,087
AVG FAMILY INCOME
$128,444
AVG HOUSEHOLD INCOME
36.0%
WAGE / INCOME GAP [ % ]
64.0¢/ $1
WAGE / INCOME GAP [ $ ]
$8,591
FAMILY INCOME DEFICIT
0.39
INEQUALITY / GINI INDEX
11,176
LABOR FORCE [ PEOPLE ]
69.9%
PERCENT IN LABOR FORCE
3.1%
UNEMPLOYMENT RATE
Holtsville Zip Codes
Holtsville Area Codes
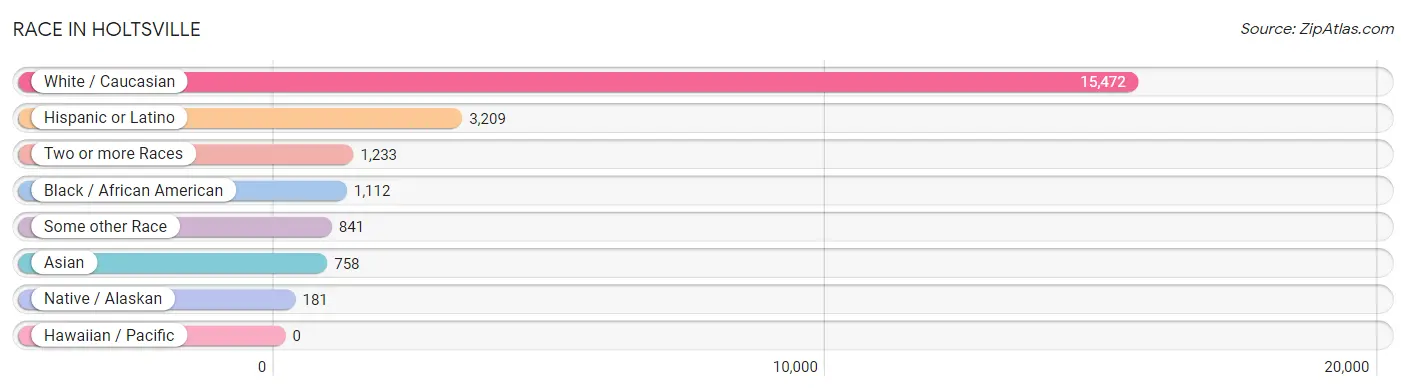
Race in Holtsville
The most populous races in Holtsville are White / Caucasian (15,472 | 78.9%), Hispanic or Latino (3,209 | 16.4%), and Two or more Races (1,233 | 6.3%).
| Race | # Population | % Population |
| Asian | 758 | 3.9% |
| Black / African American | 1,112 | 5.7% |
| Hawaiian / Pacific | 0 | 0.0% |
| Hispanic or Latino | 3,209 | 16.4% |
| Native / Alaskan | 181 | 0.9% |
| White / Caucasian | 15,472 | 78.9% |
| Two or more Races | 1,233 | 6.3% |
| Some other Race | 841 | 4.3% |
| Total | 19,597 | 100.0% |
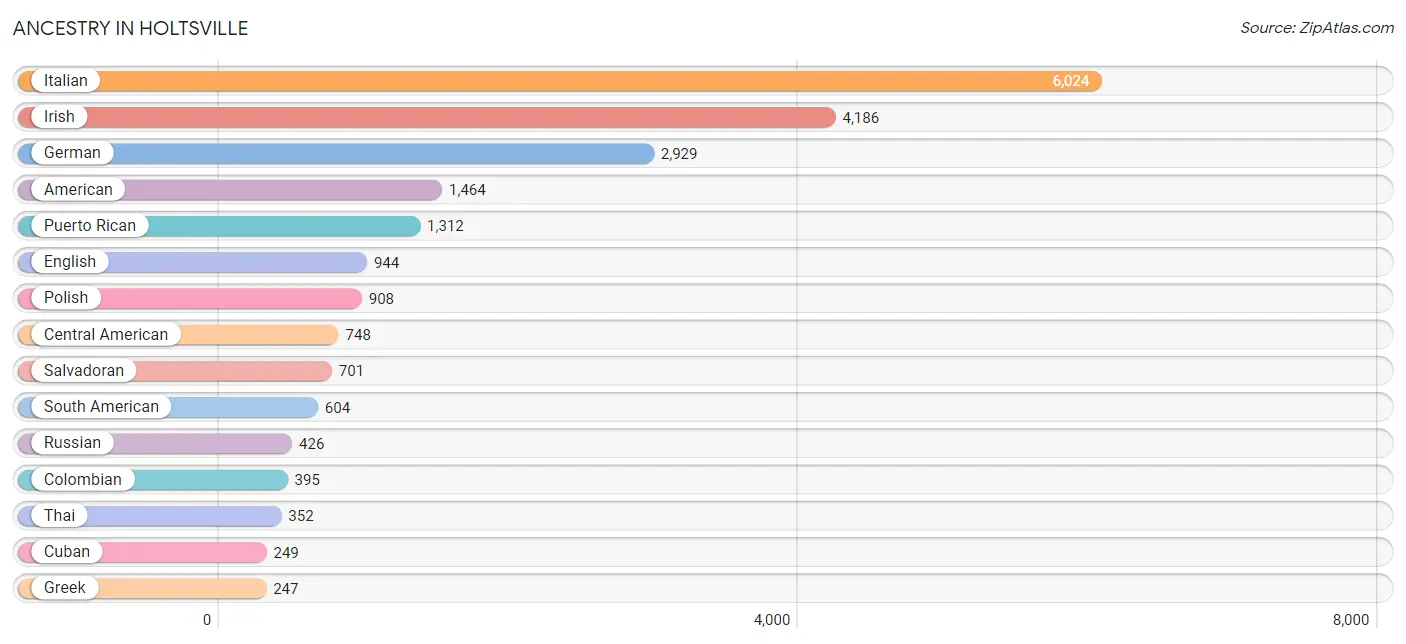
Ancestry in Holtsville
The most populous ancestries reported in Holtsville are Italian (6,024 | 30.7%), Irish (4,186 | 21.4%), German (2,929 | 14.9%), American (1,464 | 7.5%), and Puerto Rican (1,312 | 6.7%), together accounting for 81.2% of all Holtsville residents.
| Ancestry | # Population | % Population |
| Afghan | 21 | 0.1% |
| Albanian | 60 | 0.3% |
| American | 1,464 | 7.5% |
| Arab | 34 | 0.2% |
| Austrian | 19 | 0.1% |
| Belgian | 11 | 0.1% |
| Bhutanese | 29 | 0.2% |
| Brazilian | 218 | 1.1% |
| British | 36 | 0.2% |
| Burmese | 42 | 0.2% |
| Canadian | 32 | 0.2% |
| Central American | 748 | 3.8% |
| Choctaw | 56 | 0.3% |
| Colombian | 395 | 2.0% |
| Croatian | 23 | 0.1% |
| Cuban | 249 | 1.3% |
| Czech | 65 | 0.3% |
| Danish | 113 | 0.6% |
| Dominican | 100 | 0.5% |
| Dutch | 74 | 0.4% |
| Eastern European | 10 | 0.1% |
| Ecuadorian | 156 | 0.8% |
| Egyptian | 16 | 0.1% |
| English | 944 | 4.8% |
| European | 194 | 1.0% |
| Filipino | 54 | 0.3% |
| Finnish | 27 | 0.1% |
| French | 231 | 1.2% |
| French Canadian | 32 | 0.2% |
| German | 2,929 | 14.9% |
| Greek | 247 | 1.3% |
| Guyanese | 44 | 0.2% |
| Haitian | 115 | 0.6% |
| Hungarian | 75 | 0.4% |
| Indian (Asian) | 128 | 0.6% |
| Irish | 4,186 | 21.4% |
| Italian | 6,024 | 30.7% |
| Jamaican | 46 | 0.2% |
| Korean | 26 | 0.1% |
| Lithuanian | 8 | 0.0% |
| Mexican | 122 | 0.6% |
| Mexican American Indian | 122 | 0.6% |
| Moroccan | 18 | 0.1% |
| Navajo | 50 | 0.3% |
| Nicaraguan | 47 | 0.2% |
| Nigerian | 12 | 0.1% |
| Norwegian | 38 | 0.2% |
| Peruvian | 53 | 0.3% |
| Polish | 908 | 4.6% |
| Portuguese | 74 | 0.4% |
| Puerto Rican | 1,312 | 6.7% |
| Romanian | 75 | 0.4% |
| Russian | 426 | 2.2% |
| Salvadoran | 701 | 3.6% |
| Scotch-Irish | 85 | 0.4% |
| Scottish | 243 | 1.2% |
| Slovak | 42 | 0.2% |
| South American | 604 | 3.1% |
| Spaniard | 10 | 0.1% |
| Spanish | 42 | 0.2% |
| Subsaharan African | 12 | 0.1% |
| Swedish | 43 | 0.2% |
| Swiss | 6 | 0.0% |
| Thai | 352 | 1.8% |
| Trinidadian and Tobagonian | 192 | 1.0% |
| Turkish | 101 | 0.5% |
| Ukrainian | 128 | 0.6% |
| Vietnamese | 87 | 0.4% |
| Welsh | 53 | 0.3% |
| West Indian | 199 | 1.0% |
| Yugoslavian | 16 | 0.1% | View All 71 Rows |
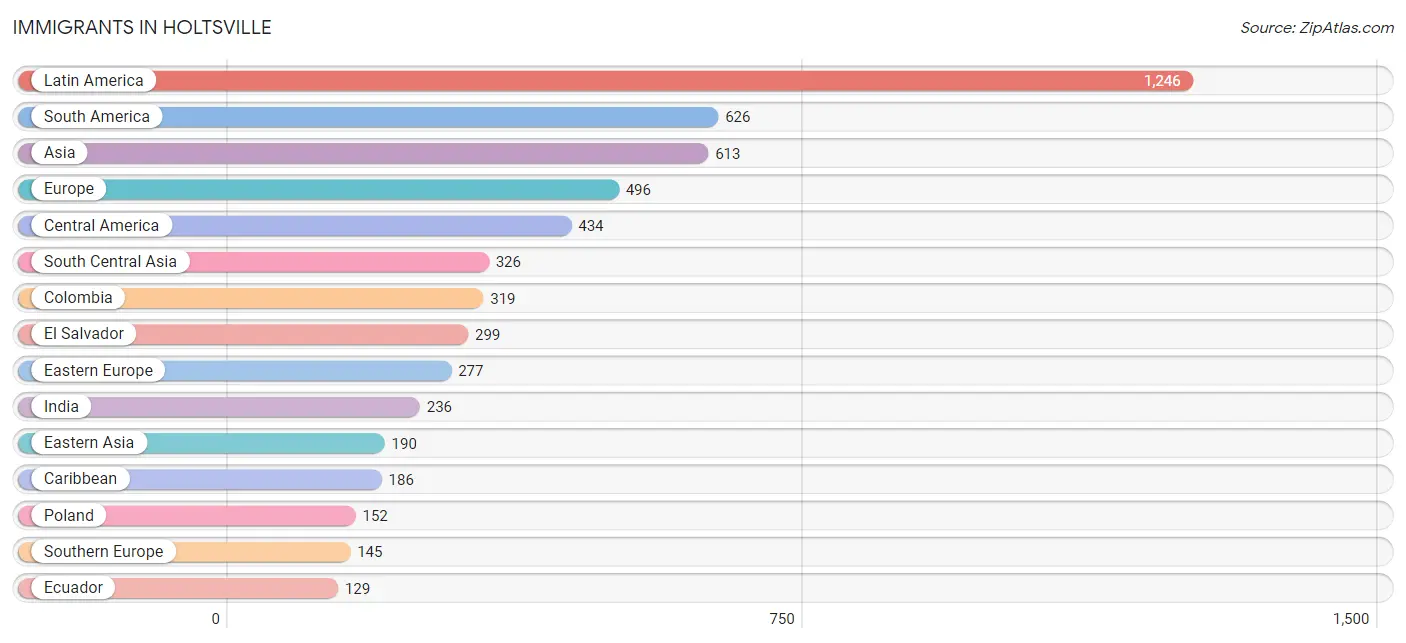
Immigrants in Holtsville
The most numerous immigrant groups reported in Holtsville came from Latin America (1,246 | 6.4%), South America (626 | 3.2%), Asia (613 | 3.1%), Europe (496 | 2.5%), and Central America (434 | 2.2%), together accounting for 17.4% of all Holtsville residents.
| Immigration Origin | # Population | % Population |
| Africa | 45 | 0.2% |
| Asia | 613 | 3.1% |
| Australia | 11 | 0.1% |
| Austria | 3 | 0.0% |
| Bangladesh | 43 | 0.2% |
| Brazil | 77 | 0.4% |
| Canada | 9 | 0.1% |
| Caribbean | 186 | 0.9% |
| Central America | 434 | 2.2% |
| China | 128 | 0.6% |
| Colombia | 319 | 1.6% |
| Croatia | 18 | 0.1% |
| Cuba | 9 | 0.1% |
| Eastern Asia | 190 | 1.0% |
| Eastern Europe | 277 | 1.4% |
| Ecuador | 129 | 0.7% |
| Egypt | 16 | 0.1% |
| El Salvador | 299 | 1.5% |
| England | 32 | 0.2% |
| Europe | 496 | 2.5% |
| Germany | 15 | 0.1% |
| Greece | 8 | 0.0% |
| Guyana | 76 | 0.4% |
| Haiti | 57 | 0.3% |
| India | 236 | 1.2% |
| Ireland | 5 | 0.0% |
| Italy | 103 | 0.5% |
| Jamaica | 11 | 0.1% |
| Japan | 20 | 0.1% |
| Korea | 42 | 0.2% |
| Latin America | 1,246 | 6.4% |
| Mexico | 122 | 0.6% |
| Moldova | 15 | 0.1% |
| Morocco | 18 | 0.1% |
| Netherlands | 10 | 0.1% |
| Nicaragua | 13 | 0.1% |
| Northern Africa | 34 | 0.2% |
| Northern Europe | 46 | 0.2% |
| Oceania | 11 | 0.1% |
| Pakistan | 47 | 0.2% |
| Peru | 25 | 0.1% |
| Poland | 152 | 0.8% |
| Portugal | 24 | 0.1% |
| Romania | 46 | 0.2% |
| Russia | 17 | 0.1% |
| South America | 626 | 3.2% |
| South Central Asia | 326 | 1.7% |
| Southern Europe | 145 | 0.7% |
| Spain | 10 | 0.1% |
| Taiwan | 54 | 0.3% |
| Trinidad and Tobago | 109 | 0.6% |
| Turkey | 97 | 0.5% |
| Western Asia | 97 | 0.5% |
| Western Europe | 28 | 0.1% | View All 54 Rows |
Sex and Age in Holtsville
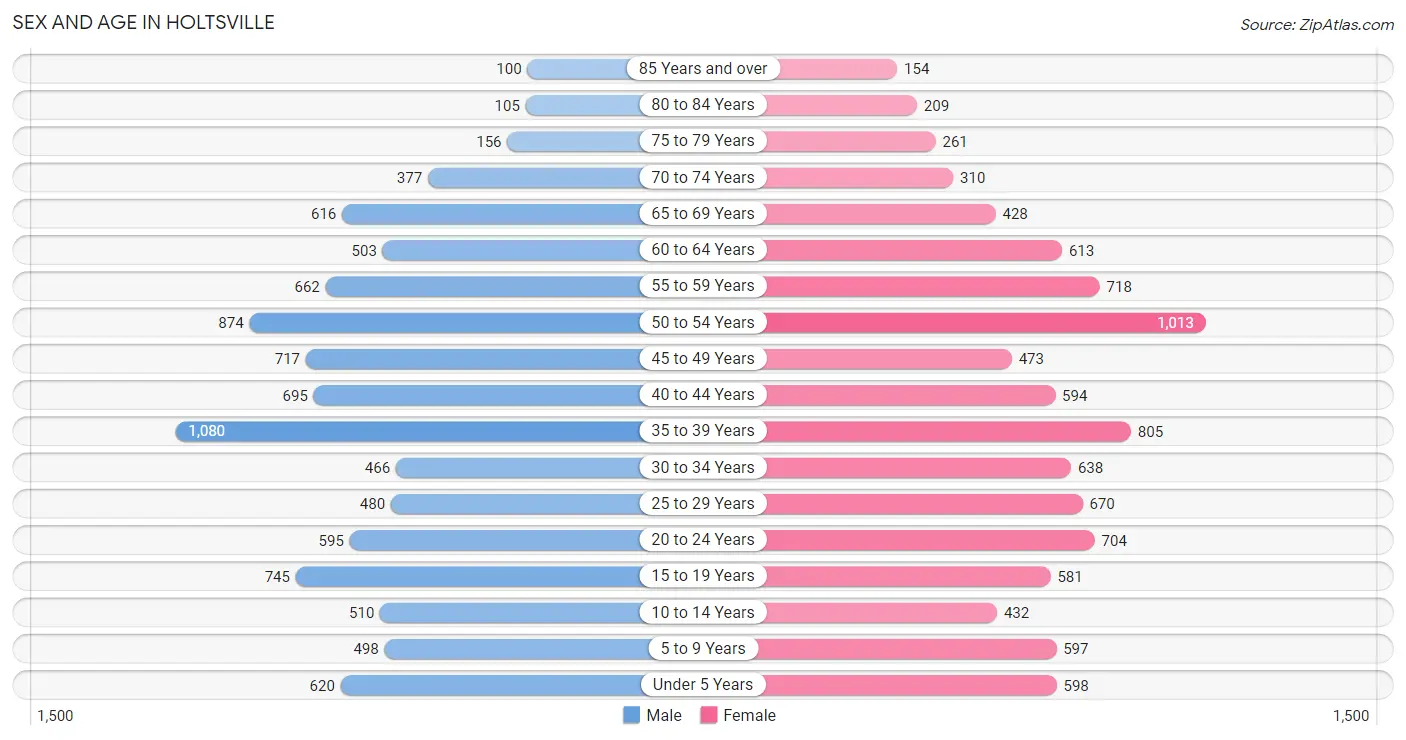
Sex and Age in Holtsville
The most populous age groups in Holtsville are 35 to 39 Years (1,080 | 11.0%) for men and 50 to 54 Years (1,013 | 10.3%) for women.
| Age Bracket | Male | Female |
| Under 5 Years | 620 (6.3%) | 598 (6.1%) |
| 5 to 9 Years | 498 (5.1%) | 597 (6.1%) |
| 10 to 14 Years | 510 (5.2%) | 432 (4.4%) |
| 15 to 19 Years | 745 (7.6%) | 581 (5.9%) |
| 20 to 24 Years | 595 (6.1%) | 704 (7.2%) |
| 25 to 29 Years | 480 (4.9%) | 670 (6.8%) |
| 30 to 34 Years | 466 (4.8%) | 638 (6.5%) |
| 35 to 39 Years | 1,080 (11.0%) | 805 (8.2%) |
| 40 to 44 Years | 695 (7.1%) | 594 (6.1%) |
| 45 to 49 Years | 717 (7.3%) | 473 (4.8%) |
| 50 to 54 Years | 874 (8.9%) | 1,013 (10.3%) |
| 55 to 59 Years | 662 (6.8%) | 718 (7.3%) |
| 60 to 64 Years | 503 (5.1%) | 613 (6.3%) |
| 65 to 69 Years | 616 (6.3%) | 428 (4.4%) |
| 70 to 74 Years | 377 (3.8%) | 310 (3.2%) |
| 75 to 79 Years | 156 (1.6%) | 261 (2.7%) |
| 80 to 84 Years | 105 (1.1%) | 209 (2.1%) |
| 85 Years and over | 100 (1.0%) | 154 (1.6%) |
| Total | 9,799 (100.0%) | 9,798 (100.0%) |
Families and Households in Holtsville
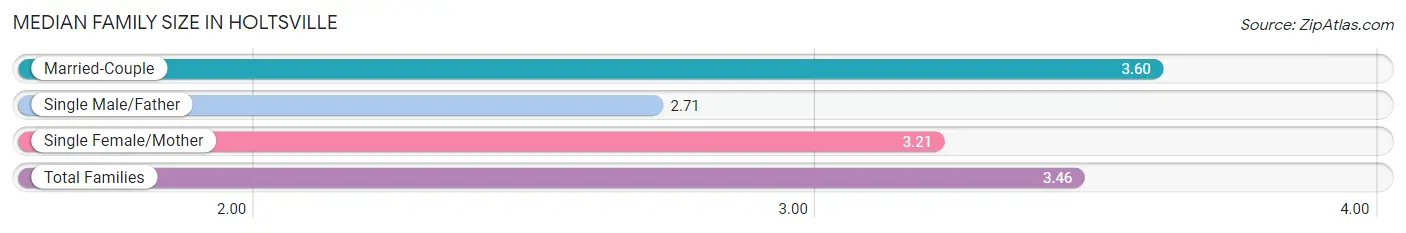
Median Family Size in Holtsville
The median family size in Holtsville is 3.46 persons per family, with married-couple families (3,789 | 76.4%) accounting for the largest median family size of 3.6 persons per family. On the other hand, single male/father families (464 | 9.4%) represent the smallest median family size with 2.71 persons per family.
| Family Type | # Families | Family Size |
| Married-Couple | 3,789 (76.4%) | 3.60 |
| Single Male/Father | 464 (9.4%) | 2.71 |
| Single Female/Mother | 705 (14.2%) | 3.21 |
| Total Families | 4,958 (100.0%) | 3.46 |
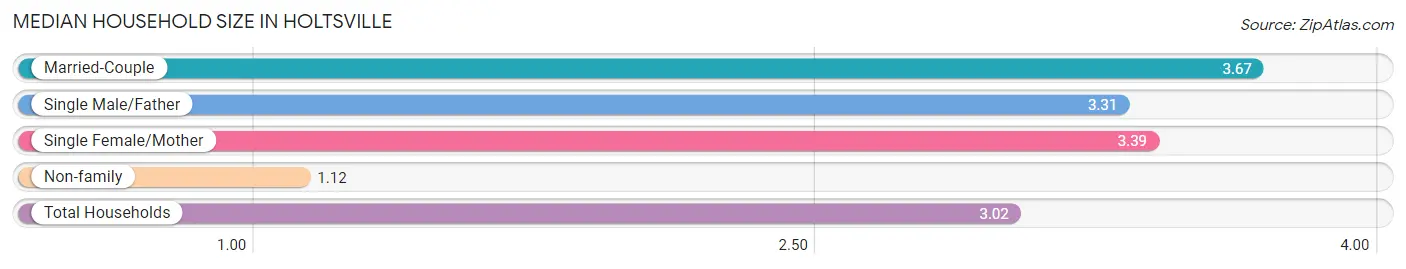
Median Household Size in Holtsville
The median household size in Holtsville is 3.02 persons per household, with married-couple households (3,789 | 58.8%) accounting for the largest median household size of 3.67 persons per household. non-family households (1,491 | 23.1%) represent the smallest median household size with 1.12 persons per household.
| Household Type | # Households | Household Size |
| Married-Couple | 3,789 (58.8%) | 3.67 |
| Single Male/Father | 464 (7.2%) | 3.31 |
| Single Female/Mother | 705 (10.9%) | 3.39 |
| Non-family | 1,491 (23.1%) | 1.12 |
| Total Households | 6,449 (100.0%) | 3.02 |
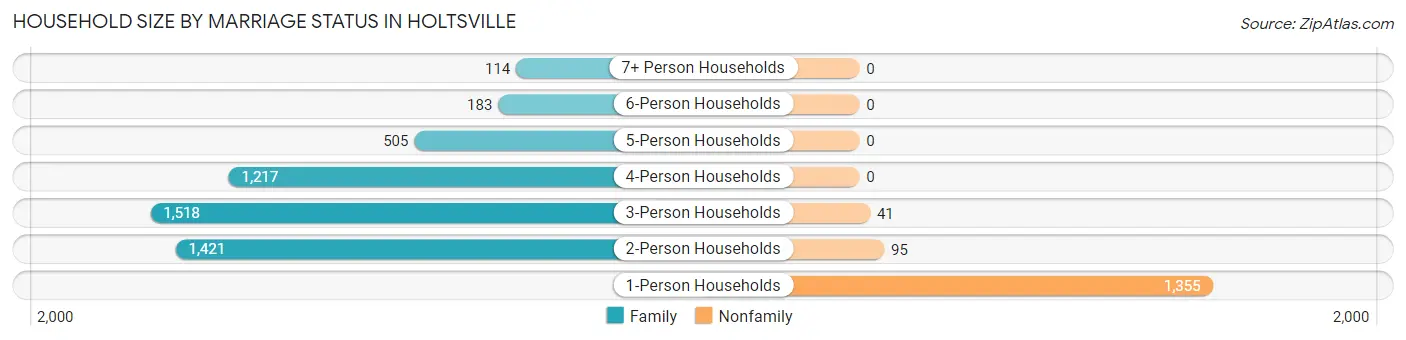
Household Size by Marriage Status in Holtsville
Out of a total of 6,449 households in Holtsville, 4,958 (76.9%) are family households, while 1,491 (23.1%) are nonfamily households. The most numerous type of family households are 3-person households, comprising 1,518, and the most common type of nonfamily households are 1-person households, comprising 1,355.
| Household Size | Family Households | Nonfamily Households |
| 1-Person Households | - | 1,355 (21.0%) |
| 2-Person Households | 1,421 (22.0%) | 95 (1.5%) |
| 3-Person Households | 1,518 (23.5%) | 41 (0.6%) |
| 4-Person Households | 1,217 (18.9%) | 0 (0.0%) |
| 5-Person Households | 505 (7.8%) | 0 (0.0%) |
| 6-Person Households | 183 (2.8%) | 0 (0.0%) |
| 7+ Person Households | 114 (1.8%) | 0 (0.0%) |
| Total | 4,958 (76.9%) | 1,491 (23.1%) |
Female Fertility in Holtsville
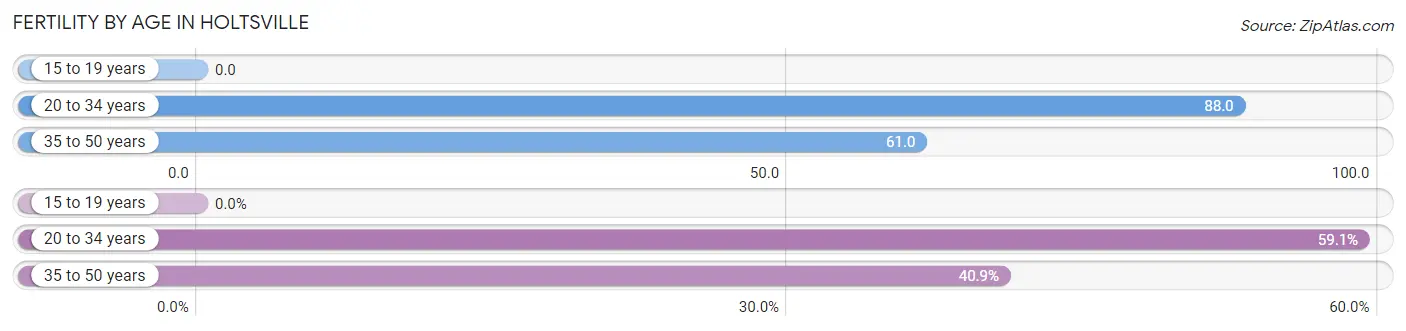
Fertility by Age in Holtsville
Average fertility rate in Holtsville is 65.0 births per 1,000 women. Women in the age bracket of 20 to 34 years have the highest fertility rate with 88.0 births per 1,000 women. Women in the age bracket of 20 to 34 years acount for 59.1% of all women with births.
| Age Bracket | Women with Births | Births / 1,000 Women |
| 15 to 19 years | 0 (0.0%) | 0.0 |
| 20 to 34 years | 178 (59.1%) | 88.0 |
| 35 to 50 years | 123 (40.9%) | 61.0 |
| Total | 301 (100.0%) | 65.0 |
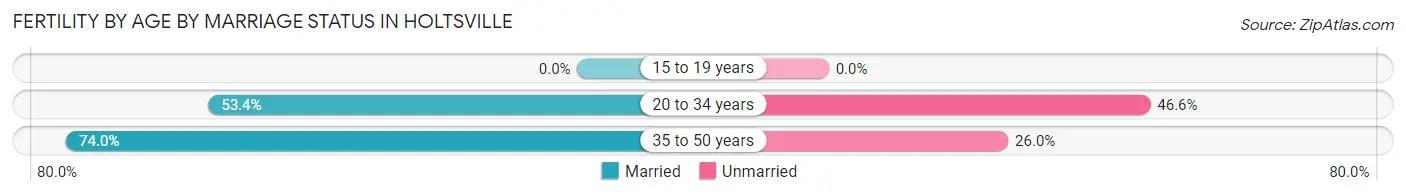
Fertility by Age by Marriage Status in Holtsville
61.8% of women with births (301) in Holtsville are married. The highest percentage of unmarried women with births falls into 20 to 34 years age bracket with 46.6% of them unmarried at the time of birth, while the lowest percentage of unmarried women with births belong to 35 to 50 years age bracket with 26.0% of them unmarried.
| Age Bracket | Married | Unmarried |
| 15 to 19 years | 0 (0.0%) | 0 (0.0%) |
| 20 to 34 years | 95 (53.4%) | 83 (46.6%) |
| 35 to 50 years | 91 (74.0%) | 32 (26.0%) |
| Total | 186 (61.8%) | 115 (38.2%) |
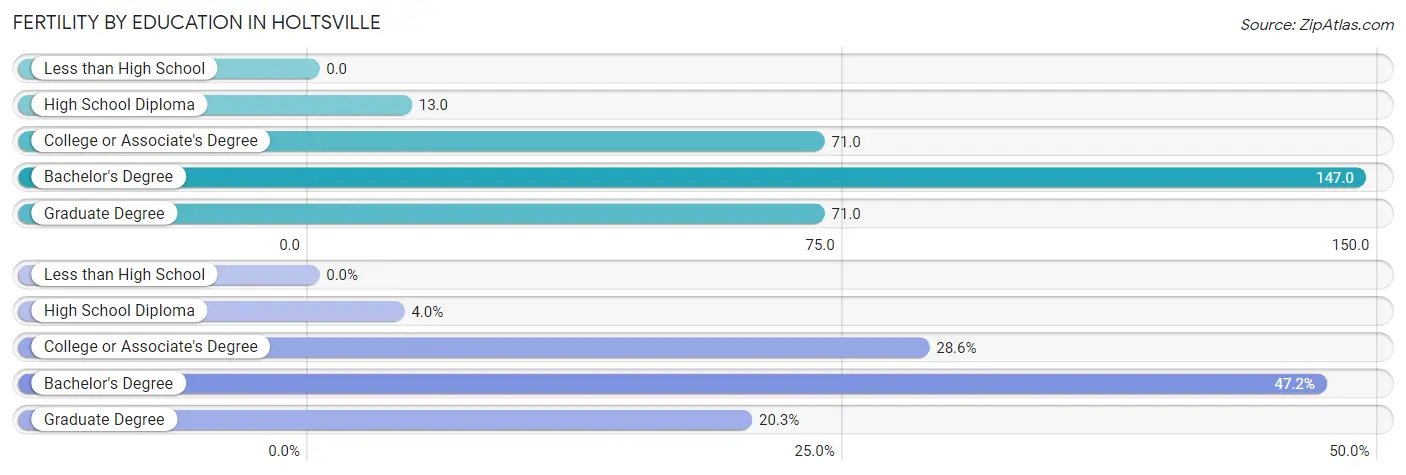
Fertility by Education in Holtsville
| Educational Attainment | Women with Births | Births / 1,000 Women |
| Less than High School | 0 (0.0%) | 0.0 |
| High School Diploma | 12 (4.0%) | 13.0 |
| College or Associate's Degree | 86 (28.6%) | 71.0 |
| Bachelor's Degree | 142 (47.2%) | 147.0 |
| Graduate Degree | 61 (20.3%) | 71.0 |
| Total | 301 (100.0%) | 65.0 |
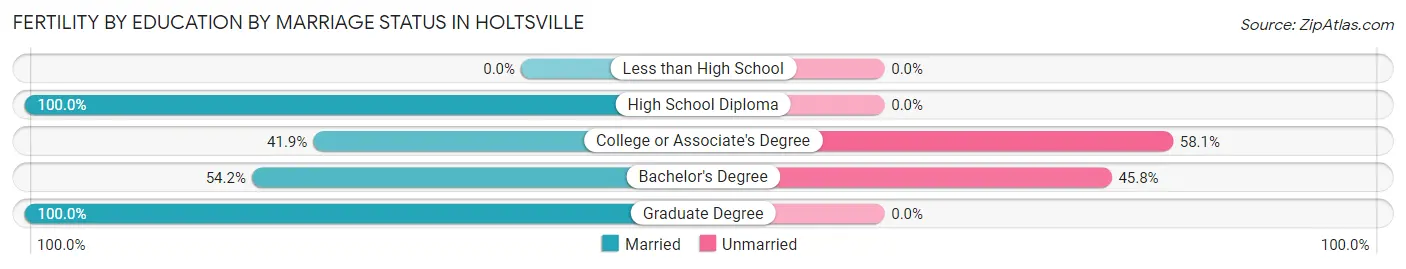
Fertility by Education by Marriage Status in Holtsville
38.2% of women with births in Holtsville are unmarried. Women with the educational attainment of high school diploma are most likely to be married with 100.0% of them married at childbirth, while women with the educational attainment of college or associate's degree are least likely to be married with 58.1% of them unmarried at childbirth.
| Educational Attainment | Married | Unmarried |
| Less than High School | 0 (0.0%) | 0 (0.0%) |
| High School Diploma | 12 (100.0%) | 0 (0.0%) |
| College or Associate's Degree | 36 (41.9%) | 50 (58.1%) |
| Bachelor's Degree | 77 (54.2%) | 65 (45.8%) |
| Graduate Degree | 61 (100.0%) | 0 (0.0%) |
| Total | 186 (61.8%) | 115 (38.2%) |
Income in Holtsville
Income Overview in Holtsville
Per Capita Income in Holtsville is $49,255, while median incomes of families and households are $144,087 and $128,444 respectively.
| Characteristic | Number | Measure |
| Per Capita Income | 19,597 | $49,255 |
| Median Family Income | 4,958 | $144,087 |
| Mean Family Income | 4,958 | $159,486 |
| Median Household Income | 6,449 | $128,444 |
| Mean Household Income | 6,449 | $144,722 |
| Income Deficit | 4,958 | $8,591 |
| Wage / Income Gap (%) | 19,597 | 35.96% |
| Wage / Income Gap ($) | 19,597 | 64.04¢ per $1 |
| Gini / Inequality Index | 19,597 | 0.39 |
Earnings by Sex in Holtsville
Average Earnings in Holtsville are $55,961, $68,814 for men and $44,066 for women, a difference of 36.0%.
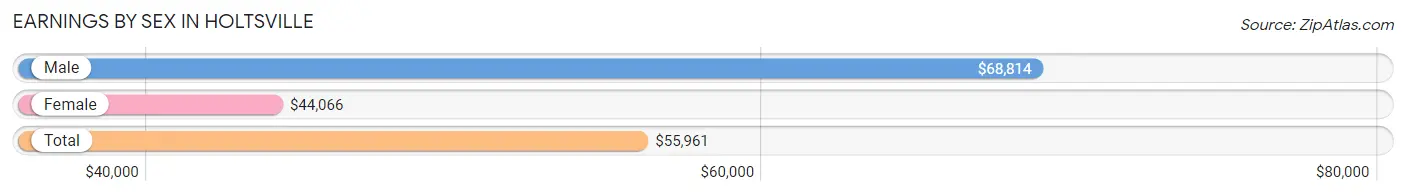
| Sex | Number | Average Earnings |
| Male | 6,089 (53.4%) | $68,814 |
| Female | 5,310 (46.6%) | $44,066 |
| Total | 11,399 (100.0%) | $55,961 |
Earnings by Sex by Income Bracket in Holtsville
The most common earnings brackets in Holtsville are $100,000+ for men (2,116 | 34.7%) and $75,000 to $99,999 for women (872 | 16.4%).
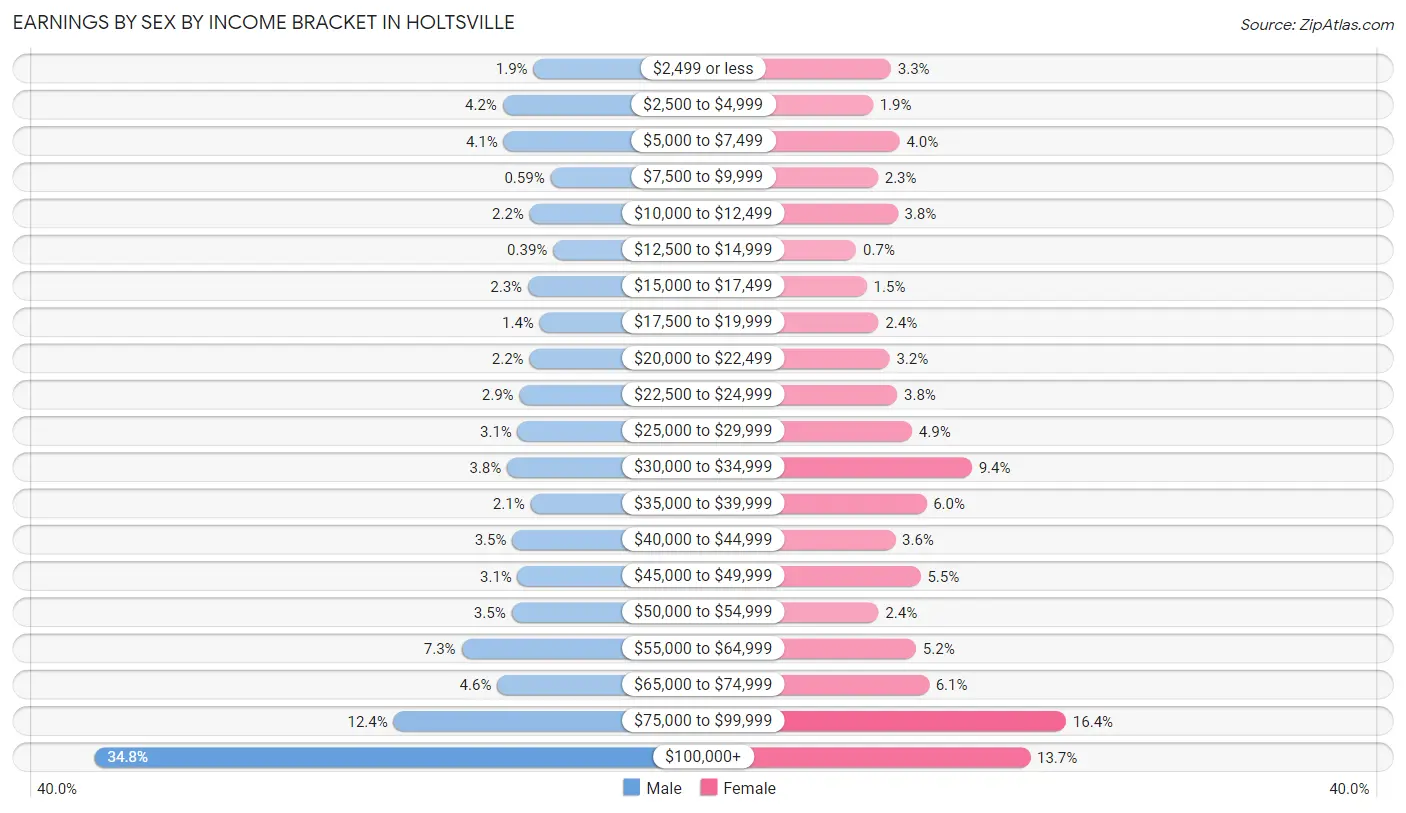
| Income | Male | Female |
| $2,499 or less | 114 (1.9%) | 175 (3.3%) |
| $2,500 to $4,999 | 254 (4.2%) | 103 (1.9%) |
| $5,000 to $7,499 | 250 (4.1%) | 210 (4.0%) |
| $7,500 to $9,999 | 36 (0.6%) | 123 (2.3%) |
| $10,000 to $12,499 | 131 (2.1%) | 202 (3.8%) |
| $12,500 to $14,999 | 24 (0.4%) | 37 (0.7%) |
| $15,000 to $17,499 | 139 (2.3%) | 79 (1.5%) |
| $17,500 to $19,999 | 85 (1.4%) | 126 (2.4%) |
| $20,000 to $22,499 | 132 (2.2%) | 170 (3.2%) |
| $22,500 to $24,999 | 178 (2.9%) | 200 (3.8%) |
| $25,000 to $29,999 | 186 (3.0%) | 259 (4.9%) |
| $30,000 to $34,999 | 234 (3.8%) | 497 (9.4%) |
| $35,000 to $39,999 | 127 (2.1%) | 316 (5.9%) |
| $40,000 to $44,999 | 210 (3.5%) | 192 (3.6%) |
| $45,000 to $49,999 | 186 (3.0%) | 293 (5.5%) |
| $50,000 to $54,999 | 214 (3.5%) | 126 (2.4%) |
| $55,000 to $64,999 | 442 (7.3%) | 275 (5.2%) |
| $65,000 to $74,999 | 279 (4.6%) | 326 (6.1%) |
| $75,000 to $99,999 | 752 (12.3%) | 872 (16.4%) |
| $100,000+ | 2,116 (34.7%) | 729 (13.7%) |
| Total | 6,089 (100.0%) | 5,310 (100.0%) |
Earnings by Sex by Educational Attainment in Holtsville
Average earnings in Holtsville are $79,688 for men and $48,658 for women, a difference of 38.9%. Men with an educational attainment of graduate degree enjoy the highest average annual earnings of $133,571, while those with less than high school education earn the least with $40,877. Women with an educational attainment of graduate degree earn the most with the average annual earnings of $88,611, while those with less than high school education have the smallest earnings of $23,646.
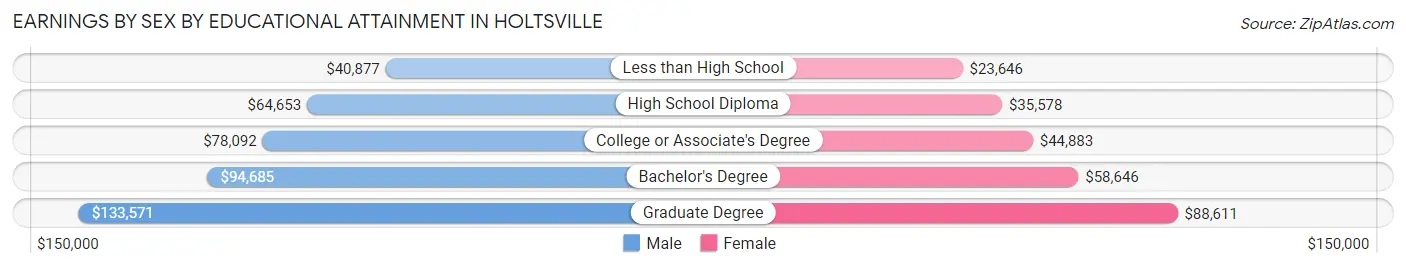
| Educational Attainment | Male Income | Female Income |
| Less than High School | $40,877 | $23,646 |
| High School Diploma | $64,653 | $35,578 |
| College or Associate's Degree | $78,092 | $44,883 |
| Bachelor's Degree | $94,685 | $58,646 |
| Graduate Degree | $133,571 | $88,611 |
| Total | $79,688 | $48,658 |
Family Income in Holtsville
Family Income Brackets in Holtsville
According to the Holtsville family income data, there are 1,339 families falling into the $200,000+ income range, which is the most common income bracket and makes up 27.0% of all families. Conversely, the less than $10,000 income bracket is the least frequent group with only 15 families (0.3%) belonging to this category.
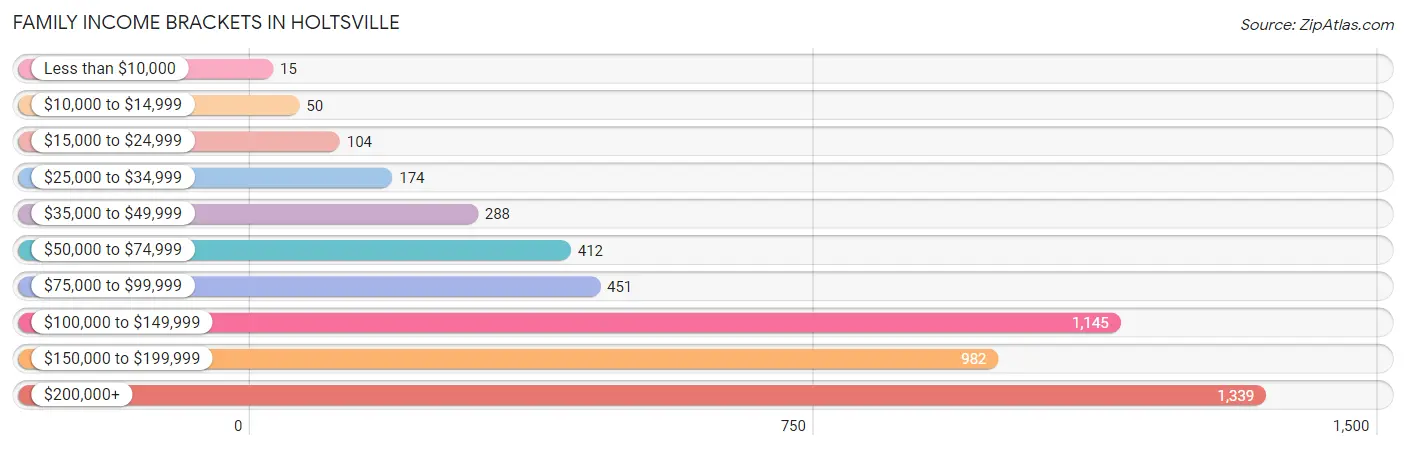
| Income Bracket | # Families | % Families |
| Less than $10,000 | 15 | 0.3% |
| $10,000 to $14,999 | 50 | 1.0% |
| $15,000 to $24,999 | 104 | 2.1% |
| $25,000 to $34,999 | 174 | 3.5% |
| $35,000 to $49,999 | 288 | 5.8% |
| $50,000 to $74,999 | 412 | 8.3% |
| $75,000 to $99,999 | 451 | 9.1% |
| $100,000 to $149,999 | 1,145 | 23.1% |
| $150,000 to $199,999 | 982 | 19.8% |
| $200,000+ | 1,339 | 27.0% |
Family Income by Famaliy Size in Holtsville
6-person families (161 | 3.3%) account for the highest median family income in Holtsville with $226,926 per family, while 2-person families (1,584 | 32.0%) have the highest median income of $54,678 per family member.
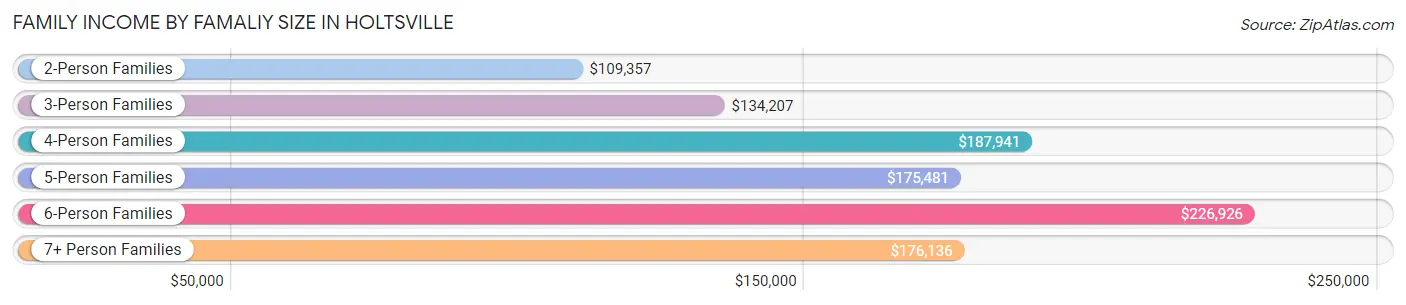
| Income Bracket | # Families | Median Income |
| 2-Person Families | 1,584 (32.0%) | $109,357 |
| 3-Person Families | 1,586 (32.0%) | $134,207 |
| 4-Person Families | 1,108 (22.4%) | $187,941 |
| 5-Person Families | 433 (8.7%) | $175,481 |
| 6-Person Families | 161 (3.3%) | $226,926 |
| 7+ Person Families | 86 (1.7%) | $176,136 |
| Total | 4,958 (100.0%) | $144,087 |
Family Income by Number of Earners in Holtsville
The median family income in Holtsville is $144,087, with families comprising 3+ earners (990) having the highest median family income of $206,000, while families with no earners (494) have the lowest median family income of $63,895, accounting for 20.0% and 10.0% of families, respectively.
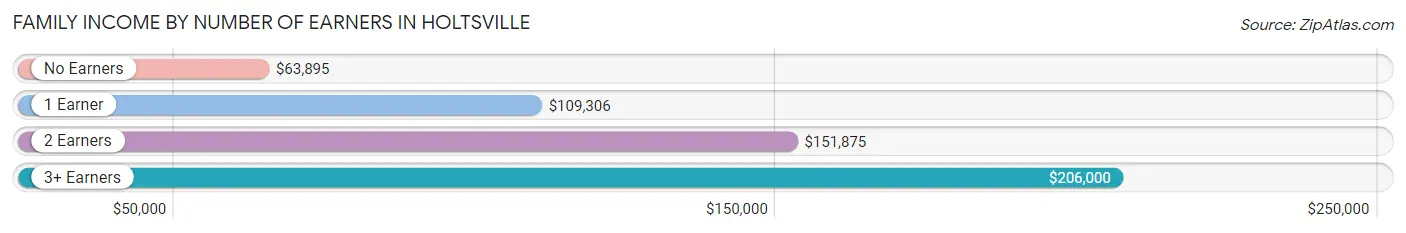
| Number of Earners | # Families | Median Income |
| No Earners | 494 (10.0%) | $63,895 |
| 1 Earner | 1,117 (22.5%) | $109,306 |
| 2 Earners | 2,357 (47.5%) | $151,875 |
| 3+ Earners | 990 (20.0%) | $206,000 |
| Total | 4,958 (100.0%) | $144,087 |
Household Income in Holtsville
Household Income Brackets in Holtsville
With 1,445 households falling in the category, the $200,000+ income range is the most frequent in Holtsville, accounting for 22.4% of all households. In contrast, only 84 households (1.3%) fall into the less than $10,000 income bracket, making it the least populous group.
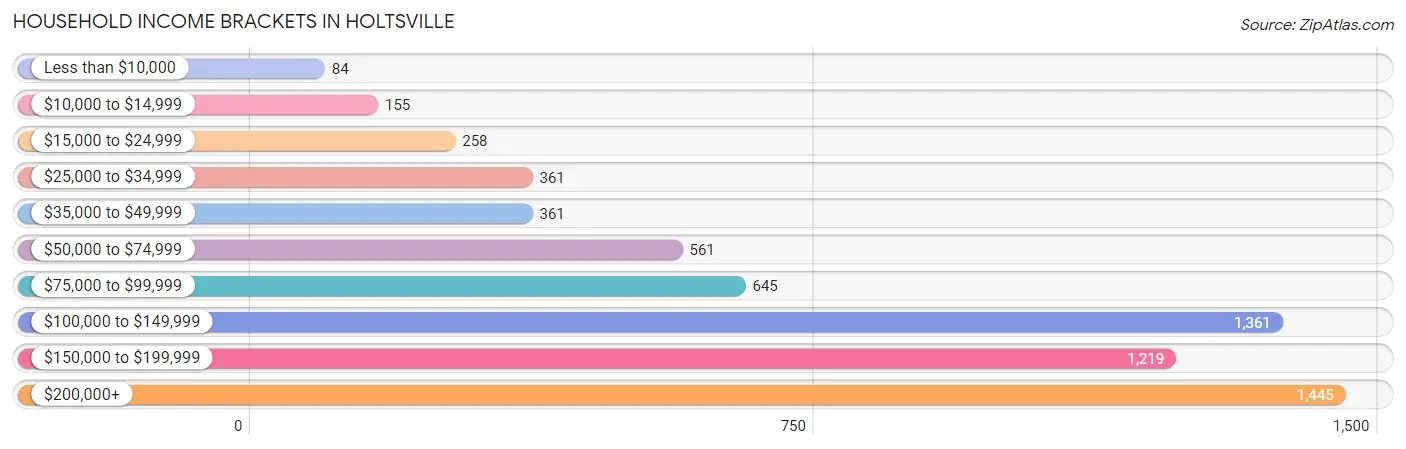
| Income Bracket | # Households | % Households |
| Less than $10,000 | 84 | 1.3% |
| $10,000 to $14,999 | 155 | 2.4% |
| $15,000 to $24,999 | 258 | 4.0% |
| $25,000 to $34,999 | 361 | 5.6% |
| $35,000 to $49,999 | 361 | 5.6% |
| $50,000 to $74,999 | 561 | 8.7% |
| $75,000 to $99,999 | 645 | 10.0% |
| $100,000 to $149,999 | 1,361 | 21.1% |
| $150,000 to $199,999 | 1,219 | 18.9% |
| $200,000+ | 1,445 | 22.4% |
Household Income by Householder Age in Holtsville
The median household income in Holtsville is $128,444, with the highest median household income of $151,583 found in the 25 to 44 years age bracket for the primary householder. A total of 2,061 households (32.0%) fall into this category. Meanwhile, the 15 to 24 years age bracket for the primary householder has the lowest median household income of $32,578, with 110 households (1.7%) in this group.
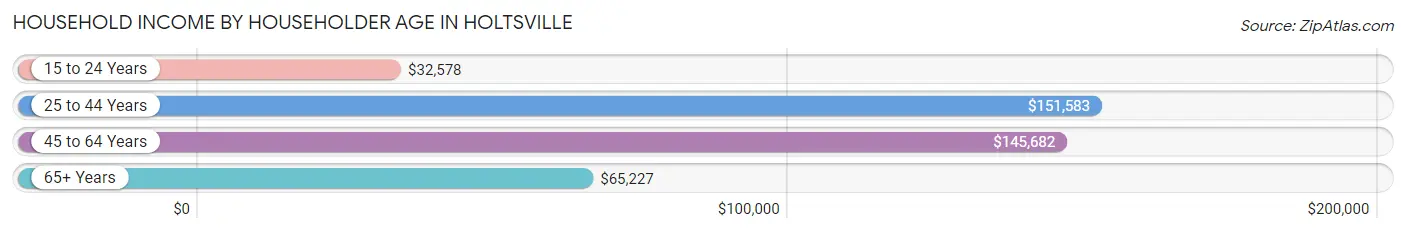
| Income Bracket | # Households | Median Income |
| 15 to 24 Years | 110 (1.7%) | $32,578 |
| 25 to 44 Years | 2,061 (32.0%) | $151,583 |
| 45 to 64 Years | 2,752 (42.7%) | $145,682 |
| 65+ Years | 1,526 (23.7%) | $65,227 |
| Total | 6,449 (100.0%) | $128,444 |
Poverty in Holtsville
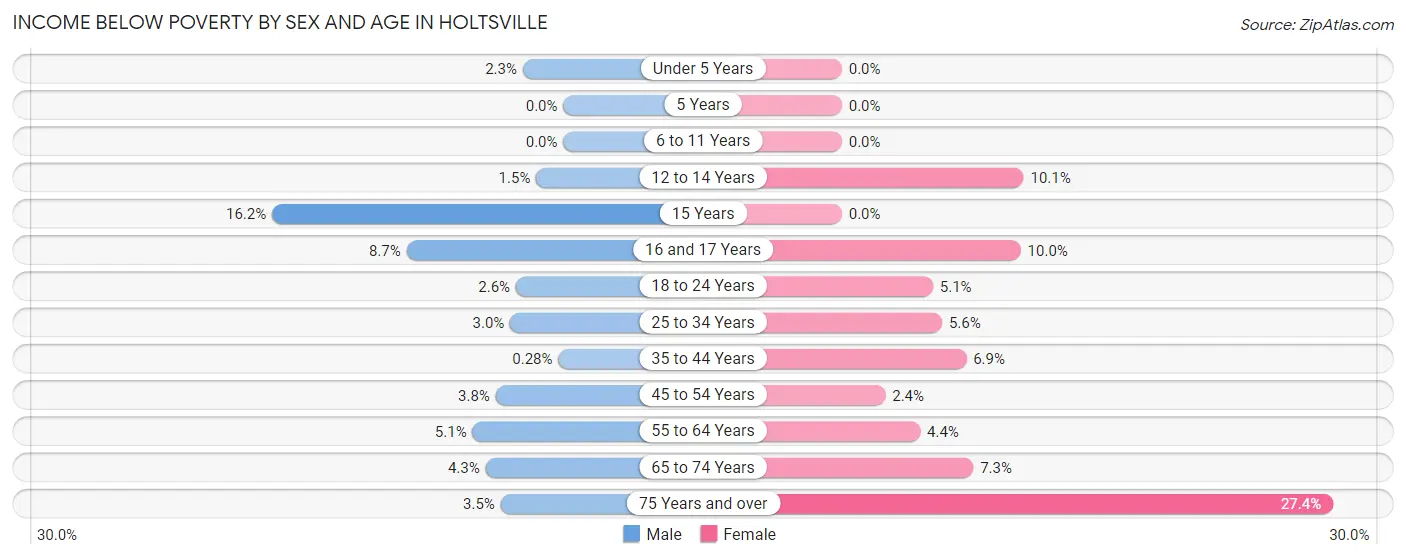
Income Below Poverty by Sex and Age in Holtsville
With 3.0% poverty level for males and 5.9% for females among the residents of Holtsville, 15 year old males and 75 year old and over females are the most vulnerable to poverty, with 24 males (16.2%) and 166 females (27.4%) in their respective age groups living below the poverty level.
| Age Bracket | Male | Female |
| Under 5 Years | 14 (2.3%) | 0 (0.0%) |
| 5 Years | 0 (0.0%) | 0 (0.0%) |
| 6 to 11 Years | 0 (0.0%) | 0 (0.0%) |
| 12 to 14 Years | 5 (1.5%) | 25 (10.1%) |
| 15 Years | 24 (16.2%) | 0 (0.0%) |
| 16 and 17 Years | 24 (8.7%) | 25 (10.0%) |
| 18 to 24 Years | 24 (2.6%) | 42 (5.1%) |
| 25 to 34 Years | 28 (3.0%) | 73 (5.6%) |
| 35 to 44 Years | 5 (0.3%) | 97 (6.9%) |
| 45 to 54 Years | 60 (3.8%) | 36 (2.4%) |
| 55 to 64 Years | 59 (5.1%) | 58 (4.4%) |
| 65 to 74 Years | 43 (4.3%) | 54 (7.3%) |
| 75 Years and over | 12 (3.5%) | 166 (27.4%) |
| Total | 298 (3.0%) | 576 (5.9%) |
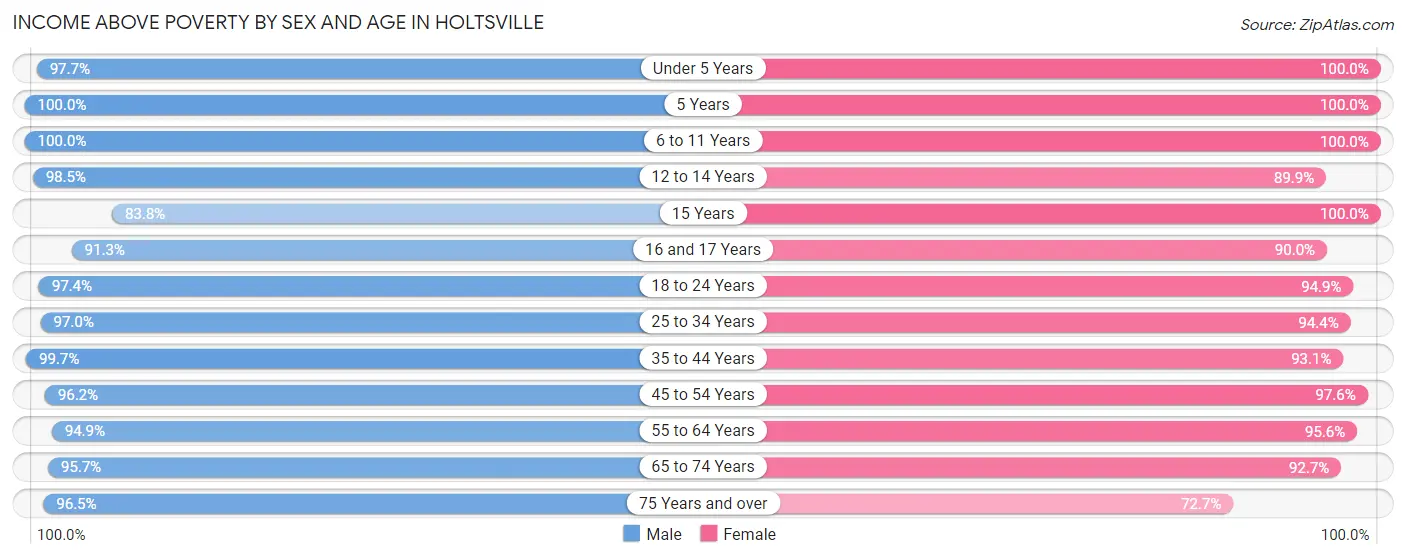
Income Above Poverty by Sex and Age in Holtsville
According to the poverty statistics in Holtsville, males aged 5 years and females aged under 5 years are the age groups that are most secure financially, with 100.0% of males and 100.0% of females in these age groups living above the poverty line.
| Age Bracket | Male | Female |
| Under 5 Years | 606 (97.7%) | 598 (100.0%) |
| 5 Years | 91 (100.0%) | 90 (100.0%) |
| 6 to 11 Years | 586 (100.0%) | 682 (100.0%) |
| 12 to 14 Years | 326 (98.5%) | 222 (89.9%) |
| 15 Years | 124 (83.8%) | 205 (100.0%) |
| 16 and 17 Years | 251 (91.3%) | 226 (90.0%) |
| 18 to 24 Years | 884 (97.4%) | 787 (94.9%) |
| 25 to 34 Years | 918 (97.0%) | 1,235 (94.4%) |
| 35 to 44 Years | 1,770 (99.7%) | 1,302 (93.1%) |
| 45 to 54 Years | 1,531 (96.2%) | 1,450 (97.6%) |
| 55 to 64 Years | 1,106 (94.9%) | 1,273 (95.6%) |
| 65 to 74 Years | 950 (95.7%) | 684 (92.7%) |
| 75 Years and over | 332 (96.5%) | 441 (72.7%) |
| Total | 9,475 (97.0%) | 9,195 (94.1%) |
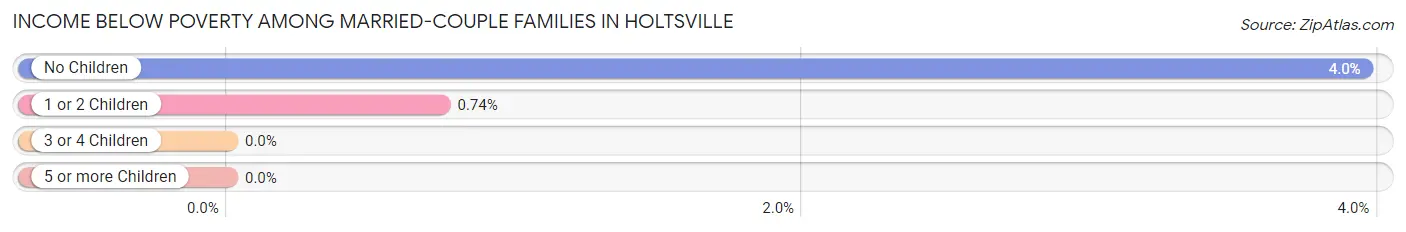
Income Below Poverty Among Married-Couple Families in Holtsville
The poverty statistics for married-couple families in Holtsville show that 2.4% or 90 of the total 3,789 families live below the poverty line. Families with no children have the highest poverty rate of 4.0%, comprising of 78 families. On the other hand, families with 3 or 4 children have the lowest poverty rate of 0.0%, which includes 0 families.
| Children | Above Poverty | Below Poverty |
| No Children | 1,896 (96.1%) | 78 (4.0%) |
| 1 or 2 Children | 1,607 (99.3%) | 12 (0.7%) |
| 3 or 4 Children | 176 (100.0%) | 0 (0.0%) |
| 5 or more Children | 20 (100.0%) | 0 (0.0%) |
| Total | 3,699 (97.6%) | 90 (2.4%) |
Income Below Poverty Among Single-Parent Households in Holtsville
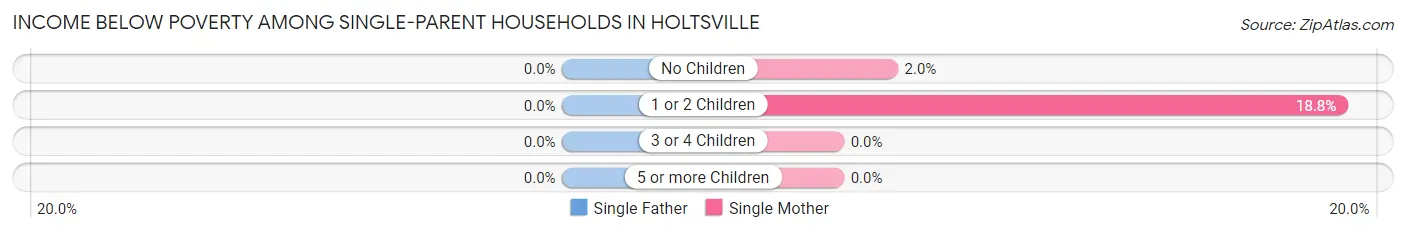
| Children | Single Father | Single Mother |
| No Children | 0 (0.0%) | 7 (2.0%) |
| 1 or 2 Children | 0 (0.0%) | 53 (18.8%) |
| 3 or 4 Children | 0 (0.0%) | 0 (0.0%) |
| 5 or more Children | 0 (0.0%) | 0 (0.0%) |
| Total | 0 (0.0%) | 60 (8.5%) |
Income Below Poverty Among Married-Couple vs Single-Parent Households in Holtsville
The poverty data for Holtsville shows that 90 of the married-couple family households (2.4%) and 60 of the single-parent households (5.1%) are living below the poverty level. Within the married-couple family households, those with no children have the highest poverty rate, with 78 households (4.0%) falling below the poverty line. Among the single-parent households, those with 1 or 2 children have the highest poverty rate, with 53 household (11.4%) living below poverty.
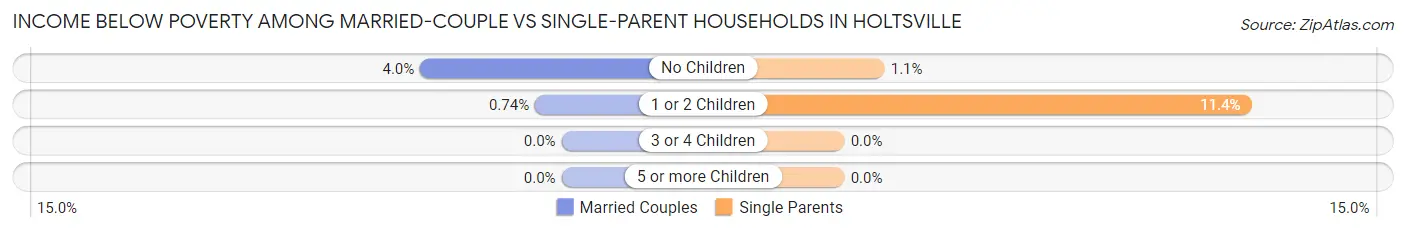
| Children | Married-Couple Families | Single-Parent Households |
| No Children | 78 (4.0%) | 7 (1.1%) |
| 1 or 2 Children | 12 (0.7%) | 53 (11.4%) |
| 3 or 4 Children | 0 (0.0%) | 0 (0.0%) |
| 5 or more Children | 0 (0.0%) | 0 (0.0%) |
| Total | 90 (2.4%) | 60 (5.1%) |
Employment Characteristics in Holtsville
Employment by Class of Employer in Holtsville
Among the 10,648 employed individuals in Holtsville, private company employees (7,072 | 66.4%), local government employees (1,204 | 11.3%), and not-for-profit organizations (693 | 6.5%) make up the most common classes of employment.
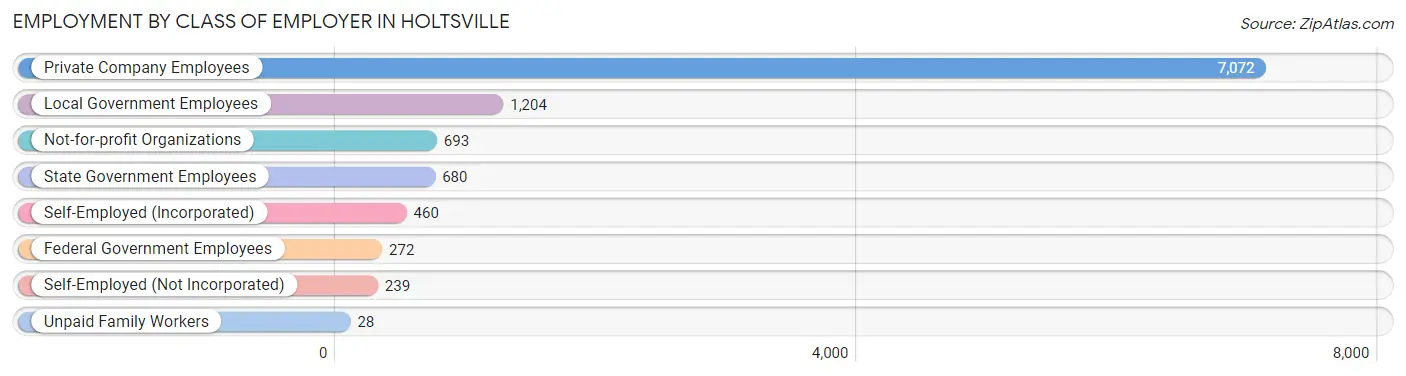
| Employer Class | # Employees | % Employees |
| Private Company Employees | 7,072 | 66.4% |
| Self-Employed (Incorporated) | 460 | 4.3% |
| Self-Employed (Not Incorporated) | 239 | 2.2% |
| Not-for-profit Organizations | 693 | 6.5% |
| Local Government Employees | 1,204 | 11.3% |
| State Government Employees | 680 | 6.4% |
| Federal Government Employees | 272 | 2.5% |
| Unpaid Family Workers | 28 | 0.3% |
| Total | 10,648 | 100.0% |
Employment Status by Age in Holtsville
According to the labor force statistics for Holtsville, out of the total population over 16 years of age (15,989), 69.9% or 11,176 individuals are in the labor force, with 3.1% or 346 of them unemployed. The age group with the highest labor force participation rate is 35 to 44 years, with 90.3% or 2,866 individuals in the labor force. Within the labor force, the 25 to 29 years age range has the highest percentage of unemployed individuals, with 6.8% or 68 of them being unemployed.
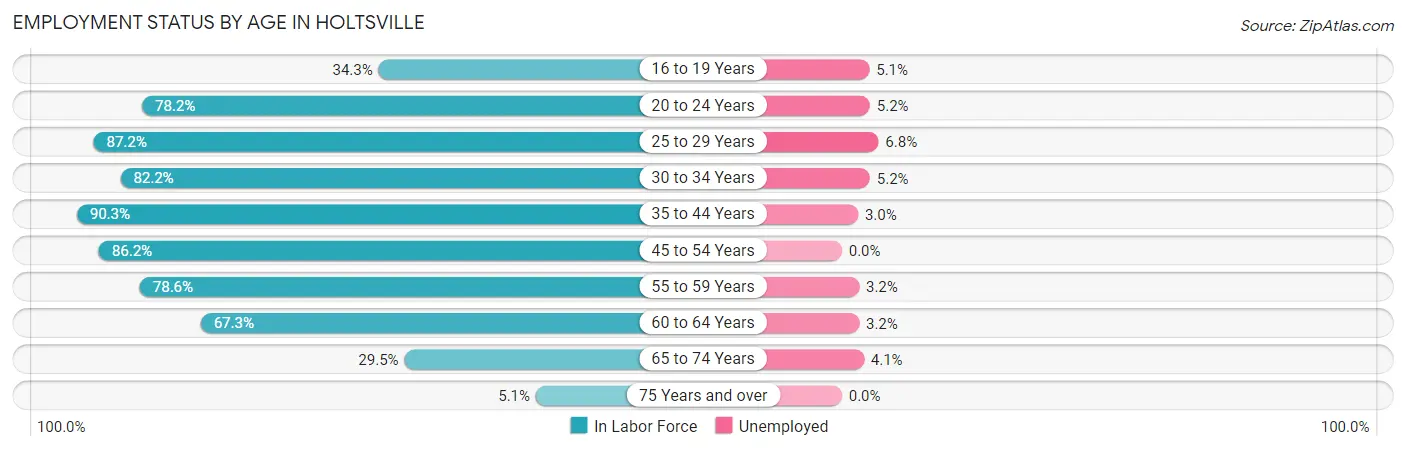
| Age Bracket | In Labor Force | Unemployed |
| 16 to 19 Years | 334 (34.3%) | 17 (5.1%) |
| 20 to 24 Years | 1,016 (78.2%) | 53 (5.2%) |
| 25 to 29 Years | 1,003 (87.2%) | 68 (6.8%) |
| 30 to 34 Years | 907 (82.2%) | 47 (5.2%) |
| 35 to 44 Years | 2,866 (90.3%) | 86 (3.0%) |
| 45 to 54 Years | 2,652 (86.2%) | 0 (0.0%) |
| 55 to 59 Years | 1,085 (78.6%) | 35 (3.2%) |
| 60 to 64 Years | 751 (67.3%) | 24 (3.2%) |
| 65 to 74 Years | 511 (29.5%) | 21 (4.1%) |
| 75 Years and over | 50 (5.1%) | 0 (0.0%) |
| Total | 11,176 (69.9%) | 346 (3.1%) |
Employment Status by Educational Attainment in Holtsville
According to labor force statistics for Holtsville, 84.2% of individuals (9,263) out of the total population between 25 and 64 years of age (11,001) are in the labor force, with 2.8% or 259 of them being unemployed. The group with the highest labor force participation rate are those with the educational attainment of bachelor's degree or higher, with 92.8% or 3,690 individuals in the labor force. Within the labor force, individuals with high school diploma education have the highest percentage of unemployment, with 5.8% or 144 of them being unemployed.
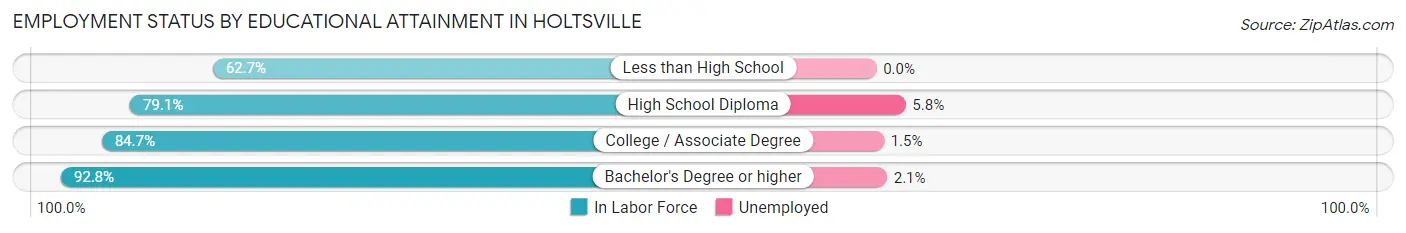
| Educational Attainment | In Labor Force | Unemployed |
| Less than High School | 571 (62.7%) | 0 (0.0%) |
| High School Diploma | 2,484 (79.1%) | 182 (5.8%) |
| College / Associate Degree | 2,520 (84.7%) | 45 (1.5%) |
| Bachelor's Degree or higher | 3,690 (92.8%) | 83 (2.1%) |
| Total | 9,263 (84.2%) | 308 (2.8%) |
Employment Occupations by Sex in Holtsville
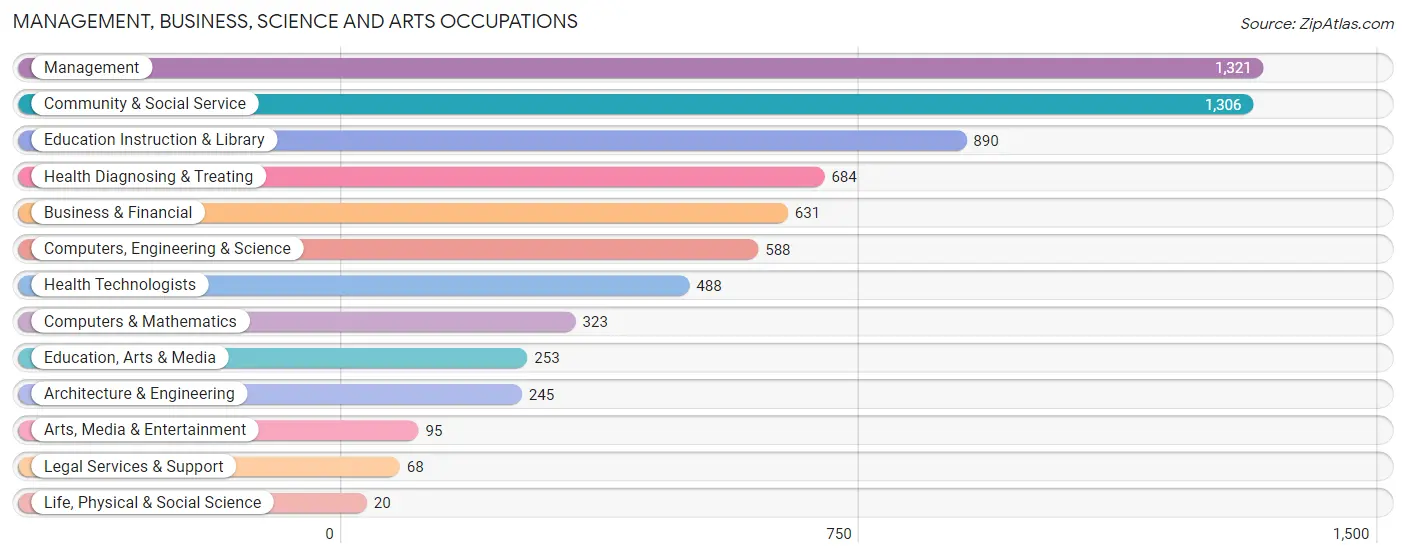
Management, Business, Science and Arts Occupations
The most common Management, Business, Science and Arts occupations in Holtsville are Management (1,321 | 12.2%), Community & Social Service (1,306 | 12.1%), Education Instruction & Library (890 | 8.2%), Health Diagnosing & Treating (684 | 6.3%), and Business & Financial (631 | 5.8%).
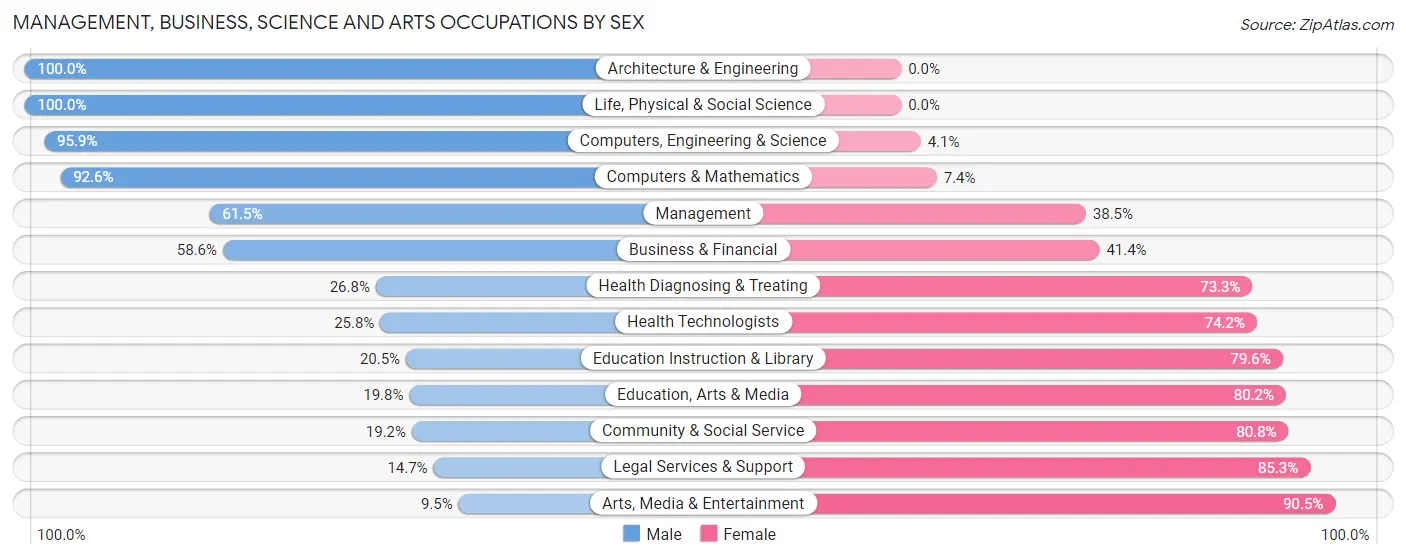
Management, Business, Science and Arts Occupations by Sex
Within the Management, Business, Science and Arts occupations in Holtsville, the most male-oriented occupations are Architecture & Engineering (100.0%), Life, Physical & Social Science (100.0%), and Computers, Engineering & Science (95.9%), while the most female-oriented occupations are Arts, Media & Entertainment (90.5%), Legal Services & Support (85.3%), and Community & Social Service (80.8%).
| Occupation | Male | Female |
| Management | 812 (61.5%) | 509 (38.5%) |
| Business & Financial | 370 (58.6%) | 261 (41.4%) |
| Computers, Engineering & Science | 564 (95.9%) | 24 (4.1%) |
| Computers & Mathematics | 299 (92.6%) | 24 (7.4%) |
| Architecture & Engineering | 245 (100.0%) | 0 (0.0%) |
| Life, Physical & Social Science | 20 (100.0%) | 0 (0.0%) |
| Community & Social Service | 251 (19.2%) | 1,055 (80.8%) |
| Education, Arts & Media | 50 (19.8%) | 203 (80.2%) |
| Legal Services & Support | 10 (14.7%) | 58 (85.3%) |
| Education Instruction & Library | 182 (20.4%) | 708 (79.5%) |
| Arts, Media & Entertainment | 9 (9.5%) | 86 (90.5%) |
| Health Diagnosing & Treating | 183 (26.8%) | 501 (73.3%) |
| Health Technologists | 126 (25.8%) | 362 (74.2%) |
| Total (Category) | 2,180 (48.1%) | 2,350 (51.9%) |
| Total (Overall) | 5,766 (53.3%) | 5,057 (46.7%) |
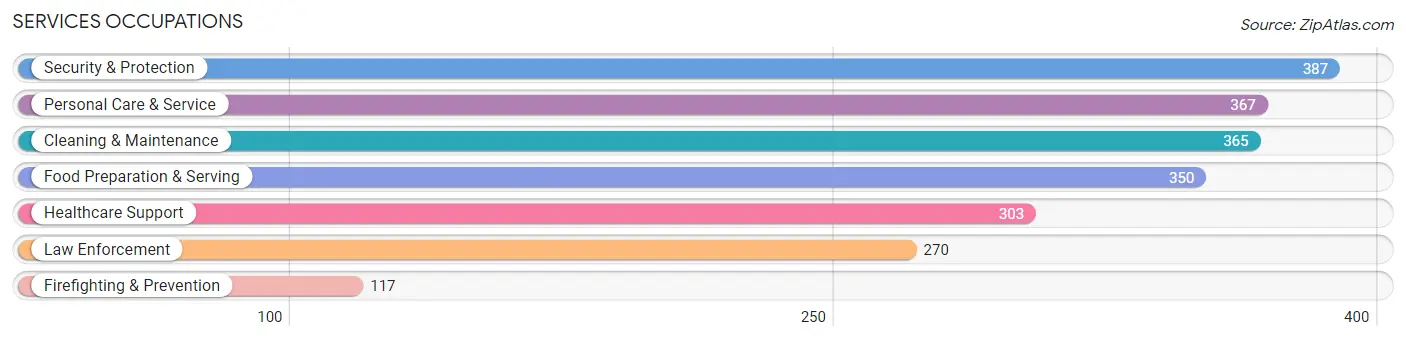
Services Occupations
The most common Services occupations in Holtsville are Security & Protection (387 | 3.6%), Personal Care & Service (367 | 3.4%), Cleaning & Maintenance (365 | 3.4%), Food Preparation & Serving (350 | 3.2%), and Healthcare Support (303 | 2.8%).
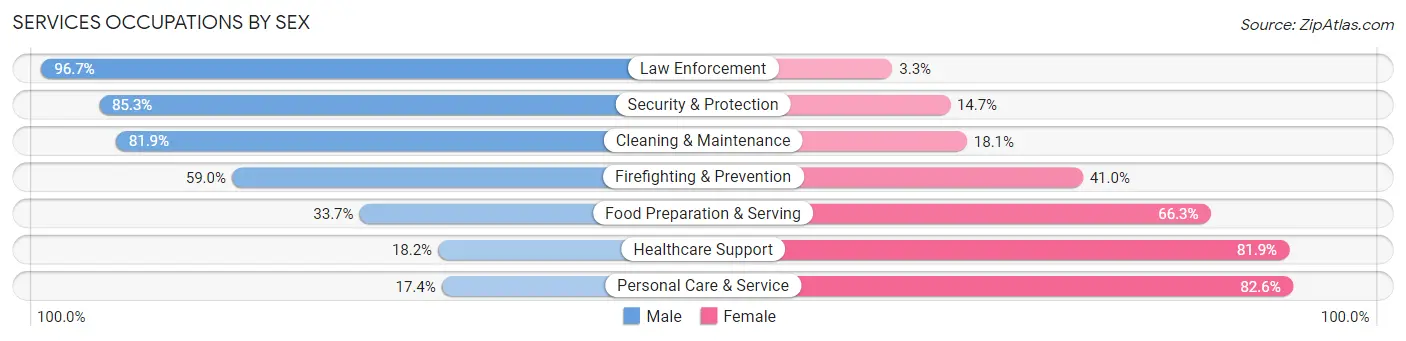
Services Occupations by Sex
Within the Services occupations in Holtsville, the most male-oriented occupations are Law Enforcement (96.7%), Security & Protection (85.3%), and Cleaning & Maintenance (81.9%), while the most female-oriented occupations are Personal Care & Service (82.6%), Healthcare Support (81.9%), and Food Preparation & Serving (66.3%).
| Occupation | Male | Female |
| Healthcare Support | 55 (18.1%) | 248 (81.9%) |
| Security & Protection | 330 (85.3%) | 57 (14.7%) |
| Firefighting & Prevention | 69 (59.0%) | 48 (41.0%) |
| Law Enforcement | 261 (96.7%) | 9 (3.3%) |
| Food Preparation & Serving | 118 (33.7%) | 232 (66.3%) |
| Cleaning & Maintenance | 299 (81.9%) | 66 (18.1%) |
| Personal Care & Service | 64 (17.4%) | 303 (82.6%) |
| Total (Category) | 866 (48.9%) | 906 (51.1%) |
| Total (Overall) | 5,766 (53.3%) | 5,057 (46.7%) |
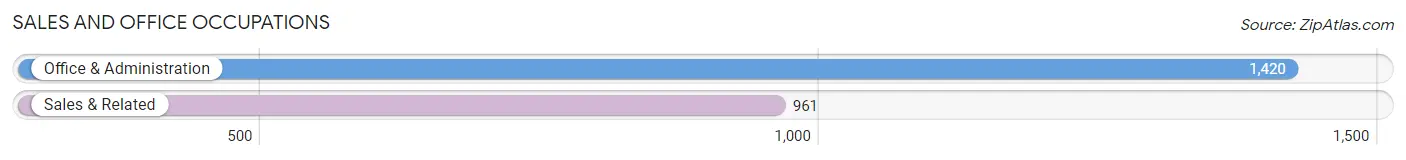
Sales and Office Occupations
The most common Sales and Office occupations in Holtsville are Office & Administration (1,420 | 13.1%), and Sales & Related (961 | 8.9%).
Sales and Office Occupations by Sex
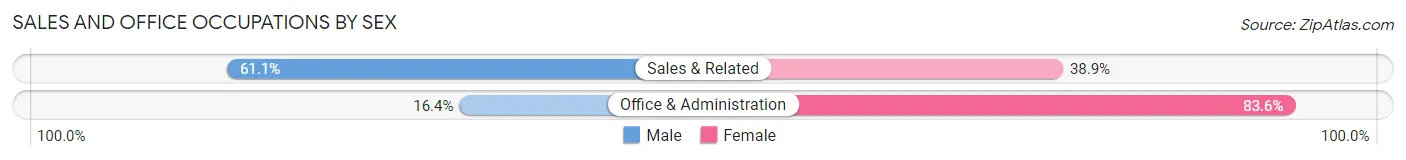
| Occupation | Male | Female |
| Sales & Related | 587 (61.1%) | 374 (38.9%) |
| Office & Administration | 233 (16.4%) | 1,187 (83.6%) |
| Total (Category) | 820 (34.4%) | 1,561 (65.6%) |
| Total (Overall) | 5,766 (53.3%) | 5,057 (46.7%) |
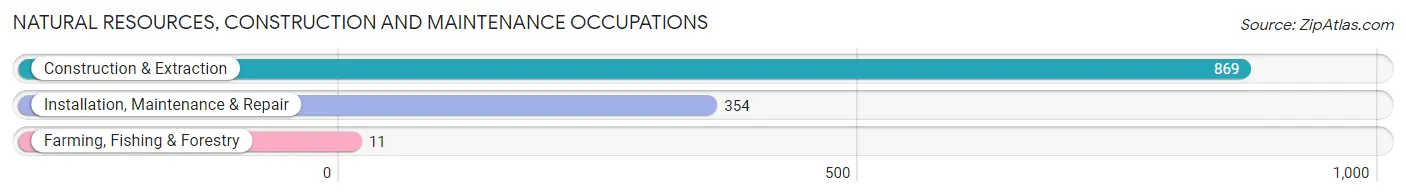
Natural Resources, Construction and Maintenance Occupations
The most common Natural Resources, Construction and Maintenance occupations in Holtsville are Construction & Extraction (869 | 8.0%), Installation, Maintenance & Repair (354 | 3.3%), and Farming, Fishing & Forestry (11 | 0.1%).
Natural Resources, Construction and Maintenance Occupations by Sex
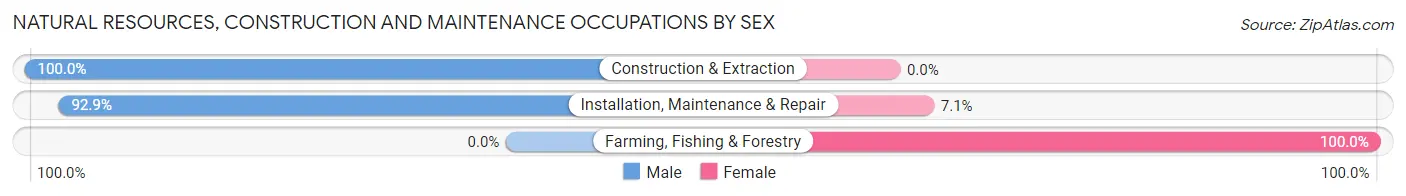
| Occupation | Male | Female |
| Farming, Fishing & Forestry | 0 (0.0%) | 11 (100.0%) |
| Construction & Extraction | 869 (100.0%) | 0 (0.0%) |
| Installation, Maintenance & Repair | 329 (92.9%) | 25 (7.1%) |
| Total (Category) | 1,198 (97.1%) | 36 (2.9%) |
| Total (Overall) | 5,766 (53.3%) | 5,057 (46.7%) |
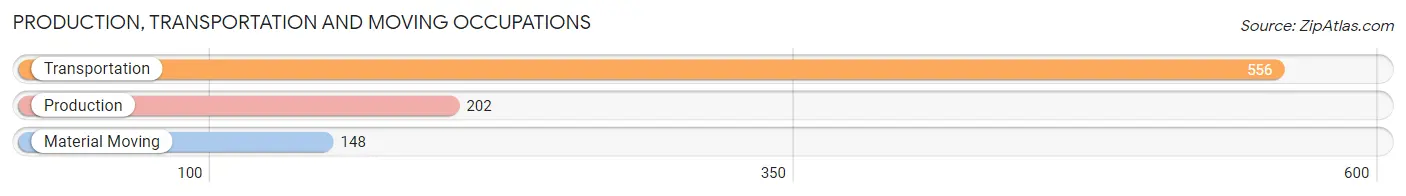
Production, Transportation and Moving Occupations
The most common Production, Transportation and Moving occupations in Holtsville are Transportation (556 | 5.1%), Production (202 | 1.9%), and Material Moving (148 | 1.4%).
Production, Transportation and Moving Occupations by Sex
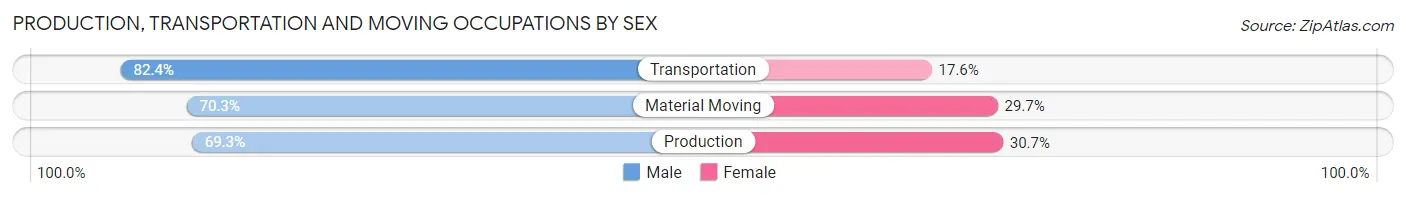
| Occupation | Male | Female |
| Production | 140 (69.3%) | 62 (30.7%) |
| Transportation | 458 (82.4%) | 98 (17.6%) |
| Material Moving | 104 (70.3%) | 44 (29.7%) |
| Total (Category) | 702 (77.5%) | 204 (22.5%) |
| Total (Overall) | 5,766 (53.3%) | 5,057 (46.7%) |
Employment Industries by Sex in Holtsville
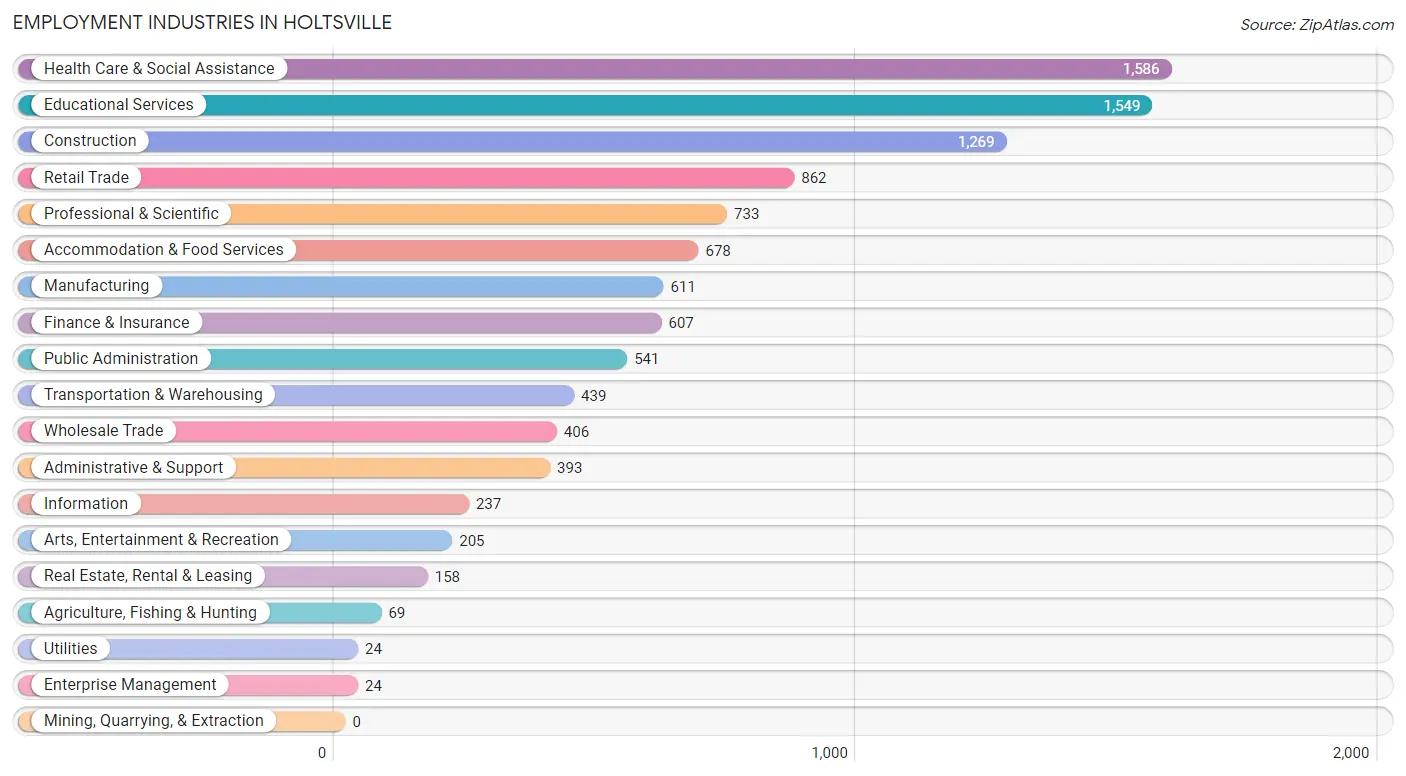
Employment Industries in Holtsville
The major employment industries in Holtsville include Health Care & Social Assistance (1,586 | 14.6%), Educational Services (1,549 | 14.3%), Construction (1,269 | 11.7%), Retail Trade (862 | 8.0%), and Professional & Scientific (733 | 6.8%).
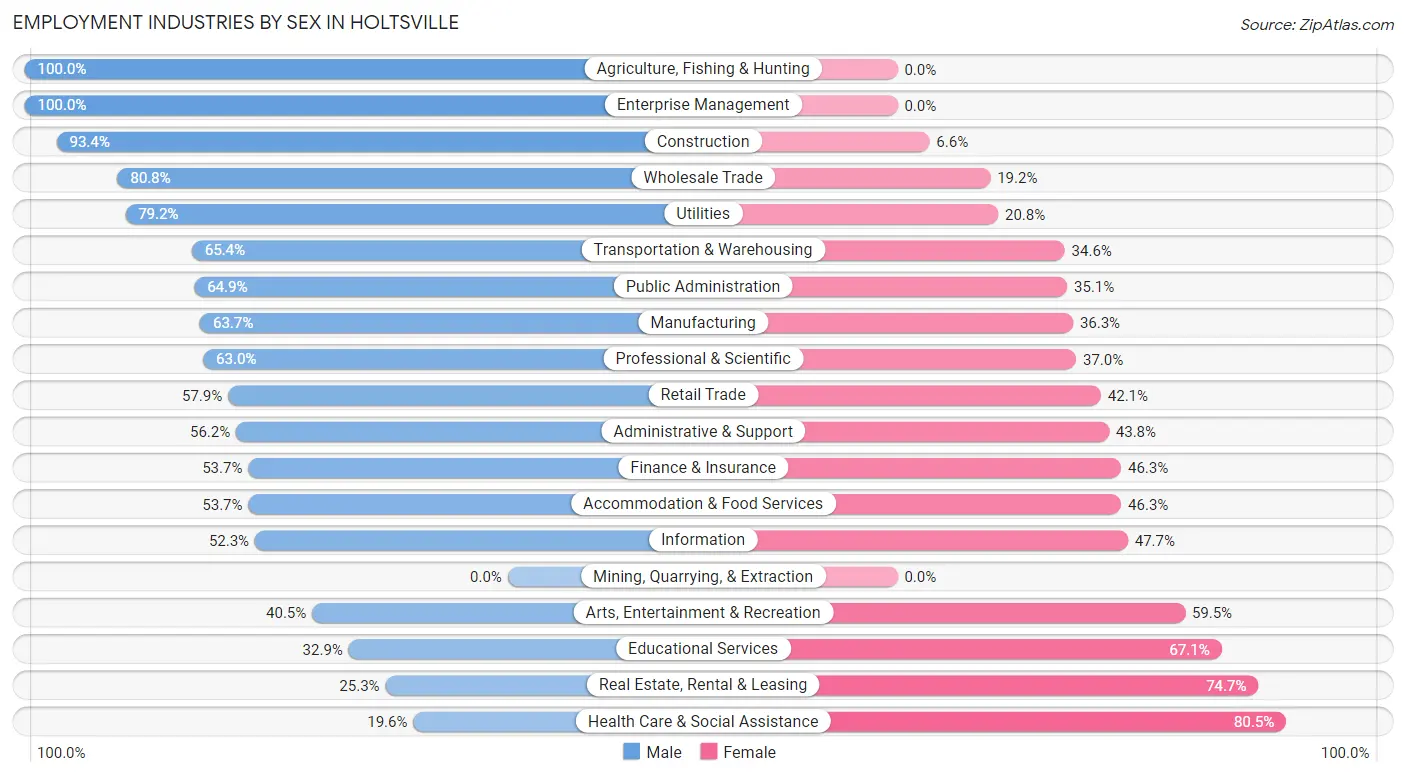
Employment Industries by Sex in Holtsville
The Holtsville industries that see more men than women are Agriculture, Fishing & Hunting (100.0%), Enterprise Management (100.0%), and Construction (93.4%), whereas the industries that tend to have a higher number of women are Health Care & Social Assistance (80.4%), Real Estate, Rental & Leasing (74.7%), and Educational Services (67.1%).
| Industry | Male | Female |
| Agriculture, Fishing & Hunting | 69 (100.0%) | 0 (0.0%) |
| Mining, Quarrying, & Extraction | 0 (0.0%) | 0 (0.0%) |
| Construction | 1,185 (93.4%) | 84 (6.6%) |
| Manufacturing | 389 (63.7%) | 222 (36.3%) |
| Wholesale Trade | 328 (80.8%) | 78 (19.2%) |
| Retail Trade | 499 (57.9%) | 363 (42.1%) |
| Transportation & Warehousing | 287 (65.4%) | 152 (34.6%) |
| Utilities | 19 (79.2%) | 5 (20.8%) |
| Information | 124 (52.3%) | 113 (47.7%) |
| Finance & Insurance | 326 (53.7%) | 281 (46.3%) |
| Real Estate, Rental & Leasing | 40 (25.3%) | 118 (74.7%) |
| Professional & Scientific | 462 (63.0%) | 271 (37.0%) |
| Enterprise Management | 24 (100.0%) | 0 (0.0%) |
| Administrative & Support | 221 (56.2%) | 172 (43.8%) |
| Educational Services | 510 (32.9%) | 1,039 (67.1%) |
| Health Care & Social Assistance | 310 (19.6%) | 1,276 (80.4%) |
| Arts, Entertainment & Recreation | 83 (40.5%) | 122 (59.5%) |
| Accommodation & Food Services | 364 (53.7%) | 314 (46.3%) |
| Public Administration | 351 (64.9%) | 190 (35.1%) |
| Total | 5,766 (53.3%) | 5,057 (46.7%) |
Education in Holtsville
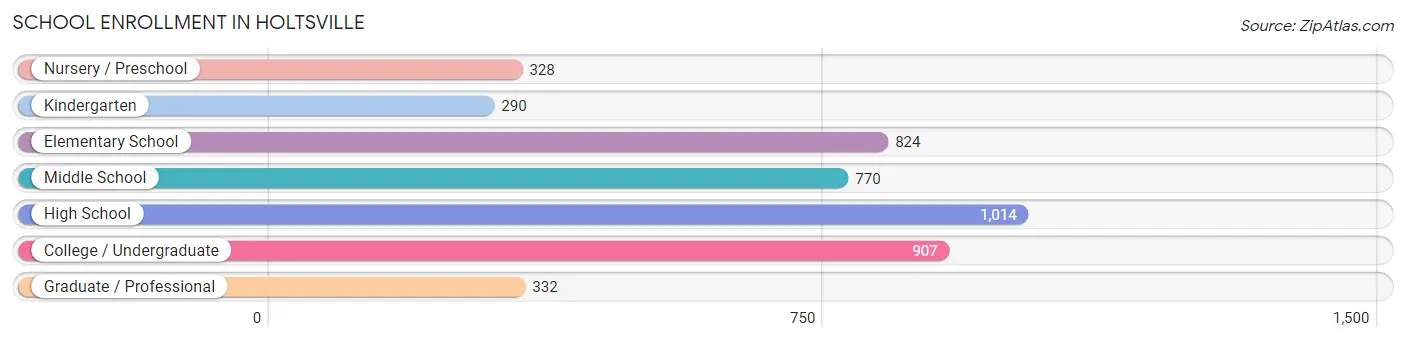
School Enrollment in Holtsville
The most common levels of schooling among the 4,465 students in Holtsville are high school (1,014 | 22.7%), college / undergraduate (907 | 20.3%), and elementary school (824 | 18.4%).
| School Level | # Students | % Students |
| Nursery / Preschool | 328 | 7.3% |
| Kindergarten | 290 | 6.5% |
| Elementary School | 824 | 18.4% |
| Middle School | 770 | 17.2% |
| High School | 1,014 | 22.7% |
| College / Undergraduate | 907 | 20.3% |
| Graduate / Professional | 332 | 7.4% |
| Total | 4,465 | 100.0% |
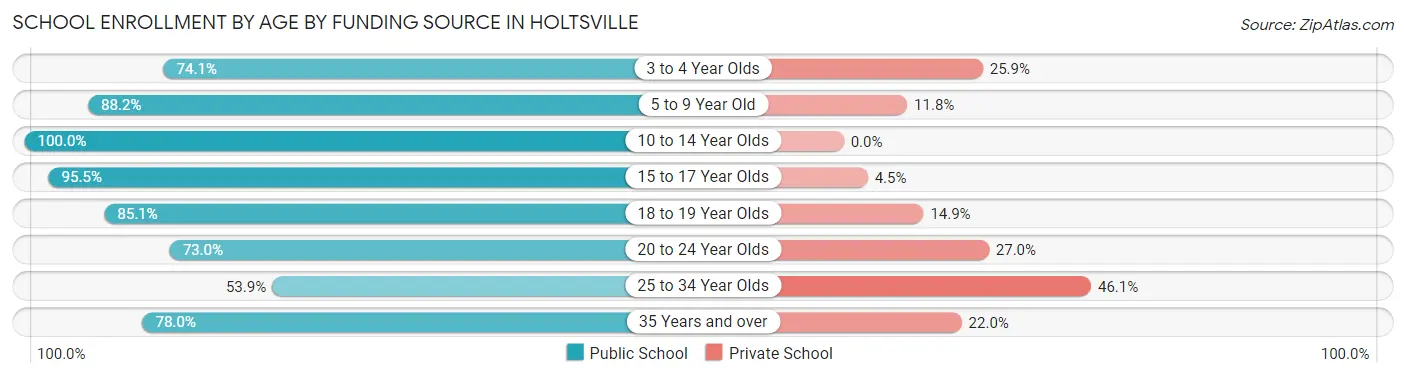
School Enrollment by Age by Funding Source in Holtsville
Out of a total of 4,465 students who are enrolled in schools in Holtsville, 638 (14.3%) attend a private institution, while the remaining 3,827 (85.7%) are enrolled in public schools. The age group of 25 to 34 year olds has the highest likelihood of being enrolled in private schools, with 153 (46.1% in the age bracket) enrolled. Conversely, the age group of 10 to 14 year olds has the lowest likelihood of being enrolled in a private school, with 875 (100.0% in the age bracket) attending a public institution.
| Age Bracket | Public School | Private School |
| 3 to 4 Year Olds | 243 (74.1%) | 85 (25.9%) |
| 5 to 9 Year Old | 932 (88.2%) | 125 (11.8%) |
| 10 to 14 Year Olds | 875 (100.0%) | 0 (0.0%) |
| 15 to 17 Year Olds | 788 (95.5%) | 37 (4.5%) |
| 18 to 19 Year Olds | 235 (85.1%) | 41 (14.9%) |
| 20 to 24 Year Olds | 394 (73.0%) | 146 (27.0%) |
| 25 to 34 Year Olds | 179 (53.9%) | 153 (46.1%) |
| 35 Years and over | 181 (78.0%) | 51 (22.0%) |
| Total | 3,827 (85.7%) | 638 (14.3%) |
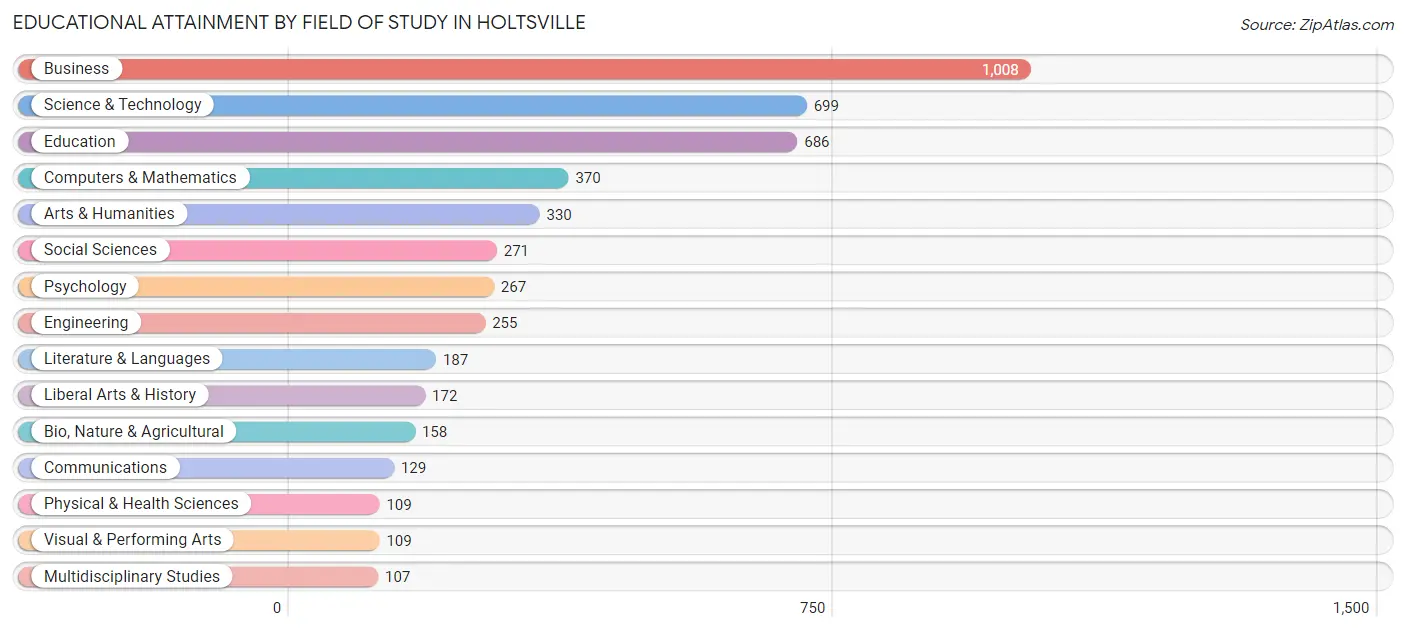
Educational Attainment by Field of Study in Holtsville
Business (1,008 | 20.7%), science & technology (699 | 14.4%), education (686 | 14.1%), computers & mathematics (370 | 7.6%), and arts & humanities (330 | 6.8%) are the most common fields of study among 4,857 individuals in Holtsville who have obtained a bachelor's degree or higher.
| Field of Study | # Graduates | % Graduates |
| Computers & Mathematics | 370 | 7.6% |
| Bio, Nature & Agricultural | 158 | 3.3% |
| Physical & Health Sciences | 109 | 2.2% |
| Psychology | 267 | 5.5% |
| Social Sciences | 271 | 5.6% |
| Engineering | 255 | 5.2% |
| Multidisciplinary Studies | 107 | 2.2% |
| Science & Technology | 699 | 14.4% |
| Business | 1,008 | 20.7% |
| Education | 686 | 14.1% |
| Literature & Languages | 187 | 3.8% |
| Liberal Arts & History | 172 | 3.5% |
| Visual & Performing Arts | 109 | 2.2% |
| Communications | 129 | 2.7% |
| Arts & Humanities | 330 | 6.8% |
| Total | 4,857 | 100.0% |
Transportation & Commute in Holtsville
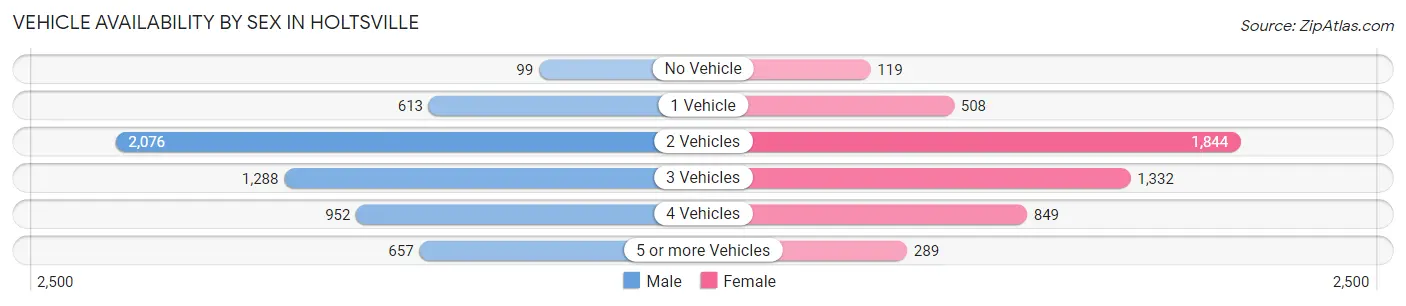
Vehicle Availability by Sex in Holtsville
The most prevalent vehicle ownership categories in Holtsville are males with 2 vehicles (2,076, accounting for 36.5%) and females with 2 vehicles (1,844, making up 42.0%).
| Vehicles Available | Male | Female |
| No Vehicle | 99 (1.7%) | 119 (2.4%) |
| 1 Vehicle | 613 (10.8%) | 508 (10.3%) |
| 2 Vehicles | 2,076 (36.5%) | 1,844 (37.3%) |
| 3 Vehicles | 1,288 (22.7%) | 1,332 (27.0%) |
| 4 Vehicles | 952 (16.8%) | 849 (17.2%) |
| 5 or more Vehicles | 657 (11.6%) | 289 (5.9%) |
| Total | 5,685 (100.0%) | 4,941 (100.0%) |
Commute Time in Holtsville
The most frequently occuring commute durations in Holtsville are 30 to 34 minutes (1,920 commuters, 19.2%), 20 to 24 minutes (1,530 commuters, 15.3%), and 15 to 19 minutes (1,473 commuters, 14.7%).
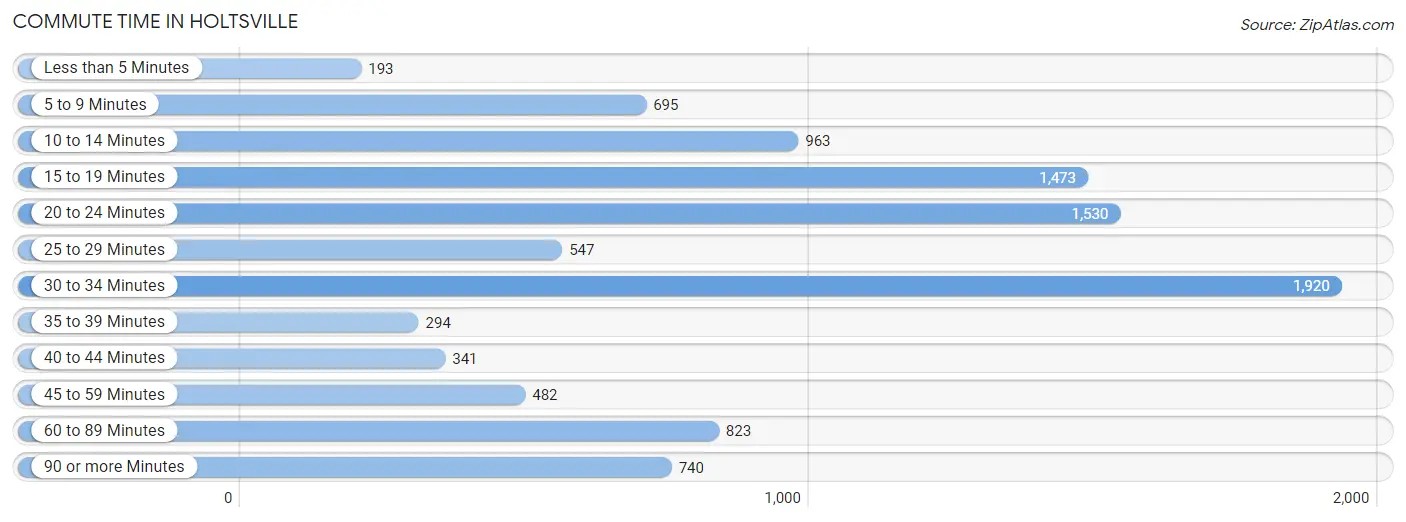
| Commute Time | # Commuters | % Commuters |
| Less than 5 Minutes | 193 | 1.9% |
| 5 to 9 Minutes | 695 | 7.0% |
| 10 to 14 Minutes | 963 | 9.6% |
| 15 to 19 Minutes | 1,473 | 14.7% |
| 20 to 24 Minutes | 1,530 | 15.3% |
| 25 to 29 Minutes | 547 | 5.5% |
| 30 to 34 Minutes | 1,920 | 19.2% |
| 35 to 39 Minutes | 294 | 2.9% |
| 40 to 44 Minutes | 341 | 3.4% |
| 45 to 59 Minutes | 482 | 4.8% |
| 60 to 89 Minutes | 823 | 8.2% |
| 90 or more Minutes | 740 | 7.4% |
Commute Time by Sex in Holtsville
The most common commute times in Holtsville are 30 to 34 minutes (1,044 commuters, 19.5%) for males and 30 to 34 minutes (876 commuters, 18.9%) for females.
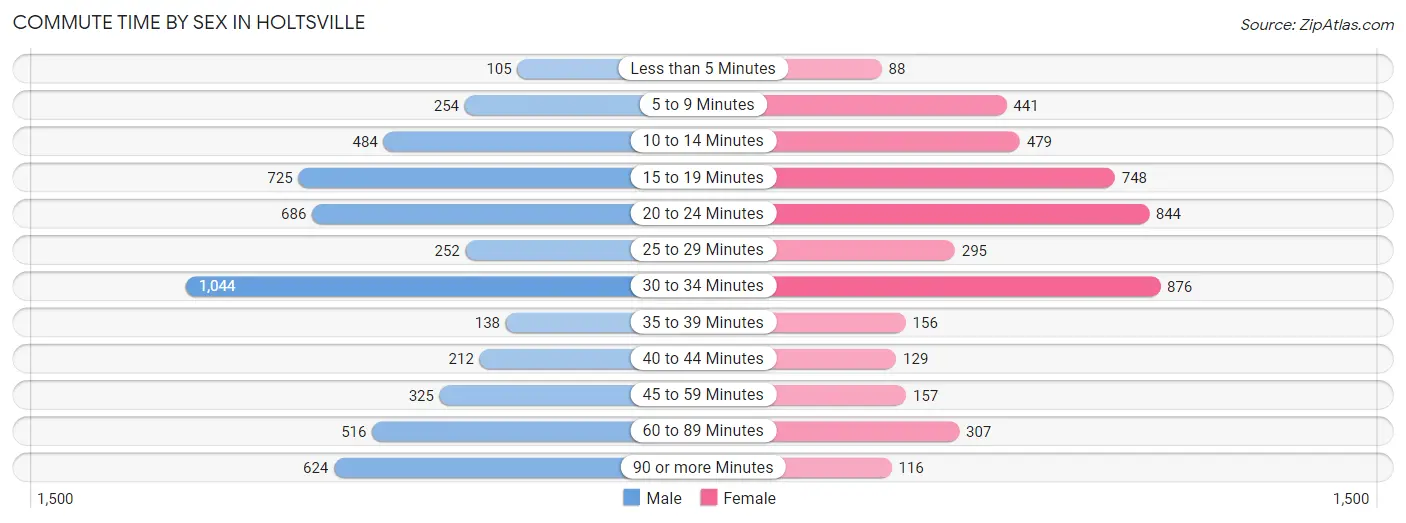
| Commute Time | Male | Female |
| Less than 5 Minutes | 105 (2.0%) | 88 (1.9%) |
| 5 to 9 Minutes | 254 (4.7%) | 441 (9.5%) |
| 10 to 14 Minutes | 484 (9.0%) | 479 (10.3%) |
| 15 to 19 Minutes | 725 (13.5%) | 748 (16.1%) |
| 20 to 24 Minutes | 686 (12.8%) | 844 (18.2%) |
| 25 to 29 Minutes | 252 (4.7%) | 295 (6.4%) |
| 30 to 34 Minutes | 1,044 (19.5%) | 876 (18.9%) |
| 35 to 39 Minutes | 138 (2.6%) | 156 (3.4%) |
| 40 to 44 Minutes | 212 (4.0%) | 129 (2.8%) |
| 45 to 59 Minutes | 325 (6.1%) | 157 (3.4%) |
| 60 to 89 Minutes | 516 (9.6%) | 307 (6.6%) |
| 90 or more Minutes | 624 (11.6%) | 116 (2.5%) |
Time of Departure to Work by Sex in Holtsville
The most frequent times of departure to work in Holtsville are 7:00 AM to 7:29 AM (856, 16.0%) for males and 8:00 AM to 8:29 AM (1,029, 22.2%) for females.
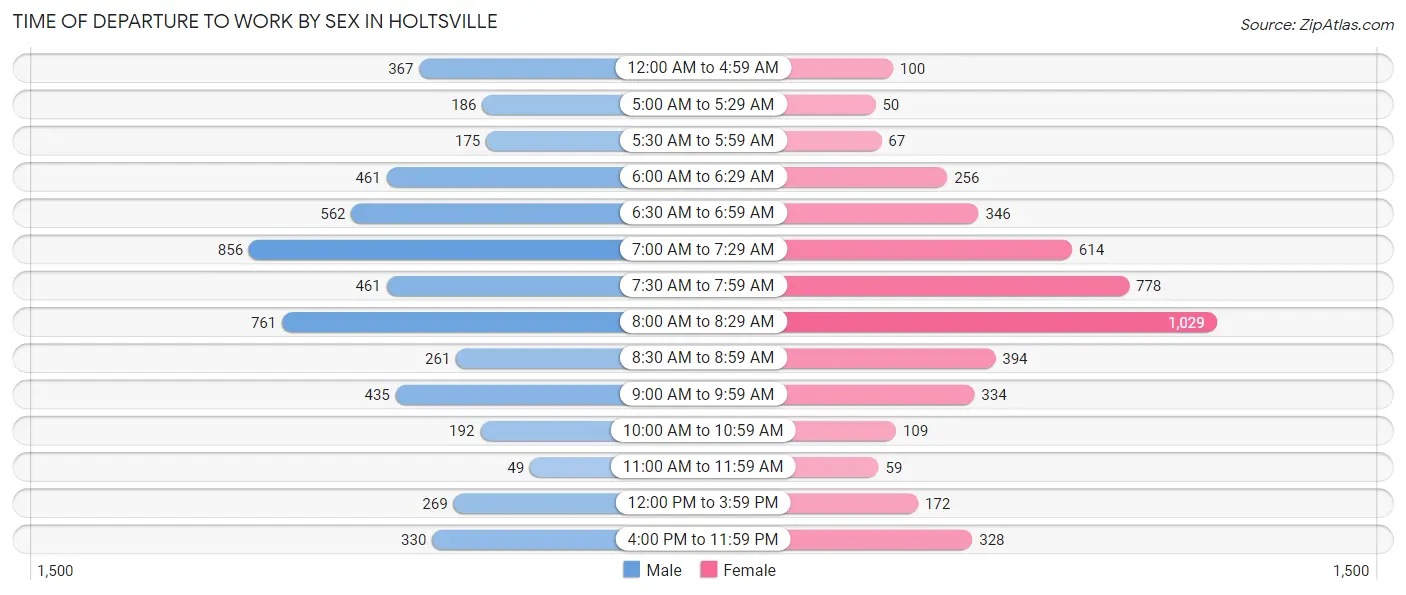
| Time of Departure | Male | Female |
| 12:00 AM to 4:59 AM | 367 (6.8%) | 100 (2.2%) |
| 5:00 AM to 5:29 AM | 186 (3.5%) | 50 (1.1%) |
| 5:30 AM to 5:59 AM | 175 (3.3%) | 67 (1.5%) |
| 6:00 AM to 6:29 AM | 461 (8.6%) | 256 (5.5%) |
| 6:30 AM to 6:59 AM | 562 (10.5%) | 346 (7.5%) |
| 7:00 AM to 7:29 AM | 856 (16.0%) | 614 (13.2%) |
| 7:30 AM to 7:59 AM | 461 (8.6%) | 778 (16.8%) |
| 8:00 AM to 8:29 AM | 761 (14.2%) | 1,029 (22.2%) |
| 8:30 AM to 8:59 AM | 261 (4.9%) | 394 (8.5%) |
| 9:00 AM to 9:59 AM | 435 (8.1%) | 334 (7.2%) |
| 10:00 AM to 10:59 AM | 192 (3.6%) | 109 (2.4%) |
| 11:00 AM to 11:59 AM | 49 (0.9%) | 59 (1.3%) |
| 12:00 PM to 3:59 PM | 269 (5.0%) | 172 (3.7%) |
| 4:00 PM to 11:59 PM | 330 (6.1%) | 328 (7.1%) |
| Total | 5,365 (100.0%) | 4,636 (100.0%) |
Housing Occupancy in Holtsville
Occupancy by Ownership in Holtsville
Of the total 6,449 dwellings in Holtsville, owner-occupied units account for 5,388 (83.6%), while renter-occupied units make up 1,061 (16.5%).
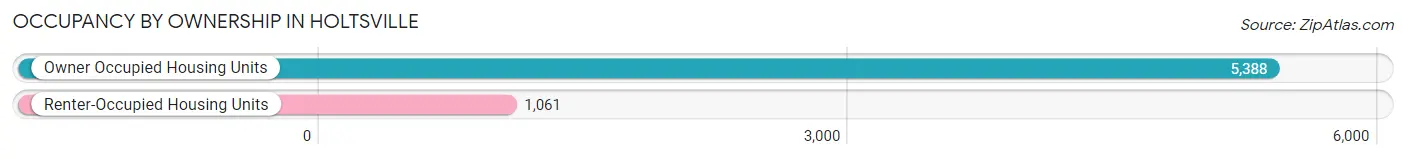
| Occupancy | # Housing Units | % Housing Units |
| Owner Occupied Housing Units | 5,388 | 83.6% |
| Renter-Occupied Housing Units | 1,061 | 16.5% |
| Total Occupied Housing Units | 6,449 | 100.0% |
Occupancy by Household Size in Holtsville
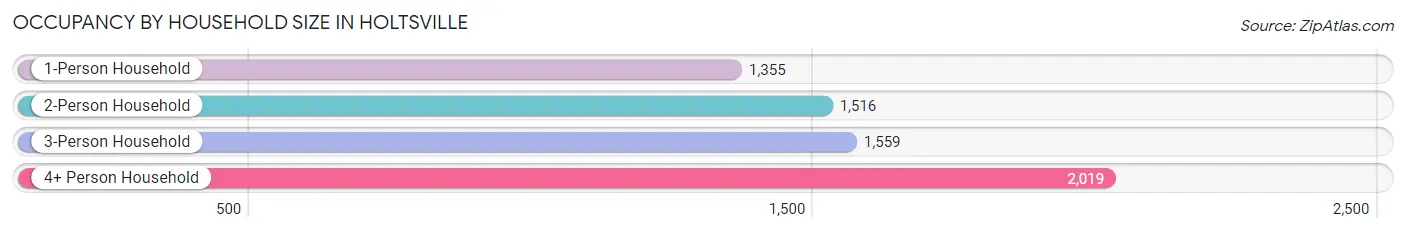
| Household Size | # Housing Units | % Housing Units |
| 1-Person Household | 1,355 | 21.0% |
| 2-Person Household | 1,516 | 23.5% |
| 3-Person Household | 1,559 | 24.2% |
| 4+ Person Household | 2,019 | 31.3% |
| Total Housing Units | 6,449 | 100.0% |
Occupancy by Ownership by Household Size in Holtsville
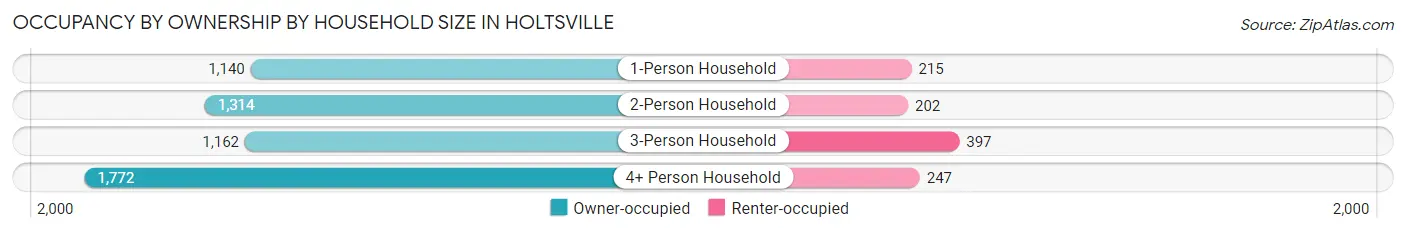
| Household Size | Owner-occupied | Renter-occupied |
| 1-Person Household | 1,140 (84.1%) | 215 (15.9%) |
| 2-Person Household | 1,314 (86.7%) | 202 (13.3%) |
| 3-Person Household | 1,162 (74.5%) | 397 (25.5%) |
| 4+ Person Household | 1,772 (87.8%) | 247 (12.2%) |
| Total Housing Units | 5,388 (83.6%) | 1,061 (16.5%) |
Occupancy by Educational Attainment in Holtsville
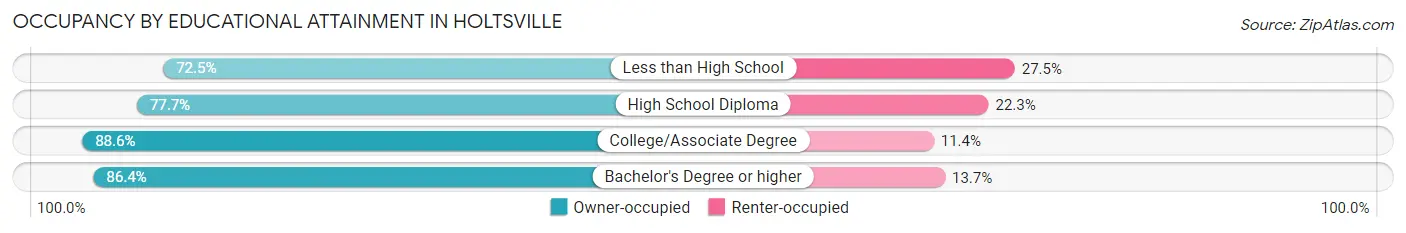
| Household Size | Owner-occupied | Renter-occupied |
| Less than High School | 327 (72.5%) | 124 (27.5%) |
| High School Diploma | 1,462 (77.7%) | 419 (22.3%) |
| College/Associate Degree | 1,752 (88.6%) | 226 (11.4%) |
| Bachelor's Degree or higher | 1,847 (86.4%) | 292 (13.7%) |
Occupancy by Age of Householder in Holtsville
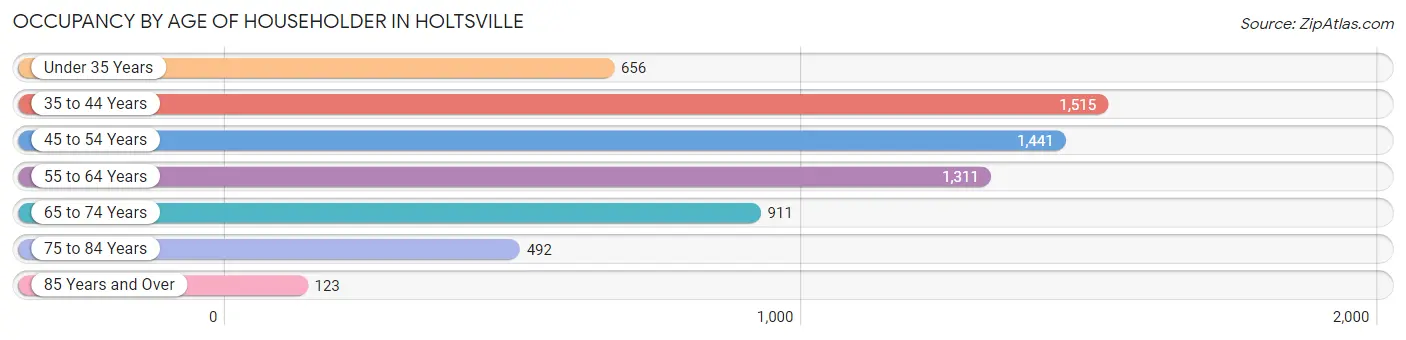
| Age Bracket | # Households | % Households |
| Under 35 Years | 656 | 10.2% |
| 35 to 44 Years | 1,515 | 23.5% |
| 45 to 54 Years | 1,441 | 22.3% |
| 55 to 64 Years | 1,311 | 20.3% |
| 65 to 74 Years | 911 | 14.1% |
| 75 to 84 Years | 492 | 7.6% |
| 85 Years and Over | 123 | 1.9% |
| Total | 6,449 | 100.0% |
Housing Finances in Holtsville
Median Income by Occupancy in Holtsville
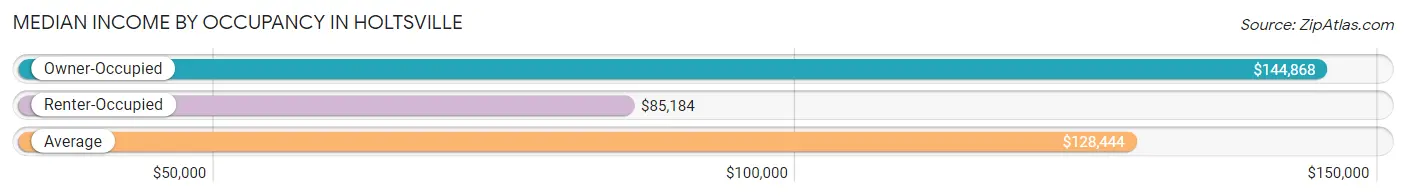
| Occupancy Type | # Households | Median Income |
| Owner-Occupied | 5,388 (83.6%) | $144,868 |
| Renter-Occupied | 1,061 (16.5%) | $85,184 |
| Average | 6,449 (100.0%) | $128,444 |
Occupancy by Householder Income Bracket in Holtsville
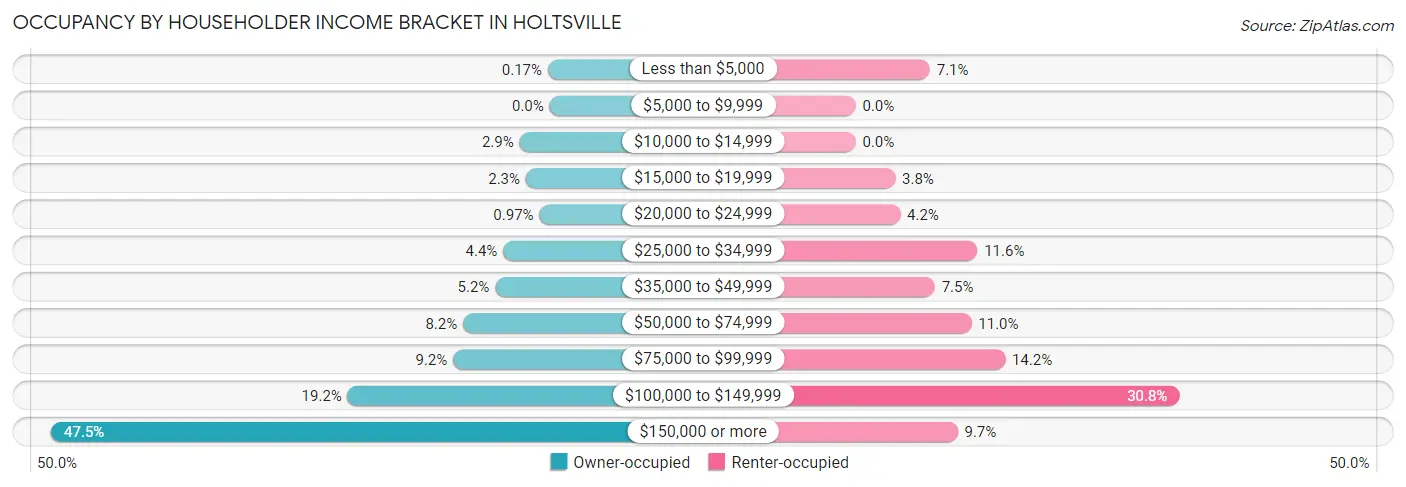
| Income Bracket | Owner-occupied | Renter-occupied |
| Less than $5,000 | 9 (0.2%) | 75 (7.1%) |
| $5,000 to $9,999 | 0 (0.0%) | 0 (0.0%) |
| $10,000 to $14,999 | 154 (2.9%) | 0 (0.0%) |
| $15,000 to $19,999 | 122 (2.3%) | 40 (3.8%) |
| $20,000 to $24,999 | 52 (1.0%) | 45 (4.2%) |
| $25,000 to $34,999 | 238 (4.4%) | 123 (11.6%) |
| $35,000 to $49,999 | 279 (5.2%) | 80 (7.5%) |
| $50,000 to $74,999 | 444 (8.2%) | 117 (11.0%) |
| $75,000 to $99,999 | 495 (9.2%) | 151 (14.2%) |
| $100,000 to $149,999 | 1,036 (19.2%) | 327 (30.8%) |
| $150,000 or more | 2,559 (47.5%) | 103 (9.7%) |
| Total | 5,388 (100.0%) | 1,061 (100.0%) |
Monthly Housing Cost Tiers in Holtsville
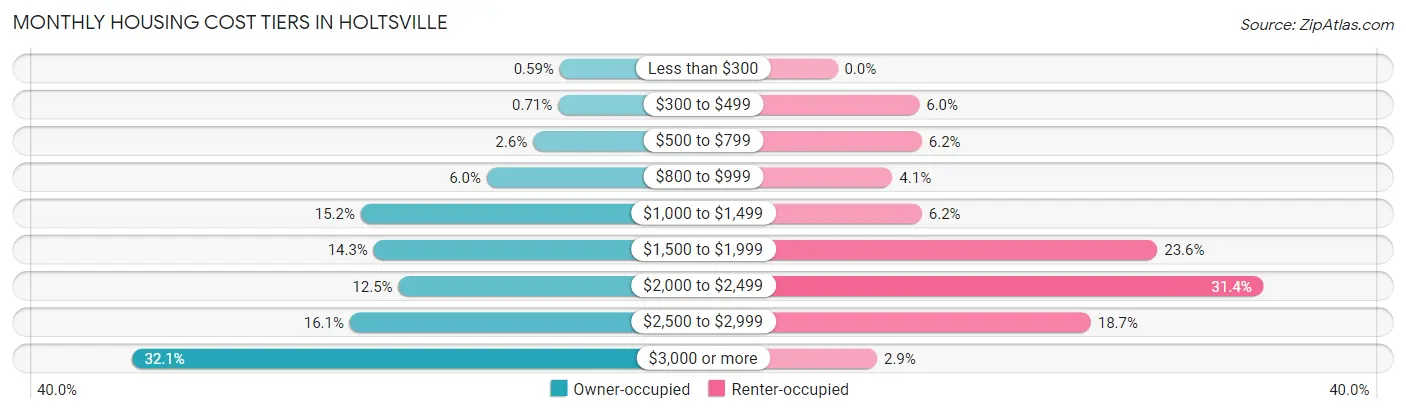
| Monthly Cost | Owner-occupied | Renter-occupied |
| Less than $300 | 32 (0.6%) | 0 (0.0%) |
| $300 to $499 | 38 (0.7%) | 64 (6.0%) |
| $500 to $799 | 138 (2.6%) | 66 (6.2%) |
| $800 to $999 | 321 (6.0%) | 43 (4.1%) |
| $1,000 to $1,499 | 821 (15.2%) | 66 (6.2%) |
| $1,500 to $1,999 | 770 (14.3%) | 250 (23.6%) |
| $2,000 to $2,499 | 672 (12.5%) | 333 (31.4%) |
| $2,500 to $2,999 | 865 (16.1%) | 198 (18.7%) |
| $3,000 or more | 1,731 (32.1%) | 31 (2.9%) |
| Total | 5,388 (100.0%) | 1,061 (100.0%) |
Physical Housing Characteristics in Holtsville
Housing Structures in Holtsville
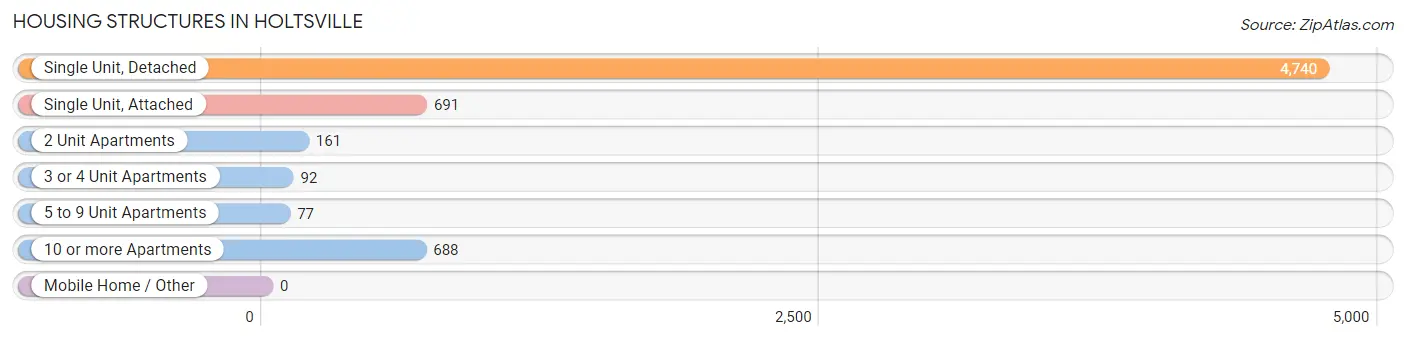
| Structure Type | # Housing Units | % Housing Units |
| Single Unit, Detached | 4,740 | 73.5% |
| Single Unit, Attached | 691 | 10.7% |
| 2 Unit Apartments | 161 | 2.5% |
| 3 or 4 Unit Apartments | 92 | 1.4% |
| 5 to 9 Unit Apartments | 77 | 1.2% |
| 10 or more Apartments | 688 | 10.7% |
| Mobile Home / Other | 0 | 0.0% |
| Total | 6,449 | 100.0% |
Housing Structures by Occupancy in Holtsville
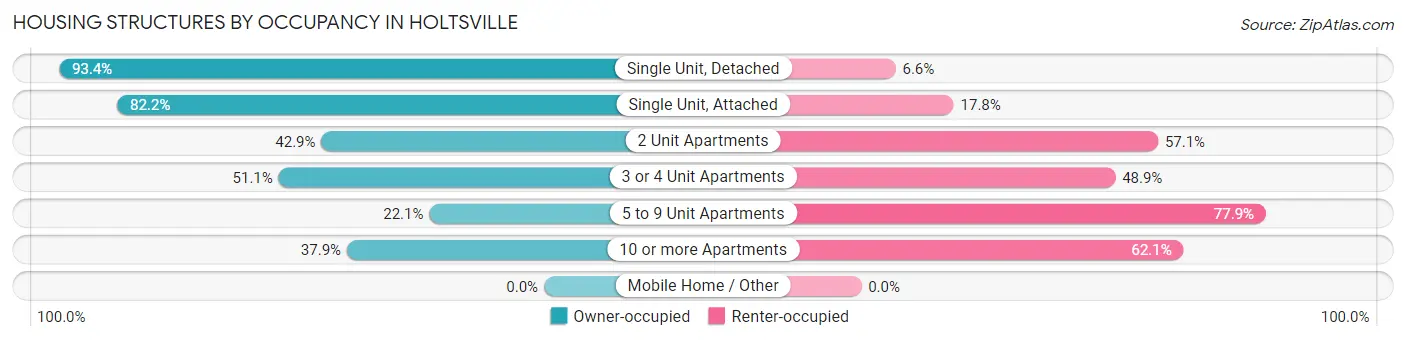
| Structure Type | Owner-occupied | Renter-occupied |
| Single Unit, Detached | 4,426 (93.4%) | 314 (6.6%) |
| Single Unit, Attached | 568 (82.2%) | 123 (17.8%) |
| 2 Unit Apartments | 69 (42.9%) | 92 (57.1%) |
| 3 or 4 Unit Apartments | 47 (51.1%) | 45 (48.9%) |
| 5 to 9 Unit Apartments | 17 (22.1%) | 60 (77.9%) |
| 10 or more Apartments | 261 (37.9%) | 427 (62.1%) |
| Mobile Home / Other | 0 (0.0%) | 0 (0.0%) |
| Total | 5,388 (83.6%) | 1,061 (16.5%) |
Housing Structures by Number of Rooms in Holtsville
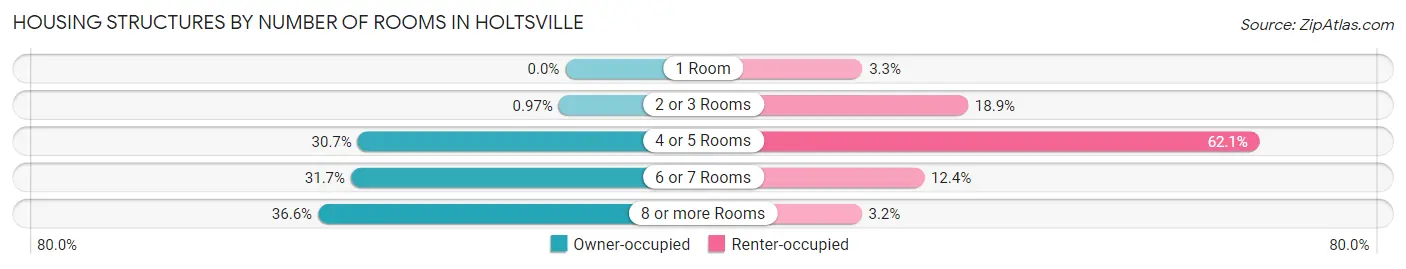
| Number of Rooms | Owner-occupied | Renter-occupied |
| 1 Room | 0 (0.0%) | 35 (3.3%) |
| 2 or 3 Rooms | 52 (1.0%) | 201 (18.9%) |
| 4 or 5 Rooms | 1,655 (30.7%) | 659 (62.1%) |
| 6 or 7 Rooms | 1,709 (31.7%) | 132 (12.4%) |
| 8 or more Rooms | 1,972 (36.6%) | 34 (3.2%) |
| Total | 5,388 (100.0%) | 1,061 (100.0%) |
Housing Structure by Heating Type in Holtsville
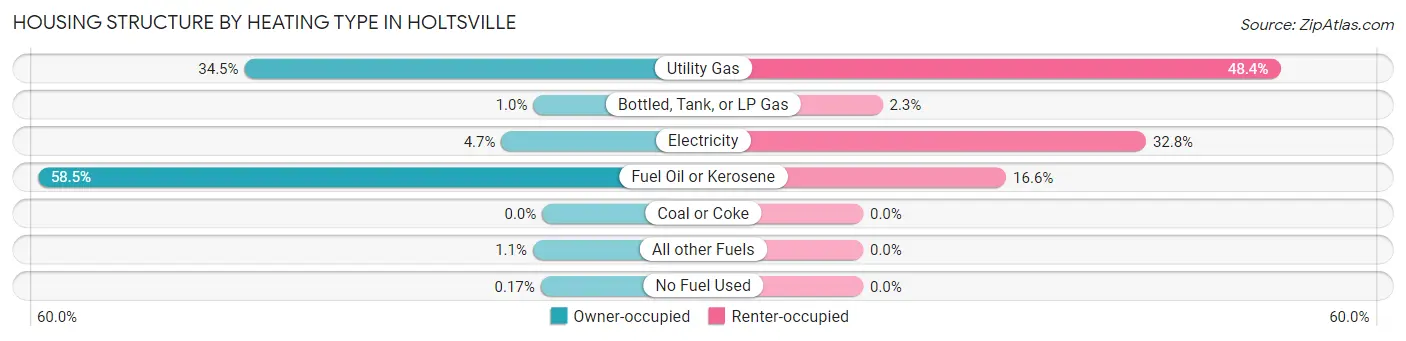
| Heating Type | Owner-occupied | Renter-occupied |
| Utility Gas | 1,860 (34.5%) | 513 (48.3%) |
| Bottled, Tank, or LP Gas | 55 (1.0%) | 24 (2.3%) |
| Electricity | 255 (4.7%) | 348 (32.8%) |
| Fuel Oil or Kerosene | 3,151 (58.5%) | 176 (16.6%) |
| Coal or Coke | 0 (0.0%) | 0 (0.0%) |
| All other Fuels | 58 (1.1%) | 0 (0.0%) |
| No Fuel Used | 9 (0.2%) | 0 (0.0%) |
| Total | 5,388 (100.0%) | 1,061 (100.0%) |
Household Vehicle Usage in Holtsville
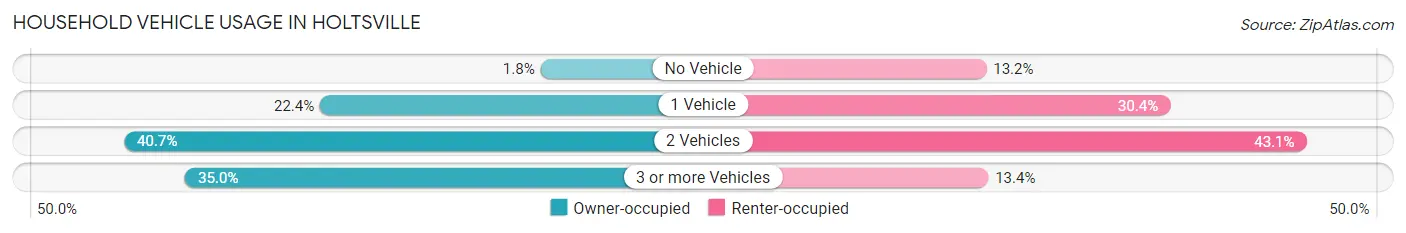
| Vehicles per Household | Owner-occupied | Renter-occupied |
| No Vehicle | 99 (1.8%) | 140 (13.2%) |
| 1 Vehicle | 1,208 (22.4%) | 322 (30.3%) |
| 2 Vehicles | 2,194 (40.7%) | 457 (43.1%) |
| 3 or more Vehicles | 1,887 (35.0%) | 142 (13.4%) |
| Total | 5,388 (100.0%) | 1,061 (100.0%) |
Real Estate & Mortgages in Holtsville
Real Estate and Mortgage Overview in Holtsville
| Characteristic | Without Mortgage | With Mortgage |
| Housing Units | 1,604 | 3,784 |
| Median Property Value | $448,000 | $460,700 |
| Median Household Income | $83,611 | $2,082 |
| Monthly Housing Costs | $1,351 | $1,709 |
| Real Estate Taxes | $8,859 | $66 |
Property Value by Mortgage Status in Holtsville
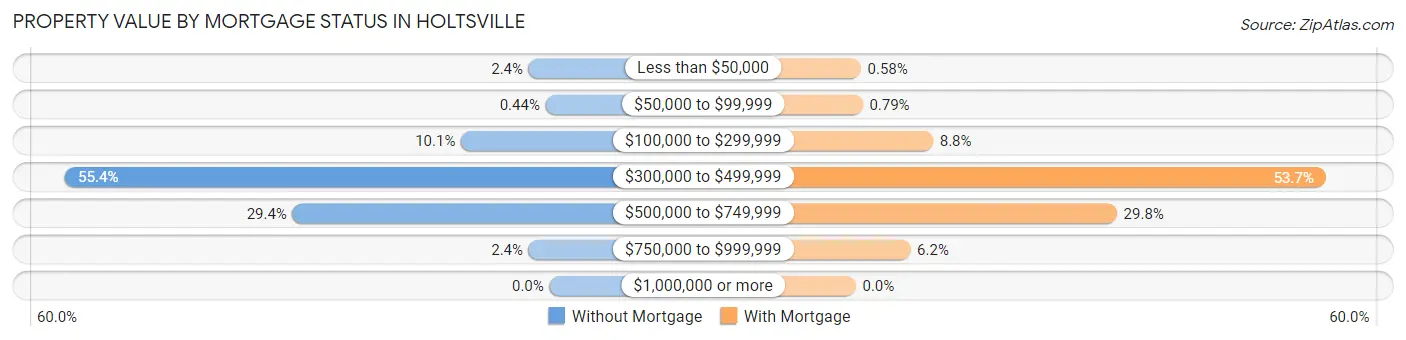
| Property Value | Without Mortgage | With Mortgage |
| Less than $50,000 | 38 (2.4%) | 22 (0.6%) |
| $50,000 to $99,999 | 7 (0.4%) | 30 (0.8%) |
| $100,000 to $299,999 | 162 (10.1%) | 334 (8.8%) |
| $300,000 to $499,999 | 888 (55.4%) | 2,033 (53.7%) |
| $500,000 to $749,999 | 471 (29.4%) | 1,129 (29.8%) |
| $750,000 to $999,999 | 38 (2.4%) | 236 (6.2%) |
| $1,000,000 or more | 0 (0.0%) | 0 (0.0%) |
| Total | 1,604 (100.0%) | 3,784 (100.0%) |
Household Income by Mortgage Status in Holtsville
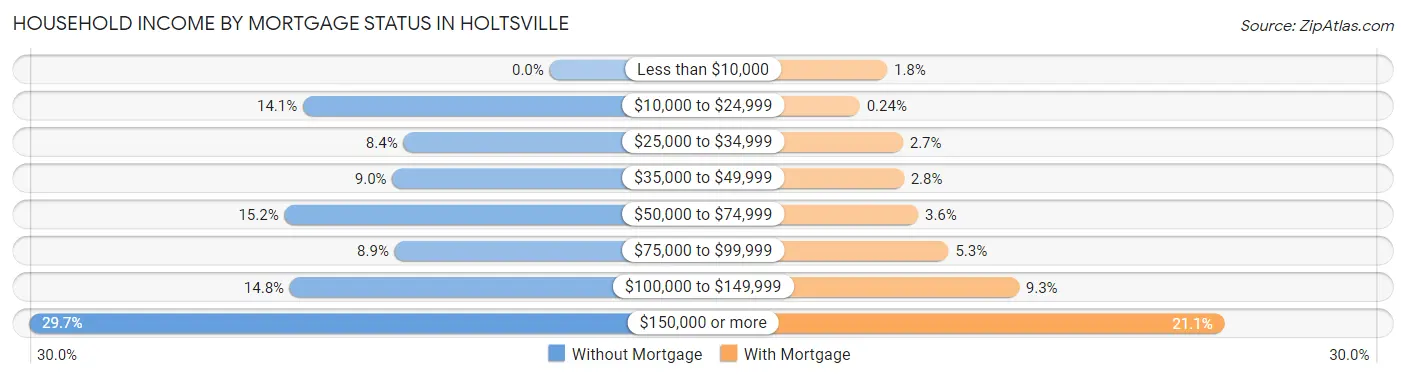
| Household Income | Without Mortgage | With Mortgage |
| Less than $10,000 | 0 (0.0%) | 68 (1.8%) |
| $10,000 to $24,999 | 226 (14.1%) | 9 (0.2%) |
| $25,000 to $34,999 | 134 (8.4%) | 102 (2.7%) |
| $35,000 to $49,999 | 144 (9.0%) | 104 (2.8%) |
| $50,000 to $74,999 | 243 (15.1%) | 135 (3.6%) |
| $75,000 to $99,999 | 142 (8.8%) | 201 (5.3%) |
| $100,000 to $149,999 | 238 (14.8%) | 353 (9.3%) |
| $150,000 or more | 477 (29.7%) | 798 (21.1%) |
| Total | 1,604 (100.0%) | 3,784 (100.0%) |
Property Value to Household Income Ratio in Holtsville
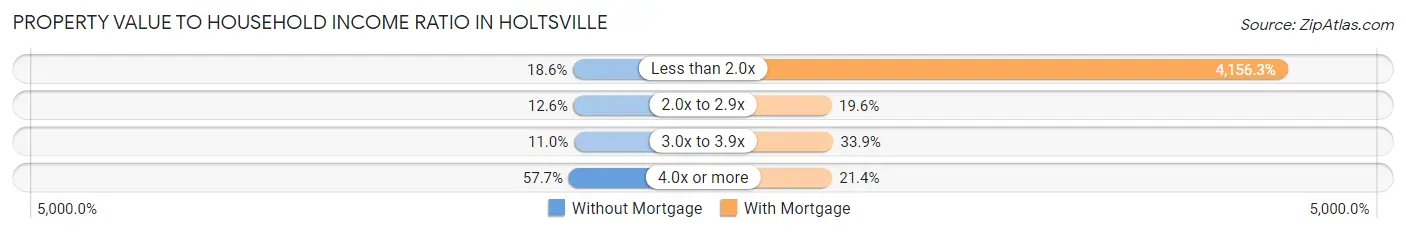
| Value-to-Income Ratio | Without Mortgage | With Mortgage |
| Less than 2.0x | 299 (18.6%) | 157,275 (4,156.3%) |
| 2.0x to 2.9x | 202 (12.6%) | 743 (19.6%) |
| 3.0x to 3.9x | 177 (11.0%) | 1,282 (33.9%) |
| 4.0x or more | 926 (57.7%) | 808 (21.3%) |
| Total | 1,604 (100.0%) | 3,784 (100.0%) |
Real Estate Taxes by Mortgage Status in Holtsville
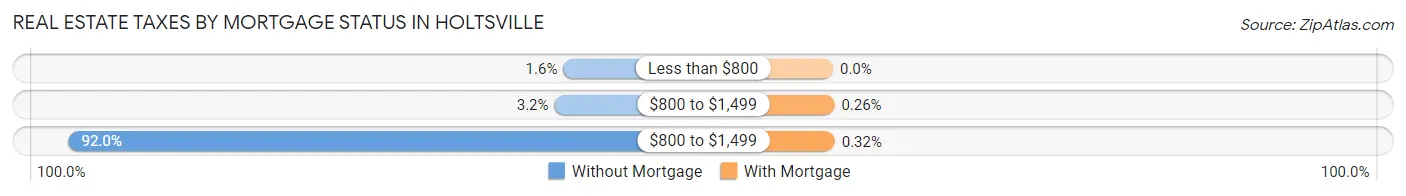
| Property Taxes | Without Mortgage | With Mortgage |
| Less than $800 | 26 (1.6%) | 0 (0.0%) |
| $800 to $1,499 | 52 (3.2%) | 10 (0.3%) |
| $800 to $1,499 | 1,475 (92.0%) | 12 (0.3%) |
| Total | 1,604 (100.0%) | 3,784 (100.0%) |
Health & Disability in Holtsville
Health Insurance Coverage by Age in Holtsville
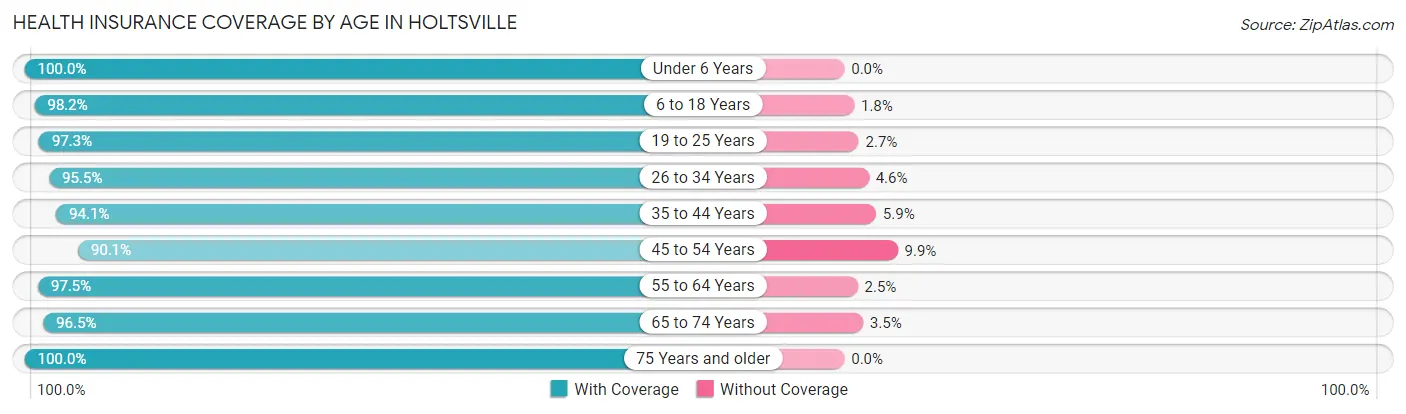
| Age Bracket | With Coverage | Without Coverage |
| Under 6 Years | 1,399 (100.0%) | 0 (0.0%) |
| 6 to 18 Years | 3,023 (98.2%) | 56 (1.8%) |
| 19 to 25 Years | 1,648 (97.3%) | 45 (2.7%) |
| 26 to 34 Years | 1,865 (95.5%) | 89 (4.5%) |
| 35 to 44 Years | 2,987 (94.1%) | 187 (5.9%) |
| 45 to 54 Years | 2,771 (90.1%) | 306 (9.9%) |
| 55 to 64 Years | 2,434 (97.5%) | 62 (2.5%) |
| 65 to 74 Years | 1,671 (96.5%) | 60 (3.5%) |
| 75 Years and older | 951 (100.0%) | 0 (0.0%) |
| Total | 18,749 (95.9%) | 805 (4.1%) |
Health Insurance Coverage by Citizenship Status in Holtsville
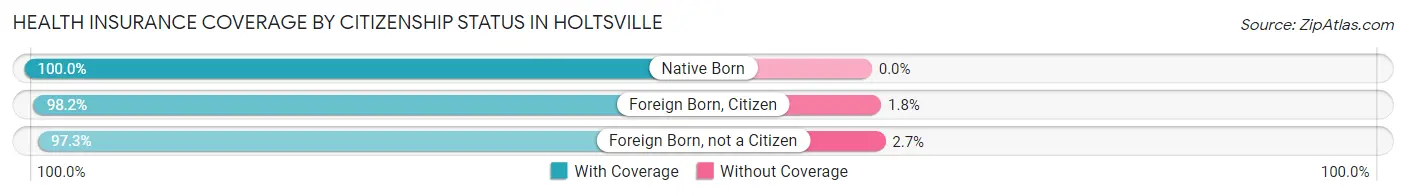
| Citizenship Status | With Coverage | Without Coverage |
| Native Born | 1,399 (100.0%) | 0 (0.0%) |
| Foreign Born, Citizen | 3,023 (98.2%) | 56 (1.8%) |
| Foreign Born, not a Citizen | 1,648 (97.3%) | 45 (2.7%) |
Health Insurance Coverage by Household Income in Holtsville
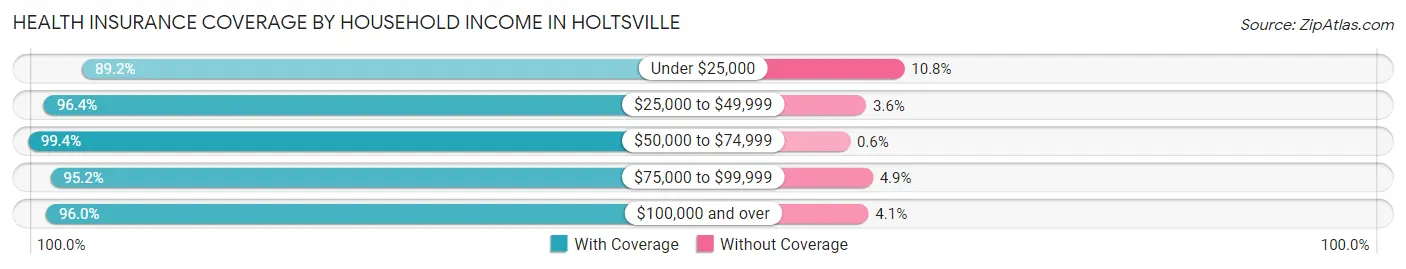
| Household Income | With Coverage | Without Coverage |
| Under $25,000 | 736 (89.2%) | 89 (10.8%) |
| $25,000 to $49,999 | 1,489 (96.4%) | 56 (3.6%) |
| $50,000 to $74,999 | 1,334 (99.4%) | 8 (0.6%) |
| $75,000 to $99,999 | 1,550 (95.2%) | 79 (4.9%) |
| $100,000 and over | 13,574 (96.0%) | 573 (4.1%) |
Public vs Private Health Insurance Coverage by Age in Holtsville
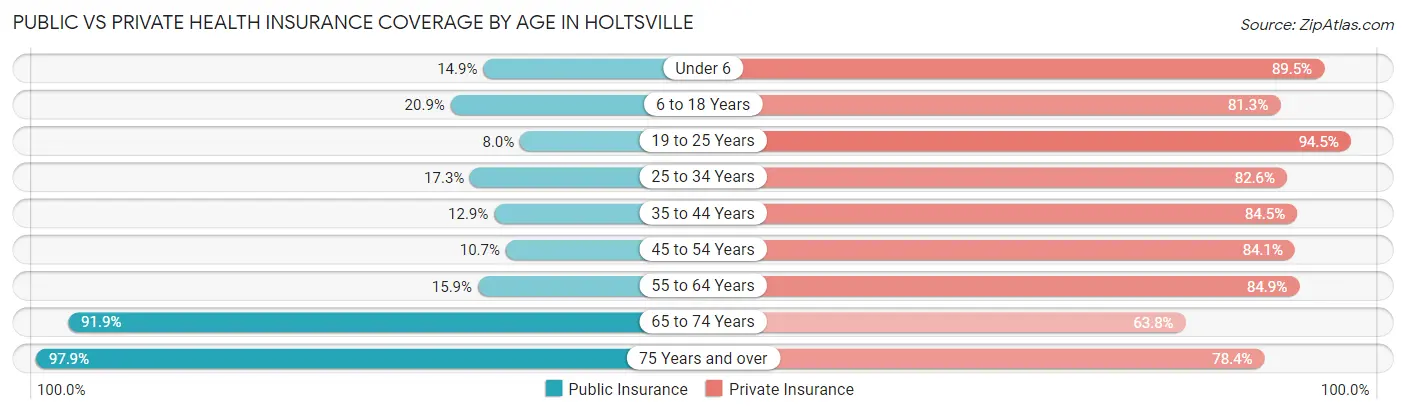
| Age Bracket | Public Insurance | Private Insurance |
| Under 6 | 208 (14.9%) | 1,252 (89.5%) |
| 6 to 18 Years | 644 (20.9%) | 2,504 (81.3%) |
| 19 to 25 Years | 136 (8.0%) | 1,599 (94.5%) |
| 25 to 34 Years | 338 (17.3%) | 1,614 (82.6%) |
| 35 to 44 Years | 408 (12.9%) | 2,682 (84.5%) |
| 45 to 54 Years | 329 (10.7%) | 2,587 (84.1%) |
| 55 to 64 Years | 396 (15.9%) | 2,118 (84.9%) |
| 65 to 74 Years | 1,591 (91.9%) | 1,104 (63.8%) |
| 75 Years and over | 931 (97.9%) | 746 (78.4%) |
| Total | 4,981 (25.5%) | 16,206 (82.9%) |
Disability Status by Sex by Age in Holtsville
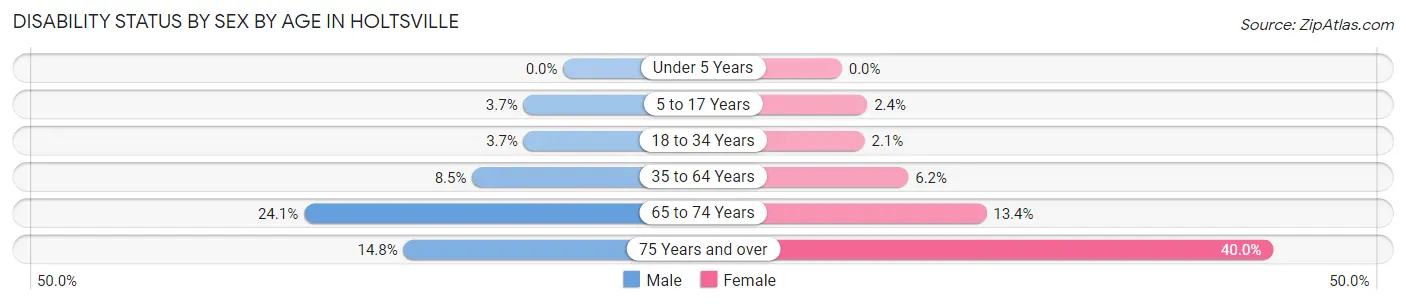
| Age Bracket | Male | Female |
| Under 5 Years | 0 (0.0%) | 0 (0.0%) |
| 5 to 17 Years | 53 (3.7%) | 35 (2.4%) |
| 18 to 34 Years | 68 (3.7%) | 45 (2.1%) |
| 35 to 64 Years | 383 (8.5%) | 260 (6.2%) |
| 65 to 74 Years | 239 (24.1%) | 99 (13.4%) |
| 75 Years and over | 51 (14.8%) | 243 (40.0%) |
Disability Class by Sex by Age in Holtsville
Disability Class: Hearing Difficulty
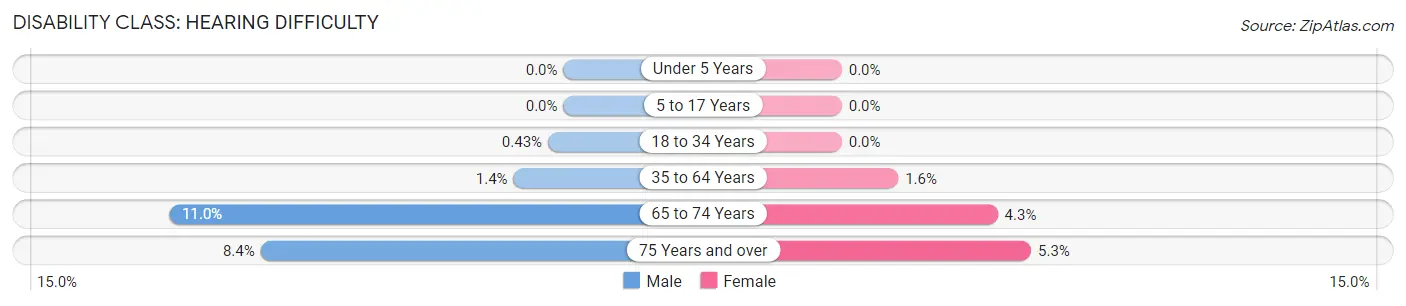
| Age Bracket | Male | Female |
| Under 5 Years | 0 (0.0%) | 0 (0.0%) |
| 5 to 17 Years | 0 (0.0%) | 0 (0.0%) |
| 18 to 34 Years | 8 (0.4%) | 0 (0.0%) |
| 35 to 64 Years | 63 (1.4%) | 66 (1.6%) |
| 65 to 74 Years | 109 (11.0%) | 32 (4.3%) |
| 75 Years and over | 29 (8.4%) | 32 (5.3%) |
Disability Class: Vision Difficulty
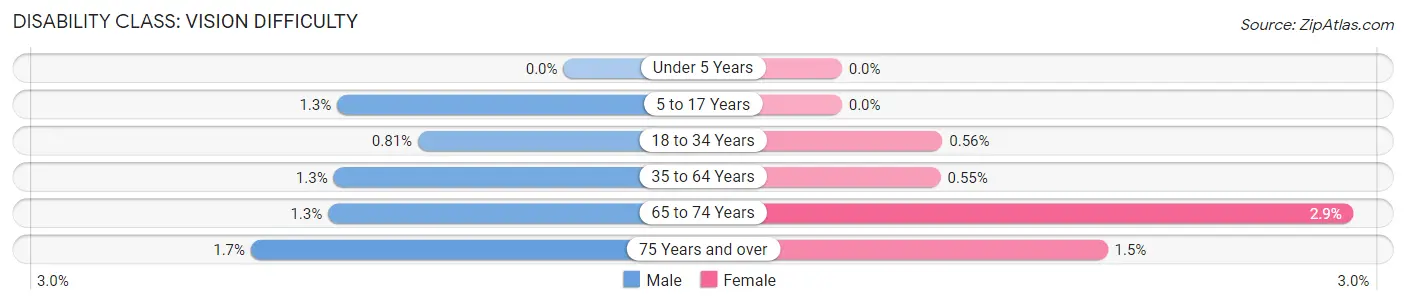
| Age Bracket | Male | Female |
| Under 5 Years | 0 (0.0%) | 0 (0.0%) |
| 5 to 17 Years | 18 (1.3%) | 0 (0.0%) |
| 18 to 34 Years | 15 (0.8%) | 12 (0.6%) |
| 35 to 64 Years | 58 (1.3%) | 23 (0.5%) |
| 65 to 74 Years | 13 (1.3%) | 21 (2.9%) |
| 75 Years and over | 6 (1.7%) | 9 (1.5%) |
Disability Class: Cognitive Difficulty
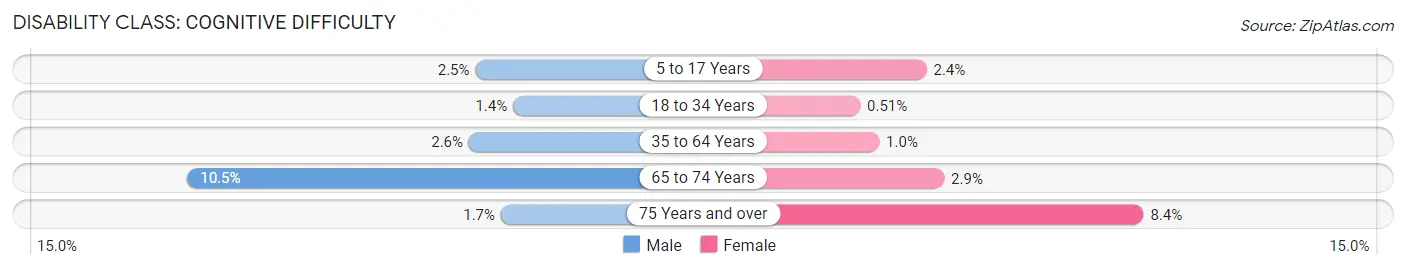
| Age Bracket | Male | Female |
| 5 to 17 Years | 35 (2.5%) | 35 (2.4%) |
| 18 to 34 Years | 26 (1.4%) | 11 (0.5%) |
| 35 to 64 Years | 119 (2.6%) | 44 (1.0%) |
| 65 to 74 Years | 104 (10.5%) | 21 (2.9%) |
| 75 Years and over | 6 (1.7%) | 51 (8.4%) |
Disability Class: Ambulatory Difficulty
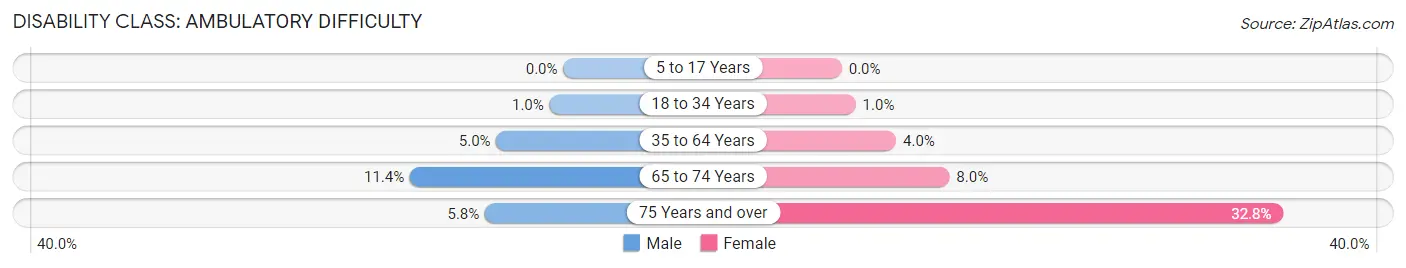
| Age Bracket | Male | Female |
| 5 to 17 Years | 0 (0.0%) | 0 (0.0%) |
| 18 to 34 Years | 19 (1.0%) | 22 (1.0%) |
| 35 to 64 Years | 225 (5.0%) | 170 (4.0%) |
| 65 to 74 Years | 113 (11.4%) | 59 (8.0%) |
| 75 Years and over | 20 (5.8%) | 199 (32.8%) |
Disability Class: Self-Care Difficulty
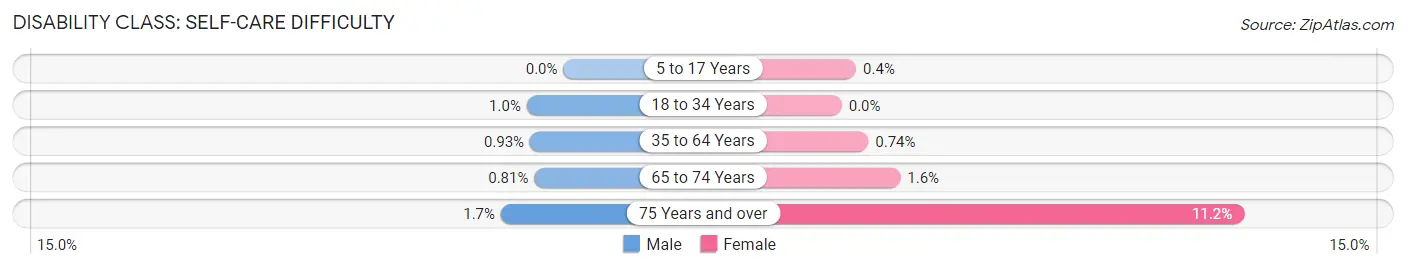
| Age Bracket | Male | Female |
| 5 to 17 Years | 0 (0.0%) | 6 (0.4%) |
| 18 to 34 Years | 19 (1.0%) | 0 (0.0%) |
| 35 to 64 Years | 42 (0.9%) | 31 (0.7%) |
| 65 to 74 Years | 8 (0.8%) | 12 (1.6%) |
| 75 Years and over | 6 (1.7%) | 68 (11.2%) |
Technology Access in Holtsville
Computing Device Access in Holtsville
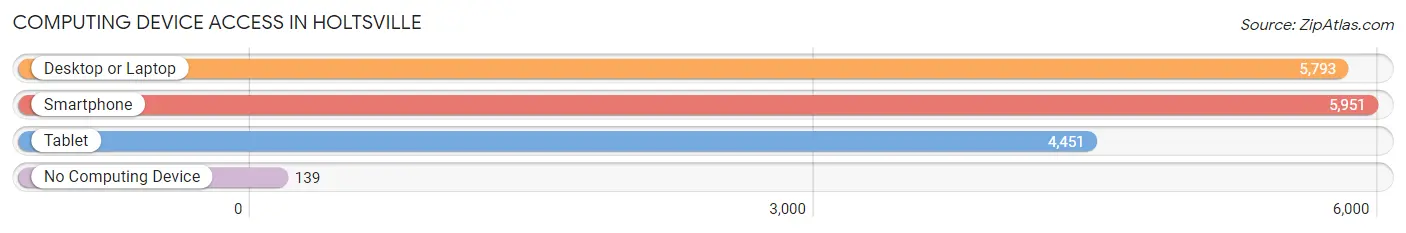
| Device Type | # Households | % Households |
| Desktop or Laptop | 5,793 | 89.8% |
| Smartphone | 5,951 | 92.3% |
| Tablet | 4,451 | 69.0% |
| No Computing Device | 139 | 2.2% |
| Total | 6,449 | 100.0% |
Internet Access in Holtsville
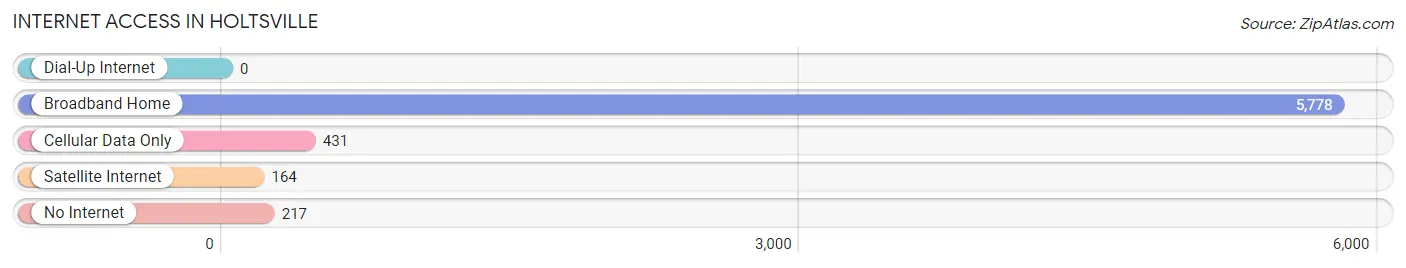
| Internet Type | # Households | % Households |
| Dial-Up Internet | 0 | 0.0% |
| Broadband Home | 5,778 | 89.6% |
| Cellular Data Only | 431 | 6.7% |
| Satellite Internet | 164 | 2.5% |
| No Internet | 217 | 3.4% |
| Total | 6,449 | 100.0% |
Holtsville Summary
Holtsville, NY is a hamlet located in the Town of Brookhaven in Suffolk County, New York. It is situated on the south shore of Long Island, approximately 60 miles east of New York City. The hamlet is bordered by Farmingville to the west, Selden to the north, and Centereach to the east. Holtsville is home to approximately 13,000 people, and is part of the larger Patchogue-Medford School District.
Geography
Holtsville is located in the Town of Brookhaven in Suffolk County, New York. It is situated on the south shore of Long Island, approximately 60 miles east of New York City. The hamlet is bordered by Farmingville to the west, Selden to the north, and Centereach to the east. Holtsville is home to approximately 13,000 people, and is part of the larger Patchogue-Medford School District.
The hamlet is located in the Pine Barrens, a region of Long Island characterized by sandy soil and pine trees. The area is known for its unique ecology, which includes rare species of plants and animals. Holtsville is also home to the Holtsville Ecology Site, a nature preserve and educational center.
The hamlet is served by the Long Island Rail Road, with a station located in the center of town. The Long Island Expressway (I-495) runs through the hamlet, providing access to New York City and other parts of Long Island.
History
Holtsville was originally inhabited by the Secatogue Indians, who were part of the Algonquin tribe. The hamlet was first settled by Europeans in the late 1600s, and was known as “Holts Corners”. The name was changed to “Holtsville” in 1845.
In the late 1800s, Holtsville was a popular summer resort destination for wealthy New Yorkers. The hamlet was home to several large hotels, including the Holtsville Hotel and the Holtsville House. The hotels attracted many famous guests, including President Theodore Roosevelt and Mark Twain.
In the early 1900s, Holtsville began to transition from a resort town to a residential community. The hamlet was home to several large farms, and was known for its agricultural products, including potatoes, onions, and corn.
Economy
Holtsville’s economy is largely based on retail and services. The hamlet is home to several large shopping centers, including the Holtsville Shopping Center and the Holtsville Mall. The hamlet is also home to several large employers, including the Holtsville Post Office, the Holtsville Fire Department, and the Holtsville Public Library.
The hamlet is also home to several small businesses, including restaurants, bars, and shops. Holtsville is also home to several industrial parks, which provide employment opportunities for local residents.
Demographics
As of the 2010 census, Holtsville had a population of 13,000. The population is largely white (83.3%), with smaller percentages of African American (7.2%), Hispanic (4.7%), and Asian (3.7%) residents. The median household income is $77,000, and the median home value is $360,000.
Holtsville is served by the Patchogue-Medford School District. The district includes four elementary schools, one middle school, and one high school. The hamlet is also home to several private schools, including St. Joseph’s Catholic School and the Holtsville Christian Academy.
Conclusion
Holtsville, NY is a hamlet located in the Town of Brookhaven in Suffolk County, New York. It is situated on the south shore of Long Island, approximately 60 miles east of New York City. The hamlet is bordered by Farmingville to the west, Selden to the north, and Centereach to the east. Holtsville is home to approximately 13,000 people, and is part of the larger Patchogue-Medford School District. The hamlet has a rich history, and is home to several large employers and retail centers. The population is largely white, with smaller percentages of African American, Hispanic, and Asian residents. Holtsville is served by the Patchogue-Medford School District, and is home to several private schools.
Common Questions
What is the Total Population of Holtsville?
Total Population of Holtsville is 19,597.
What is the Total Male Population of Holtsville?
Total Male Population of Holtsville is 9,799.
What is the Total Female Population of Holtsville?
Total Female Population of Holtsville is 9,798.
What is the Ratio of Males per 100 Females in Holtsville?
There are 100.01 Males per 100 Females in Holtsville.
What is the Ratio of Females per 100 Males in Holtsville?
There are 99.99 Females per 100 Males in Holtsville.
What is the Median Population Age in Holtsville?
Median Population Age in Holtsville is 39.4 Years.
What is the Average Family Size in Holtsville
Average Family Size in Holtsville is 3.5 People.
What is the Average Household Size in Holtsville
Average Household Size in Holtsville is 3.0 People.
What is Per Capita Income in Holtsville?
Per Capita income in Holtsville is $49,255.
What is the Median Family Income in Holtsville?
Median Family Income in Holtsville is $144,087.
What is the Median Household income in Holtsville?
Median Household Income in Holtsville is $128,444.
What is Income or Wage Gap in Holtsville?
Income or Wage Gap in Holtsville is 36.0%.
Women in Holtsville earn 64.0 cents for every dollar earned by a man.
What is Family Income Deficit in Holtsville?
Family Income Deficit in Holtsville is $8,591.
Families that are below poverty line in Holtsville earn $8,591 less on average than the poverty threshold level.
What is Inequality or Gini Index in Holtsville?
Inequality or Gini Index in Holtsville is 0.39.
How Large is the Labor Force in Holtsville?
There are 11,176 People in the Labor Forcein in Holtsville.
What is the Percentage of People in the Labor Force in Holtsville?
69.9% of People are in the Labor Force in Holtsville.
What is the Unemployment Rate in Holtsville?
Unemployment Rate in Holtsville is 3.1%.