Cities with the Highest Percentage of Immigrants from Trinidad and Tobago in Ohio
RELATED REPORTS & OPTIONS
Trinidad and Tobago
Ohio
Compare Cities
Map of Cities with the Highest Percentage of Immigrants from Trinidad and Tobago in Ohio
0.00%
0.80%
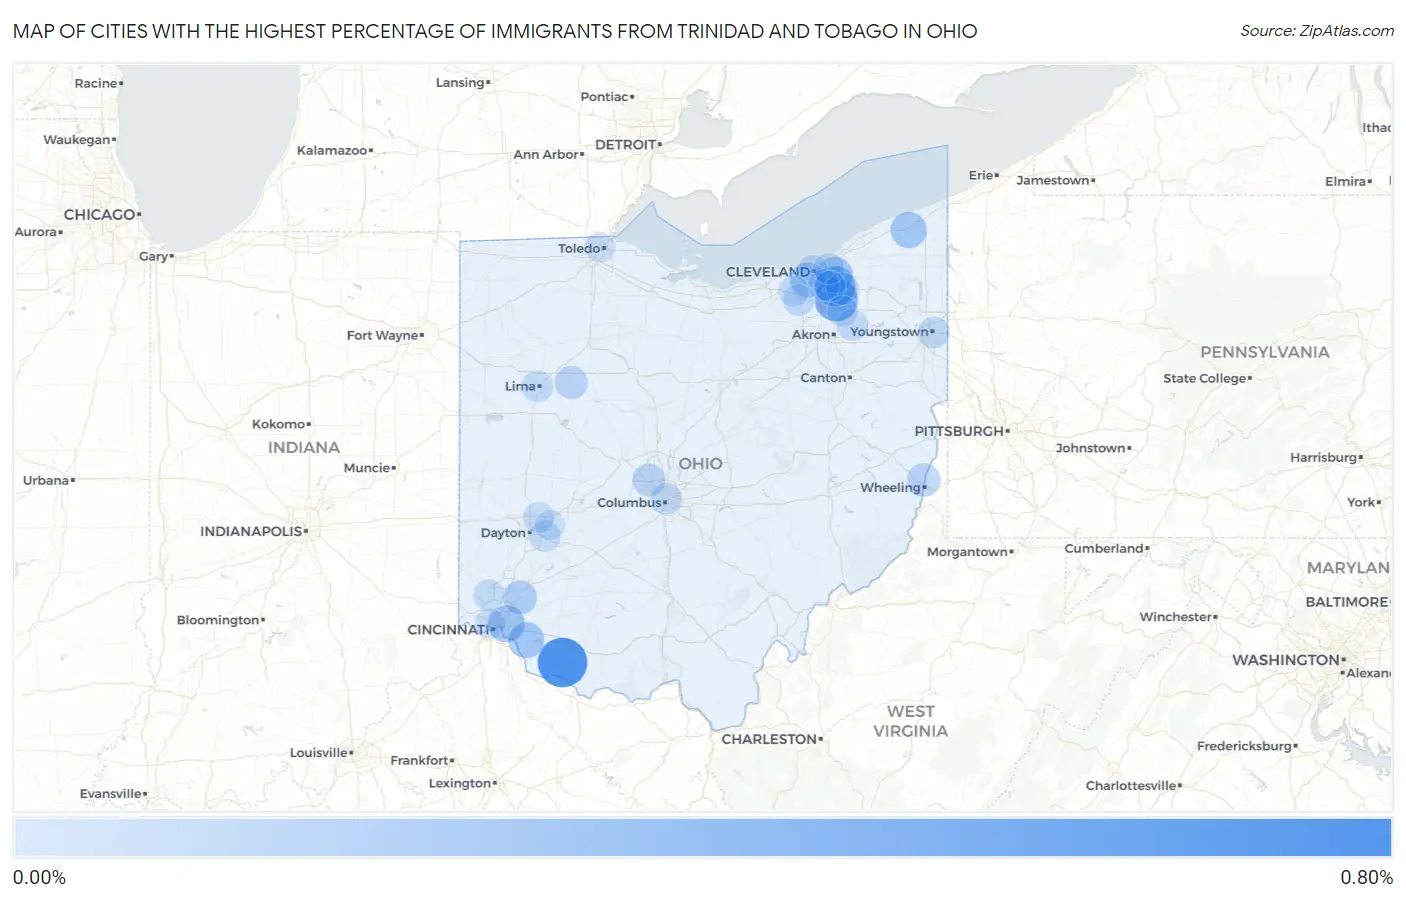
Cities with the Highest Percentage of Immigrants from Trinidad and Tobago in Ohio
| City | Trinidad and Tobago | vs State | vs National | |
| 1. | Georgetown | 0.69% | 0.011%(+0.683)#-1 | 0.070%(+0.624)#0 |
| 2. | Macedonia | 0.45% | 0.011%(+0.442)#0 | 0.070%(+0.384)#1 |
| 3. | Bedford Heights | 0.38% | 0.011%(+0.364)#1 | 0.070%(+0.305)#2 |
| 4. | Fairfax | 0.24% | 0.011%(+0.229)#2 | 0.070%(+0.171)#3 |
| 5. | Austinburg | 0.21% | 0.011%(+0.200)#3 | 0.070%(+0.142)#4 |
| 6. | Amelia | 0.21% | 0.011%(+0.198)#4 | 0.070%(+0.140)#5 |
| 7. | Beachwood | 0.21% | 0.011%(+0.198)#5 | 0.070%(+0.140)#6 |
| 8. | Brooklyn | 0.17% | 0.011%(+0.157)#6 | 0.070%(+0.099)#7 |
| 9. | Landen | 0.13% | 0.011%(+0.124)#7 | 0.070%(+0.065)#181 |
| 10. | Martins Ferry | 0.11% | 0.011%(+0.100)#8 | 0.070%(+0.042)#182 |
| 11. | Ada | 0.098% | 0.011%(+0.087)#9 | 0.070%(+0.028)#183 |
| 12. | Dublin | 0.094% | 0.011%(+0.083)#10 | 0.070%(+0.024)#184 |
| 13. | Solon | 0.083% | 0.011%(+0.072)#11 | 0.070%(+0.013)#185 |
| 14. | Strongsville | 0.056% | 0.011%(+0.045)#12 | 0.070%(-0.014)#186 |
| 15. | Youngstown | 0.053% | 0.011%(+0.042)#13 | 0.070%(-0.017)#290 |
| 16. | Cleveland | 0.052% | 0.011%(+0.040)#14 | 0.070%(-0.018)#291 |
| 17. | Lima | 0.048% | 0.011%(+0.036)#15 | 0.070%(-0.022)#292 |
| 18. | Kent | 0.048% | 0.011%(+0.036)#16 | 0.070%(-0.022)#408 |
| 19. | Columbus | 0.043% | 0.011%(+0.032)#17 | 0.070%(-0.027)#488 |
| 20. | Garfield Heights | 0.041% | 0.011%(+0.029)#18 | 0.070%(-0.029)#489 |
| 21. | Fairfield | 0.038% | 0.011%(+0.027)#19 | 0.070%(-0.032)#490 |
| 22. | Beavercreek | 0.036% | 0.011%(+0.025)#20 | 0.070%(-0.033)#491 |
| 23. | Cleveland Heights | 0.031% | 0.011%(+0.020)#21 | 0.070%(-0.039)#492 |
| 24. | Huber Heights | 0.030% | 0.011%(+0.019)#22 | 0.070%(-0.040)#493 |
| 25. | Berea | 0.027% | 0.011%(+0.016)#23 | 0.070%(-0.043)#494 |
| 26. | Hudson | 0.026% | 0.011%(+0.015)#24 | 0.070%(-0.044)#495 |
| 27. | Maple Heights | 0.026% | 0.011%(+0.014)#25 | 0.070%(-0.044)#496 |
| 28. | Cincinnati | 0.014% | 0.011%(+0.003)#26 | 0.070%(-0.056)#497 |
| 29. | Toledo | 0.0041% | 0.011%(-0.007)#27 | 0.070%(-0.066)#498 |
| 30. | Fairborn | 0.0029% | 0.011%(-0.009)#28 | 0.070%(-0.067)#499 |
Common Questions
What are the Top 10 Cities with the Highest Percentage of Immigrants from Trinidad and Tobago in Ohio?
Top 10 Cities with the Highest Percentage of Immigrants from Trinidad and Tobago in Ohio are:
#1
0.69%
#2
0.45%
#3
0.38%
#4
0.24%
#5
0.21%
#6
0.21%
#7
0.21%
#8
0.17%
#9
0.13%
#10
0.11%
What city has the Highest Percentage of Immigrants from Trinidad and Tobago in Ohio?
Georgetown has the Highest Percentage of Immigrants from Trinidad and Tobago in Ohio with 0.69%.
What is the Percentage of Immigrants from Trinidad and Tobago in the State of Ohio?
Percentage of Immigrants from Trinidad and Tobago in Ohio is 0.011%.
What is the Percentage of Immigrants from Trinidad and Tobago in the United States?
Percentage of Immigrants from Trinidad and Tobago in the United States is 0.070%.