Cities with the Highest Percentage of Immigrants from Jordan in New York
RELATED REPORTS & OPTIONS
Jordan
New York
Compare Cities
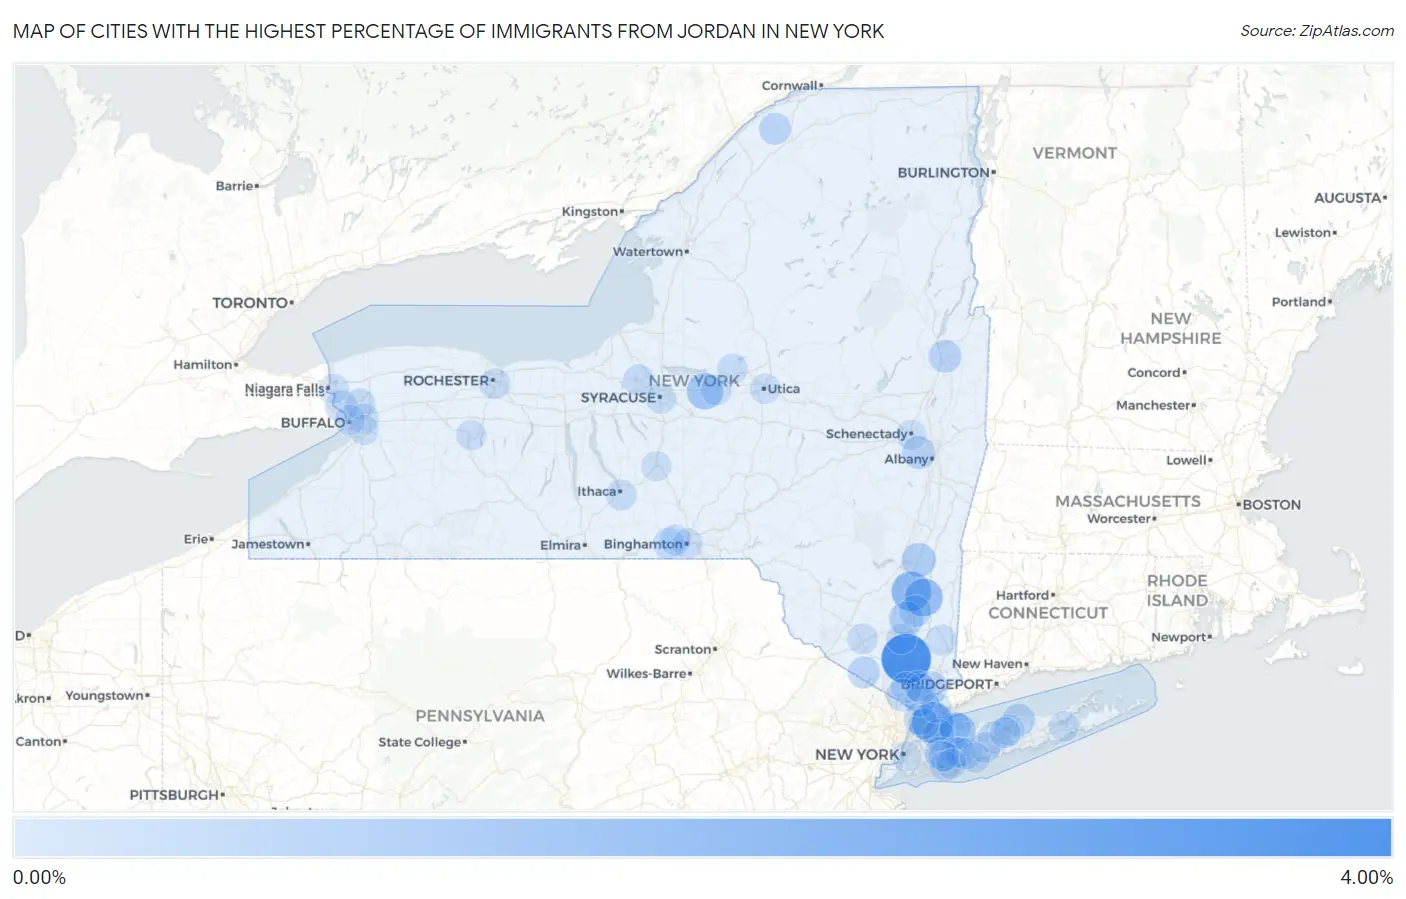
Map of Cities with the Highest Percentage of Immigrants from Jordan in New York
0.00%
4.00%
Cities with the Highest Percentage of Immigrants from Jordan in New York
| City | Jordan | vs State | vs National | |
| 1. | Fort Montgomery | 3.71% | 0.030%(+3.68)#-1 | 0.027%(+3.68)#0 |
| 2. | Larchmont | 2.05% | 0.030%(+2.02)#0 | 0.027%(+2.02)#1 |
| 3. | Hyde Park | 1.73% | 0.030%(+1.70)#1 | 0.027%(+1.71)#2 |
| 4. | Pleasant Valley | 1.46% | 0.030%(+1.43)#2 | 0.027%(+1.43)#3 |
| 5. | Canastota | 1.14% | 0.030%(+1.11)#3 | 0.027%(+1.12)#4 |
| 6. | Oyster Bay | 1.13% | 0.030%(+1.10)#4 | 0.027%(+1.10)#5 |
| 7. | Fairview Cdp Dutchess County | 0.91% | 0.030%(+0.881)#5 | 0.027%(+0.884)#6 |
| 8. | Red Hook | 0.77% | 0.030%(+0.741)#6 | 0.027%(+0.744)#7 |
| 9. | Marlboro | 0.77% | 0.030%(+0.741)#7 | 0.027%(+0.744)#8 |
| 10. | Westmere | 0.51% | 0.030%(+0.483)#8 | 0.027%(+0.486)#9 |
| 11. | Glens Falls | 0.51% | 0.030%(+0.479)#9 | 0.027%(+0.482)#10 |
| 12. | Nanuet | 0.49% | 0.030%(+0.456)#10 | 0.027%(+0.459)#11 |
| 13. | Chappaqua | 0.46% | 0.030%(+0.433)#11 | 0.027%(+0.436)#12 |
| 14. | Yonkers | 0.46% | 0.030%(+0.428)#17 | 0.027%(+0.431)#110 |
| 15. | Miller Place | 0.46% | 0.030%(+0.426)#18 | 0.027%(+0.429)#111 |
| 16. | Latham | 0.43% | 0.030%(+0.402)#19 | 0.027%(+0.405)#112 |
| 17. | Spackenkill | 0.37% | 0.030%(+0.339)#20 | 0.027%(+0.342)#113 |
| 18. | Madrid | 0.36% | 0.030%(+0.335)#21 | 0.027%(+0.338)#114 |
| 19. | Warwick | 0.35% | 0.030%(+0.316)#22 | 0.027%(+0.319)#115 |
| 20. | Grandyle Village | 0.34% | 0.030%(+0.307)#23 | 0.027%(+0.310)#116 |
| 21. | Hauppauge | 0.33% | 0.030%(+0.299)#24 | 0.027%(+0.302)#117 |
| 22. | Loudonville | 0.33% | 0.030%(+0.296)#25 | 0.027%(+0.299)#118 |
| 23. | Greenville Cdp Westchester County | 0.27% | 0.030%(+0.242)#26 | 0.027%(+0.245)#119 |
| 24. | Mill Neck | 0.27% | 0.030%(+0.241)#27 | 0.027%(+0.244)#120 |
| 25. | Port Washington North | 0.25% | 0.030%(+0.223)#28 | 0.027%(+0.226)#121 |
| 26. | Endicott | 0.25% | 0.030%(+0.221)#29 | 0.027%(+0.225)#122 |
| 27. | South Farmingdale | 0.23% | 0.030%(+0.203)#30 | 0.027%(+0.206)#123 |
| 28. | Stewart Manor | 0.22% | 0.030%(+0.193)#31 | 0.027%(+0.196)#124 |
| 29. | Baldwinsville | 0.21% | 0.030%(+0.177)#32 | 0.027%(+0.180)#125 |
| 30. | Centereach | 0.20% | 0.030%(+0.168)#33 | 0.027%(+0.171)#126 |
| 31. | Franklin Square | 0.17% | 0.030%(+0.139)#34 | 0.027%(+0.142)#127 |
| 32. | New City | 0.17% | 0.030%(+0.136)#35 | 0.027%(+0.139)#236 |
| 33. | Tarrytown | 0.16% | 0.030%(+0.132)#36 | 0.027%(+0.135)#237 |
| 34. | Endwell | 0.15% | 0.030%(+0.123)#37 | 0.027%(+0.126)#238 |
| 35. | South Hill | 0.15% | 0.030%(+0.122)#38 | 0.027%(+0.125)#239 |
| 36. | Mount Vernon | 0.15% | 0.030%(+0.116)#39 | 0.027%(+0.119)#240 |
| 37. | Baywood | 0.14% | 0.030%(+0.110)#40 | 0.027%(+0.113)#241 |
| 38. | Brighton | 0.13% | 0.030%(+0.103)#41 | 0.027%(+0.106)#242 |
| 39. | Lake Carmel | 0.12% | 0.030%(+0.094)#42 | 0.027%(+0.097)#243 |
| 40. | Ossining | 0.12% | 0.030%(+0.092)#43 | 0.027%(+0.095)#244 |
| 41. | Oneida | 0.12% | 0.030%(+0.087)#44 | 0.027%(+0.090)#245 |
| 42. | Scotchtown | 0.12% | 0.030%(+0.086)#45 | 0.027%(+0.089)#246 |
| 43. | University At Buffalo | 0.11% | 0.030%(+0.083)#46 | 0.027%(+0.087)#247 |
| 44. | Lake Grove | 0.11% | 0.030%(+0.079)#47 | 0.027%(+0.082)#248 |
| 45. | Binghamton | 0.084% | 0.030%(+0.054)#48 | 0.027%(+0.057)#249 |
| 46. | Harrison | 0.084% | 0.030%(+0.054)#49 | 0.027%(+0.057)#261 |
| 47. | New Windsor | 0.080% | 0.030%(+0.050)#50 | 0.027%(+0.053)#262 |
| 48. | East Meadow | 0.073% | 0.030%(+0.044)#51 | 0.027%(+0.047)#263 |
| 49. | Oceanside | 0.070% | 0.030%(+0.040)#52 | 0.027%(+0.043)#264 |
| 50. | Briarcliff Manor | 0.068% | 0.030%(+0.038)#53 | 0.027%(+0.041)#265 |
| 51. | Levittown | 0.061% | 0.030%(+0.031)#54 | 0.027%(+0.034)#266 |
| 52. | Rome | 0.053% | 0.030%(+0.023)#55 | 0.027%(+0.026)#267 |
| 53. | Geneseo | 0.052% | 0.030%(+0.022)#56 | 0.027%(+0.025)#268 |
| 54. | Utica | 0.051% | 0.030%(+0.021)#57 | 0.027%(+0.024)#269 |
| 55. | West Hempstead | 0.049% | 0.030%(+0.019)#58 | 0.027%(+0.022)#270 |
| 56. | Syracuse | 0.045% | 0.030%(+0.016)#59 | 0.027%(+0.019)#271 |
| 57. | Cheektowaga | 0.035% | 0.030%(+0.006)#60 | 0.027%(+0.009)#272 |
| 58. | Lindenhurst | 0.033% | 0.030%(+0.004)#61 | 0.027%(+0.007)#273 |
| 59. | Flanders | 0.031% | 0.030%(+0.002)#62 | 0.027%(+0.005)#274 |
| 60. | Cortland | 0.028% | 0.030%(-0.001)#63 | 0.027%(+0.002)#275 |
| 61. | West Seneca | 0.026% | 0.030%(-0.003)#64 | 0.027%(-0.000)#276 |
| 62. | New York | 0.025% | 0.030%(-0.004)#65 | 0.027%(-0.001)#277 |
| 63. | Schenectady | 0.023% | 0.030%(-0.006)#66 | 0.027%(-0.003)#278 |
| 64. | Buffalo | 0.017% | 0.030%(-0.012)#67 | 0.027%(-0.009)#279 |
| 65. | Niagara Falls | 0.014% | 0.030%(-0.015)#68 | 0.027%(-0.012)#280 |
| 66. | Freeport | 0.014% | 0.030%(-0.016)#69 | 0.027%(-0.013)#281 |
Common Questions
What are the Top 10 Cities with the Highest Percentage of Immigrants from Jordan in New York?
Top 10 Cities with the Highest Percentage of Immigrants from Jordan in New York are:
#1
3.71%
#2
2.05%
#3
1.73%
#4
1.46%
#5
1.14%
#6
1.13%
#7
0.77%
#8
0.77%
#9
0.51%
#10
0.51%
What city has the Highest Percentage of Immigrants from Jordan in New York?
Fort Montgomery has the Highest Percentage of Immigrants from Jordan in New York with 3.71%.
What is the Percentage of Immigrants from Jordan in the State of New York?
Percentage of Immigrants from Jordan in New York is 0.030%.
What is the Percentage of Immigrants from Jordan in the United States?
Percentage of Immigrants from Jordan in the United States is 0.027%.