Cities with the Highest Percentage of Immigrants from Scotland in New York
RELATED REPORTS & OPTIONS
Scotland
New York
Compare Cities
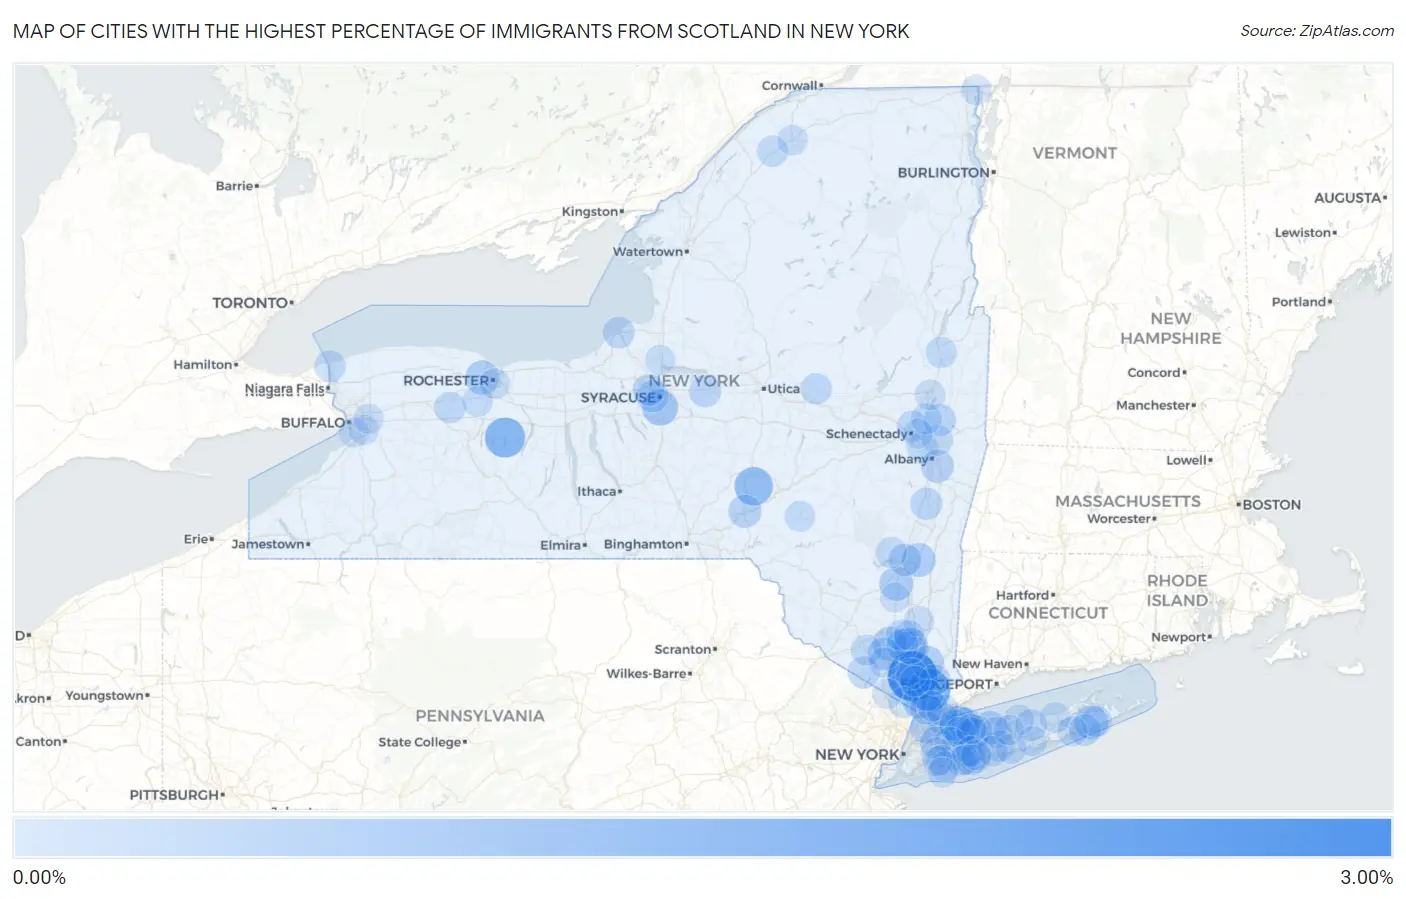
Map of Cities with the Highest Percentage of Immigrants from Scotland in New York
0.00%
3.00%
Cities with the Highest Percentage of Immigrants from Scotland in New York
| City | Scotland | vs State | vs National | |
| 1. | Crugers | 2.80% | 0.025%(+2.77)#1 | 0.017%(+2.78)#8 |
| 2. | Pleasantville | 1.86% | 0.025%(+1.83)#2 | 0.017%(+1.84)#25 |
| 3. | Honeoye | 1.43% | 0.025%(+1.41)#3 | 0.017%(+1.41)#35 |
| 4. | Gilbertsville | 1.19% | 0.025%(+1.16)#4 | 0.017%(+1.17)#49 |
| 5. | Centre Island | 1.10% | 0.025%(+1.08)#5 | 0.017%(+1.09)#56 |
| 6. | Nelsonville | 0.89% | 0.025%(+0.865)#6 | 0.017%(+0.873)#73 |
| 7. | Nedrow | 0.84% | 0.025%(+0.819)#7 | 0.017%(+0.827)#79 |
| 8. | North Gates | 0.61% | 0.025%(+0.586)#8 | 0.017%(+0.594)#119 |
| 9. | Beaver Dam Lake | 0.61% | 0.025%(+0.581)#9 | 0.017%(+0.589)#121 |
| 10. | Tarrytown | 0.59% | 0.025%(+0.560)#10 | 0.017%(+0.569)#128 |
| 11. | Tillson | 0.56% | 0.025%(+0.536)#11 | 0.017%(+0.544)#133 |
| 12. | Red Hook | 0.55% | 0.025%(+0.525)#12 | 0.017%(+0.533)#134 |
| 13. | Water Mill | 0.52% | 0.025%(+0.494)#13 | 0.017%(+0.503)#145 |
| 14. | Kings Park | 0.50% | 0.025%(+0.477)#14 | 0.017%(+0.485)#151 |
| 15. | Jefferson Valley Yorktown | 0.48% | 0.025%(+0.458)#15 | 0.017%(+0.466)#160 |
| 16. | East Greenbush | 0.44% | 0.025%(+0.416)#16 | 0.017%(+0.424)#179 |
| 17. | Sidney | 0.43% | 0.025%(+0.401)#17 | 0.017%(+0.409)#187 |
| 18. | Lloyd Harbor | 0.42% | 0.025%(+0.394)#18 | 0.017%(+0.403)#190 |
| 19. | South Blooming Grove | 0.39% | 0.025%(+0.363)#19 | 0.017%(+0.371)#205 |
| 20. | Lake Katrine | 0.38% | 0.025%(+0.356)#20 | 0.017%(+0.364)#213 |
| 21. | Cold Spring | 0.38% | 0.025%(+0.354)#21 | 0.017%(+0.362)#217 |
| 22. | Greenlawn | 0.36% | 0.025%(+0.337)#22 | 0.017%(+0.345)#228 |
| 23. | Huntington Station | 0.36% | 0.025%(+0.330)#23 | 0.017%(+0.338)#234 |
| 24. | Pelham Manor | 0.35% | 0.025%(+0.327)#24 | 0.017%(+0.335)#236 |
| 25. | Solvay | 0.33% | 0.025%(+0.308)#25 | 0.017%(+0.316)#247 |
| 26. | Warwick | 0.33% | 0.025%(+0.305)#26 | 0.017%(+0.313)#252 |
| 27. | Cornwall On Hudson | 0.33% | 0.025%(+0.303)#27 | 0.017%(+0.311)#255 |
| 28. | Coxsackie | 0.33% | 0.025%(+0.300)#28 | 0.017%(+0.308)#256 |
| 29. | Rye | 0.32% | 0.025%(+0.297)#29 | 0.017%(+0.305)#258 |
| 30. | Mechanicville | 0.31% | 0.025%(+0.284)#30 | 0.017%(+0.292)#271 |
| 31. | Canastota | 0.31% | 0.025%(+0.282)#31 | 0.017%(+0.290)#273 |
| 32. | Hartsdale | 0.29% | 0.025%(+0.267)#32 | 0.017%(+0.275)#294 |
| 33. | Lakeland | 0.28% | 0.025%(+0.253)#33 | 0.017%(+0.261)#310 |
| 34. | Port Chester | 0.28% | 0.025%(+0.253)#34 | 0.017%(+0.261)#311 |
| 35. | Ridge | 0.28% | 0.025%(+0.252)#35 | 0.017%(+0.260)#312 |
| 36. | Kensington | 0.28% | 0.025%(+0.251)#36 | 0.017%(+0.259)#313 |
| 37. | Oswego | 0.27% | 0.025%(+0.250)#37 | 0.017%(+0.258)#316 |
| 38. | Southampton | 0.27% | 0.025%(+0.242)#38 | 0.017%(+0.250)#326 |
| 39. | Youngstown | 0.25% | 0.025%(+0.229)#39 | 0.017%(+0.237)#344 |
| 40. | Le Roy | 0.25% | 0.025%(+0.228)#40 | 0.017%(+0.237)#345 |
| 41. | Lindenhurst | 0.25% | 0.025%(+0.225)#41 | 0.017%(+0.233)#349 |
| 42. | North Great River | 0.24% | 0.025%(+0.219)#42 | 0.017%(+0.227)#359 |
| 43. | Hicksville | 0.24% | 0.025%(+0.213)#43 | 0.017%(+0.221)#364 |
| 44. | Farmingdale | 0.24% | 0.025%(+0.212)#44 | 0.017%(+0.220)#368 |
| 45. | Bayville | 0.24% | 0.025%(+0.211)#45 | 0.017%(+0.219)#370 |
| 46. | Hawthorne | 0.23% | 0.025%(+0.209)#46 | 0.017%(+0.217)#378 |
| 47. | Dolgeville | 0.23% | 0.025%(+0.204)#47 | 0.017%(+0.212)#386 |
| 48. | Village Of The Branch | 0.23% | 0.025%(+0.204)#48 | 0.017%(+0.212)#387 |
| 49. | East Glenville | 0.22% | 0.025%(+0.192)#49 | 0.017%(+0.200)#401 |
| 50. | Montrose | 0.21% | 0.025%(+0.189)#50 | 0.017%(+0.197)#402 |
| 51. | Bridgehampton | 0.21% | 0.025%(+0.186)#51 | 0.017%(+0.194)#408 |
| 52. | Woodstock | 0.21% | 0.025%(+0.183)#52 | 0.017%(+0.191)#414 |
| 53. | Canton | 0.21% | 0.025%(+0.182)#53 | 0.017%(+0.190)#419 |
| 54. | Oyster Bay Cove | 0.21% | 0.025%(+0.181)#54 | 0.017%(+0.189)#423 |
| 55. | Pearl River | 0.20% | 0.025%(+0.175)#55 | 0.017%(+0.184)#435 |
| 56. | Colonie | 0.19% | 0.025%(+0.168)#56 | 0.017%(+0.176)#452 |
| 57. | Mount Kisco | 0.18% | 0.025%(+0.159)#57 | 0.017%(+0.167)#472 |
| 58. | Milton Cdp Saratoga County | 0.18% | 0.025%(+0.157)#58 | 0.017%(+0.165)#479 |
| 59. | Old Westbury | 0.18% | 0.025%(+0.156)#59 | 0.017%(+0.164)#482 |
| 60. | Glens Falls North | 0.18% | 0.025%(+0.152)#60 | 0.017%(+0.160)#491 |
| 61. | Goshen | 0.17% | 0.025%(+0.149)#61 | 0.017%(+0.157)#504 |
| 62. | Cohoes | 0.17% | 0.025%(+0.147)#62 | 0.017%(+0.155)#506 |
| 63. | Country Knolls | 0.17% | 0.025%(+0.147)#63 | 0.017%(+0.155)#507 |
| 64. | Newburgh | 0.17% | 0.025%(+0.145)#64 | 0.017%(+0.153)#512 |
| 65. | Amityville | 0.15% | 0.025%(+0.122)#65 | 0.017%(+0.130)#567 |
| 66. | Riverhead | 0.13% | 0.025%(+0.107)#66 | 0.017%(+0.115)#601 |
| 67. | Delhi | 0.13% | 0.025%(+0.102)#67 | 0.017%(+0.110)#620 |
| 68. | Croton On Hudson | 0.12% | 0.025%(+0.096)#68 | 0.017%(+0.104)#644 |
| 69. | Scottsville | 0.12% | 0.025%(+0.095)#69 | 0.017%(+0.103)#646 |
| 70. | Brighton | 0.11% | 0.025%(+0.089)#70 | 0.017%(+0.097)#662 |
| 71. | Saratoga Springs | 0.11% | 0.025%(+0.087)#71 | 0.017%(+0.095)#671 |
| 72. | Miller Place | 0.11% | 0.025%(+0.084)#72 | 0.017%(+0.092)#675 |
| 73. | Potsdam | 0.11% | 0.025%(+0.080)#73 | 0.017%(+0.088)#695 |
| 74. | Myers Corner | 0.10% | 0.025%(+0.078)#74 | 0.017%(+0.086)#704 |
| 75. | Bellerose | 0.10% | 0.025%(+0.075)#75 | 0.017%(+0.083)#717 |
| 76. | East Farmingdale | 0.099% | 0.025%(+0.074)#76 | 0.017%(+0.082)#720 |
| 77. | Islip | 0.098% | 0.025%(+0.073)#77 | 0.017%(+0.081)#724 |
| 78. | Central Square | 0.096% | 0.025%(+0.071)#78 | 0.017%(+0.079)#733 |
| 79. | Monroe | 0.096% | 0.025%(+0.070)#79 | 0.017%(+0.078)#735 |
| 80. | White Plains | 0.086% | 0.025%(+0.060)#80 | 0.017%(+0.068)#777 |
| 81. | Rouses Point | 0.079% | 0.025%(+0.054)#81 | 0.017%(+0.062)#820 |
| 82. | Bayport | 0.078% | 0.025%(+0.053)#82 | 0.017%(+0.061)#825 |
| 83. | Oceanside | 0.073% | 0.025%(+0.048)#83 | 0.017%(+0.056)#857 |
| 84. | Centereach | 0.072% | 0.025%(+0.047)#84 | 0.017%(+0.055)#862 |
| 85. | Beacon | 0.072% | 0.025%(+0.047)#85 | 0.017%(+0.055)#863 |
| 86. | Hampton Bays | 0.071% | 0.025%(+0.045)#86 | 0.017%(+0.053)#869 |
| 87. | Malverne | 0.070% | 0.025%(+0.045)#87 | 0.017%(+0.053)#875 |
| 88. | Seaford | 0.069% | 0.025%(+0.044)#88 | 0.017%(+0.052)#878 |
| 89. | Massapequa | 0.069% | 0.025%(+0.043)#89 | 0.017%(+0.051)#885 |
| 90. | Lackawanna | 0.066% | 0.025%(+0.040)#90 | 0.017%(+0.048)#902 |
| 91. | Valley Stream | 0.065% | 0.025%(+0.039)#91 | 0.017%(+0.047)#912 |
| 92. | West Babylon | 0.061% | 0.025%(+0.035)#92 | 0.017%(+0.043)#936 |
| 93. | West Seneca | 0.059% | 0.025%(+0.034)#93 | 0.017%(+0.042)#946 |
| 94. | Long Beach | 0.058% | 0.025%(+0.032)#94 | 0.017%(+0.040)#957 |
| 95. | Depew | 0.053% | 0.025%(+0.027)#95 | 0.017%(+0.035)#995 |
| 96. | Shirley | 0.053% | 0.025%(+0.027)#96 | 0.017%(+0.035)#996 |
| 97. | Suffern | 0.053% | 0.025%(+0.027)#97 | 0.017%(+0.035)#998 |
| 98. | New Paltz | 0.052% | 0.025%(+0.026)#98 | 0.017%(+0.034)#1,008 |
| 99. | Huntington | 0.051% | 0.025%(+0.026)#99 | 0.017%(+0.034)#1,013 |
| 100. | Niskayuna | 0.048% | 0.025%(+0.023)#100 | 0.017%(+0.031)#1,028 |
Common Questions
What are the Top 10 Cities with the Highest Percentage of Immigrants from Scotland in New York?
Top 10 Cities with the Highest Percentage of Immigrants from Scotland in New York are:
#1
2.80%
#2
1.86%
#3
1.43%
#4
1.19%
#5
1.10%
#6
0.89%
#7
0.84%
#8
0.61%
#9
0.61%
#10
0.59%
What city has the Highest Percentage of Immigrants from Scotland in New York?
Crugers has the Highest Percentage of Immigrants from Scotland in New York with 2.80%.
What is the Percentage of Immigrants from Scotland in the State of New York?
Percentage of Immigrants from Scotland in New York is 0.025%.
What is the Percentage of Immigrants from Scotland in the United States?
Percentage of Immigrants from Scotland in the United States is 0.017%.