Cities with the Highest Percentage of Immigrants from Singapore in New York

RELATED REPORTS & OPTIONS

Singapore
Population
Families and Households
Female Fertility
Female Fertility (Unmarried)
Race (Community Size)
Race (Percentage)
Ancestry (Community Size)
AfghanAfricanAlaska NativeAlaskan AthabascanAlbanianAleutAlsatianAmericanApacheArabArapahoArgentineanArmenianAssyrian / Chaldean / SyriacAustralianAustrianBahamianBangladeshiBarbadianBasqueBelgianBelizeanBermudanBhutaneseBlackfeetBolivianBrazilianBritishBritish West IndianBulgarianBurmeseCajunCambodianCanadianCape VerdeanCarpatho RusynCelticCentral AmericanCentral American IndianCherokeeCheyenneChickasawChileanChineseChippewaChoctawColombianColvilleComancheCosta RicanCreeCreekCroatianCrowCubanCypriotCzechCzechoslovakianDanishDelawareDominicanDutchDutch West IndianEastern EuropeanEcuadorianEgyptianEnglishEstonianEthiopianEuropeanFijianFilipinoFinnishFrenchFrench American IndianFrench CanadianGermanGerman RussianGhanaianGreekGuamanian / ChamorroGuatemalanGuyaneseHaitianHmongHonduranHopiHoumaHungarianIcelanderIndian (Asian)IndonesianInupiatIranianIraqiIrishIroquoisIsraeliItalianJamaicanJapaneseJordanianKenyanKiowaKoreanLaotianLatvianLebaneseLiberianLithuanianLumbeeLuxembourgerMacedonianMalaysianMalteseMarshalleseMenomineeMexicanMexican American IndianMongolianMoroccanNative HawaiianNavajoNepaleseNew ZealanderNicaraguanNigerianNorthern EuropeanNorwegianOkinawanOsageOttawaPaiutePakistaniPalestinianPanamanianParaguayanPennsylvania GermanPeruvianPimaPolishPortuguesePotawatomiPuebloPuerto RicanPuget Sound SalishRomanianRussianSalvadoranSamoanScandinavianScotch-IrishScottishSeminoleSenegaleseSerbianShoshoneSierra LeoneanSiouxSlavicSlovakSloveneSomaliSouth AfricanSouth AmericanSouth American IndianSoviet UnionSpaniardSpanishSpanish AmericanSpanish American IndianSri LankanSubsaharan AfricanSudaneseSwedishSwissSyrianTaiwaneseThaiTlingit-HaidaTohono O'OdhamTonganTrinidadian and TobagonianTsimshianTurkishU.S. Virgin IslanderUgandanUkrainianUruguayanUteVenezuelanVietnameseWelshWest IndianYakamaYaquiYugoslavianYumanYup'ikZimbabwean
Ancestry (Percentage)
AfghanAfricanAlaska NativeAlaskan AthabascanAlbanianAleutAlsatianAmericanApacheArabArapahoArgentineanArmenianAssyrian / Chaldean / SyriacAustralianAustrianBahamianBangladeshiBarbadianBasqueBelgianBelizeanBermudanBhutaneseBlackfeetBolivianBrazilianBritishBritish West IndianBulgarianBurmeseCajunCambodianCanadianCape VerdeanCarpatho RusynCelticCentral AmericanCentral American IndianCherokeeCheyenneChickasawChileanChineseChippewaChoctawColombianColvilleComancheCosta RicanCreeCreekCroatianCrowCubanCypriotCzechCzechoslovakianDanishDelawareDominicanDutchDutch West IndianEastern EuropeanEcuadorianEgyptianEnglishEstonianEthiopianEuropeanFijianFilipinoFinnishFrenchFrench American IndianFrench CanadianGermanGerman RussianGhanaianGreekGuamanian / ChamorroGuatemalanGuyaneseHaitianHmongHonduranHopiHoumaHungarianIcelanderIndian (Asian)IndonesianInupiatIranianIraqiIrishIroquoisIsraeliItalianJamaicanJapaneseJordanianKenyanKiowaKoreanLaotianLatvianLebaneseLiberianLithuanianLumbeeLuxembourgerMacedonianMalaysianMalteseMarshalleseMenomineeMexicanMexican American IndianMongolianMoroccanNative HawaiianNavajoNepaleseNew ZealanderNicaraguanNigerianNorthern EuropeanNorwegianOkinawanOsageOttawaPaiutePakistaniPalestinianPanamanianParaguayanPennsylvania GermanPeruvianPimaPolishPortuguesePotawatomiPuebloPuerto RicanPuget Sound SalishRomanianRussianSalvadoranSamoanScandinavianScotch-IrishScottishSeminoleSenegaleseSerbianShoshoneSierra LeoneanSiouxSlavicSlovakSloveneSomaliSouth AfricanSouth AmericanSouth American IndianSoviet UnionSpaniardSpanishSpanish AmericanSpanish American IndianSri LankanSubsaharan AfricanSudaneseSwedishSwissSyrianTaiwaneseThaiTlingit-HaidaTohono O'OdhamTonganTrinidadian and TobagonianTsimshianTurkishU.S. Virgin IslanderUgandanUkrainianUruguayanUteVenezuelanVietnameseWelshWest IndianYakamaYaquiYugoslavianYumanYup'ikZimbabwean
Immigrant Origin (Total)
AfghanistanAfricaAlbaniaArgentinaArmeniaAsiaAustraliaAustriaAzoresBahamasBangladeshBarbadosBelarusBelgiumBelizeBoliviaBosnia and HerzegovinaBrazilBulgariaBurma / MyanmarCabo VerdeCambodiaCameroonCanadaCaribbeanCentral AmericaChileChinaColombiaCongoCosta RicaCroatiaCubaCzechoslovakiaDenmarkDominicaDominican RepublicEastern AfricaEastern AsiaEastern EuropeEcuadorEgyptEl SalvadorEnglandEritreaEthiopiaEuropeFijiFranceGermanyGhanaGreeceGrenadaGuatemalaGuyanaHaitiHondurasHong KongHungaryIndiaIndonesiaIranIraqIrelandIsraelItalyJamaicaJapanJordanKazakhstanKenyaKoreaKuwaitLaosLatin AmericaLatviaLebanonLiberiaLithuaniaMalaysiaMexicoMicronesiaMiddle AfricaMoldovaMoroccoNepalNetherlandsNicaraguaNigeriaNorth MacedoniaNorthern AfricaNorthern EuropeNorwayOceaniaPakistanPanamaPeruPhilippinesPolandPortugalRomaniaRussiaSaudi ArabiaScotlandSenegalSerbiaSierra LeoneSingaporeSomaliaSouth AfricaSouth AmericaSouth Central AsiaSouth Eastern AsiaSouthern EuropeSpainSri LankaSt. Vincent and the GrenadinesSudanSwedenSwitzerlandSyriaTaiwanThailandTrinidad and TobagoTurkeyUgandaUkraineUruguayUzbekistanVenezuelaVietnamWest IndiesWestern AfricaWestern AsiaWestern EuropeYemenZaireZimbabwe
Immigrant Origin (Percentage)
AfghanistanAfricaAlbaniaArgentinaArmeniaAsiaAustraliaAustriaAzoresBahamasBangladeshBarbadosBelarusBelgiumBelizeBoliviaBosnia and HerzegovinaBrazilBulgariaBurma / MyanmarCabo VerdeCambodiaCameroonCanadaCaribbeanCentral AmericaChileChinaColombiaCongoCosta RicaCroatiaCubaCzechoslovakiaDenmarkDominicaDominican RepublicEastern AfricaEastern AsiaEastern EuropeEcuadorEgyptEl SalvadorEnglandEritreaEthiopiaEuropeFijiFranceGermanyGhanaGreeceGrenadaGuatemalaGuyanaHaitiHondurasHong KongHungaryIndiaIndonesiaIranIraqIrelandIsraelItalyJamaicaJapanJordanKazakhstanKenyaKoreaKuwaitLaosLatin AmericaLatviaLebanonLiberiaLithuaniaMalaysiaMexicoMicronesiaMiddle AfricaMoldovaMoroccoNepalNetherlandsNicaraguaNigeriaNorth MacedoniaNorthern AfricaNorthern EuropeNorwayOceaniaPakistanPanamaPeruPhilippinesPolandPortugalRomaniaRussiaSaudi ArabiaScotlandSenegalSerbiaSierra LeoneSingaporeSomaliaSouth AfricaSouth AmericaSouth Central AsiaSouth Eastern AsiaSouthern EuropeSpainSri LankaSt. Vincent and the GrenadinesSudanSwedenSwitzerlandSyriaTaiwanThailandTrinidad and TobagoTurkeyUgandaUkraineUruguayUzbekistanVenezuelaVietnamWest IndiesWestern AfricaWestern AsiaWestern EuropeYemenZaireZimbabwe
Income
Income (Families)
Income (Households)
Poverty
Poverty (Families)
Unemployment
Employment Occupations
Employment Industries
Employer Class
Commute Time
Commute Means
School Enrollment
Education by Degree Field
Occupancy
Finances
Physical Characteristics
New York
Compare Cities
Comparison Subject

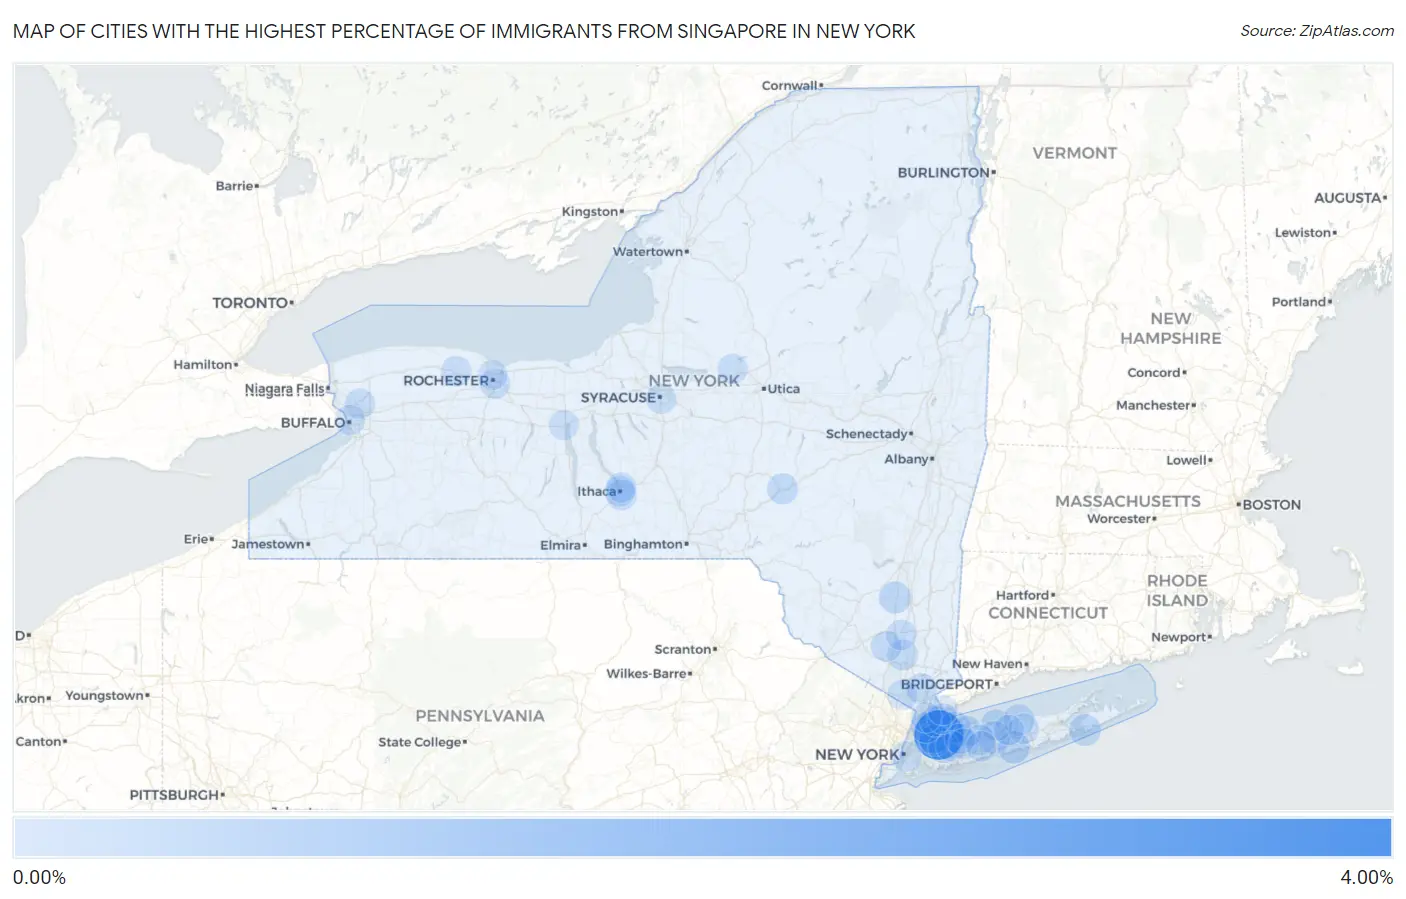
Map of Cities with the Highest Percentage of Immigrants from Singapore in New York

0.00%
4.00%
Cities with the Highest Percentage of Immigrants from Singapore in New York Map

Cities with the Highest Percentage of Immigrants from Singapore in New York

City Singapore vs State vs National
1.Port Washington North3.22%0.019%(+3.20)#-10.011%(+3.21)#0
2.St. John Fisher College0.47%0.019%(+0.451)#00.011%(+0.460)#1
3.Hauppauge0.33%0.019%(+0.314)#10.011%(+0.323)#2
4.Blue Point0.32%0.019%(+0.306)#20.011%(+0.314)#3
5.Southampton0.29%0.019%(+0.271)#1000.011%(+0.279)#2,082
6.New Paltz0.28%0.019%(+0.265)#3790.011%(+0.274)#7,120
7.Mill Neck0.27%0.019%(+0.251)#3800.011%(+0.260)#7,121
8.Kings Point0.27%0.019%(+0.249)#3810.011%(+0.257)#7,122
9.Nissequogue0.20%0.019%(+0.178)#3820.011%(+0.186)#7,123
10.Great Neck0.17%0.019%(+0.153)#3830.011%(+0.161)#7,124
11.Miller Place0.17%0.019%(+0.150)#3840.011%(+0.158)#7,125
12.Cold Spring Harbor0.17%0.019%(+0.149)#3850.011%(+0.157)#7,126
13.Oneonta0.14%0.019%(+0.123)#3860.011%(+0.131)#7,127
14.West Point0.13%0.019%(+0.106)#3870.011%(+0.115)#7,128
15.South Hill0.11%0.019%(+0.087)#3880.011%(+0.095)#7,129
16.Williston Park0.093%0.019%(+0.074)#3890.011%(+0.082)#7,130
17.Pelham Manor0.088%0.019%(+0.069)#3900.011%(+0.077)#7,131
18.Washingtonville0.087%0.019%(+0.068)#3910.011%(+0.077)#7,132
19.Mamaroneck0.085%0.019%(+0.066)#3920.011%(+0.075)#7,133
20.Briarcliff Manor0.081%0.019%(+0.062)#3930.011%(+0.070)#7,134
21.Newburgh0.073%0.019%(+0.054)#3940.011%(+0.062)#7,135
22.Westbury0.070%0.019%(+0.050)#3950.011%(+0.059)#7,136
23.Dix Hills0.065%0.019%(+0.046)#3960.011%(+0.054)#7,137
24.Nanuet0.063%0.019%(+0.044)#3970.011%(+0.052)#7,138
25.Middle Island0.056%0.019%(+0.037)#3980.011%(+0.045)#7,139
26.Brockport0.056%0.019%(+0.036)#3990.011%(+0.045)#7,140
27.Syosset0.053%0.019%(+0.034)#4000.011%(+0.042)#7,141
28.Rye0.049%0.019%(+0.029)#4010.011%(+0.038)#7,142
29.Ithaca0.048%0.019%(+0.029)#4020.011%(+0.037)#7,143
30.Brighton0.041%0.019%(+0.021)#4030.011%(+0.030)#7,144
31.Eastchester0.039%0.019%(+0.020)#4040.011%(+0.028)#7,145
32.Plainview0.038%0.019%(+0.018)#4050.011%(+0.027)#7,146
33.New York0.035%0.019%(+0.015)#4060.011%(+0.024)#7,147
34.Centereach0.034%0.019%(+0.015)#4070.011%(+0.024)#7,148
35.University At Buffalo0.032%0.019%(+0.013)#4080.011%(+0.022)#7,401
36.Deer Park0.029%0.019%(+0.010)#4090.011%(+0.019)#7,402
37.Cayuga Heights0.025%0.019%(+0.005)#4100.011%(+0.014)#7,403
38.Syracuse0.024%0.019%(+0.005)#4110.011%(+0.013)#7,404
39.Buffalo0.023%0.019%(+0.004)#4120.011%(+0.013)#7,405
40.Port Chester0.016%0.019%(-0.003)#4130.011%(+0.005)#7,406
41.Geneva0.016%0.019%(-0.003)#4140.011%(+0.005)#7,407
42.Rome0.016%0.019%(-0.004)#4150.011%(+0.005)#7,408
43.Rochester0.013%0.019%(-0.006)#4160.011%(+0.002)#7,409

Common Questions

What are the Top 10 Cities with the Highest Percentage of Immigrants from Singapore in New York?
Top 10 Cities with the Highest Percentage of Immigrants from Singapore in New York are:
What city has the Highest Percentage of Immigrants from Singapore in New York?
Port Washington North has the Highest Percentage of Immigrants from Singapore in New York with 3.22%.
What is the Percentage of Immigrants from Singapore in the State of New York?
Percentage of Immigrants from Singapore in New York is 0.019%.
What is the Percentage of Immigrants from Singapore in the United States?
Percentage of Immigrants from Singapore in the United States is 0.011%.