Franklin Square, NY
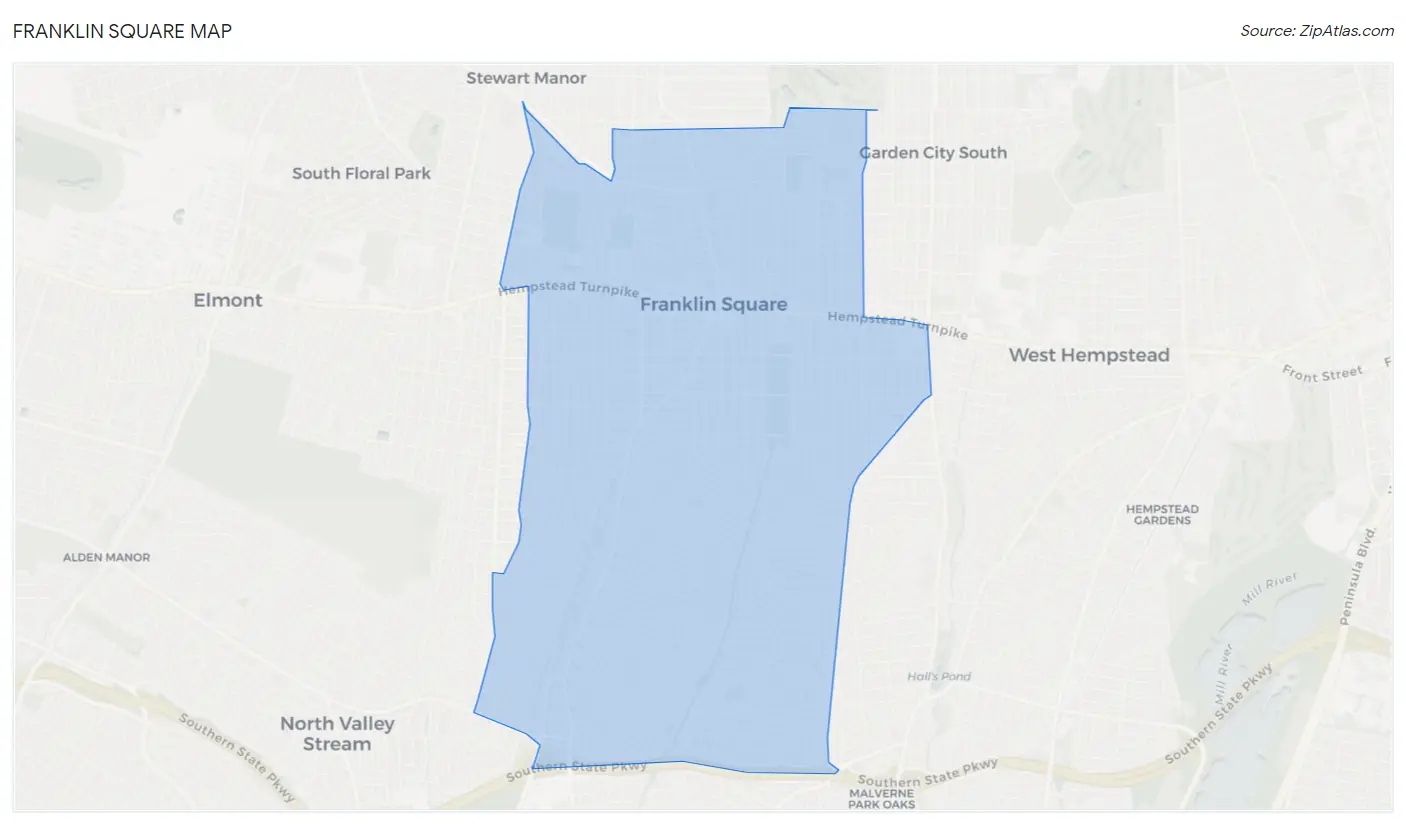
Franklin Square Map
Franklin Square Overview
31,969
TOTAL POPULATION
15,467
MALE POPULATION
16,502
FEMALE POPULATION
93.73
MALES / 100 FEMALES
106.69
FEMALES / 100 MALES
40.7
MEDIAN AGE
3.6
AVG FAMILY SIZE
3.2
AVG HOUSEHOLD SIZE
$48,801
PER CAPITA INCOME
$145,535
AVG FAMILY INCOME
$136,225
AVG HOUSEHOLD INCOME
32.4%
WAGE / INCOME GAP [ % ]
67.6¢/ $1
WAGE / INCOME GAP [ $ ]
0.38
INEQUALITY / GINI INDEX
17,871
LABOR FORCE [ PEOPLE ]
67.7%
PERCENT IN LABOR FORCE
3.9%
UNEMPLOYMENT RATE
Franklin Square Zip Codes
Franklin Square Area Codes
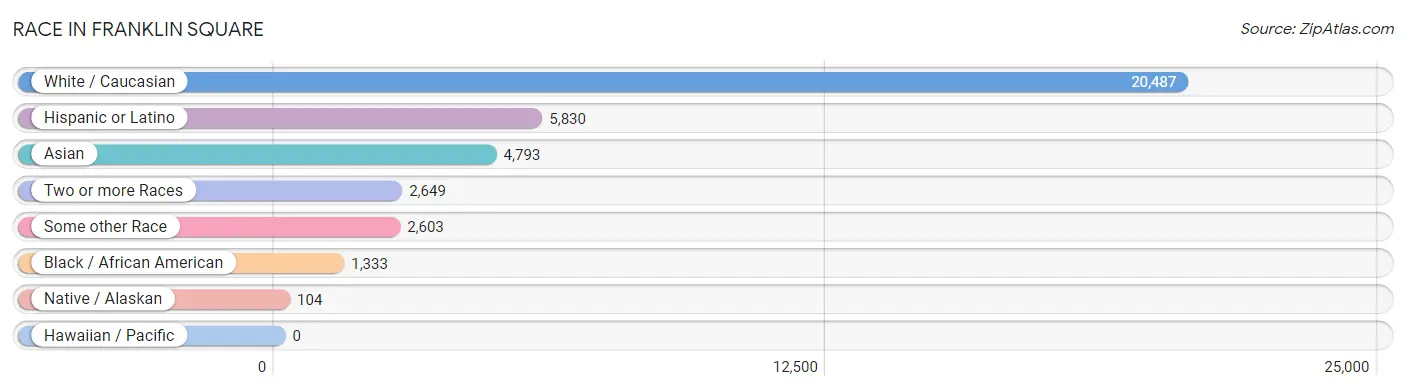
Race in Franklin Square
The most populous races in Franklin Square are White / Caucasian (20,487 | 64.1%), Hispanic or Latino (5,830 | 18.2%), and Asian (4,793 | 15.0%).
| Race | # Population | % Population |
| Asian | 4,793 | 15.0% |
| Black / African American | 1,333 | 4.2% |
| Hawaiian / Pacific | 0 | 0.0% |
| Hispanic or Latino | 5,830 | 18.2% |
| Native / Alaskan | 104 | 0.3% |
| White / Caucasian | 20,487 | 64.1% |
| Two or more Races | 2,649 | 8.3% |
| Some other Race | 2,603 | 8.1% |
| Total | 31,969 | 100.0% |
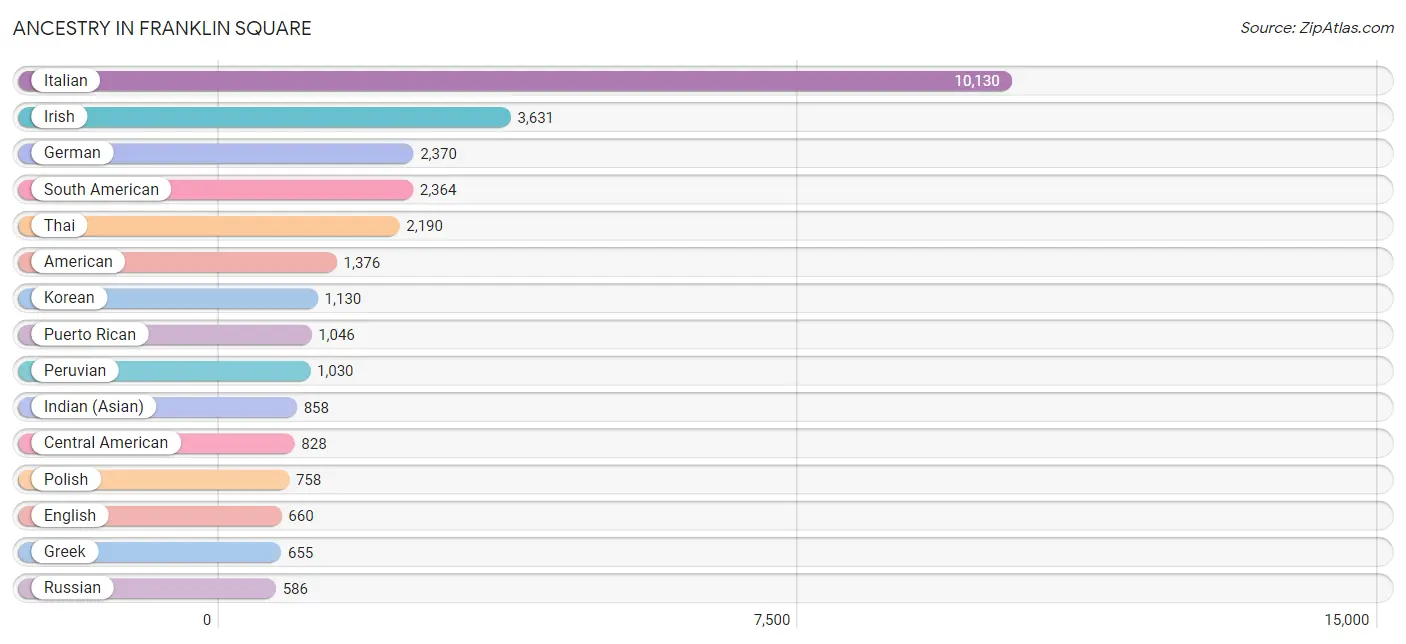
Ancestry in Franklin Square
The most populous ancestries reported in Franklin Square are Italian (10,130 | 31.7%), Irish (3,631 | 11.4%), German (2,370 | 7.4%), South American (2,364 | 7.4%), and Thai (2,190 | 6.9%), together accounting for 64.7% of all Franklin Square residents.
| Ancestry | # Population | % Population |
| African | 54 | 0.2% |
| American | 1,376 | 4.3% |
| Arab | 218 | 0.7% |
| Argentinean | 302 | 0.9% |
| Armenian | 20 | 0.1% |
| Austrian | 144 | 0.4% |
| Belgian | 40 | 0.1% |
| Bhutanese | 3 | 0.0% |
| Bolivian | 10 | 0.0% |
| British | 14 | 0.0% |
| British West Indian | 45 | 0.1% |
| Burmese | 140 | 0.4% |
| Canadian | 8 | 0.0% |
| Central American | 828 | 2.6% |
| Central American Indian | 26 | 0.1% |
| Chilean | 70 | 0.2% |
| Colombian | 422 | 1.3% |
| Costa Rican | 9 | 0.0% |
| Croatian | 87 | 0.3% |
| Cuban | 382 | 1.2% |
| Cypriot | 35 | 0.1% |
| Czech | 30 | 0.1% |
| Czechoslovakian | 74 | 0.2% |
| Danish | 44 | 0.1% |
| Dominican | 452 | 1.4% |
| Dutch | 118 | 0.4% |
| Eastern European | 79 | 0.3% |
| Ecuadorian | 357 | 1.1% |
| Egyptian | 63 | 0.2% |
| English | 660 | 2.1% |
| European | 165 | 0.5% |
| Filipino | 21 | 0.1% |
| French | 87 | 0.3% |
| French Canadian | 26 | 0.1% |
| German | 2,370 | 7.4% |
| Greek | 655 | 2.1% |
| Guatemalan | 180 | 0.6% |
| Guyanese | 160 | 0.5% |
| Haitian | 151 | 0.5% |
| Honduran | 231 | 0.7% |
| Hungarian | 111 | 0.4% |
| Indian (Asian) | 858 | 2.7% |
| Irish | 3,631 | 11.4% |
| Iroquois | 78 | 0.2% |
| Israeli | 50 | 0.2% |
| Italian | 10,130 | 31.7% |
| Jamaican | 94 | 0.3% |
| Jordanian | 123 | 0.4% |
| Korean | 1,130 | 3.5% |
| Lebanese | 17 | 0.1% |
| Lithuanian | 93 | 0.3% |
| Macedonian | 9 | 0.0% |
| Maltese | 54 | 0.2% |
| Mexican | 420 | 1.3% |
| Mexican American Indian | 12 | 0.0% |
| Northern European | 42 | 0.1% |
| Norwegian | 65 | 0.2% |
| Panamanian | 21 | 0.1% |
| Paraguayan | 4 | 0.0% |
| Peruvian | 1,030 | 3.2% |
| Polish | 758 | 2.4% |
| Portuguese | 246 | 0.8% |
| Puerto Rican | 1,046 | 3.3% |
| Romanian | 91 | 0.3% |
| Russian | 586 | 1.8% |
| Salvadoran | 387 | 1.2% |
| Scotch-Irish | 32 | 0.1% |
| Scottish | 209 | 0.6% |
| Slovak | 21 | 0.1% |
| Slovene | 16 | 0.1% |
| South American | 2,364 | 7.4% |
| South American Indian | 110 | 0.3% |
| Spaniard | 50 | 0.2% |
| Spanish | 57 | 0.2% |
| Subsaharan African | 54 | 0.2% |
| Swedish | 119 | 0.4% |
| Swiss | 16 | 0.1% |
| Syrian | 7 | 0.0% |
| Thai | 2,190 | 6.9% |
| Trinidadian and Tobagonian | 114 | 0.4% |
| Turkish | 20 | 0.1% |
| Ukrainian | 301 | 0.9% |
| Uruguayan | 14 | 0.0% |
| Vietnamese | 69 | 0.2% |
| West Indian | 7 | 0.0% |
| Yugoslavian | 15 | 0.1% | View All 86 Rows |
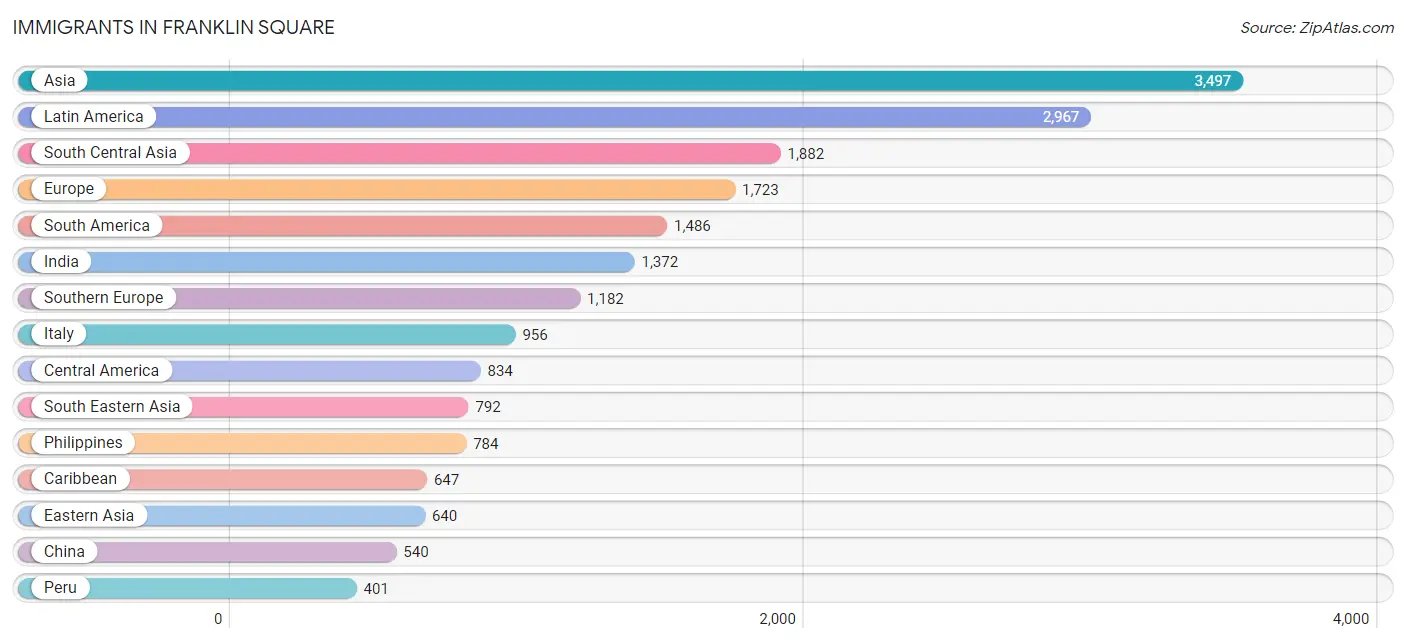
Immigrants in Franklin Square
The most numerous immigrant groups reported in Franklin Square came from Asia (3,497 | 10.9%), Latin America (2,967 | 9.3%), South Central Asia (1,882 | 5.9%), Europe (1,723 | 5.4%), and South America (1,486 | 4.6%), together accounting for 36.1% of all Franklin Square residents.
| Immigration Origin | # Population | % Population |
| Africa | 47 | 0.2% |
| Argentina | 163 | 0.5% |
| Asia | 3,497 | 10.9% |
| Austria | 25 | 0.1% |
| Bangladesh | 132 | 0.4% |
| Belgium | 20 | 0.1% |
| Brazil | 58 | 0.2% |
| Canada | 35 | 0.1% |
| Caribbean | 647 | 2.0% |
| Central America | 834 | 2.6% |
| Chile | 47 | 0.2% |
| China | 540 | 1.7% |
| Colombia | 222 | 0.7% |
| Costa Rica | 9 | 0.0% |
| Croatia | 19 | 0.1% |
| Cuba | 26 | 0.1% |
| Dominican Republic | 171 | 0.5% |
| Eastern Asia | 640 | 2.0% |
| Eastern Europe | 371 | 1.2% |
| Ecuador | 193 | 0.6% |
| Egypt | 25 | 0.1% |
| El Salvador | 236 | 0.7% |
| England | 7 | 0.0% |
| Europe | 1,723 | 5.4% |
| Germany | 67 | 0.2% |
| Greece | 96 | 0.3% |
| Grenada | 49 | 0.2% |
| Guatemala | 156 | 0.5% |
| Guyana | 385 | 1.2% |
| Haiti | 159 | 0.5% |
| Honduras | 155 | 0.5% |
| Hong Kong | 39 | 0.1% |
| Hungary | 79 | 0.3% |
| India | 1,372 | 4.3% |
| Israel | 19 | 0.1% |
| Italy | 956 | 3.0% |
| Jamaica | 94 | 0.3% |
| Japan | 1 | 0.0% |
| Jordan | 54 | 0.2% |
| Kazakhstan | 13 | 0.0% |
| Korea | 99 | 0.3% |
| Latin America | 2,967 | 9.3% |
| Malaysia | 2 | 0.0% |
| Mexico | 278 | 0.9% |
| Morocco | 22 | 0.1% |
| Northern Africa | 47 | 0.2% |
| Northern Europe | 47 | 0.2% |
| Pakistan | 347 | 1.1% |
| Peru | 401 | 1.3% |
| Philippines | 784 | 2.5% |
| Poland | 54 | 0.2% |
| Portugal | 17 | 0.1% |
| Romania | 72 | 0.2% |
| Russia | 38 | 0.1% |
| Scotland | 7 | 0.0% |
| South America | 1,486 | 4.6% |
| South Central Asia | 1,882 | 5.9% |
| South Eastern Asia | 792 | 2.5% |
| Southern Europe | 1,182 | 3.7% |
| Spain | 50 | 0.2% |
| Sri Lanka | 18 | 0.1% |
| St. Vincent and the Grenadines | 22 | 0.1% |
| Switzerland | 11 | 0.0% |
| Syria | 7 | 0.0% |
| Taiwan | 54 | 0.2% |
| Trinidad and Tobago | 126 | 0.4% |
| Ukraine | 109 | 0.3% |
| Uruguay | 14 | 0.0% |
| Venezuela | 3 | 0.0% |
| Vietnam | 6 | 0.0% |
| Western Asia | 183 | 0.6% |
| Western Europe | 123 | 0.4% | View All 72 Rows |
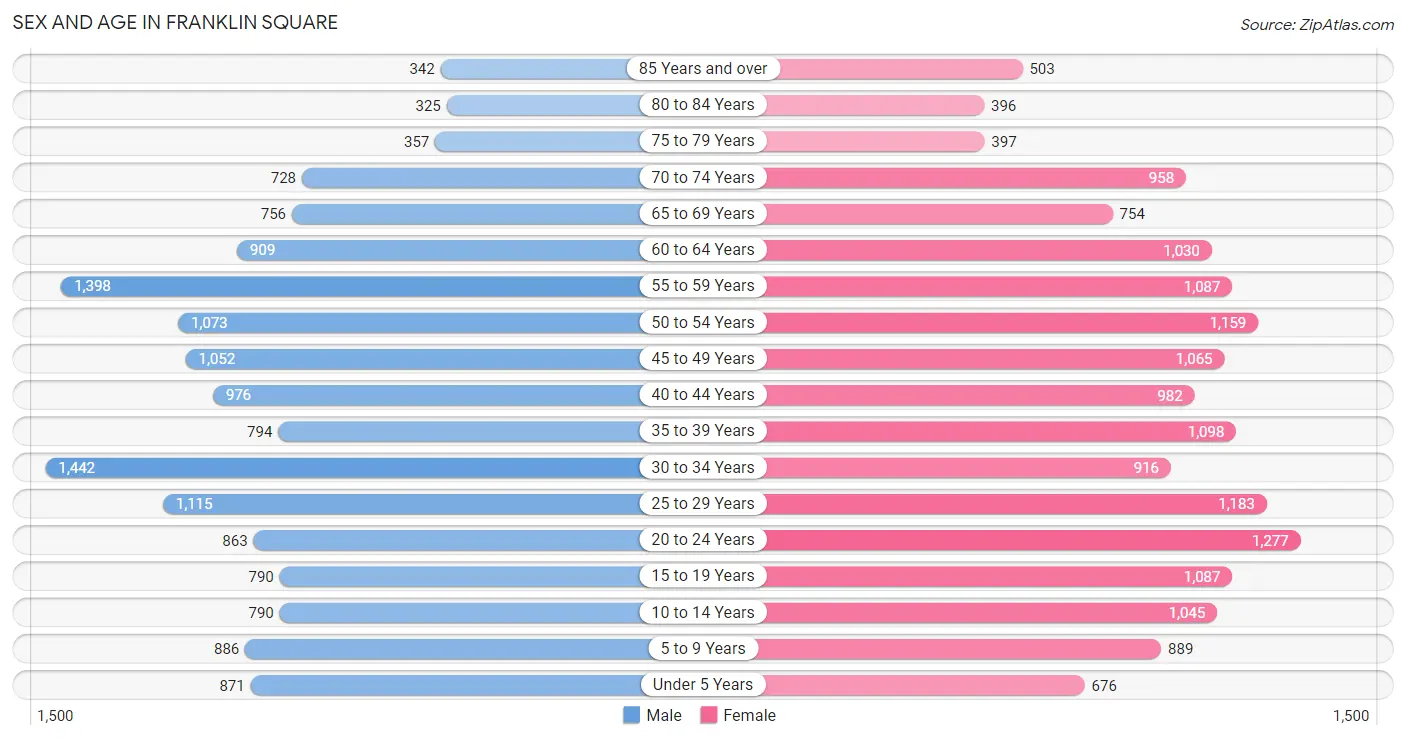
Sex and Age in Franklin Square
Sex and Age in Franklin Square
The most populous age groups in Franklin Square are 30 to 34 Years (1,442 | 9.3%) for men and 20 to 24 Years (1,277 | 7.7%) for women.
| Age Bracket | Male | Female |
| Under 5 Years | 871 (5.6%) | 676 (4.1%) |
| 5 to 9 Years | 886 (5.7%) | 889 (5.4%) |
| 10 to 14 Years | 790 (5.1%) | 1,045 (6.3%) |
| 15 to 19 Years | 790 (5.1%) | 1,087 (6.6%) |
| 20 to 24 Years | 863 (5.6%) | 1,277 (7.7%) |
| 25 to 29 Years | 1,115 (7.2%) | 1,183 (7.2%) |
| 30 to 34 Years | 1,442 (9.3%) | 916 (5.6%) |
| 35 to 39 Years | 794 (5.1%) | 1,098 (6.7%) |
| 40 to 44 Years | 976 (6.3%) | 982 (5.9%) |
| 45 to 49 Years | 1,052 (6.8%) | 1,065 (6.5%) |
| 50 to 54 Years | 1,073 (6.9%) | 1,159 (7.0%) |
| 55 to 59 Years | 1,398 (9.0%) | 1,087 (6.6%) |
| 60 to 64 Years | 909 (5.9%) | 1,030 (6.2%) |
| 65 to 69 Years | 756 (4.9%) | 754 (4.6%) |
| 70 to 74 Years | 728 (4.7%) | 958 (5.8%) |
| 75 to 79 Years | 357 (2.3%) | 397 (2.4%) |
| 80 to 84 Years | 325 (2.1%) | 396 (2.4%) |
| 85 Years and over | 342 (2.2%) | 503 (3.0%) |
| Total | 15,467 (100.0%) | 16,502 (100.0%) |
Families and Households in Franklin Square
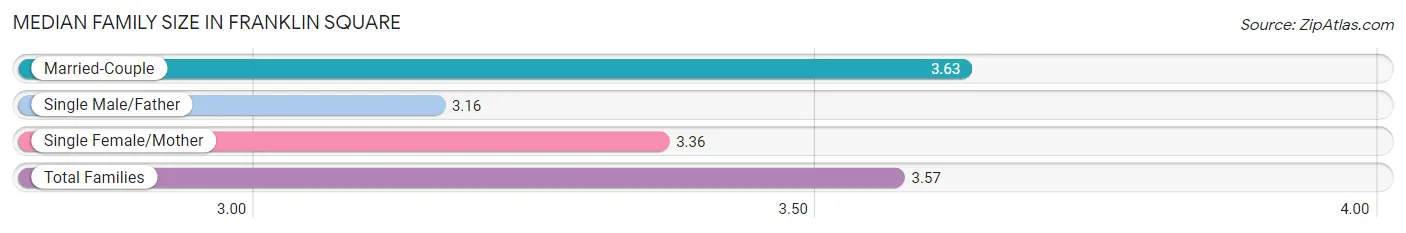
Median Family Size in Franklin Square
The median family size in Franklin Square is 3.57 persons per family, with married-couple families (6,505 | 80.1%) accounting for the largest median family size of 3.63 persons per family. On the other hand, single male/father families (456 | 5.6%) represent the smallest median family size with 3.16 persons per family.
| Family Type | # Families | Family Size |
| Married-Couple | 6,505 (80.1%) | 3.63 |
| Single Male/Father | 456 (5.6%) | 3.16 |
| Single Female/Mother | 1,158 (14.3%) | 3.36 |
| Total Families | 8,119 (100.0%) | 3.57 |
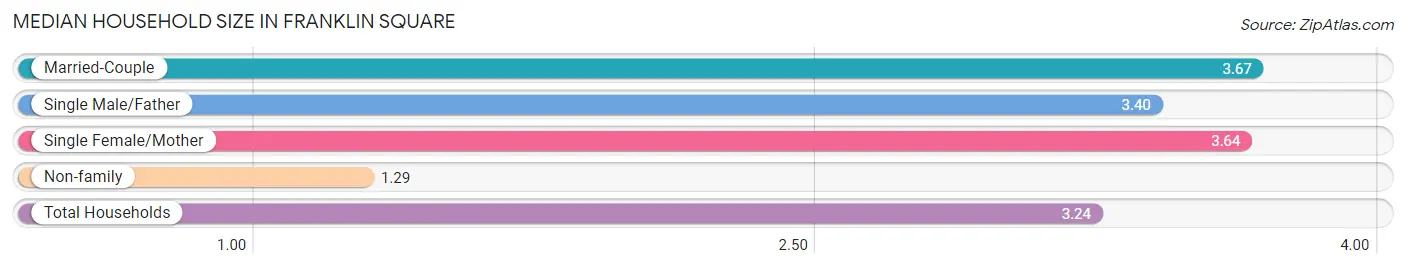
Median Household Size in Franklin Square
The median household size in Franklin Square is 3.24 persons per household, with married-couple households (6,505 | 66.3%) accounting for the largest median household size of 3.67 persons per household. non-family households (1,690 | 17.2%) represent the smallest median household size with 1.29 persons per household.
| Household Type | # Households | Household Size |
| Married-Couple | 6,505 (66.3%) | 3.67 |
| Single Male/Father | 456 (4.6%) | 3.40 |
| Single Female/Mother | 1,158 (11.8%) | 3.64 |
| Non-family | 1,690 (17.2%) | 1.29 |
| Total Households | 9,809 (100.0%) | 3.24 |
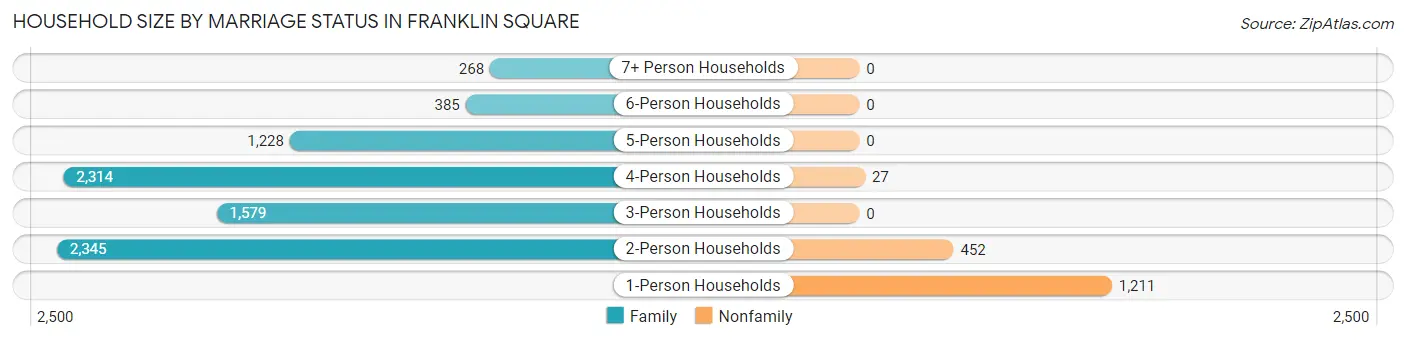
Household Size by Marriage Status in Franklin Square
Out of a total of 9,809 households in Franklin Square, 8,119 (82.8%) are family households, while 1,690 (17.2%) are nonfamily households. The most numerous type of family households are 2-person households, comprising 2,345, and the most common type of nonfamily households are 1-person households, comprising 1,211.
| Household Size | Family Households | Nonfamily Households |
| 1-Person Households | - | 1,211 (12.3%) |
| 2-Person Households | 2,345 (23.9%) | 452 (4.6%) |
| 3-Person Households | 1,579 (16.1%) | 0 (0.0%) |
| 4-Person Households | 2,314 (23.6%) | 27 (0.3%) |
| 5-Person Households | 1,228 (12.5%) | 0 (0.0%) |
| 6-Person Households | 385 (3.9%) | 0 (0.0%) |
| 7+ Person Households | 268 (2.7%) | 0 (0.0%) |
| Total | 8,119 (82.8%) | 1,690 (17.2%) |
Female Fertility in Franklin Square
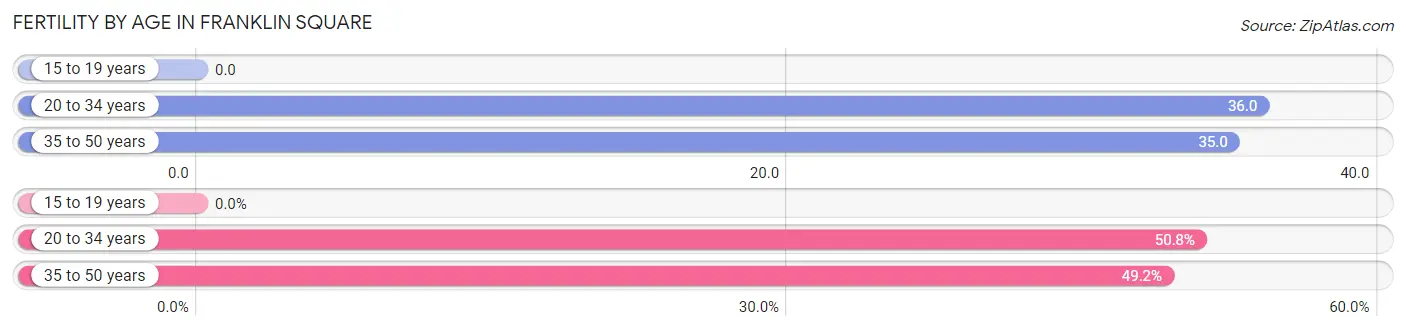
Fertility by Age in Franklin Square
Average fertility rate in Franklin Square is 31.0 births per 1,000 women. Women in the age bracket of 20 to 34 years have the highest fertility rate with 36.0 births per 1,000 women. Women in the age bracket of 20 to 34 years acount for 50.8% of all women with births.
| Age Bracket | Women with Births | Births / 1,000 Women |
| 15 to 19 years | 0 (0.0%) | 0.0 |
| 20 to 34 years | 121 (50.8%) | 36.0 |
| 35 to 50 years | 117 (49.2%) | 35.0 |
| Total | 238 (100.0%) | 31.0 |
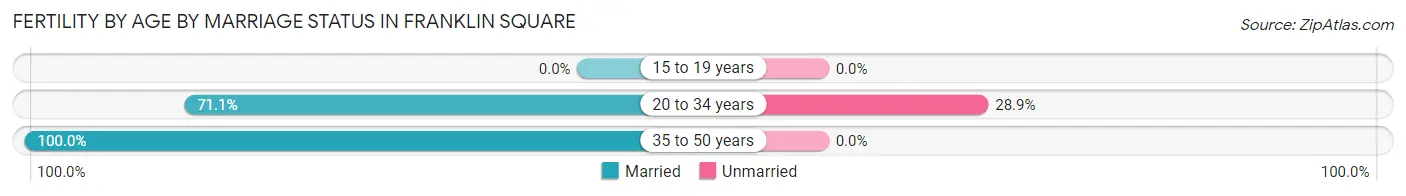
Fertility by Age by Marriage Status in Franklin Square
85.3% of women with births (238) in Franklin Square are married. The highest percentage of unmarried women with births falls into 20 to 34 years age bracket with 28.9% of them unmarried at the time of birth, while the lowest percentage of unmarried women with births belong to 35 to 50 years age bracket with 0.0% of them unmarried.
| Age Bracket | Married | Unmarried |
| 15 to 19 years | 0 (0.0%) | 0 (0.0%) |
| 20 to 34 years | 86 (71.1%) | 35 (28.9%) |
| 35 to 50 years | 117 (100.0%) | 0 (0.0%) |
| Total | 203 (85.3%) | 35 (14.7%) |
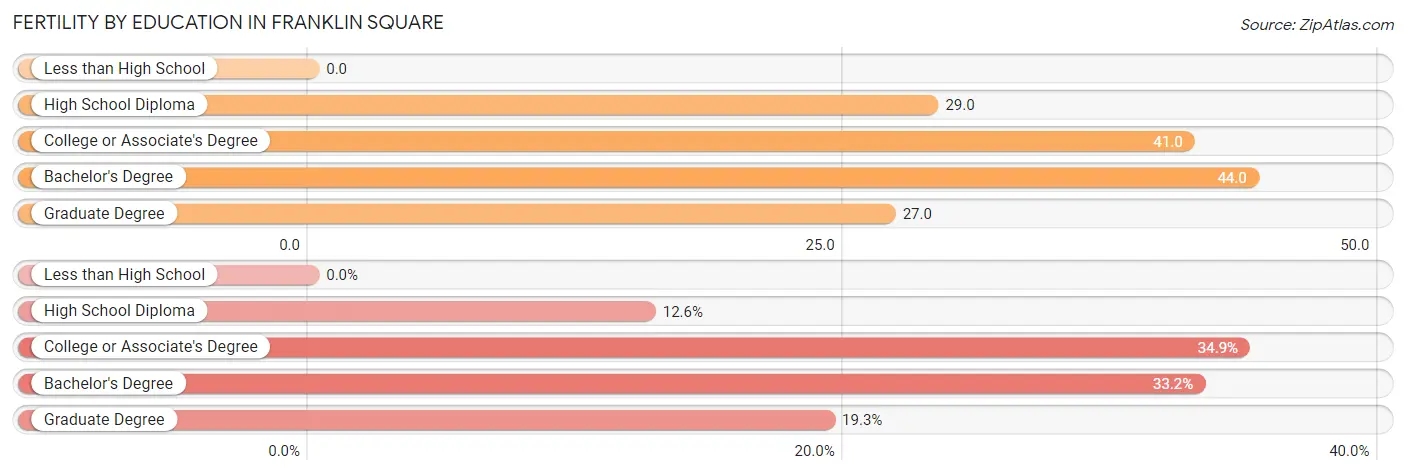
Fertility by Education in Franklin Square
| Educational Attainment | Women with Births | Births / 1,000 Women |
| Less than High School | 0 (0.0%) | 0.0 |
| High School Diploma | 30 (12.6%) | 29.0 |
| College or Associate's Degree | 83 (34.9%) | 41.0 |
| Bachelor's Degree | 79 (33.2%) | 44.0 |
| Graduate Degree | 46 (19.3%) | 27.0 |
| Total | 238 (100.0%) | 31.0 |
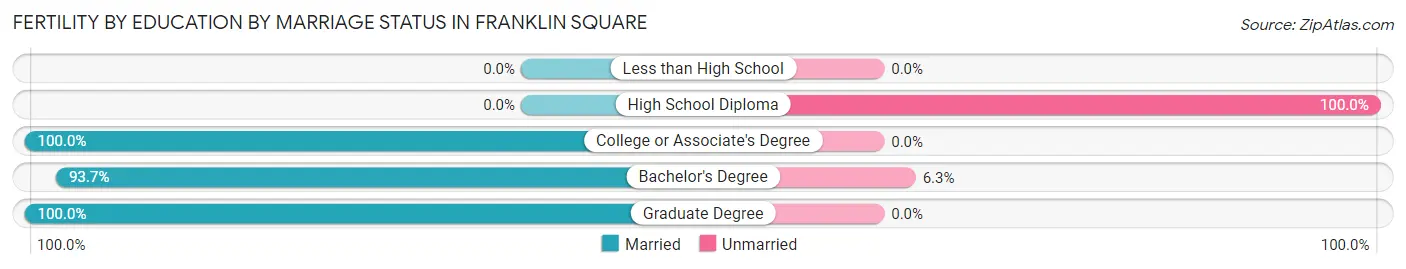
Fertility by Education by Marriage Status in Franklin Square
14.7% of women with births in Franklin Square are unmarried. Women with the educational attainment of college or associate's degree are most likely to be married with 100.0% of them married at childbirth, while women with the educational attainment of high school diploma are least likely to be married with 100.0% of them unmarried at childbirth.
| Educational Attainment | Married | Unmarried |
| Less than High School | 0 (0.0%) | 0 (0.0%) |
| High School Diploma | 0 (0.0%) | 30 (100.0%) |
| College or Associate's Degree | 83 (100.0%) | 0 (0.0%) |
| Bachelor's Degree | 74 (93.7%) | 5 (6.3%) |
| Graduate Degree | 46 (100.0%) | 0 (0.0%) |
| Total | 203 (85.3%) | 35 (14.7%) |
Income in Franklin Square
Income Overview in Franklin Square
Per Capita Income in Franklin Square is $48,801, while median incomes of families and households are $145,535 and $136,225 respectively.
| Characteristic | Number | Measure |
| Per Capita Income | 31,969 | $48,801 |
| Median Family Income | 8,119 | $145,535 |
| Mean Family Income | 8,119 | $168,832 |
| Median Household Income | 9,809 | $136,225 |
| Mean Household Income | 9,809 | $156,955 |
| Income Deficit | 8,119 | $0 |
| Wage / Income Gap (%) | 31,969 | 32.45% |
| Wage / Income Gap ($) | 31,969 | 67.55¢ per $1 |
| Gini / Inequality Index | 31,969 | 0.38 |
Earnings by Sex in Franklin Square
Average Earnings in Franklin Square are $56,535, $66,229 for men and $44,739 for women, a difference of 32.5%.
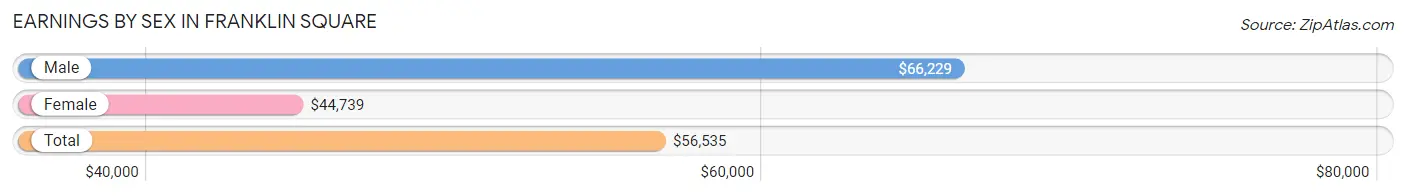
| Sex | Number | Average Earnings |
| Male | 9,164 (50.9%) | $66,229 |
| Female | 8,842 (49.1%) | $44,739 |
| Total | 18,006 (100.0%) | $56,535 |
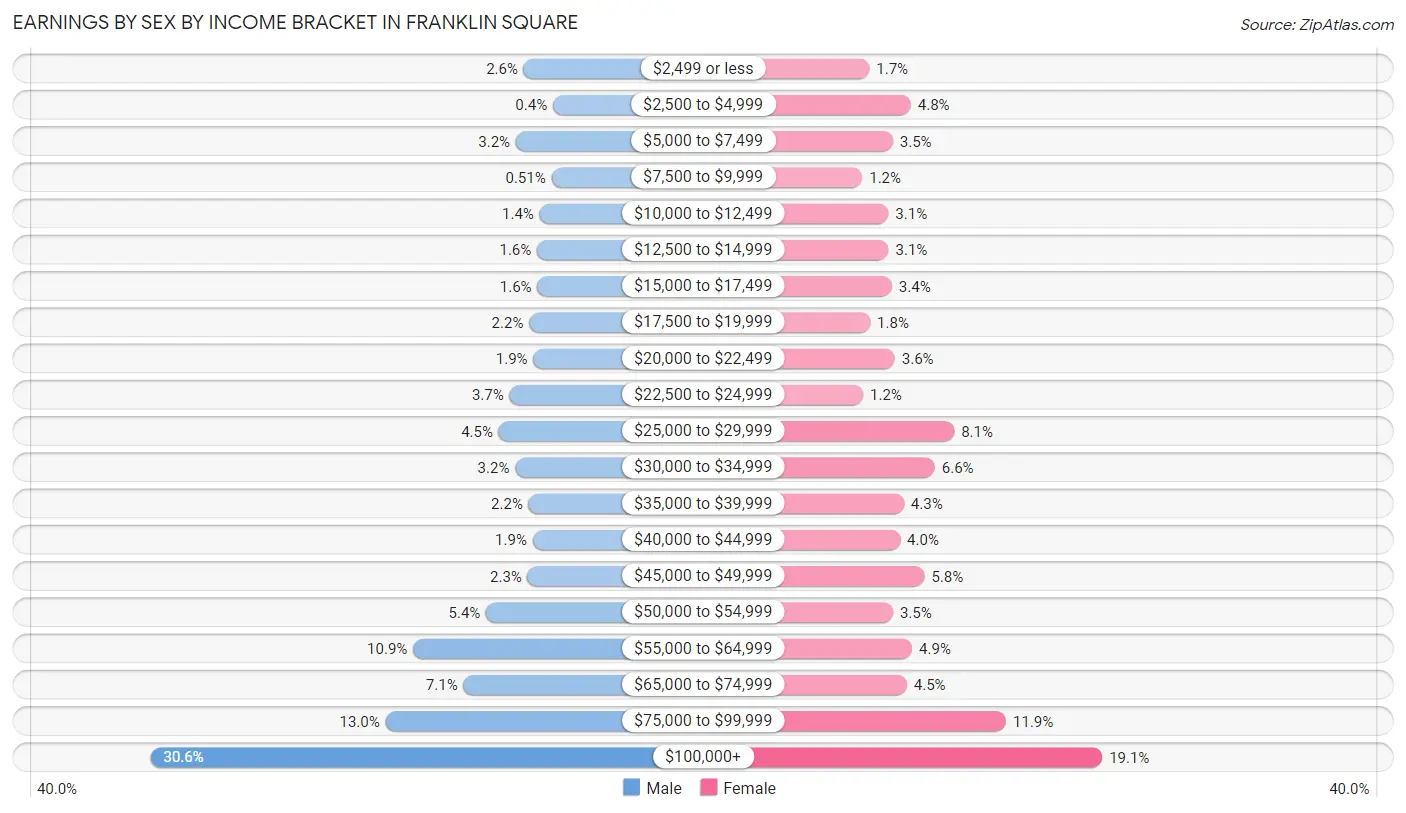
Earnings by Sex by Income Bracket in Franklin Square
The most common earnings brackets in Franklin Square are $100,000+ for men (2,801 | 30.6%) and $100,000+ for women (1,692 | 19.1%).
| Income | Male | Female |
| $2,499 or less | 237 (2.6%) | 149 (1.7%) |
| $2,500 to $4,999 | 37 (0.4%) | 424 (4.8%) |
| $5,000 to $7,499 | 291 (3.2%) | 305 (3.5%) |
| $7,500 to $9,999 | 47 (0.5%) | 103 (1.2%) |
| $10,000 to $12,499 | 128 (1.4%) | 276 (3.1%) |
| $12,500 to $14,999 | 146 (1.6%) | 277 (3.1%) |
| $15,000 to $17,499 | 144 (1.6%) | 299 (3.4%) |
| $17,500 to $19,999 | 200 (2.2%) | 155 (1.8%) |
| $20,000 to $22,499 | 171 (1.9%) | 318 (3.6%) |
| $22,500 to $24,999 | 335 (3.7%) | 108 (1.2%) |
| $25,000 to $29,999 | 409 (4.5%) | 712 (8.1%) |
| $30,000 to $34,999 | 296 (3.2%) | 584 (6.6%) |
| $35,000 to $39,999 | 203 (2.2%) | 378 (4.3%) |
| $40,000 to $44,999 | 176 (1.9%) | 354 (4.0%) |
| $45,000 to $49,999 | 211 (2.3%) | 515 (5.8%) |
| $50,000 to $54,999 | 496 (5.4%) | 306 (3.5%) |
| $55,000 to $64,999 | 997 (10.9%) | 433 (4.9%) |
| $65,000 to $74,999 | 652 (7.1%) | 398 (4.5%) |
| $75,000 to $99,999 | 1,187 (13.0%) | 1,056 (11.9%) |
| $100,000+ | 2,801 (30.6%) | 1,692 (19.1%) |
| Total | 9,164 (100.0%) | 8,842 (100.0%) |
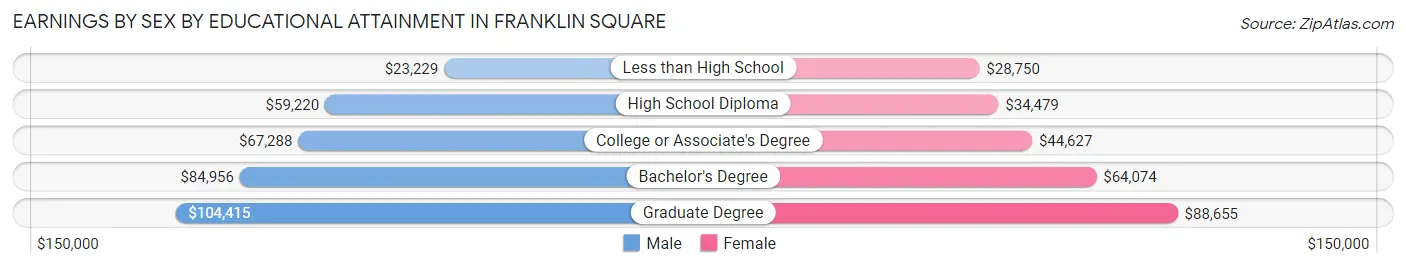
Earnings by Sex by Educational Attainment in Franklin Square
Average earnings in Franklin Square are $69,837 for men and $51,588 for women, a difference of 26.1%. Men with an educational attainment of graduate degree enjoy the highest average annual earnings of $104,415, while those with less than high school education earn the least with $23,229. Women with an educational attainment of graduate degree earn the most with the average annual earnings of $88,655, while those with less than high school education have the smallest earnings of $28,750.
| Educational Attainment | Male Income | Female Income |
| Less than High School | $23,229 | $28,750 |
| High School Diploma | $59,220 | $34,479 |
| College or Associate's Degree | $67,288 | $44,627 |
| Bachelor's Degree | $84,956 | $64,074 |
| Graduate Degree | $104,415 | $88,655 |
| Total | $69,837 | $51,588 |
Family Income in Franklin Square
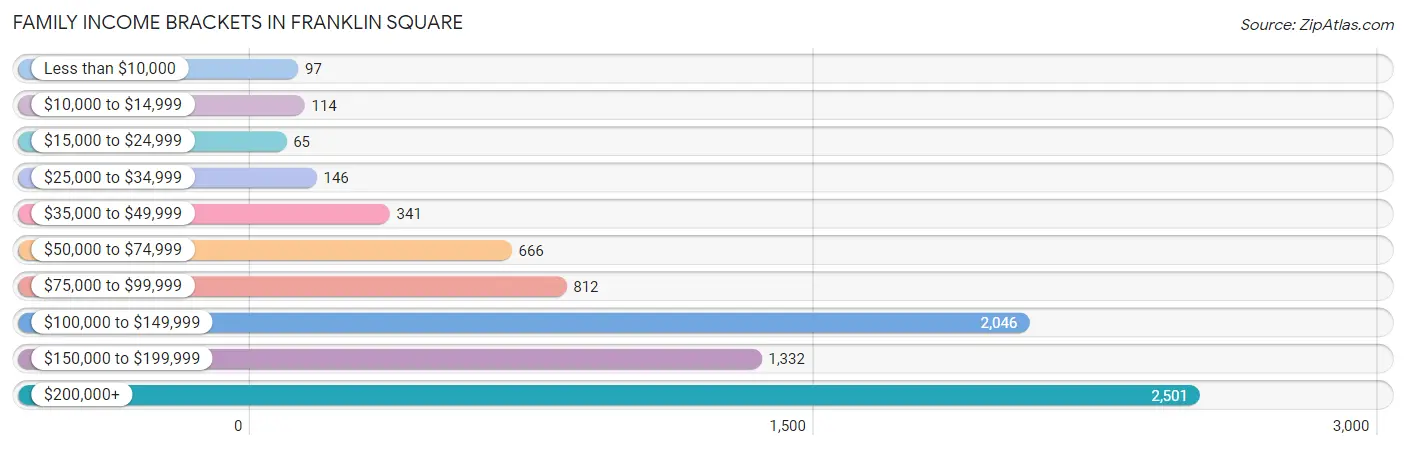
Family Income Brackets in Franklin Square
According to the Franklin Square family income data, there are 2,501 families falling into the $200,000+ income range, which is the most common income bracket and makes up 30.8% of all families. Conversely, the $15,000 to $24,999 income bracket is the least frequent group with only 65 families (0.8%) belonging to this category.
| Income Bracket | # Families | % Families |
| Less than $10,000 | 97 | 1.2% |
| $10,000 to $14,999 | 114 | 1.4% |
| $15,000 to $24,999 | 65 | 0.8% |
| $25,000 to $34,999 | 146 | 1.8% |
| $35,000 to $49,999 | 341 | 4.2% |
| $50,000 to $74,999 | 666 | 8.2% |
| $75,000 to $99,999 | 812 | 10.0% |
| $100,000 to $149,999 | 2,046 | 25.2% |
| $150,000 to $199,999 | 1,332 | 16.4% |
| $200,000+ | 2,501 | 30.8% |
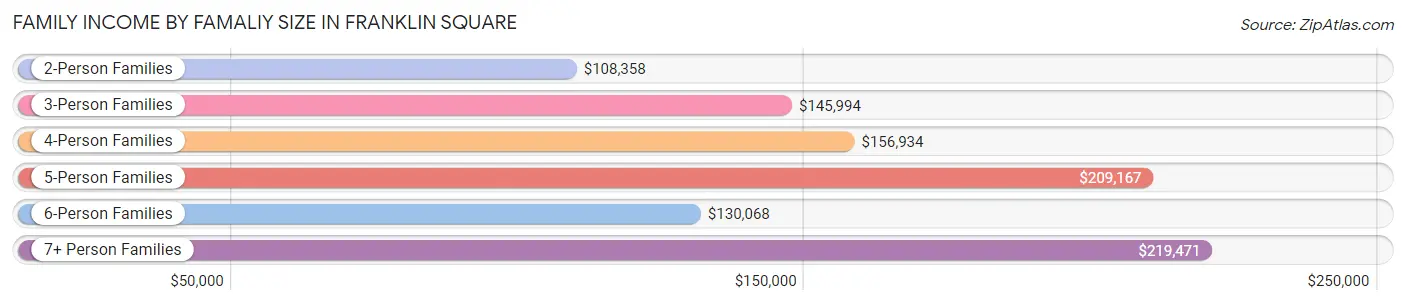
Family Income by Famaliy Size in Franklin Square
7+ person families (255 | 3.1%) account for the highest median family income in Franklin Square with $219,471 per family, while 2-person families (2,537 | 31.2%) have the highest median income of $54,179 per family member.
| Income Bracket | # Families | Median Income |
| 2-Person Families | 2,537 (31.2%) | $108,358 |
| 3-Person Families | 1,475 (18.2%) | $145,994 |
| 4-Person Families | 2,390 (29.4%) | $156,934 |
| 5-Person Families | 1,102 (13.6%) | $209,167 |
| 6-Person Families | 360 (4.4%) | $130,068 |
| 7+ Person Families | 255 (3.1%) | $219,471 |
| Total | 8,119 (100.0%) | $145,535 |
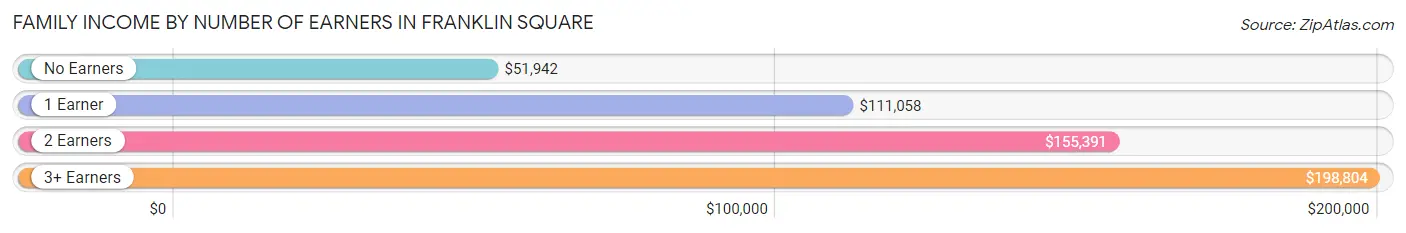
Family Income by Number of Earners in Franklin Square
The median family income in Franklin Square is $145,535, with families comprising 3+ earners (1,932) having the highest median family income of $198,804, while families with no earners (933) have the lowest median family income of $51,942, accounting for 23.8% and 11.5% of families, respectively.
| Number of Earners | # Families | Median Income |
| No Earners | 933 (11.5%) | $51,942 |
| 1 Earner | 1,495 (18.4%) | $111,058 |
| 2 Earners | 3,759 (46.3%) | $155,391 |
| 3+ Earners | 1,932 (23.8%) | $198,804 |
| Total | 8,119 (100.0%) | $145,535 |
Household Income in Franklin Square
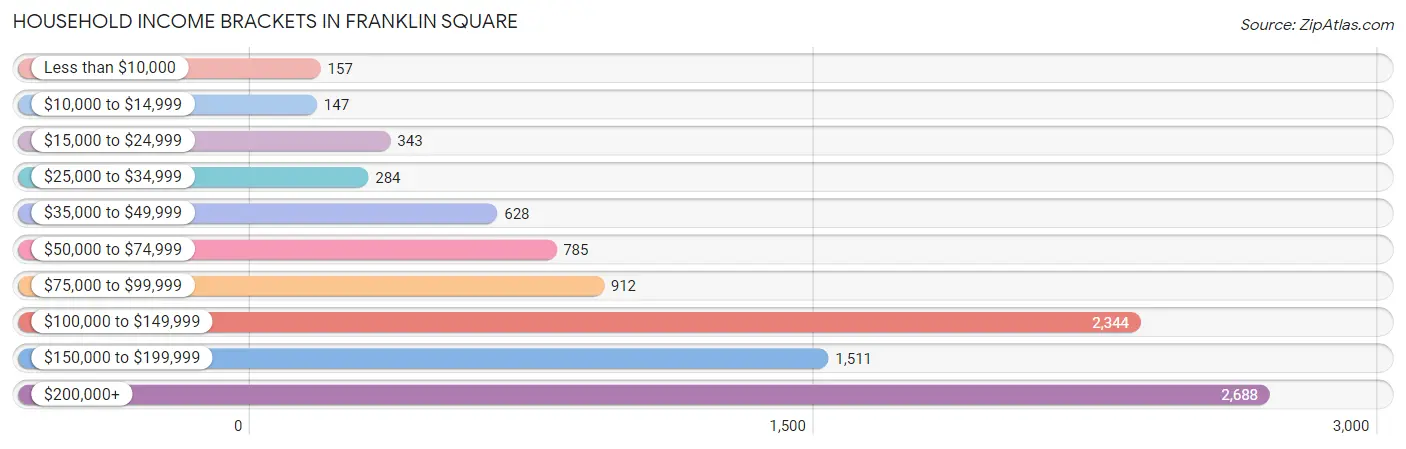
Household Income Brackets in Franklin Square
With 2,688 households falling in the category, the $200,000+ income range is the most frequent in Franklin Square, accounting for 27.4% of all households. In contrast, only 147 households (1.5%) fall into the $10,000 to $14,999 income bracket, making it the least populous group.
| Income Bracket | # Households | % Households |
| Less than $10,000 | 157 | 1.6% |
| $10,000 to $14,999 | 147 | 1.5% |
| $15,000 to $24,999 | 343 | 3.5% |
| $25,000 to $34,999 | 284 | 2.9% |
| $35,000 to $49,999 | 628 | 6.4% |
| $50,000 to $74,999 | 785 | 8.0% |
| $75,000 to $99,999 | 912 | 9.3% |
| $100,000 to $149,999 | 2,344 | 23.9% |
| $150,000 to $199,999 | 1,511 | 15.4% |
| $200,000+ | 2,688 | 27.4% |
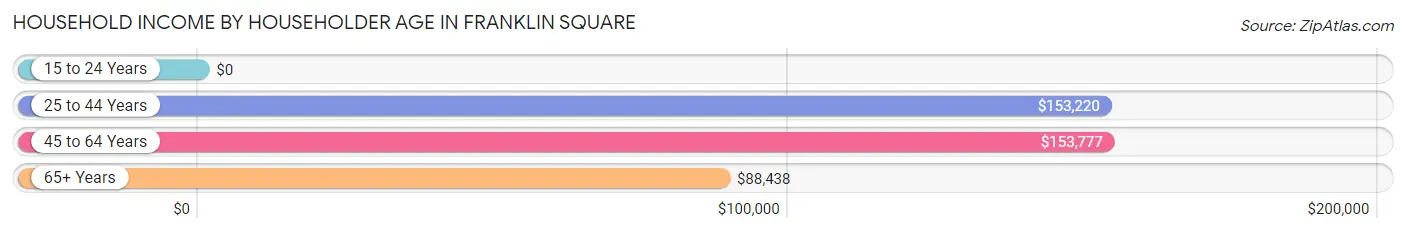
Household Income by Householder Age in Franklin Square
The median household income in Franklin Square is $136,225, with the highest median household income of $153,777 found in the 45 to 64 years age bracket for the primary householder. A total of 4,214 households (43.0%) fall into this category. Meanwhile, the 15 to 24 years age bracket for the primary householder has the lowest median household income of $0, with 16 households (0.2%) in this group.
| Income Bracket | # Households | Median Income |
| 15 to 24 Years | 16 (0.2%) | $0 |
| 25 to 44 Years | 2,939 (30.0%) | $153,220 |
| 45 to 64 Years | 4,214 (43.0%) | $153,777 |
| 65+ Years | 2,640 (26.9%) | $88,438 |
| Total | 9,809 (100.0%) | $136,225 |
Poverty in Franklin Square
Income Below Poverty by Sex and Age in Franklin Square
With 5.3% poverty level for males and 4.8% for females among the residents of Franklin Square, 16 and 17 year old males and 35 to 44 year old females are the most vulnerable to poverty, with 53 males (14.6%) and 189 females (9.1%) in their respective age groups living below the poverty level.
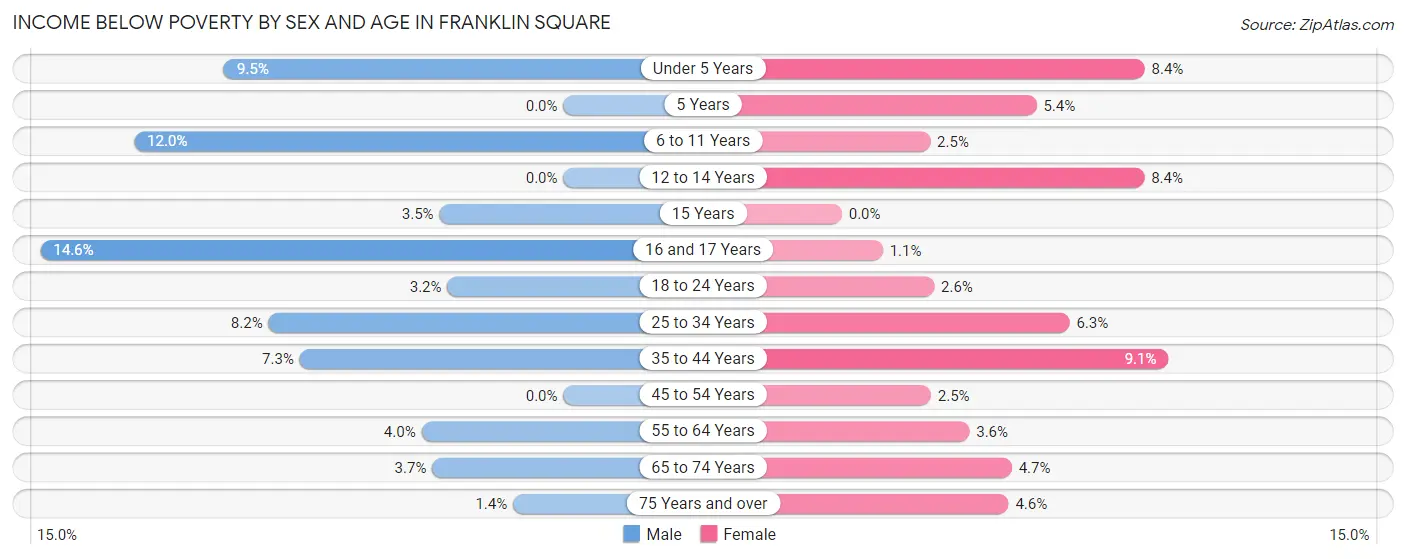
| Age Bracket | Male | Female |
| Under 5 Years | 82 (9.5%) | 57 (8.4%) |
| 5 Years | 0 (0.0%) | 9 (5.4%) |
| 6 to 11 Years | 136 (11.9%) | 29 (2.5%) |
| 12 to 14 Years | 0 (0.0%) | 48 (8.4%) |
| 15 Years | 6 (3.5%) | 0 (0.0%) |
| 16 and 17 Years | 53 (14.6%) | 6 (1.1%) |
| 18 to 24 Years | 36 (3.2%) | 41 (2.6%) |
| 25 to 34 Years | 210 (8.2%) | 133 (6.3%) |
| 35 to 44 Years | 130 (7.3%) | 189 (9.1%) |
| 45 to 54 Years | 0 (0.0%) | 55 (2.5%) |
| 55 to 64 Years | 91 (4.0%) | 75 (3.5%) |
| 65 to 74 Years | 54 (3.6%) | 80 (4.7%) |
| 75 Years and over | 14 (1.4%) | 58 (4.6%) |
| Total | 812 (5.3%) | 780 (4.8%) |
Income Above Poverty by Sex and Age in Franklin Square
According to the poverty statistics in Franklin Square, males aged 5 years and females aged 15 years are the age groups that are most secure financially, with 100.0% of males and 100.0% of females in these age groups living above the poverty line.
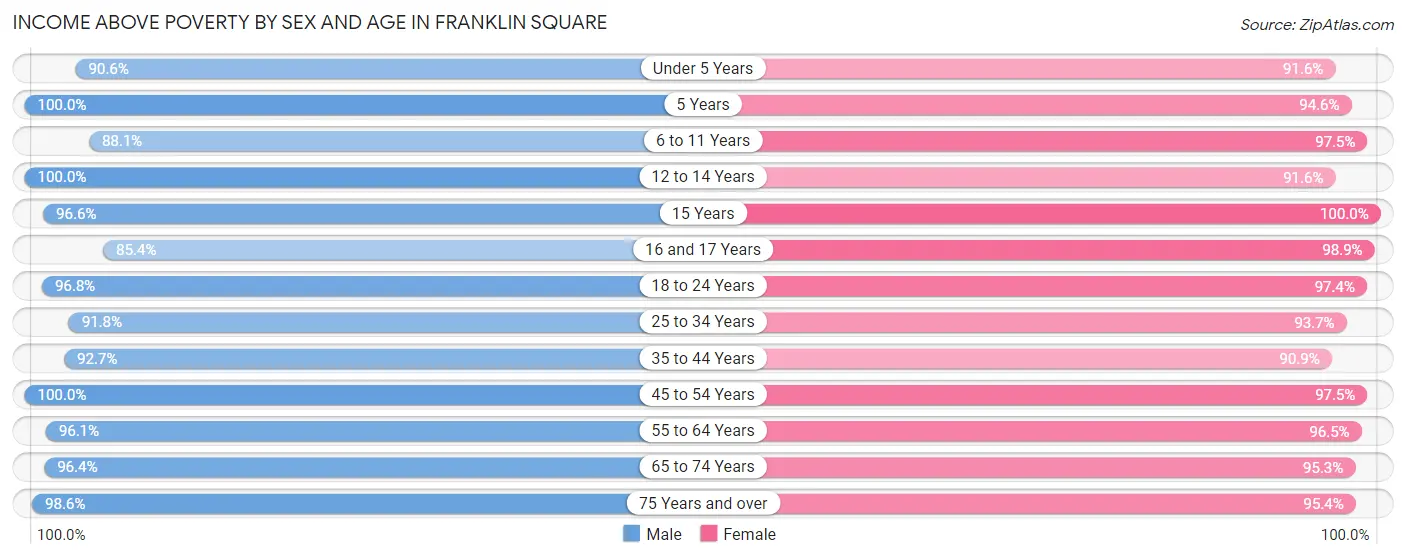
| Age Bracket | Male | Female |
| Under 5 Years | 786 (90.5%) | 619 (91.6%) |
| 5 Years | 111 (100.0%) | 157 (94.6%) |
| 6 to 11 Years | 1,002 (88.0%) | 1,150 (97.5%) |
| 12 to 14 Years | 413 (100.0%) | 522 (91.6%) |
| 15 Years | 168 (96.6%) | 240 (100.0%) |
| 16 and 17 Years | 311 (85.4%) | 522 (98.9%) |
| 18 to 24 Years | 1,079 (96.8%) | 1,555 (97.4%) |
| 25 to 34 Years | 2,347 (91.8%) | 1,966 (93.7%) |
| 35 to 44 Years | 1,640 (92.7%) | 1,891 (90.9%) |
| 45 to 54 Years | 2,125 (100.0%) | 2,165 (97.5%) |
| 55 to 64 Years | 2,212 (96.1%) | 2,035 (96.5%) |
| 65 to 74 Years | 1,426 (96.4%) | 1,612 (95.3%) |
| 75 Years and over | 987 (98.6%) | 1,192 (95.4%) |
| Total | 14,607 (94.7%) | 15,626 (95.3%) |
Income Below Poverty Among Married-Couple Families in Franklin Square
The poverty statistics for married-couple families in Franklin Square show that 2.6% or 167 of the total 6,505 families live below the poverty line. Families with 3 or 4 children have the highest poverty rate of 6.2%, comprising of 29 families. On the other hand, families with 5 or more children have the lowest poverty rate of 0.0%, which includes 0 families.
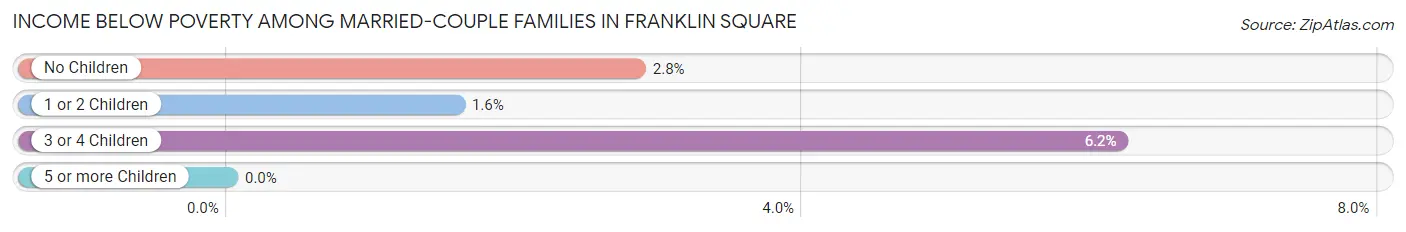
| Children | Above Poverty | Below Poverty |
| No Children | 3,323 (97.2%) | 97 (2.8%) |
| 1 or 2 Children | 2,549 (98.4%) | 41 (1.6%) |
| 3 or 4 Children | 439 (93.8%) | 29 (6.2%) |
| 5 or more Children | 27 (100.0%) | 0 (0.0%) |
| Total | 6,338 (97.4%) | 167 (2.6%) |
Income Below Poverty Among Single-Parent Households in Franklin Square
According to the poverty data in Franklin Square, 11.6% or 53 single-father households and 7.9% or 92 single-mother households are living below the poverty line. Among single-father households, those with no children have the highest poverty rate, with 53 households (17.5%) experiencing poverty. Likewise, among single-mother households, those with 5 or more children have the highest poverty rate, with 8 households (100.0%) falling below the poverty line.
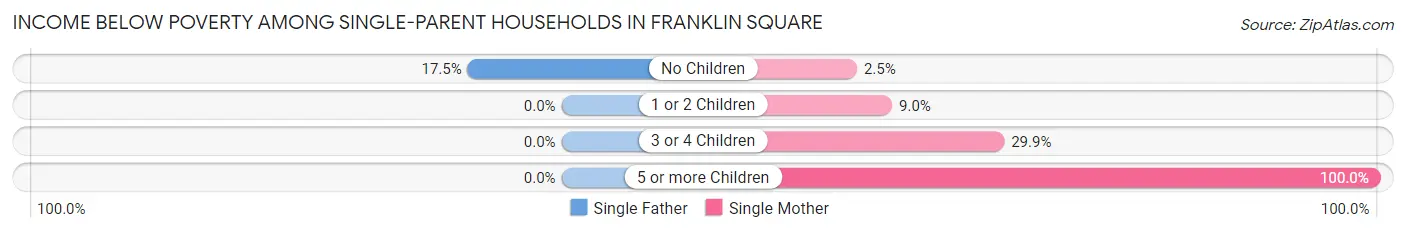
| Children | Single Father | Single Mother |
| No Children | 53 (17.5%) | 16 (2.5%) |
| 1 or 2 Children | 0 (0.0%) | 36 (9.0%) |
| 3 or 4 Children | 0 (0.0%) | 32 (29.9%) |
| 5 or more Children | 0 (0.0%) | 8 (100.0%) |
| Total | 53 (11.6%) | 92 (7.9%) |
Income Below Poverty Among Married-Couple vs Single-Parent Households in Franklin Square
The poverty data for Franklin Square shows that 167 of the married-couple family households (2.6%) and 145 of the single-parent households (9.0%) are living below the poverty level. Within the married-couple family households, those with 3 or 4 children have the highest poverty rate, with 29 households (6.2%) falling below the poverty line. Among the single-parent households, those with 5 or more children have the highest poverty rate, with 8 household (100.0%) living below poverty.
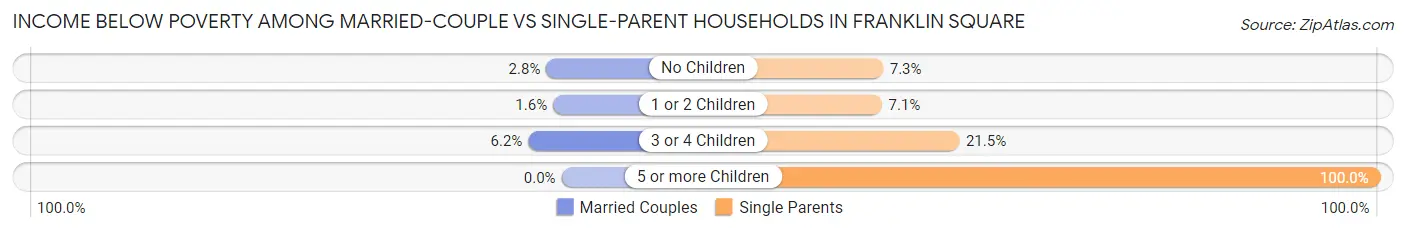
| Children | Married-Couple Families | Single-Parent Households |
| No Children | 97 (2.8%) | 69 (7.3%) |
| 1 or 2 Children | 41 (1.6%) | 36 (7.1%) |
| 3 or 4 Children | 29 (6.2%) | 32 (21.5%) |
| 5 or more Children | 0 (0.0%) | 8 (100.0%) |
| Total | 167 (2.6%) | 145 (9.0%) |
Employment Characteristics in Franklin Square
Employment by Class of Employer in Franklin Square
Among the 16,274 employed individuals in Franklin Square, private company employees (10,680 | 65.6%), local government employees (2,336 | 14.3%), and not-for-profit organizations (1,187 | 7.3%) make up the most common classes of employment.
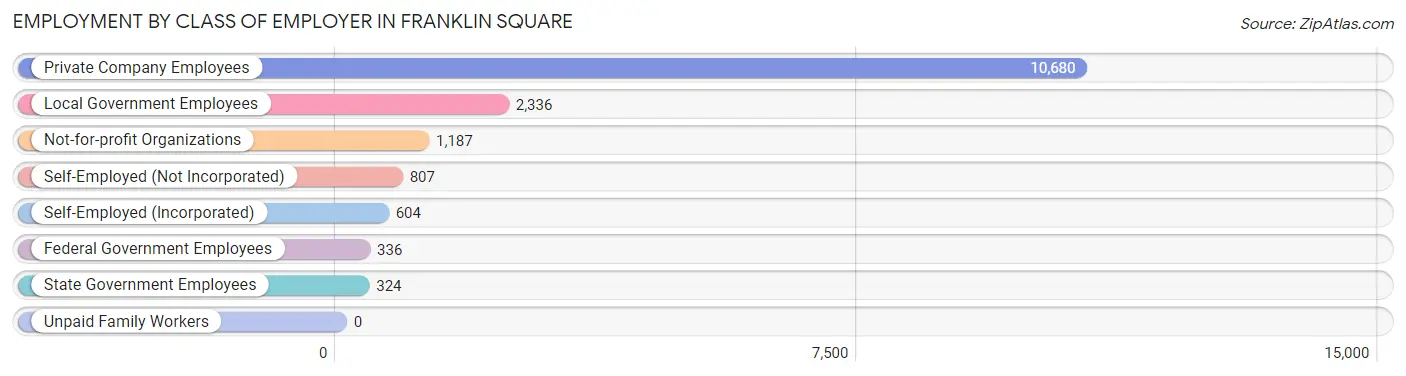
| Employer Class | # Employees | % Employees |
| Private Company Employees | 10,680 | 65.6% |
| Self-Employed (Incorporated) | 604 | 3.7% |
| Self-Employed (Not Incorporated) | 807 | 5.0% |
| Not-for-profit Organizations | 1,187 | 7.3% |
| Local Government Employees | 2,336 | 14.3% |
| State Government Employees | 324 | 2.0% |
| Federal Government Employees | 336 | 2.1% |
| Unpaid Family Workers | 0 | 0.0% |
| Total | 16,274 | 100.0% |
Employment Status by Age in Franklin Square
According to the labor force statistics for Franklin Square, out of the total population over 16 years of age (26,398), 67.7% or 17,871 individuals are in the labor force, with 3.9% or 697 of them unemployed. The age group with the highest labor force participation rate is 30 to 34 years, with 95.6% or 2,254 individuals in the labor force. Within the labor force, the 20 to 24 years age range has the highest percentage of unemployed individuals, with 7.3% or 108 of them being unemployed.
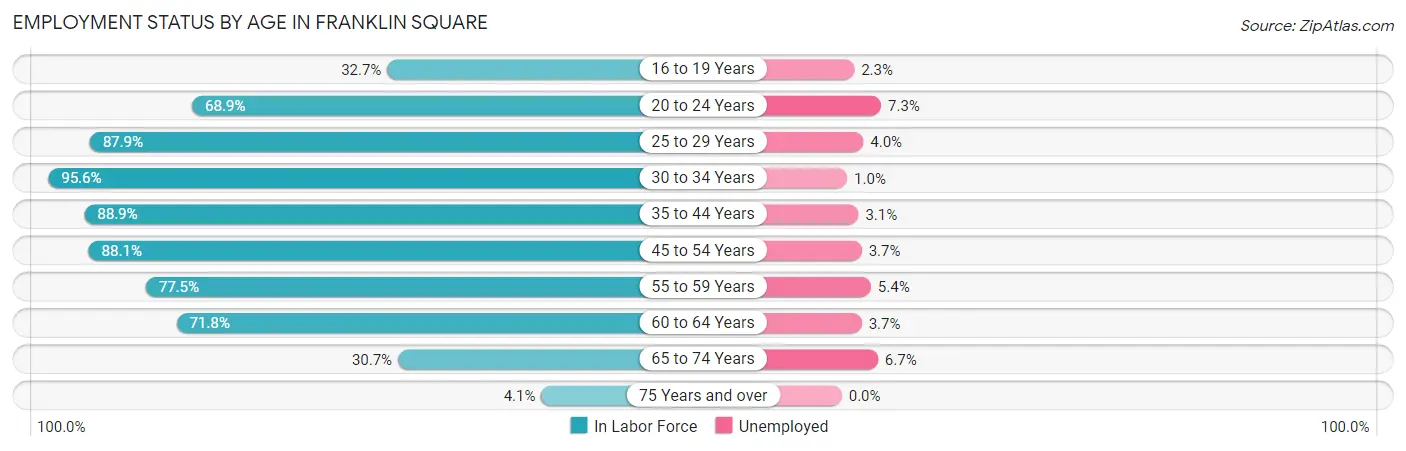
| Age Bracket | In Labor Force | Unemployed |
| 16 to 19 Years | 478 (32.7%) | 11 (2.3%) |
| 20 to 24 Years | 1,474 (68.9%) | 108 (7.3%) |
| 25 to 29 Years | 2,020 (87.9%) | 81 (4.0%) |
| 30 to 34 Years | 2,254 (95.6%) | 23 (1.0%) |
| 35 to 44 Years | 3,423 (88.9%) | 106 (3.1%) |
| 45 to 54 Years | 3,831 (88.1%) | 142 (3.7%) |
| 55 to 59 Years | 1,926 (77.5%) | 104 (5.4%) |
| 60 to 64 Years | 1,392 (71.8%) | 52 (3.7%) |
| 65 to 74 Years | 981 (30.7%) | 66 (6.7%) |
| 75 Years and over | 95 (4.1%) | 0 (0.0%) |
| Total | 17,871 (67.7%) | 697 (3.9%) |
Employment Status by Educational Attainment in Franklin Square
According to labor force statistics for Franklin Square, 85.9% of individuals (14,843) out of the total population between 25 and 64 years of age (17,279) are in the labor force, with 3.4% or 505 of them being unemployed. The group with the highest labor force participation rate are those with the educational attainment of bachelor's degree or higher, with 91.0% or 6,870 individuals in the labor force. Within the labor force, individuals with less than high school education have the highest percentage of unemployment, with 9.6% or 76 of them being unemployed.
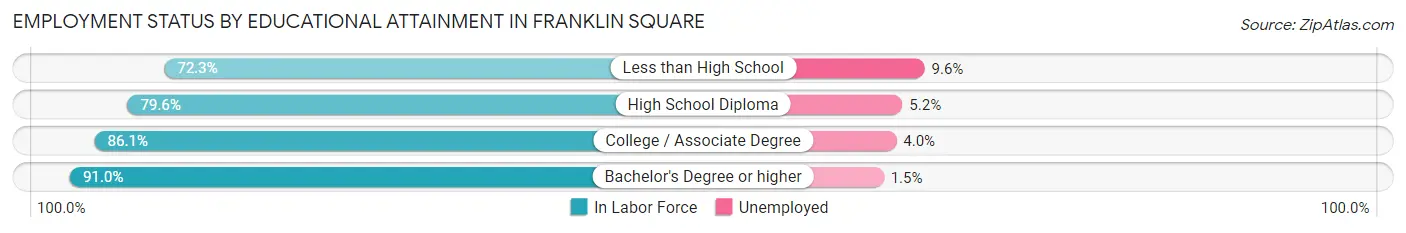
| Educational Attainment | In Labor Force | Unemployed |
| Less than High School | 790 (72.3%) | 105 (9.6%) |
| High School Diploma | 3,010 (79.6%) | 197 (5.2%) |
| College / Associate Degree | 4,182 (86.1%) | 194 (4.0%) |
| Bachelor's Degree or higher | 6,870 (91.0%) | 113 (1.5%) |
| Total | 14,843 (85.9%) | 587 (3.4%) |
Employment Occupations by Sex in Franklin Square
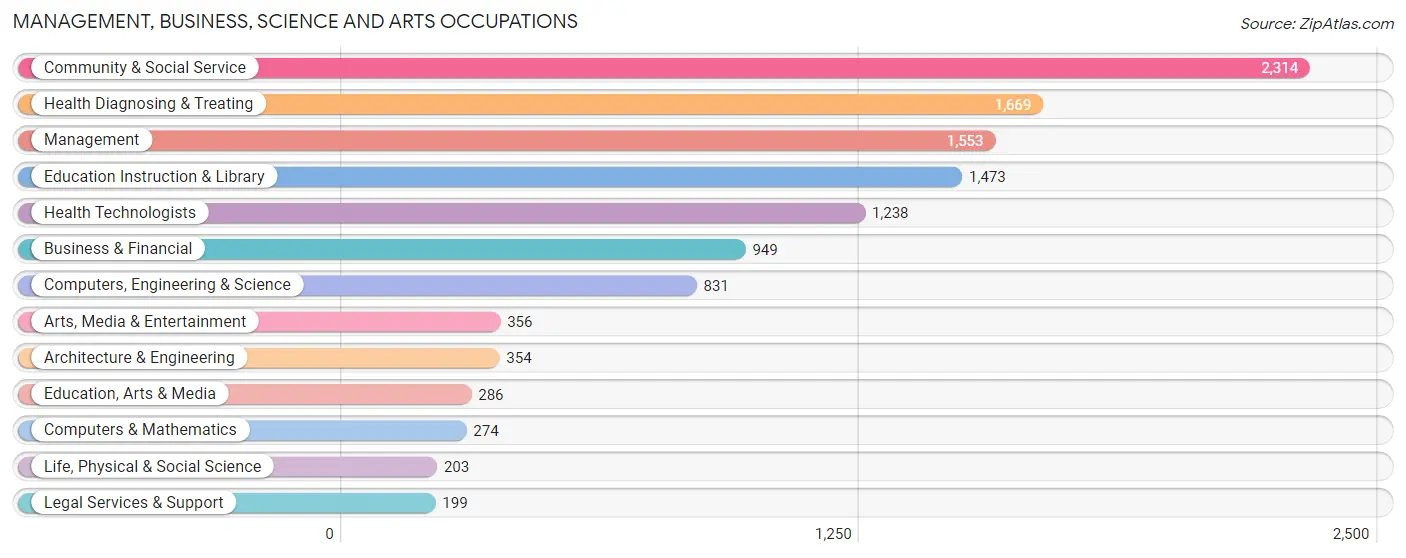
Management, Business, Science and Arts Occupations
The most common Management, Business, Science and Arts occupations in Franklin Square are Community & Social Service (2,314 | 13.5%), Health Diagnosing & Treating (1,669 | 9.7%), Management (1,553 | 9.0%), Education Instruction & Library (1,473 | 8.6%), and Health Technologists (1,238 | 7.2%).
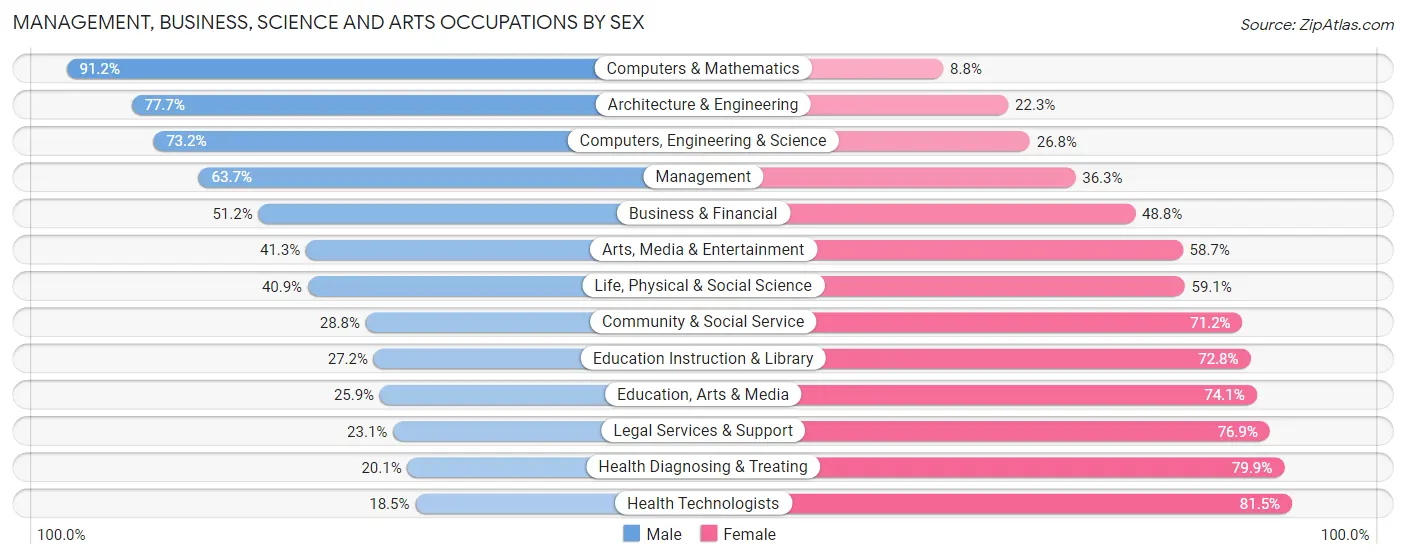
Management, Business, Science and Arts Occupations by Sex
Within the Management, Business, Science and Arts occupations in Franklin Square, the most male-oriented occupations are Computers & Mathematics (91.2%), Architecture & Engineering (77.7%), and Computers, Engineering & Science (73.2%), while the most female-oriented occupations are Health Technologists (81.5%), Health Diagnosing & Treating (79.9%), and Legal Services & Support (76.9%).
| Occupation | Male | Female |
| Management | 989 (63.7%) | 564 (36.3%) |
| Business & Financial | 486 (51.2%) | 463 (48.8%) |
| Computers, Engineering & Science | 608 (73.2%) | 223 (26.8%) |
| Computers & Mathematics | 250 (91.2%) | 24 (8.8%) |
| Architecture & Engineering | 275 (77.7%) | 79 (22.3%) |
| Life, Physical & Social Science | 83 (40.9%) | 120 (59.1%) |
| Community & Social Service | 667 (28.8%) | 1,647 (71.2%) |
| Education, Arts & Media | 74 (25.9%) | 212 (74.1%) |
| Legal Services & Support | 46 (23.1%) | 153 (76.9%) |
| Education Instruction & Library | 400 (27.2%) | 1,073 (72.8%) |
| Arts, Media & Entertainment | 147 (41.3%) | 209 (58.7%) |
| Health Diagnosing & Treating | 336 (20.1%) | 1,333 (79.9%) |
| Health Technologists | 229 (18.5%) | 1,009 (81.5%) |
| Total (Category) | 3,086 (42.2%) | 4,230 (57.8%) |
| Total (Overall) | 8,737 (50.9%) | 8,440 (49.1%) |
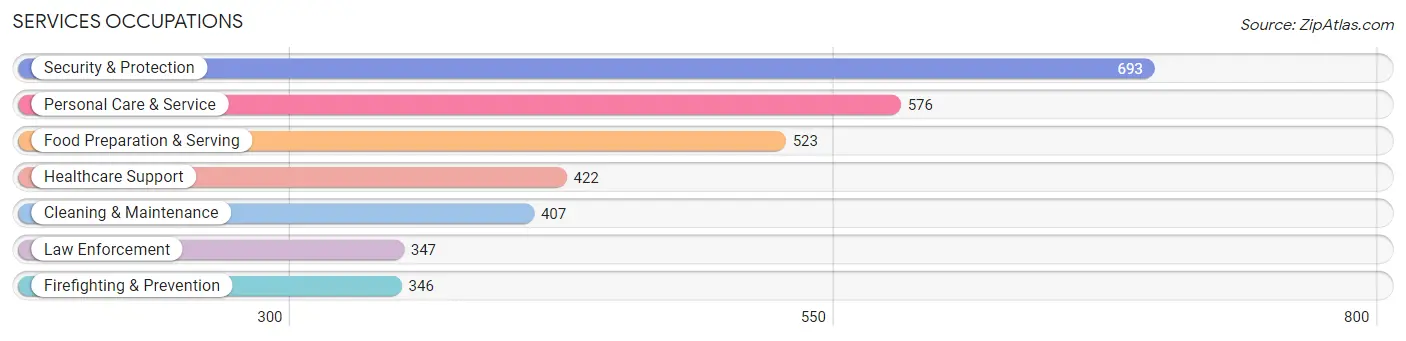
Services Occupations
The most common Services occupations in Franklin Square are Security & Protection (693 | 4.0%), Personal Care & Service (576 | 3.4%), Food Preparation & Serving (523 | 3.0%), Healthcare Support (422 | 2.5%), and Cleaning & Maintenance (407 | 2.4%).
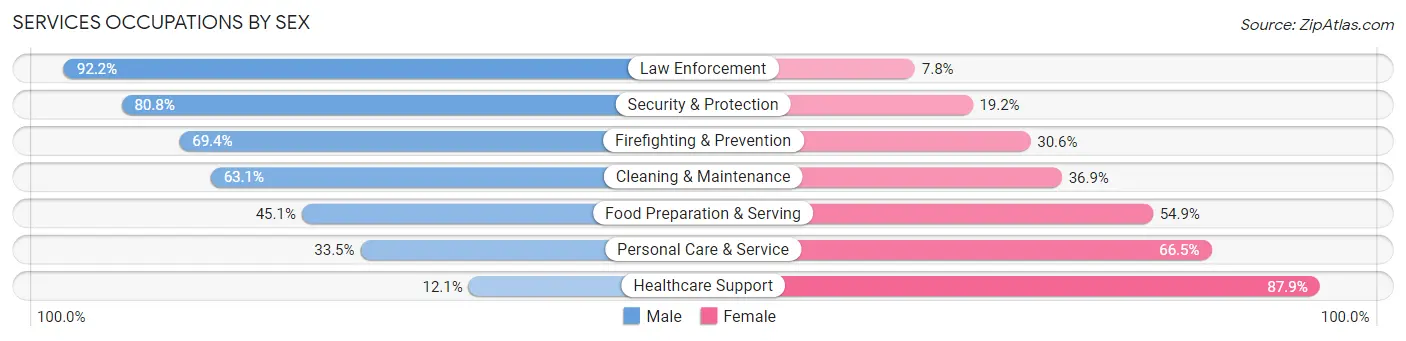
Services Occupations by Sex
Within the Services occupations in Franklin Square, the most male-oriented occupations are Law Enforcement (92.2%), Security & Protection (80.8%), and Firefighting & Prevention (69.4%), while the most female-oriented occupations are Healthcare Support (87.9%), Personal Care & Service (66.5%), and Food Preparation & Serving (54.9%).
| Occupation | Male | Female |
| Healthcare Support | 51 (12.1%) | 371 (87.9%) |
| Security & Protection | 560 (80.8%) | 133 (19.2%) |
| Firefighting & Prevention | 240 (69.4%) | 106 (30.6%) |
| Law Enforcement | 320 (92.2%) | 27 (7.8%) |
| Food Preparation & Serving | 236 (45.1%) | 287 (54.9%) |
| Cleaning & Maintenance | 257 (63.1%) | 150 (36.9%) |
| Personal Care & Service | 193 (33.5%) | 383 (66.5%) |
| Total (Category) | 1,297 (49.5%) | 1,324 (50.5%) |
| Total (Overall) | 8,737 (50.9%) | 8,440 (49.1%) |
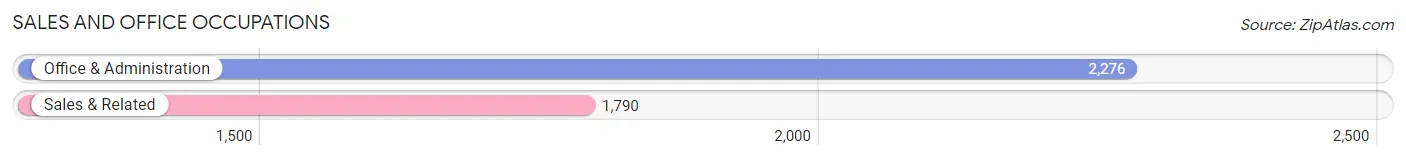
Sales and Office Occupations
The most common Sales and Office occupations in Franklin Square are Office & Administration (2,276 | 13.3%), and Sales & Related (1,790 | 10.4%).
Sales and Office Occupations by Sex
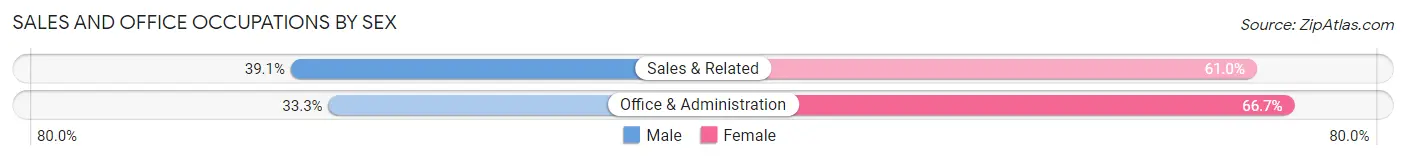
| Occupation | Male | Female |
| Sales & Related | 699 (39.1%) | 1,091 (61.0%) |
| Office & Administration | 757 (33.3%) | 1,519 (66.7%) |
| Total (Category) | 1,456 (35.8%) | 2,610 (64.2%) |
| Total (Overall) | 8,737 (50.9%) | 8,440 (49.1%) |
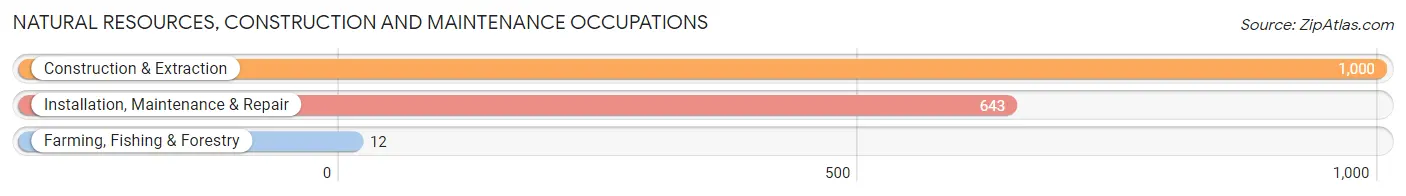
Natural Resources, Construction and Maintenance Occupations
The most common Natural Resources, Construction and Maintenance occupations in Franklin Square are Construction & Extraction (1,000 | 5.8%), Installation, Maintenance & Repair (643 | 3.7%), and Farming, Fishing & Forestry (12 | 0.1%).
Natural Resources, Construction and Maintenance Occupations by Sex
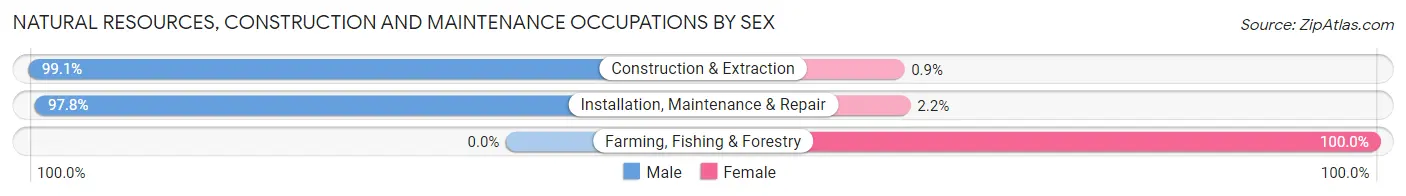
| Occupation | Male | Female |
| Farming, Fishing & Forestry | 0 (0.0%) | 12 (100.0%) |
| Construction & Extraction | 991 (99.1%) | 9 (0.9%) |
| Installation, Maintenance & Repair | 629 (97.8%) | 14 (2.2%) |
| Total (Category) | 1,620 (97.9%) | 35 (2.1%) |
| Total (Overall) | 8,737 (50.9%) | 8,440 (49.1%) |
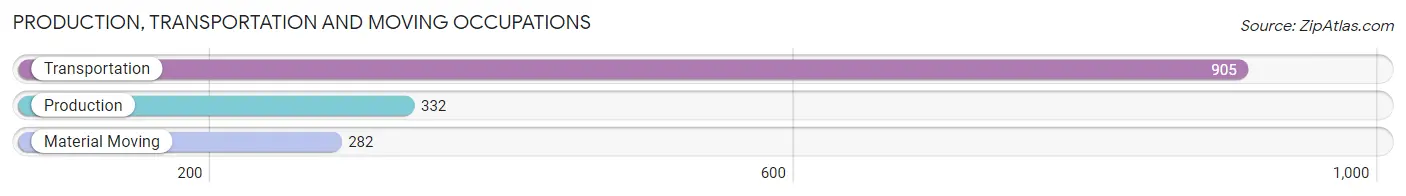
Production, Transportation and Moving Occupations
The most common Production, Transportation and Moving occupations in Franklin Square are Transportation (905 | 5.3%), Production (332 | 1.9%), and Material Moving (282 | 1.6%).
Production, Transportation and Moving Occupations by Sex
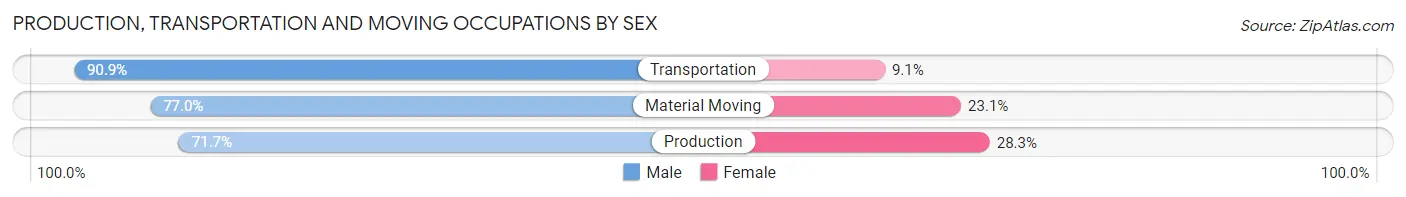
| Occupation | Male | Female |
| Production | 238 (71.7%) | 94 (28.3%) |
| Transportation | 823 (90.9%) | 82 (9.1%) |
| Material Moving | 217 (76.9%) | 65 (23.1%) |
| Total (Category) | 1,278 (84.1%) | 241 (15.9%) |
| Total (Overall) | 8,737 (50.9%) | 8,440 (49.1%) |
Employment Industries by Sex in Franklin Square
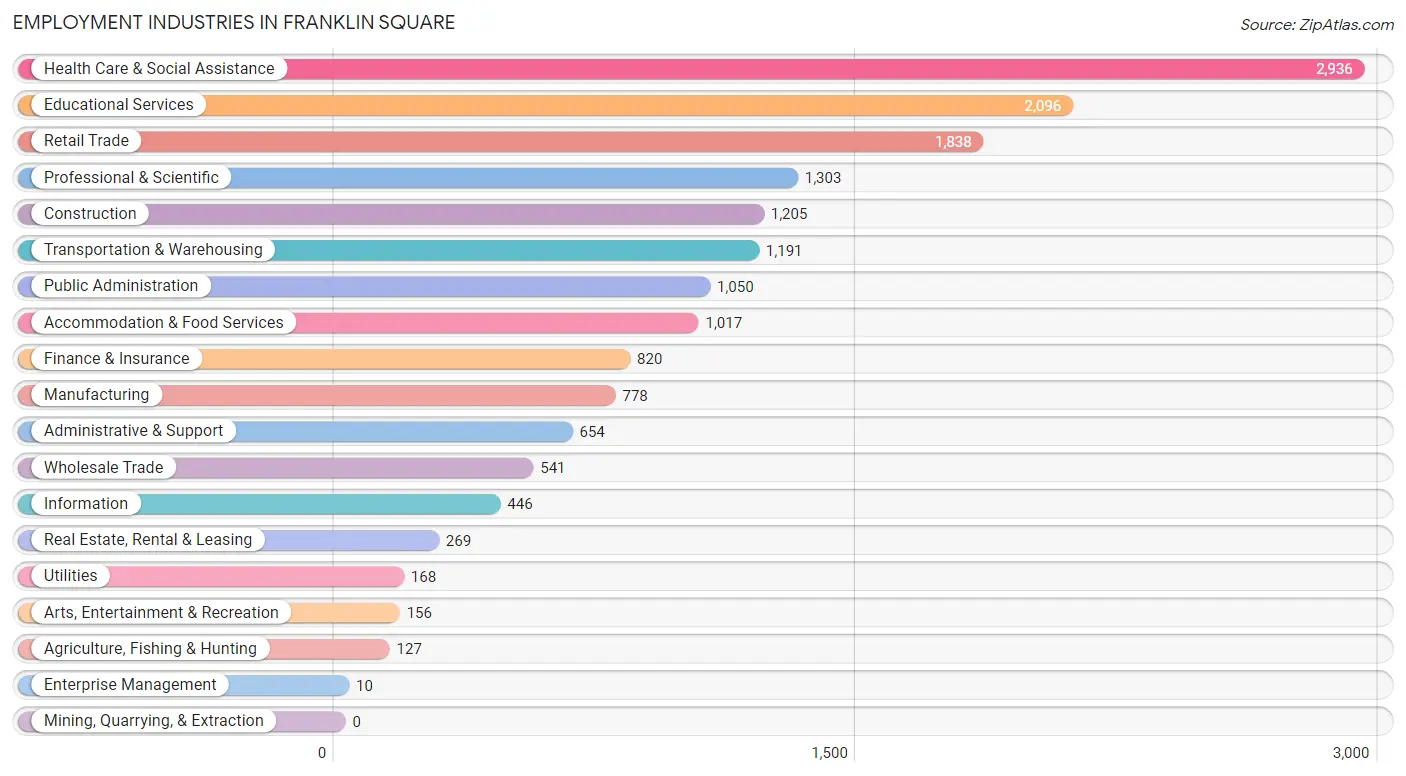
Employment Industries in Franklin Square
The major employment industries in Franklin Square include Health Care & Social Assistance (2,936 | 17.1%), Educational Services (2,096 | 12.2%), Retail Trade (1,838 | 10.7%), Professional & Scientific (1,303 | 7.6%), and Construction (1,205 | 7.0%).
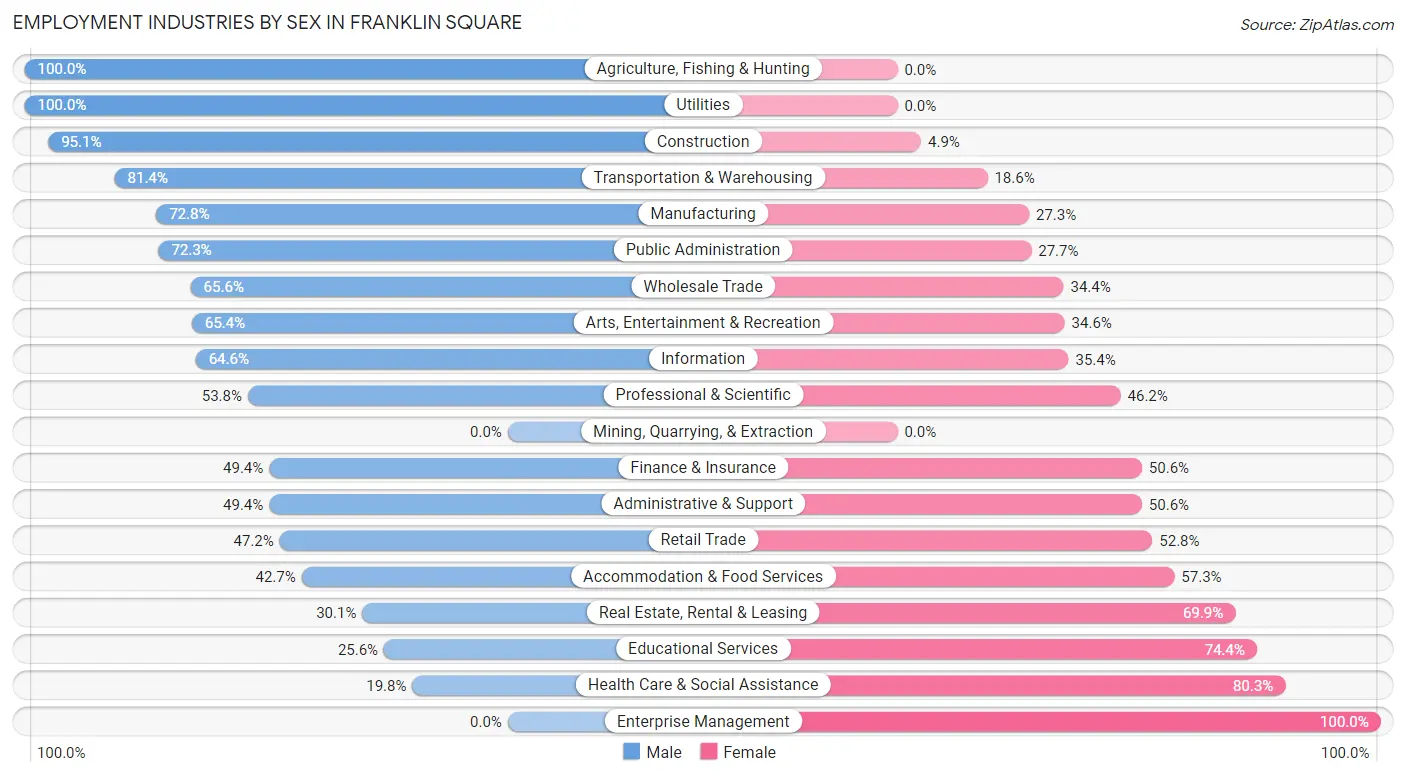
Employment Industries by Sex in Franklin Square
The Franklin Square industries that see more men than women are Agriculture, Fishing & Hunting (100.0%), Utilities (100.0%), and Construction (95.1%), whereas the industries that tend to have a higher number of women are Enterprise Management (100.0%), Health Care & Social Assistance (80.2%), and Educational Services (74.4%).
| Industry | Male | Female |
| Agriculture, Fishing & Hunting | 127 (100.0%) | 0 (0.0%) |
| Mining, Quarrying, & Extraction | 0 (0.0%) | 0 (0.0%) |
| Construction | 1,146 (95.1%) | 59 (4.9%) |
| Manufacturing | 566 (72.8%) | 212 (27.3%) |
| Wholesale Trade | 355 (65.6%) | 186 (34.4%) |
| Retail Trade | 868 (47.2%) | 970 (52.8%) |
| Transportation & Warehousing | 969 (81.4%) | 222 (18.6%) |
| Utilities | 168 (100.0%) | 0 (0.0%) |
| Information | 288 (64.6%) | 158 (35.4%) |
| Finance & Insurance | 405 (49.4%) | 415 (50.6%) |
| Real Estate, Rental & Leasing | 81 (30.1%) | 188 (69.9%) |
| Professional & Scientific | 701 (53.8%) | 602 (46.2%) |
| Enterprise Management | 0 (0.0%) | 10 (100.0%) |
| Administrative & Support | 323 (49.4%) | 331 (50.6%) |
| Educational Services | 537 (25.6%) | 1,559 (74.4%) |
| Health Care & Social Assistance | 580 (19.8%) | 2,356 (80.2%) |
| Arts, Entertainment & Recreation | 102 (65.4%) | 54 (34.6%) |
| Accommodation & Food Services | 434 (42.7%) | 583 (57.3%) |
| Public Administration | 759 (72.3%) | 291 (27.7%) |
| Total | 8,737 (50.9%) | 8,440 (49.1%) |
Education in Franklin Square
School Enrollment in Franklin Square
The most common levels of schooling among the 7,798 students in Franklin Square are high school (1,732 | 22.2%), elementary school (1,594 | 20.4%), and college / undergraduate (1,565 | 20.1%).
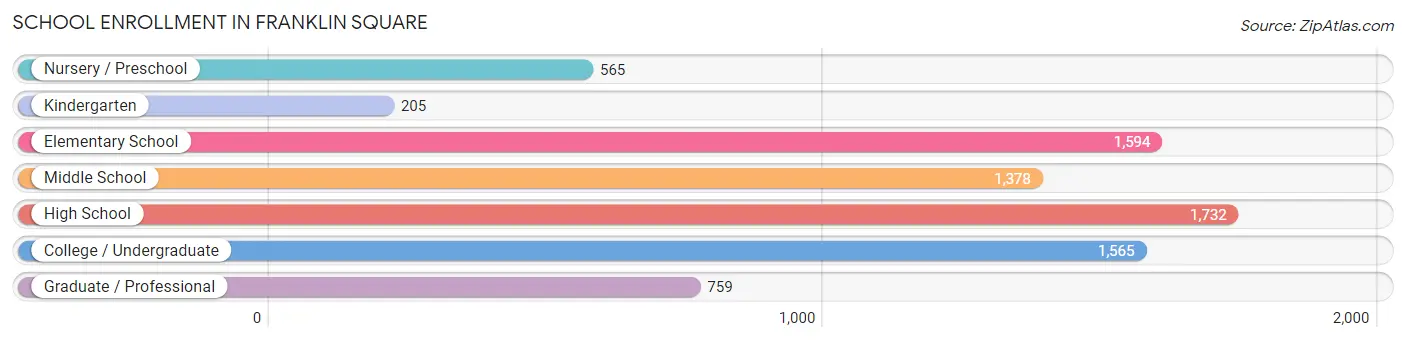
| School Level | # Students | % Students |
| Nursery / Preschool | 565 | 7.2% |
| Kindergarten | 205 | 2.6% |
| Elementary School | 1,594 | 20.4% |
| Middle School | 1,378 | 17.7% |
| High School | 1,732 | 22.2% |
| College / Undergraduate | 1,565 | 20.1% |
| Graduate / Professional | 759 | 9.7% |
| Total | 7,798 | 100.0% |
School Enrollment by Age by Funding Source in Franklin Square
Out of a total of 7,798 students who are enrolled in schools in Franklin Square, 1,716 (22.0%) attend a private institution, while the remaining 6,082 (78.0%) are enrolled in public schools. The age group of 3 to 4 year olds has the highest likelihood of being enrolled in private schools, with 312 (60.8% in the age bracket) enrolled. Conversely, the age group of 5 to 9 year old has the lowest likelihood of being enrolled in a private school, with 1,512 (89.8% in the age bracket) attending a public institution.
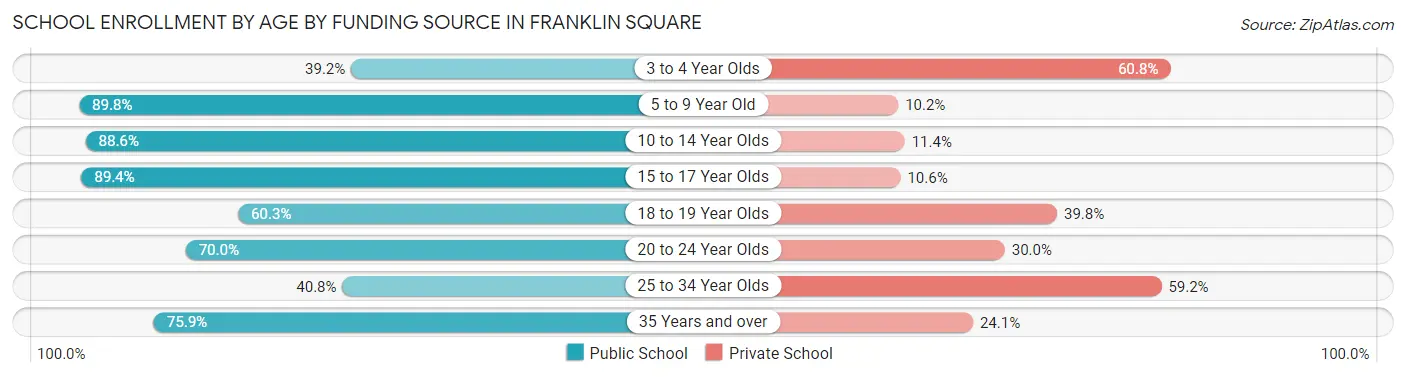
| Age Bracket | Public School | Private School |
| 3 to 4 Year Olds | 201 (39.2%) | 312 (60.8%) |
| 5 to 9 Year Old | 1,512 (89.8%) | 171 (10.2%) |
| 10 to 14 Year Olds | 1,613 (88.6%) | 207 (11.4%) |
| 15 to 17 Year Olds | 1,158 (89.4%) | 137 (10.6%) |
| 18 to 19 Year Olds | 288 (60.3%) | 190 (39.8%) |
| 20 to 24 Year Olds | 767 (70.0%) | 329 (30.0%) |
| 25 to 34 Year Olds | 171 (40.8%) | 248 (59.2%) |
| 35 Years and over | 375 (75.9%) | 119 (24.1%) |
| Total | 6,082 (78.0%) | 1,716 (22.0%) |
Educational Attainment by Field of Study in Franklin Square
Business (2,123 | 22.7%), science & technology (1,469 | 15.7%), education (1,112 | 11.9%), engineering (632 | 6.8%), and arts & humanities (607 | 6.5%) are the most common fields of study among 9,364 individuals in Franklin Square who have obtained a bachelor's degree or higher.
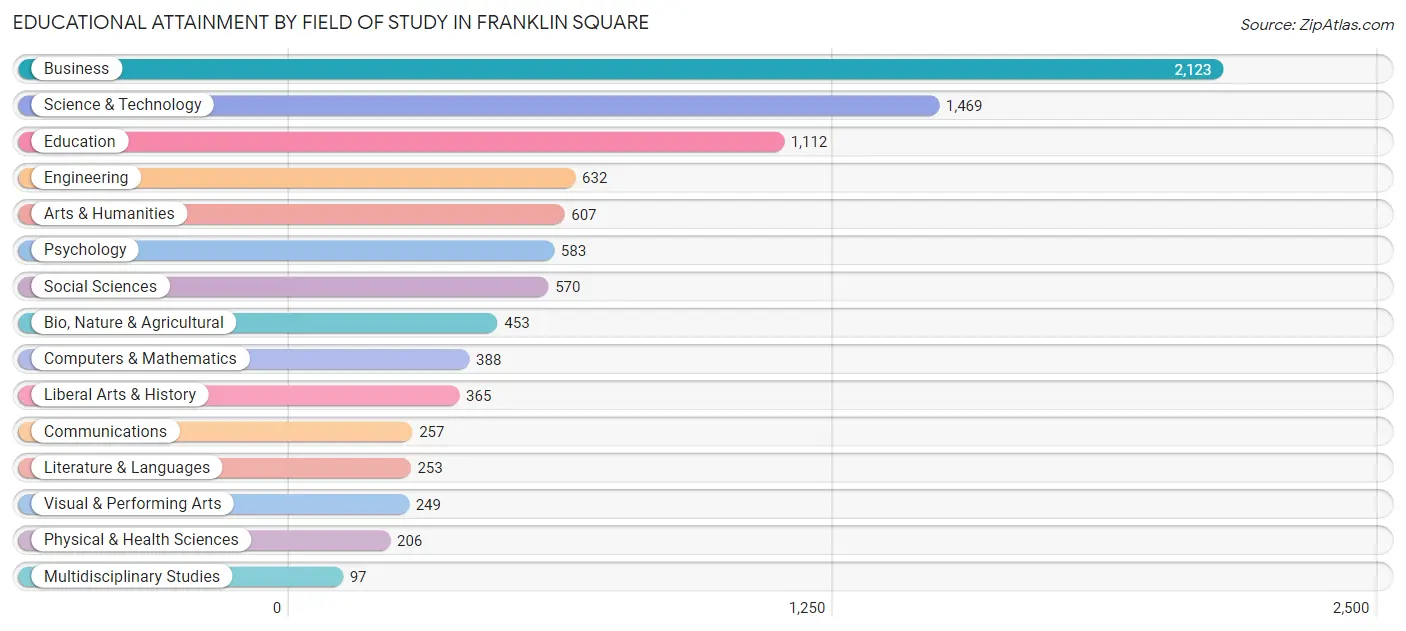
| Field of Study | # Graduates | % Graduates |
| Computers & Mathematics | 388 | 4.1% |
| Bio, Nature & Agricultural | 453 | 4.8% |
| Physical & Health Sciences | 206 | 2.2% |
| Psychology | 583 | 6.2% |
| Social Sciences | 570 | 6.1% |
| Engineering | 632 | 6.8% |
| Multidisciplinary Studies | 97 | 1.0% |
| Science & Technology | 1,469 | 15.7% |
| Business | 2,123 | 22.7% |
| Education | 1,112 | 11.9% |
| Literature & Languages | 253 | 2.7% |
| Liberal Arts & History | 365 | 3.9% |
| Visual & Performing Arts | 249 | 2.7% |
| Communications | 257 | 2.7% |
| Arts & Humanities | 607 | 6.5% |
| Total | 9,364 | 100.0% |
Transportation & Commute in Franklin Square
Vehicle Availability by Sex in Franklin Square
The most prevalent vehicle ownership categories in Franklin Square are males with 2 vehicles (3,637, accounting for 43.8%) and females with 2 vehicles (3,202, making up 45.6%).
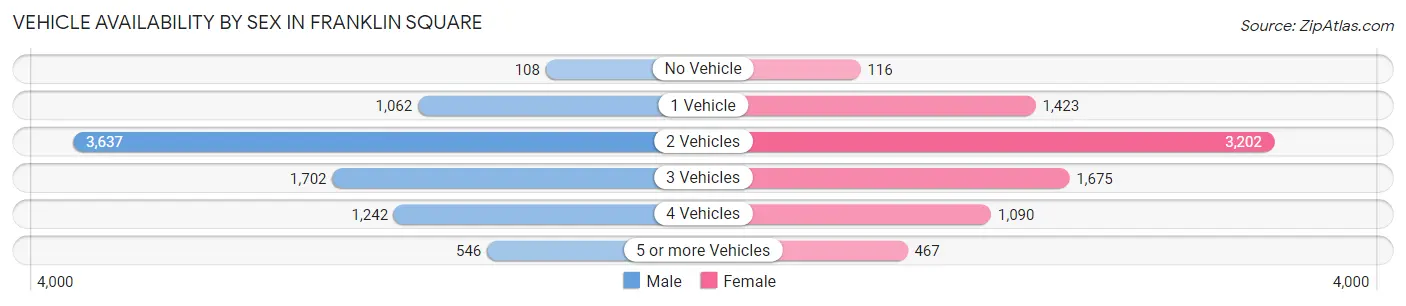
| Vehicles Available | Male | Female |
| No Vehicle | 108 (1.3%) | 116 (1.5%) |
| 1 Vehicle | 1,062 (12.8%) | 1,423 (17.8%) |
| 2 Vehicles | 3,637 (43.8%) | 3,202 (40.2%) |
| 3 Vehicles | 1,702 (20.5%) | 1,675 (21.0%) |
| 4 Vehicles | 1,242 (15.0%) | 1,090 (13.7%) |
| 5 or more Vehicles | 546 (6.6%) | 467 (5.9%) |
| Total | 8,297 (100.0%) | 7,973 (100.0%) |
Commute Time in Franklin Square
The most frequently occuring commute durations in Franklin Square are 30 to 34 minutes (2,349 commuters, 15.6%), 20 to 24 minutes (2,077 commuters, 13.8%), and 60 to 89 minutes (2,057 commuters, 13.7%).
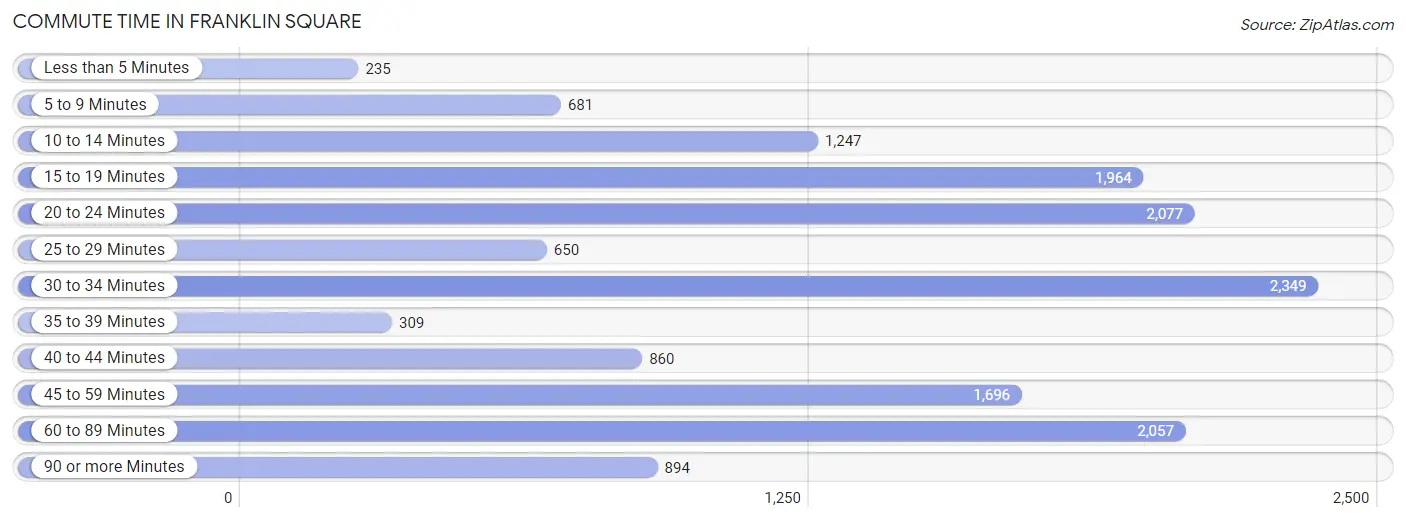
| Commute Time | # Commuters | % Commuters |
| Less than 5 Minutes | 235 | 1.6% |
| 5 to 9 Minutes | 681 | 4.5% |
| 10 to 14 Minutes | 1,247 | 8.3% |
| 15 to 19 Minutes | 1,964 | 13.1% |
| 20 to 24 Minutes | 2,077 | 13.8% |
| 25 to 29 Minutes | 650 | 4.3% |
| 30 to 34 Minutes | 2,349 | 15.6% |
| 35 to 39 Minutes | 309 | 2.1% |
| 40 to 44 Minutes | 860 | 5.7% |
| 45 to 59 Minutes | 1,696 | 11.3% |
| 60 to 89 Minutes | 2,057 | 13.7% |
| 90 or more Minutes | 894 | 5.9% |
Commute Time by Sex in Franklin Square
The most common commute times in Franklin Square are 30 to 34 minutes (1,330 commuters, 17.1%) for males and 20 to 24 minutes (1,278 commuters, 17.7%) for females.
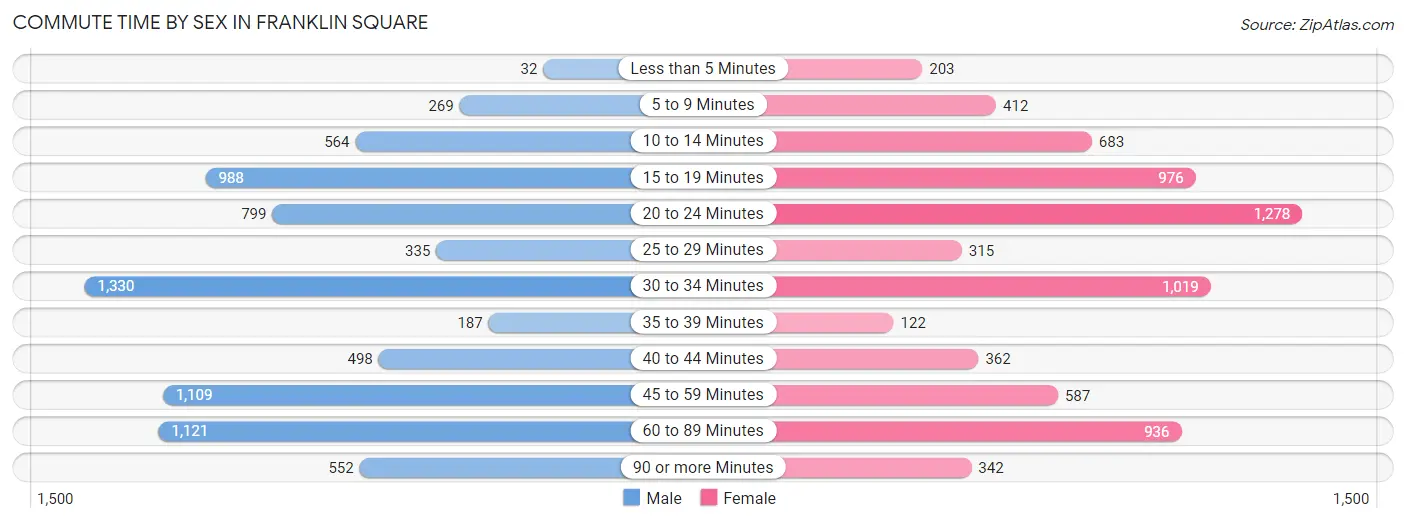
| Commute Time | Male | Female |
| Less than 5 Minutes | 32 (0.4%) | 203 (2.8%) |
| 5 to 9 Minutes | 269 (3.5%) | 412 (5.7%) |
| 10 to 14 Minutes | 564 (7.2%) | 683 (9.4%) |
| 15 to 19 Minutes | 988 (12.7%) | 976 (13.5%) |
| 20 to 24 Minutes | 799 (10.3%) | 1,278 (17.7%) |
| 25 to 29 Minutes | 335 (4.3%) | 315 (4.3%) |
| 30 to 34 Minutes | 1,330 (17.1%) | 1,019 (14.1%) |
| 35 to 39 Minutes | 187 (2.4%) | 122 (1.7%) |
| 40 to 44 Minutes | 498 (6.4%) | 362 (5.0%) |
| 45 to 59 Minutes | 1,109 (14.2%) | 587 (8.1%) |
| 60 to 89 Minutes | 1,121 (14.4%) | 936 (12.9%) |
| 90 or more Minutes | 552 (7.1%) | 342 (4.7%) |
Time of Departure to Work by Sex in Franklin Square
The most frequent times of departure to work in Franklin Square are 7:00 AM to 7:29 AM (1,234, 15.9%) for males and 8:00 AM to 8:29 AM (1,258, 17.4%) for females.
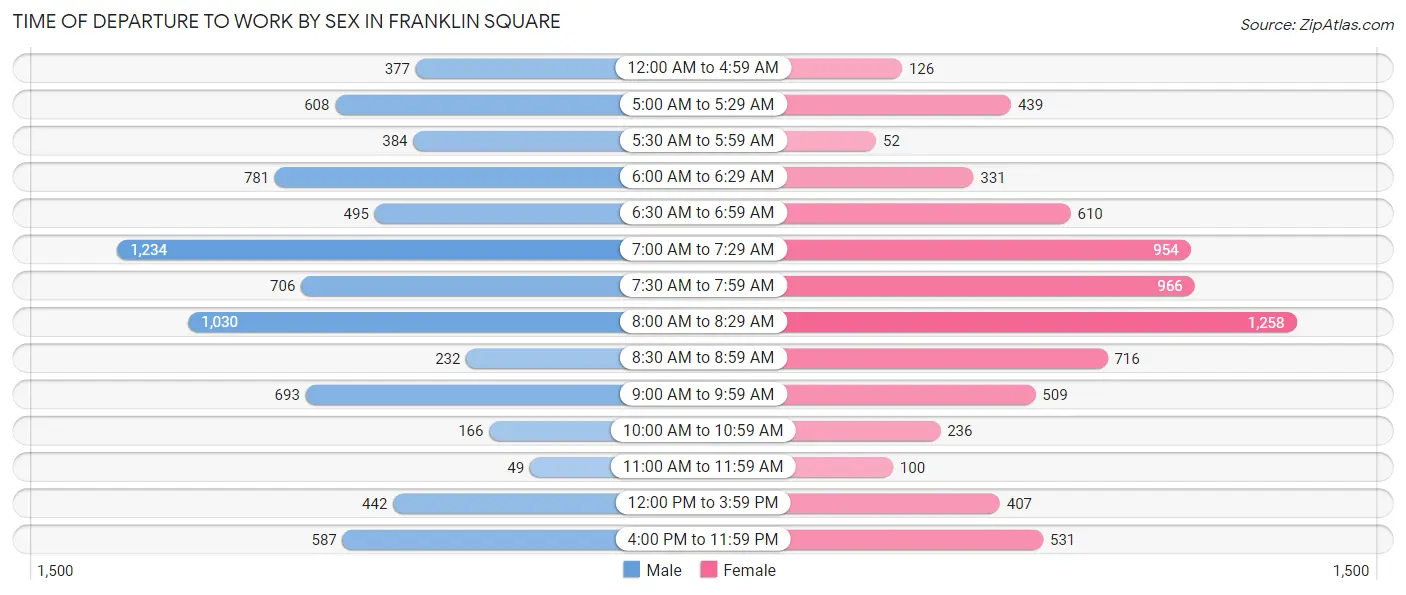
| Time of Departure | Male | Female |
| 12:00 AM to 4:59 AM | 377 (4.8%) | 126 (1.7%) |
| 5:00 AM to 5:29 AM | 608 (7.8%) | 439 (6.1%) |
| 5:30 AM to 5:59 AM | 384 (4.9%) | 52 (0.7%) |
| 6:00 AM to 6:29 AM | 781 (10.0%) | 331 (4.6%) |
| 6:30 AM to 6:59 AM | 495 (6.4%) | 610 (8.4%) |
| 7:00 AM to 7:29 AM | 1,234 (15.9%) | 954 (13.2%) |
| 7:30 AM to 7:59 AM | 706 (9.1%) | 966 (13.4%) |
| 8:00 AM to 8:29 AM | 1,030 (13.2%) | 1,258 (17.4%) |
| 8:30 AM to 8:59 AM | 232 (3.0%) | 716 (9.9%) |
| 9:00 AM to 9:59 AM | 693 (8.9%) | 509 (7.0%) |
| 10:00 AM to 10:59 AM | 166 (2.1%) | 236 (3.3%) |
| 11:00 AM to 11:59 AM | 49 (0.6%) | 100 (1.4%) |
| 12:00 PM to 3:59 PM | 442 (5.7%) | 407 (5.6%) |
| 4:00 PM to 11:59 PM | 587 (7.5%) | 531 (7.3%) |
| Total | 7,784 (100.0%) | 7,235 (100.0%) |
Housing Occupancy in Franklin Square
Occupancy by Ownership in Franklin Square
Of the total 9,809 dwellings in Franklin Square, owner-occupied units account for 8,197 (83.6%), while renter-occupied units make up 1,612 (16.4%).
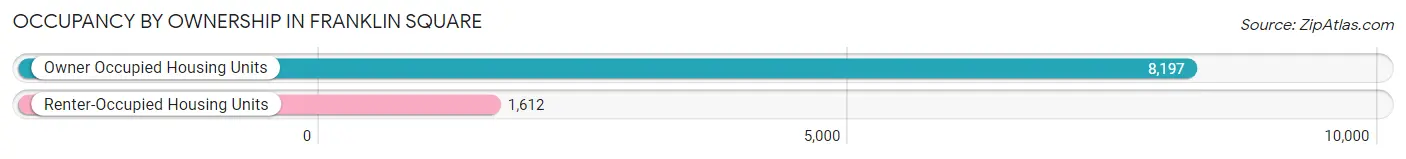
| Occupancy | # Housing Units | % Housing Units |
| Owner Occupied Housing Units | 8,197 | 83.6% |
| Renter-Occupied Housing Units | 1,612 | 16.4% |
| Total Occupied Housing Units | 9,809 | 100.0% |
Occupancy by Household Size in Franklin Square
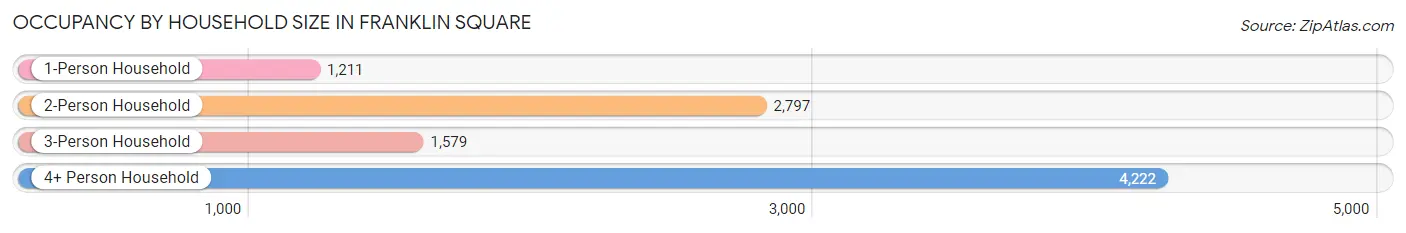
| Household Size | # Housing Units | % Housing Units |
| 1-Person Household | 1,211 | 12.3% |
| 2-Person Household | 2,797 | 28.5% |
| 3-Person Household | 1,579 | 16.1% |
| 4+ Person Household | 4,222 | 43.0% |
| Total Housing Units | 9,809 | 100.0% |
Occupancy by Ownership by Household Size in Franklin Square
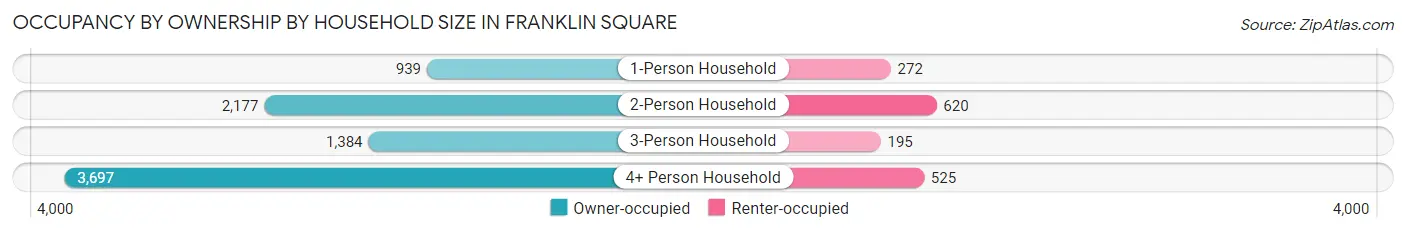
| Household Size | Owner-occupied | Renter-occupied |
| 1-Person Household | 939 (77.5%) | 272 (22.5%) |
| 2-Person Household | 2,177 (77.8%) | 620 (22.2%) |
| 3-Person Household | 1,384 (87.6%) | 195 (12.3%) |
| 4+ Person Household | 3,697 (87.6%) | 525 (12.4%) |
| Total Housing Units | 8,197 (83.6%) | 1,612 (16.4%) |
Occupancy by Educational Attainment in Franklin Square
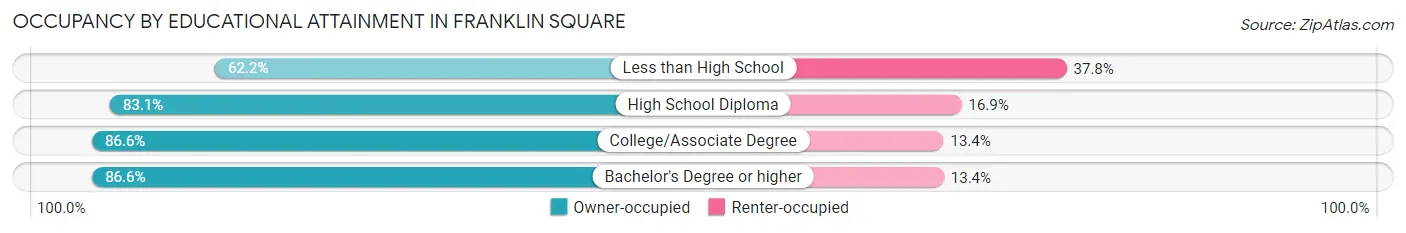
| Household Size | Owner-occupied | Renter-occupied |
| Less than High School | 562 (62.2%) | 341 (37.8%) |
| High School Diploma | 1,831 (83.1%) | 373 (16.9%) |
| College/Associate Degree | 2,230 (86.6%) | 344 (13.4%) |
| Bachelor's Degree or higher | 3,574 (86.6%) | 554 (13.4%) |
Occupancy by Age of Householder in Franklin Square
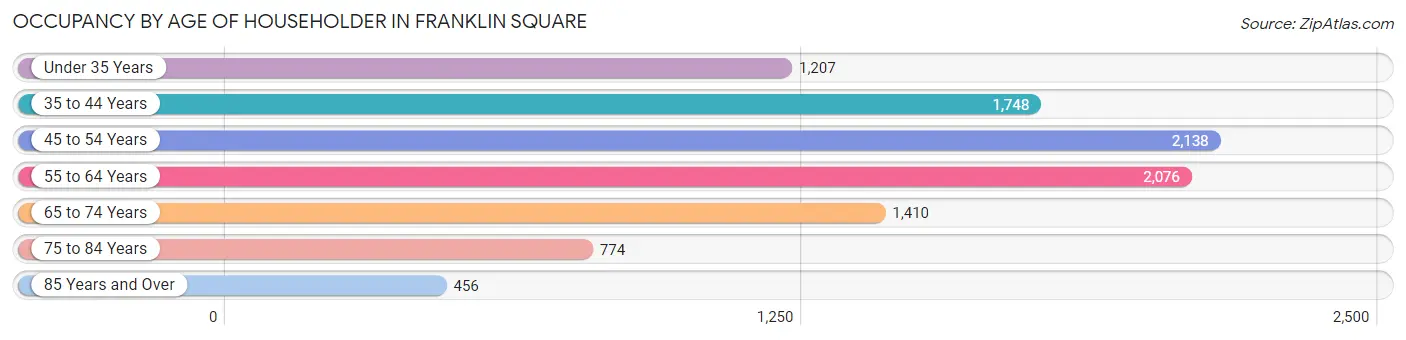
| Age Bracket | # Households | % Households |
| Under 35 Years | 1,207 | 12.3% |
| 35 to 44 Years | 1,748 | 17.8% |
| 45 to 54 Years | 2,138 | 21.8% |
| 55 to 64 Years | 2,076 | 21.2% |
| 65 to 74 Years | 1,410 | 14.4% |
| 75 to 84 Years | 774 | 7.9% |
| 85 Years and Over | 456 | 4.6% |
| Total | 9,809 | 100.0% |
Housing Finances in Franklin Square
Median Income by Occupancy in Franklin Square
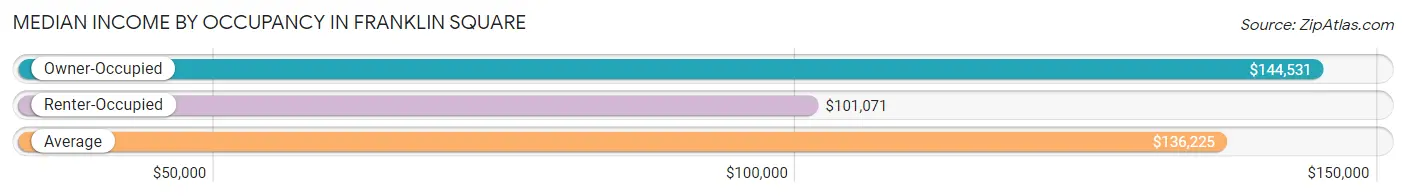
| Occupancy Type | # Households | Median Income |
| Owner-Occupied | 8,197 (83.6%) | $144,531 |
| Renter-Occupied | 1,612 (16.4%) | $101,071 |
| Average | 9,809 (100.0%) | $136,225 |
Occupancy by Householder Income Bracket in Franklin Square
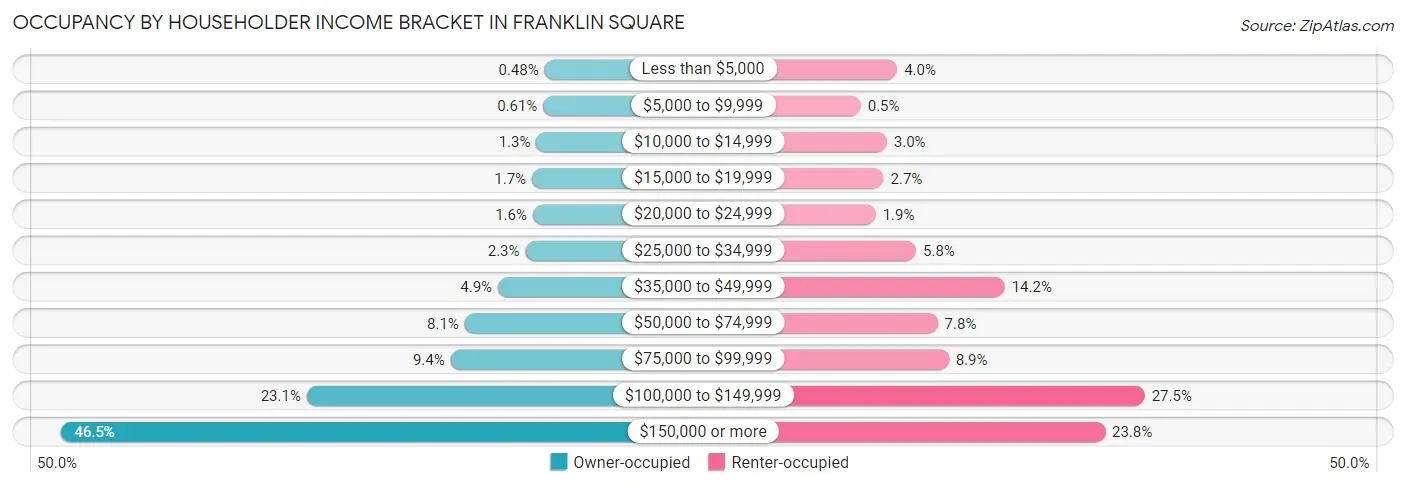
| Income Bracket | Owner-occupied | Renter-occupied |
| Less than $5,000 | 39 (0.5%) | 64 (4.0%) |
| $5,000 to $9,999 | 50 (0.6%) | 8 (0.5%) |
| $10,000 to $14,999 | 104 (1.3%) | 48 (3.0%) |
| $15,000 to $19,999 | 138 (1.7%) | 43 (2.7%) |
| $20,000 to $24,999 | 131 (1.6%) | 31 (1.9%) |
| $25,000 to $34,999 | 189 (2.3%) | 93 (5.8%) |
| $35,000 to $49,999 | 403 (4.9%) | 229 (14.2%) |
| $50,000 to $74,999 | 663 (8.1%) | 126 (7.8%) |
| $75,000 to $99,999 | 773 (9.4%) | 143 (8.9%) |
| $100,000 to $149,999 | 1,896 (23.1%) | 444 (27.5%) |
| $150,000 or more | 3,811 (46.5%) | 383 (23.8%) |
| Total | 8,197 (100.0%) | 1,612 (100.0%) |
Monthly Housing Cost Tiers in Franklin Square
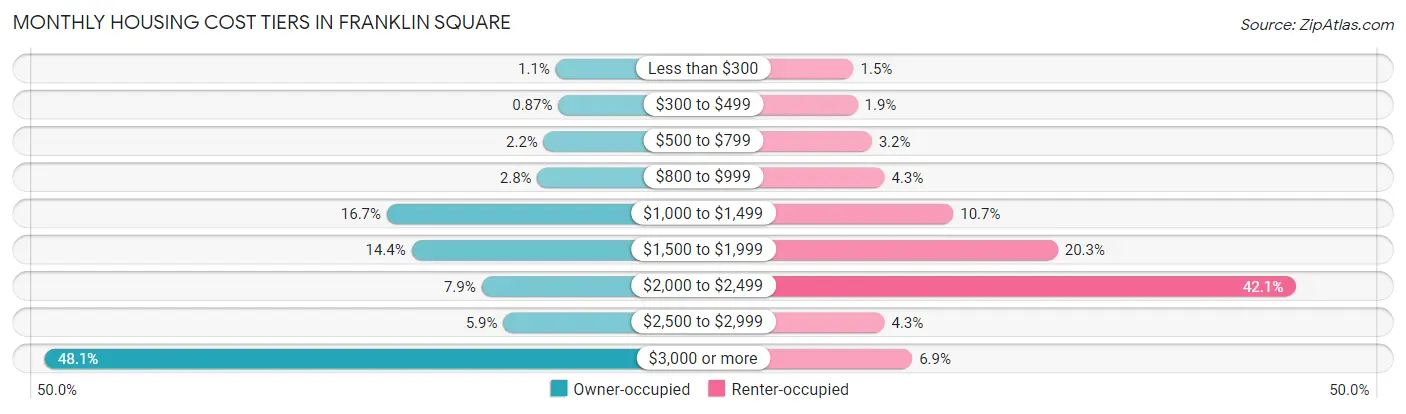
| Monthly Cost | Owner-occupied | Renter-occupied |
| Less than $300 | 91 (1.1%) | 24 (1.5%) |
| $300 to $499 | 71 (0.9%) | 30 (1.9%) |
| $500 to $799 | 181 (2.2%) | 51 (3.2%) |
| $800 to $999 | 229 (2.8%) | 70 (4.3%) |
| $1,000 to $1,499 | 1,365 (16.7%) | 172 (10.7%) |
| $1,500 to $1,999 | 1,179 (14.4%) | 327 (20.3%) |
| $2,000 to $2,499 | 650 (7.9%) | 679 (42.1%) |
| $2,500 to $2,999 | 486 (5.9%) | 70 (4.3%) |
| $3,000 or more | 3,945 (48.1%) | 111 (6.9%) |
| Total | 8,197 (100.0%) | 1,612 (100.0%) |
Physical Housing Characteristics in Franklin Square
Housing Structures in Franklin Square
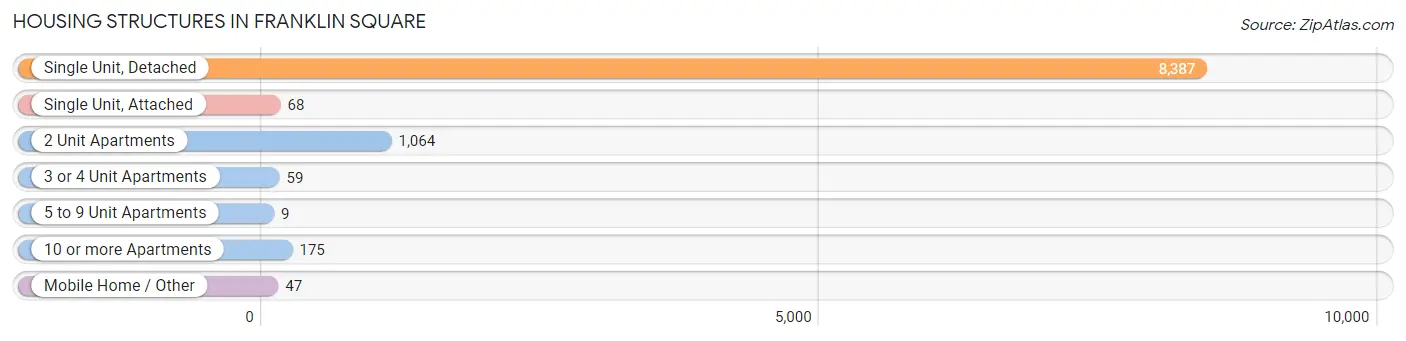
| Structure Type | # Housing Units | % Housing Units |
| Single Unit, Detached | 8,387 | 85.5% |
| Single Unit, Attached | 68 | 0.7% |
| 2 Unit Apartments | 1,064 | 10.8% |
| 3 or 4 Unit Apartments | 59 | 0.6% |
| 5 to 9 Unit Apartments | 9 | 0.1% |
| 10 or more Apartments | 175 | 1.8% |
| Mobile Home / Other | 47 | 0.5% |
| Total | 9,809 | 100.0% |
Housing Structures by Occupancy in Franklin Square
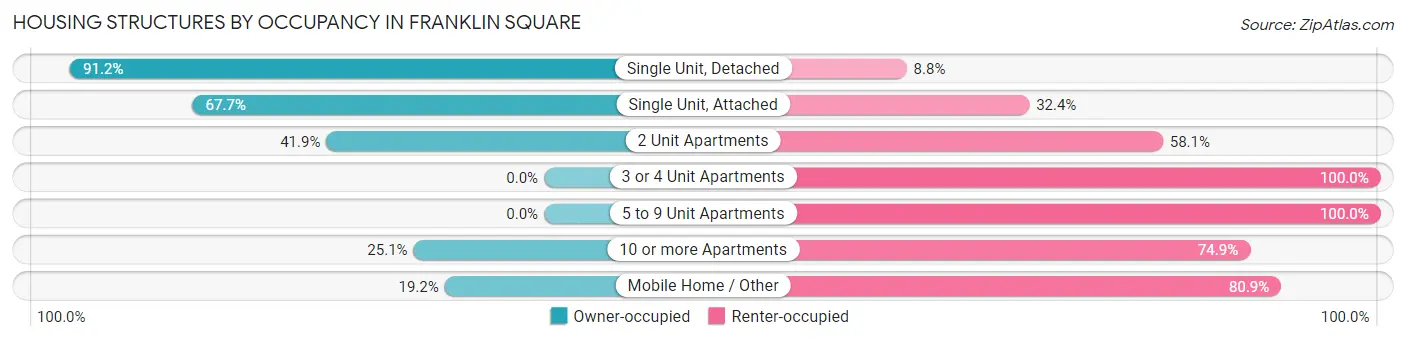
| Structure Type | Owner-occupied | Renter-occupied |
| Single Unit, Detached | 7,652 (91.2%) | 735 (8.8%) |
| Single Unit, Attached | 46 (67.6%) | 22 (32.4%) |
| 2 Unit Apartments | 446 (41.9%) | 618 (58.1%) |
| 3 or 4 Unit Apartments | 0 (0.0%) | 59 (100.0%) |
| 5 to 9 Unit Apartments | 0 (0.0%) | 9 (100.0%) |
| 10 or more Apartments | 44 (25.1%) | 131 (74.9%) |
| Mobile Home / Other | 9 (19.2%) | 38 (80.8%) |
| Total | 8,197 (83.6%) | 1,612 (16.4%) |
Housing Structures by Number of Rooms in Franklin Square
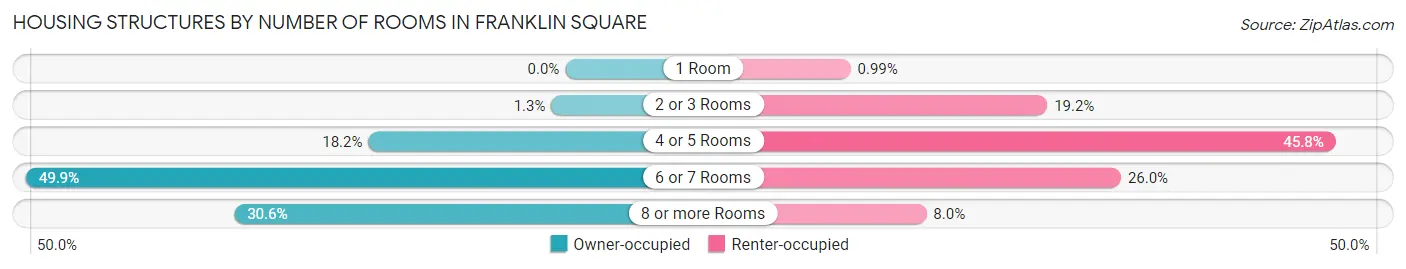
| Number of Rooms | Owner-occupied | Renter-occupied |
| 1 Room | 0 (0.0%) | 16 (1.0%) |
| 2 or 3 Rooms | 106 (1.3%) | 309 (19.2%) |
| 4 or 5 Rooms | 1,493 (18.2%) | 739 (45.8%) |
| 6 or 7 Rooms | 4,089 (49.9%) | 419 (26.0%) |
| 8 or more Rooms | 2,509 (30.6%) | 129 (8.0%) |
| Total | 8,197 (100.0%) | 1,612 (100.0%) |
Housing Structure by Heating Type in Franklin Square
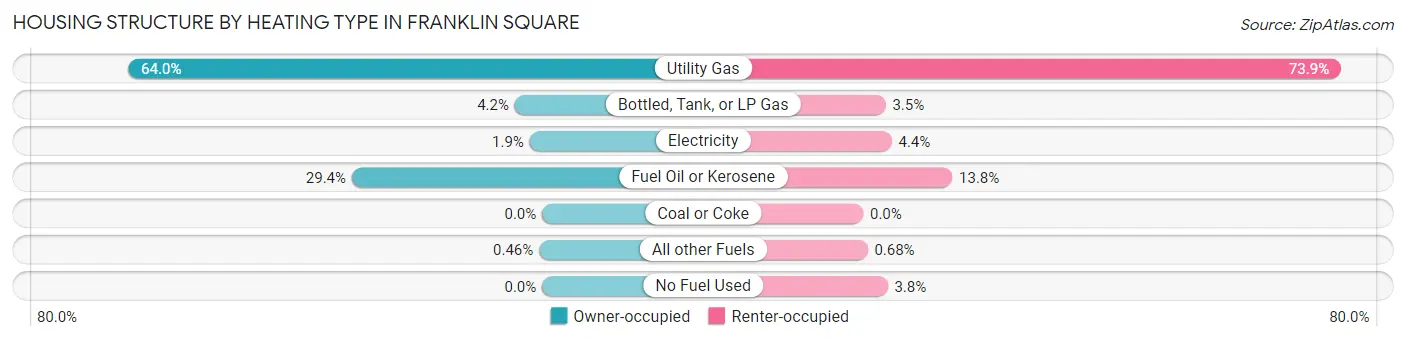
| Heating Type | Owner-occupied | Renter-occupied |
| Utility Gas | 5,245 (64.0%) | 1,191 (73.9%) |
| Bottled, Tank, or LP Gas | 346 (4.2%) | 56 (3.5%) |
| Electricity | 157 (1.9%) | 71 (4.4%) |
| Fuel Oil or Kerosene | 2,411 (29.4%) | 222 (13.8%) |
| Coal or Coke | 0 (0.0%) | 0 (0.0%) |
| All other Fuels | 38 (0.5%) | 11 (0.7%) |
| No Fuel Used | 0 (0.0%) | 61 (3.8%) |
| Total | 8,197 (100.0%) | 1,612 (100.0%) |
Household Vehicle Usage in Franklin Square
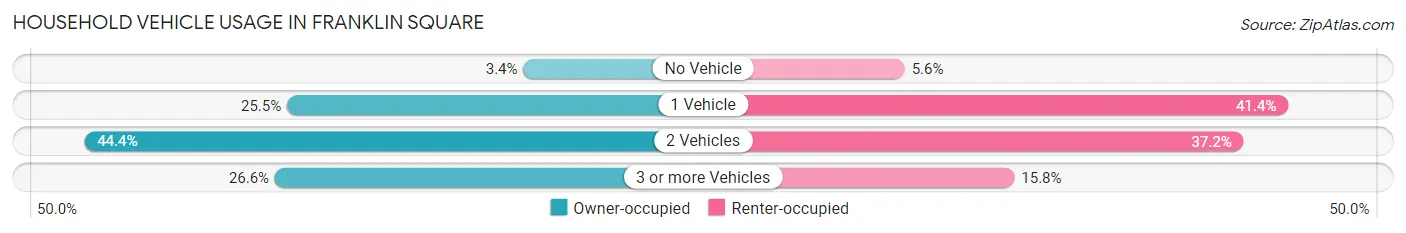
| Vehicles per Household | Owner-occupied | Renter-occupied |
| No Vehicle | 282 (3.4%) | 90 (5.6%) |
| 1 Vehicle | 2,090 (25.5%) | 667 (41.4%) |
| 2 Vehicles | 3,642 (44.4%) | 600 (37.2%) |
| 3 or more Vehicles | 2,183 (26.6%) | 255 (15.8%) |
| Total | 8,197 (100.0%) | 1,612 (100.0%) |
Real Estate & Mortgages in Franklin Square
Real Estate and Mortgage Overview in Franklin Square
| Characteristic | Without Mortgage | With Mortgage |
| Housing Units | 2,955 | 5,242 |
| Median Property Value | $601,800 | $629,900 |
| Median Household Income | $96,589 | $3,104 |
| Monthly Housing Costs | $1,396 | $3,937 |
| Real Estate Taxes | $10,001 | $75 |
Property Value by Mortgage Status in Franklin Square
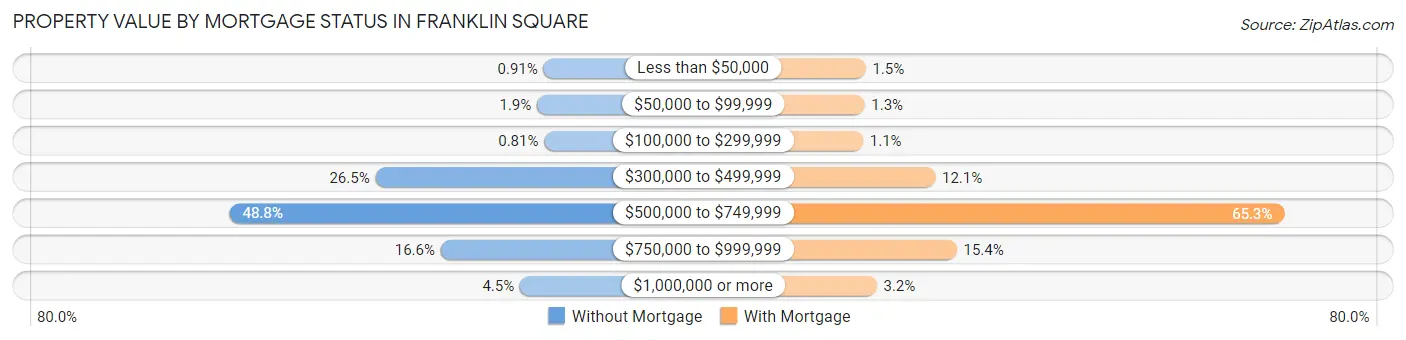
| Property Value | Without Mortgage | With Mortgage |
| Less than $50,000 | 27 (0.9%) | 79 (1.5%) |
| $50,000 to $99,999 | 56 (1.9%) | 70 (1.3%) |
| $100,000 to $299,999 | 24 (0.8%) | 58 (1.1%) |
| $300,000 to $499,999 | 784 (26.5%) | 635 (12.1%) |
| $500,000 to $749,999 | 1,441 (48.8%) | 3,425 (65.3%) |
| $750,000 to $999,999 | 490 (16.6%) | 807 (15.4%) |
| $1,000,000 or more | 133 (4.5%) | 168 (3.2%) |
| Total | 2,955 (100.0%) | 5,242 (100.0%) |
Household Income by Mortgage Status in Franklin Square
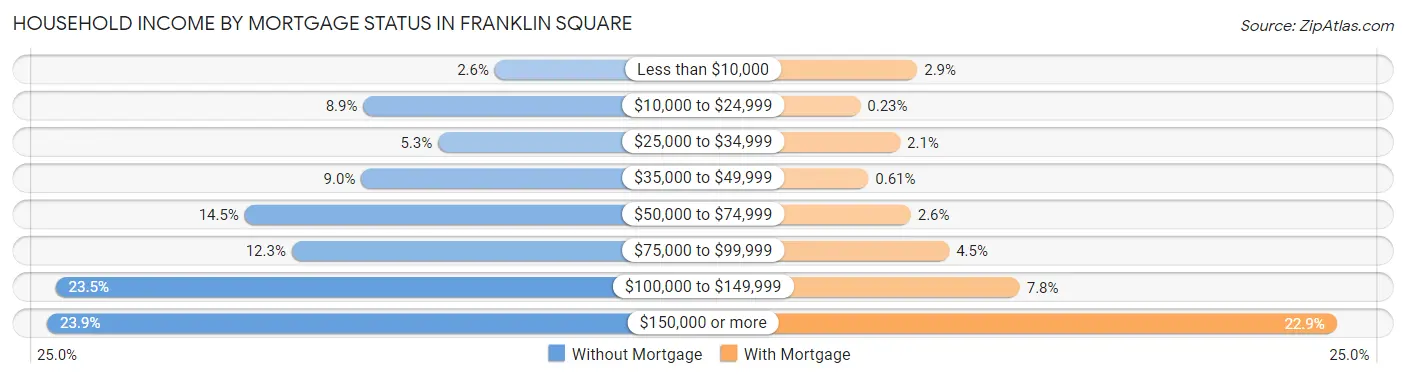
| Household Income | Without Mortgage | With Mortgage |
| Less than $10,000 | 77 (2.6%) | 154 (2.9%) |
| $10,000 to $24,999 | 262 (8.9%) | 12 (0.2%) |
| $25,000 to $34,999 | 157 (5.3%) | 111 (2.1%) |
| $35,000 to $49,999 | 265 (9.0%) | 32 (0.6%) |
| $50,000 to $74,999 | 429 (14.5%) | 138 (2.6%) |
| $75,000 to $99,999 | 363 (12.3%) | 234 (4.5%) |
| $100,000 to $149,999 | 695 (23.5%) | 410 (7.8%) |
| $150,000 or more | 707 (23.9%) | 1,201 (22.9%) |
| Total | 2,955 (100.0%) | 5,242 (100.0%) |
Property Value to Household Income Ratio in Franklin Square
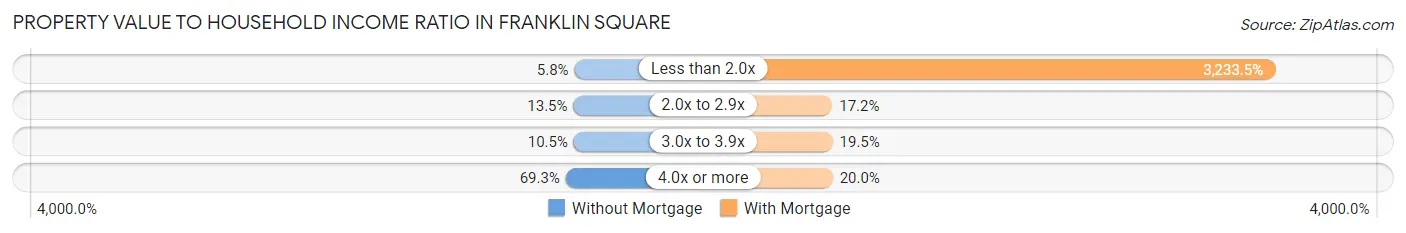
| Value-to-Income Ratio | Without Mortgage | With Mortgage |
| Less than 2.0x | 171 (5.8%) | 169,500 (3,233.5%) |
| 2.0x to 2.9x | 400 (13.5%) | 900 (17.2%) |
| 3.0x to 3.9x | 311 (10.5%) | 1,022 (19.5%) |
| 4.0x or more | 2,048 (69.3%) | 1,049 (20.0%) |
| Total | 2,955 (100.0%) | 5,242 (100.0%) |
Real Estate Taxes by Mortgage Status in Franklin Square
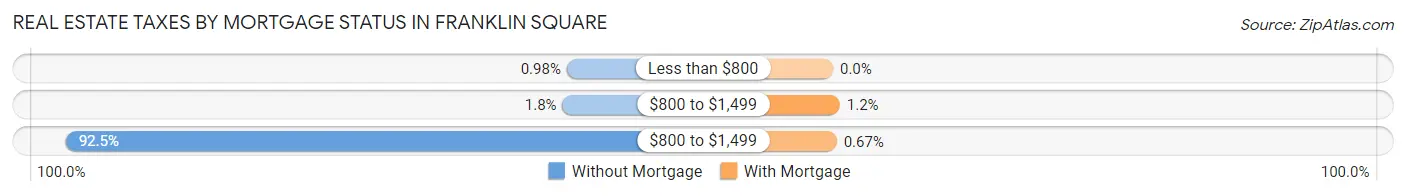
| Property Taxes | Without Mortgage | With Mortgage |
| Less than $800 | 29 (1.0%) | 0 (0.0%) |
| $800 to $1,499 | 52 (1.8%) | 65 (1.2%) |
| $800 to $1,499 | 2,733 (92.5%) | 35 (0.7%) |
| Total | 2,955 (100.0%) | 5,242 (100.0%) |
Health & Disability in Franklin Square
Health Insurance Coverage by Age in Franklin Square
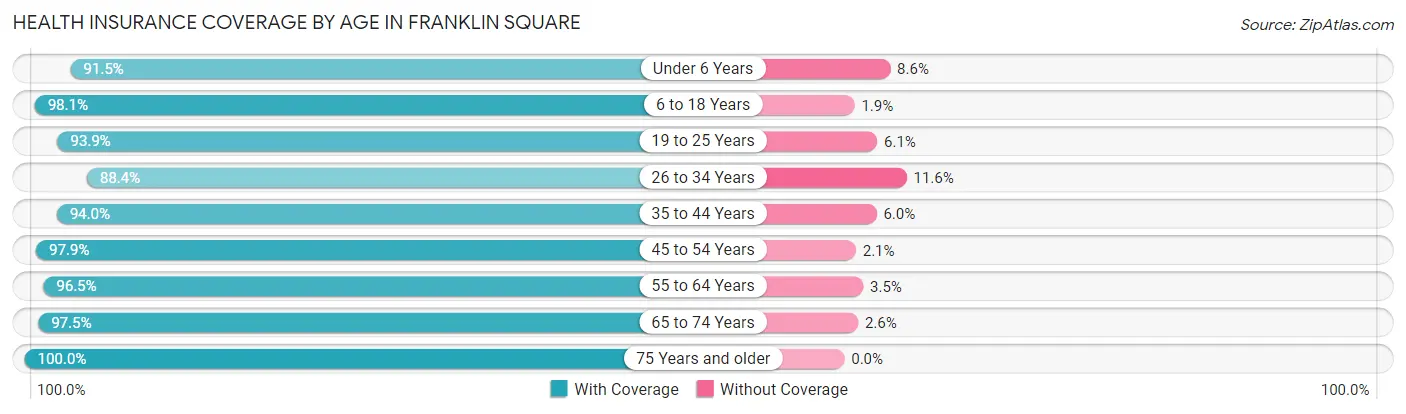
| Age Bracket | With Coverage | Without Coverage |
| Under 6 Years | 1,668 (91.4%) | 156 (8.6%) |
| 6 to 18 Years | 4,918 (98.1%) | 95 (1.9%) |
| 19 to 25 Years | 2,531 (93.9%) | 165 (6.1%) |
| 26 to 34 Years | 3,791 (88.4%) | 498 (11.6%) |
| 35 to 44 Years | 3,619 (94.0%) | 231 (6.0%) |
| 45 to 54 Years | 4,252 (97.9%) | 93 (2.1%) |
| 55 to 64 Years | 4,258 (96.5%) | 155 (3.5%) |
| 65 to 74 Years | 3,091 (97.5%) | 81 (2.5%) |
| 75 Years and older | 2,251 (100.0%) | 0 (0.0%) |
| Total | 30,379 (95.4%) | 1,474 (4.6%) |
Health Insurance Coverage by Citizenship Status in Franklin Square
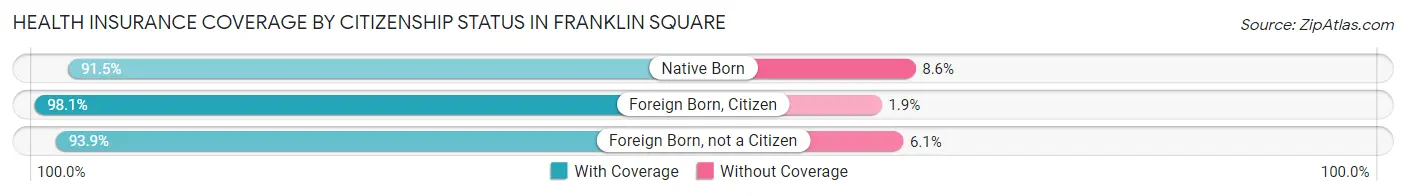
| Citizenship Status | With Coverage | Without Coverage |
| Native Born | 1,668 (91.4%) | 156 (8.6%) |
| Foreign Born, Citizen | 4,918 (98.1%) | 95 (1.9%) |
| Foreign Born, not a Citizen | 2,531 (93.9%) | 165 (6.1%) |
Health Insurance Coverage by Household Income in Franklin Square
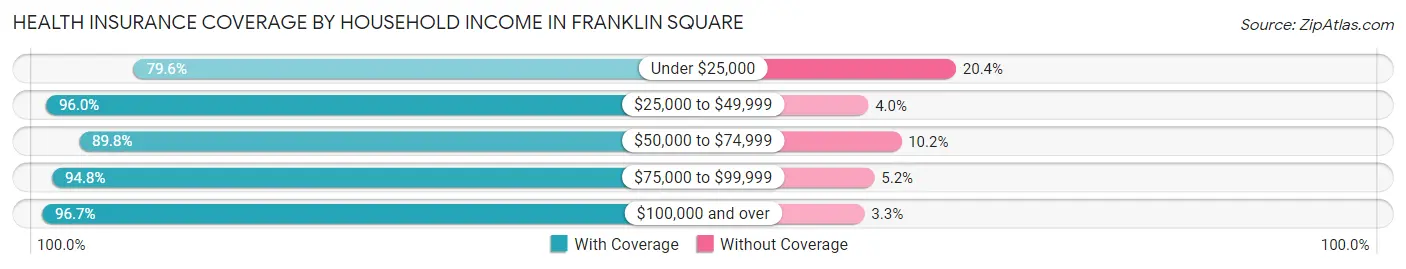
| Household Income | With Coverage | Without Coverage |
| Under $25,000 | 962 (79.6%) | 247 (20.4%) |
| $25,000 to $49,999 | 2,084 (96.0%) | 87 (4.0%) |
| $50,000 to $74,999 | 1,955 (89.8%) | 222 (10.2%) |
| $75,000 to $99,999 | 2,498 (94.8%) | 136 (5.2%) |
| $100,000 and over | 22,830 (96.7%) | 778 (3.3%) |
Public vs Private Health Insurance Coverage by Age in Franklin Square
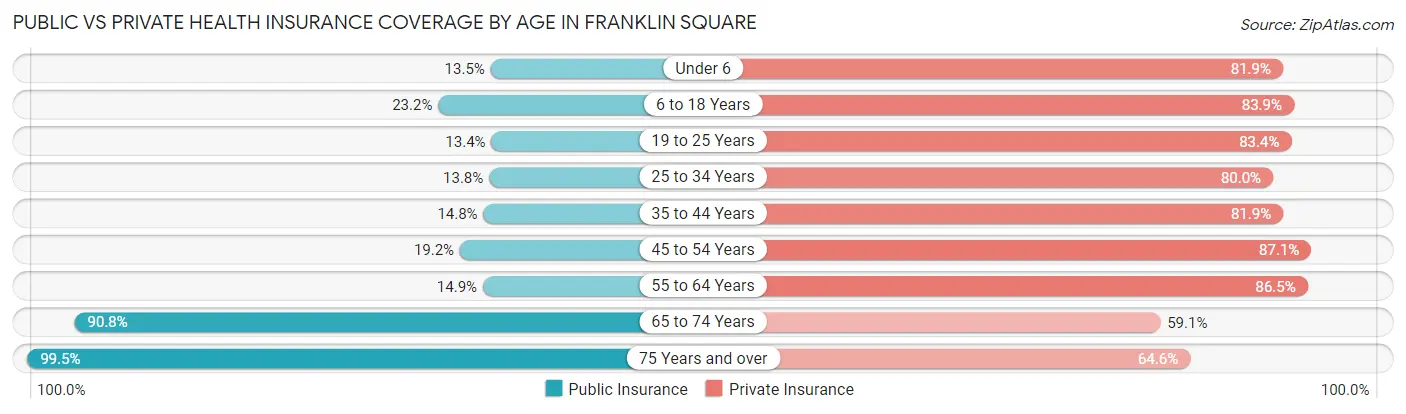
| Age Bracket | Public Insurance | Private Insurance |
| Under 6 | 246 (13.5%) | 1,493 (81.9%) |
| 6 to 18 Years | 1,164 (23.2%) | 4,206 (83.9%) |
| 19 to 25 Years | 360 (13.4%) | 2,249 (83.4%) |
| 25 to 34 Years | 591 (13.8%) | 3,432 (80.0%) |
| 35 to 44 Years | 571 (14.8%) | 3,153 (81.9%) |
| 45 to 54 Years | 834 (19.2%) | 3,785 (87.1%) |
| 55 to 64 Years | 659 (14.9%) | 3,815 (86.5%) |
| 65 to 74 Years | 2,879 (90.8%) | 1,875 (59.1%) |
| 75 Years and over | 2,240 (99.5%) | 1,455 (64.6%) |
| Total | 9,544 (30.0%) | 25,463 (79.9%) |
Disability Status by Sex by Age in Franklin Square
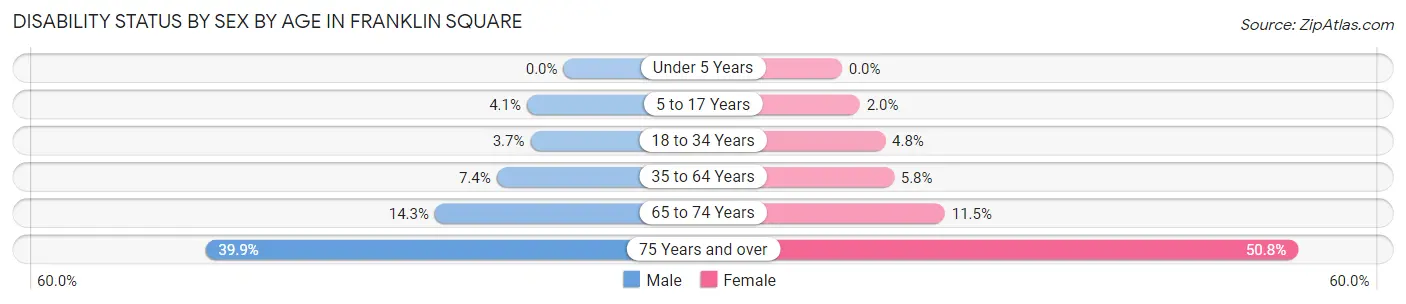
| Age Bracket | Male | Female |
| Under 5 Years | 0 (0.0%) | 0 (0.0%) |
| 5 to 17 Years | 90 (4.1%) | 54 (2.0%) |
| 18 to 34 Years | 135 (3.7%) | 178 (4.8%) |
| 35 to 64 Years | 461 (7.4%) | 371 (5.8%) |
| 65 to 74 Years | 212 (14.3%) | 194 (11.5%) |
| 75 Years and over | 399 (39.9%) | 635 (50.8%) |
Disability Class by Sex by Age in Franklin Square
Disability Class: Hearing Difficulty
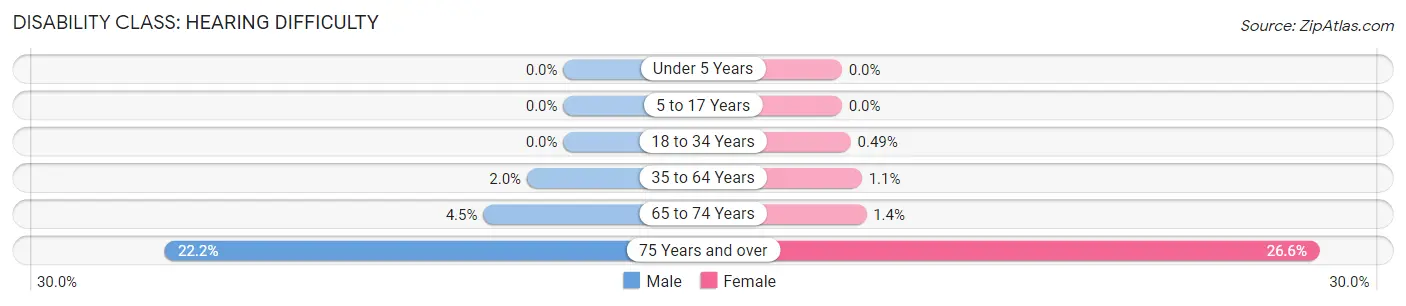
| Age Bracket | Male | Female |
| Under 5 Years | 0 (0.0%) | 0 (0.0%) |
| 5 to 17 Years | 0 (0.0%) | 0 (0.0%) |
| 18 to 34 Years | 0 (0.0%) | 18 (0.5%) |
| 35 to 64 Years | 126 (2.0%) | 71 (1.1%) |
| 65 to 74 Years | 66 (4.5%) | 23 (1.4%) |
| 75 Years and over | 222 (22.2%) | 332 (26.6%) |
Disability Class: Vision Difficulty
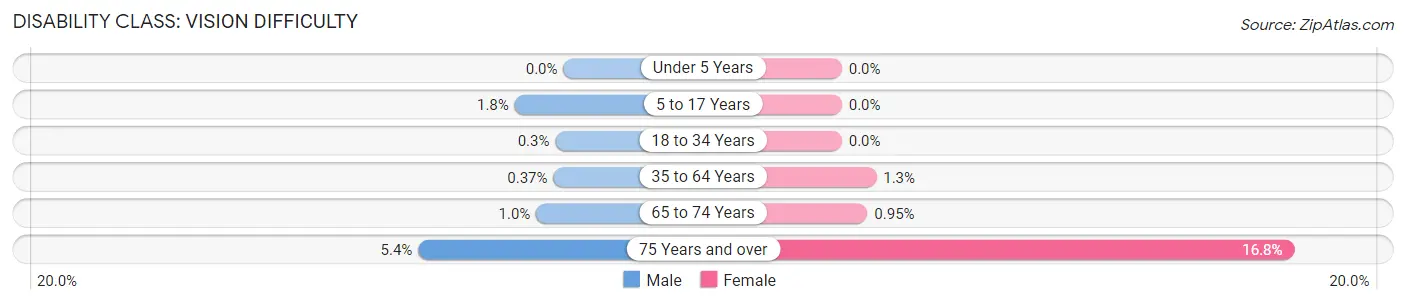
| Age Bracket | Male | Female |
| Under 5 Years | 0 (0.0%) | 0 (0.0%) |
| 5 to 17 Years | 40 (1.8%) | 0 (0.0%) |
| 18 to 34 Years | 11 (0.3%) | 0 (0.0%) |
| 35 to 64 Years | 23 (0.4%) | 82 (1.3%) |
| 65 to 74 Years | 15 (1.0%) | 16 (0.9%) |
| 75 Years and over | 54 (5.4%) | 210 (16.8%) |
Disability Class: Cognitive Difficulty
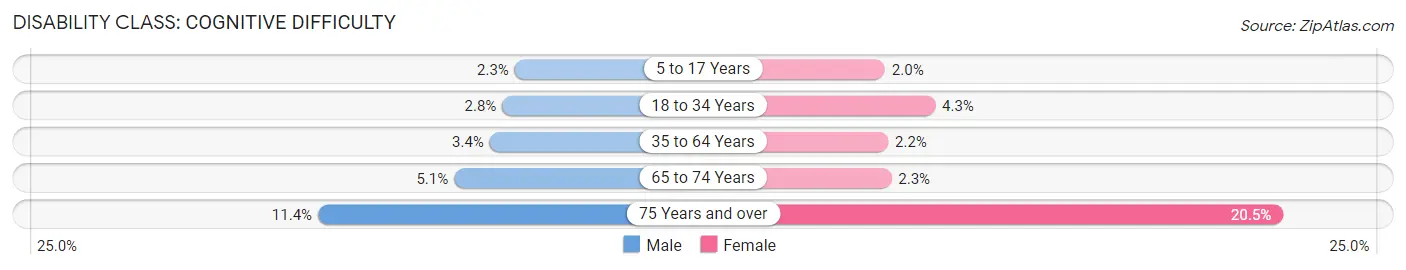
| Age Bracket | Male | Female |
| 5 to 17 Years | 50 (2.3%) | 54 (2.0%) |
| 18 to 34 Years | 104 (2.8%) | 160 (4.3%) |
| 35 to 64 Years | 212 (3.4%) | 138 (2.1%) |
| 65 to 74 Years | 75 (5.1%) | 39 (2.3%) |
| 75 Years and over | 114 (11.4%) | 256 (20.5%) |
Disability Class: Ambulatory Difficulty
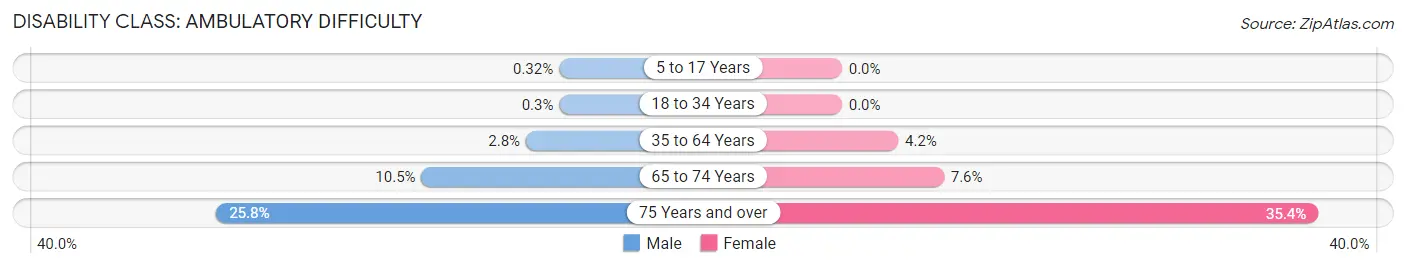
| Age Bracket | Male | Female |
| 5 to 17 Years | 7 (0.3%) | 0 (0.0%) |
| 18 to 34 Years | 11 (0.3%) | 0 (0.0%) |
| 35 to 64 Years | 172 (2.8%) | 268 (4.2%) |
| 65 to 74 Years | 156 (10.5%) | 128 (7.6%) |
| 75 Years and over | 258 (25.8%) | 442 (35.4%) |
Disability Class: Self-Care Difficulty
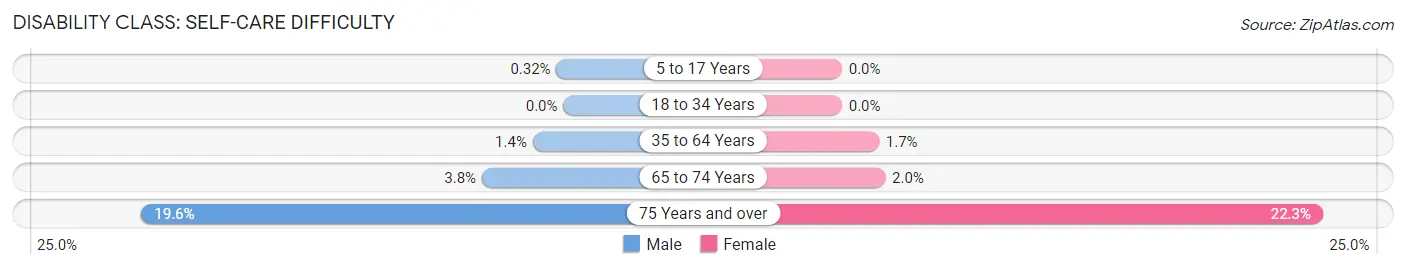
| Age Bracket | Male | Female |
| 5 to 17 Years | 7 (0.3%) | 0 (0.0%) |
| 18 to 34 Years | 0 (0.0%) | 0 (0.0%) |
| 35 to 64 Years | 88 (1.4%) | 110 (1.7%) |
| 65 to 74 Years | 56 (3.8%) | 34 (2.0%) |
| 75 Years and over | 196 (19.6%) | 279 (22.3%) |
Technology Access in Franklin Square
Computing Device Access in Franklin Square
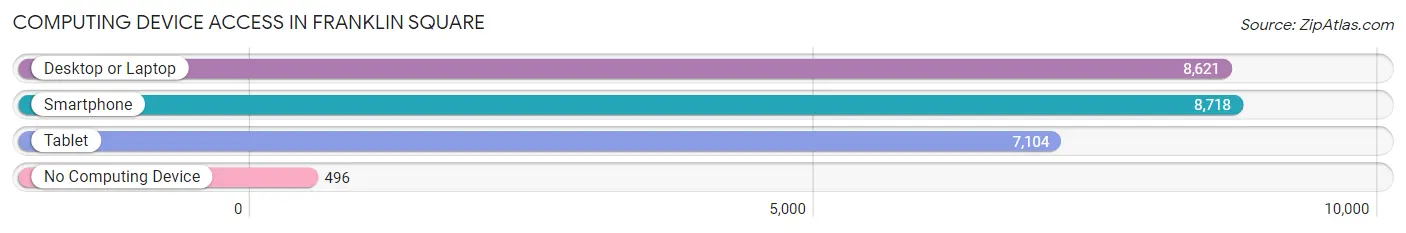
| Device Type | # Households | % Households |
| Desktop or Laptop | 8,621 | 87.9% |
| Smartphone | 8,718 | 88.9% |
| Tablet | 7,104 | 72.4% |
| No Computing Device | 496 | 5.1% |
| Total | 9,809 | 100.0% |
Internet Access in Franklin Square
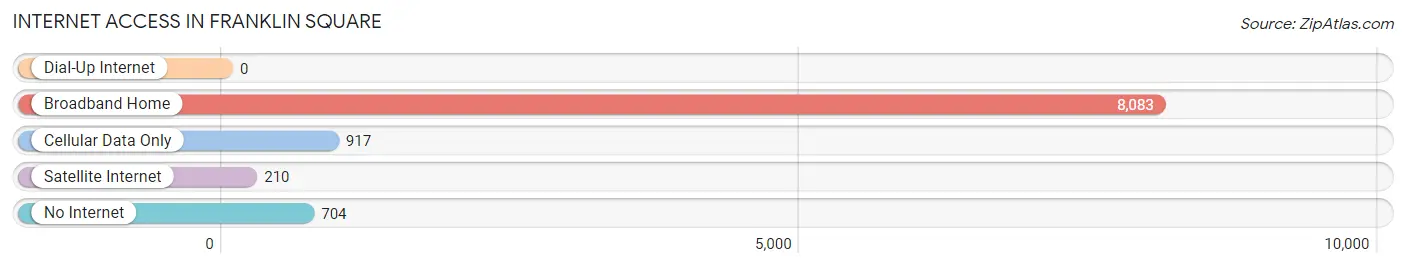
| Internet Type | # Households | % Households |
| Dial-Up Internet | 0 | 0.0% |
| Broadband Home | 8,083 | 82.4% |
| Cellular Data Only | 917 | 9.3% |
| Satellite Internet | 210 | 2.1% |
| No Internet | 704 | 7.2% |
| Total | 9,809 | 100.0% |
Franklin Square Summary
Franklin Square is a hamlet and census-designated place (CDP) located in the Town of Hempstead in Nassau County, New York, United States. The population was 32,783 at the 2010 census.
History
Franklin Square was originally part of the Hempstead Plains, a large area of flat, treeless land that was used by the Native Americans for hunting and fishing. The area was first settled by Europeans in 1644, when Thomas Hicks, a Quaker, purchased land from the local Native Americans. The area was named after Benjamin Franklin, who was a popular figure at the time.
In the late 19th century, Franklin Square became a popular summer resort for wealthy New Yorkers. The area was known for its large estates and grand homes. In the early 20th century, the area began to be developed for residential use.
Geography
Franklin Square is located at 40°41'17" North, 73°41'17" West (40.688, -73.688). According to the United States Census Bureau, the CDP has a total area of 4.2 square miles (10.8 km2), all land.
Economy
Franklin Square is a primarily residential community, with a few small businesses located in the area. The largest employer in the area is the Franklin Square School District, which employs over 1,000 people. Other employers include the Franklin Square Public Library, the Franklin Square Post Office, and several small retail stores.
Demographics
As of the census of 2000, there were 32,783 people, 11,845 households, and 8,717 families residing in the CDP. The population density was 7,817.3 people per square mile (3,019.2/km2). There were 12,093 housing units at an average density of 2,890.3/sq mi (1,118.2/km2). The racial makeup of the CDP was 79.2% White, 8.2% African American, 0.2% Native American, 6.3% Asian, 0.1% Pacific Islander, 3.2% from other races, and 2.9% from two or more races. Hispanic or Latino of any race were 11.2% of the population.
There were 11,845 households, out of which 33.2% had children under the age of 18 living with them, 56.2% were married couples living together, 11.7% had a female householder with no husband present, and 27.3% were non-families. 22.2% of all households were made up of individuals, and 9.7% had someone living alone who was 65 years of age or older. The average household size was 2.75 and the average family size was 3.25.
In the CDP, the population was spread out, with 23.7% under the age of 18, 7.2% from 18 to 24, 31.2% from 25 to 44, 22.7% from 45 to 64, and 15.2% who were 65 years of age or older. The median age was 38 years. For every 100 females, there were 94.2 males. For every 100 females age 18 and over, there were 90.7 males.
The median income for a household in the CDP was $62,845, and the median income for a family was $71,945. Males had a median income of $45,945 versus $35,945 for females. The per capita income for the CDP was $25,945. About 3.2% of families and 4.7% of the population were below the poverty line, including 5.2% of those under age 18 and 5.2% of those age 65 or over.
Common Questions
What is the Total Population of Franklin Square?
Total Population of Franklin Square is 31,969.
What is the Total Male Population of Franklin Square?
Total Male Population of Franklin Square is 15,467.
What is the Total Female Population of Franklin Square?
Total Female Population of Franklin Square is 16,502.
What is the Ratio of Males per 100 Females in Franklin Square?
There are 93.73 Males per 100 Females in Franklin Square.
What is the Ratio of Females per 100 Males in Franklin Square?
There are 106.69 Females per 100 Males in Franklin Square.
What is the Median Population Age in Franklin Square?
Median Population Age in Franklin Square is 40.7 Years.
What is the Average Family Size in Franklin Square
Average Family Size in Franklin Square is 3.6 People.
What is the Average Household Size in Franklin Square
Average Household Size in Franklin Square is 3.2 People.
What is Per Capita Income in Franklin Square?
Per Capita income in Franklin Square is $48,801.
What is the Median Family Income in Franklin Square?
Median Family Income in Franklin Square is $145,535.
What is the Median Household income in Franklin Square?
Median Household Income in Franklin Square is $136,225.
What is Income or Wage Gap in Franklin Square?
Income or Wage Gap in Franklin Square is 32.4%.
Women in Franklin Square earn 67.6 cents for every dollar earned by a man.
What is Inequality or Gini Index in Franklin Square?
Inequality or Gini Index in Franklin Square is 0.38.
How Large is the Labor Force in Franklin Square?
There are 17,871 People in the Labor Forcein in Franklin Square.
What is the Percentage of People in the Labor Force in Franklin Square?
67.7% of People are in the Labor Force in Franklin Square.
What is the Unemployment Rate in Franklin Square?
Unemployment Rate in Franklin Square is 3.9%.