Cities with the Most Immigrants from Panama in New York
RELATED REPORTS & OPTIONS
Panama
New York
Compare Cities
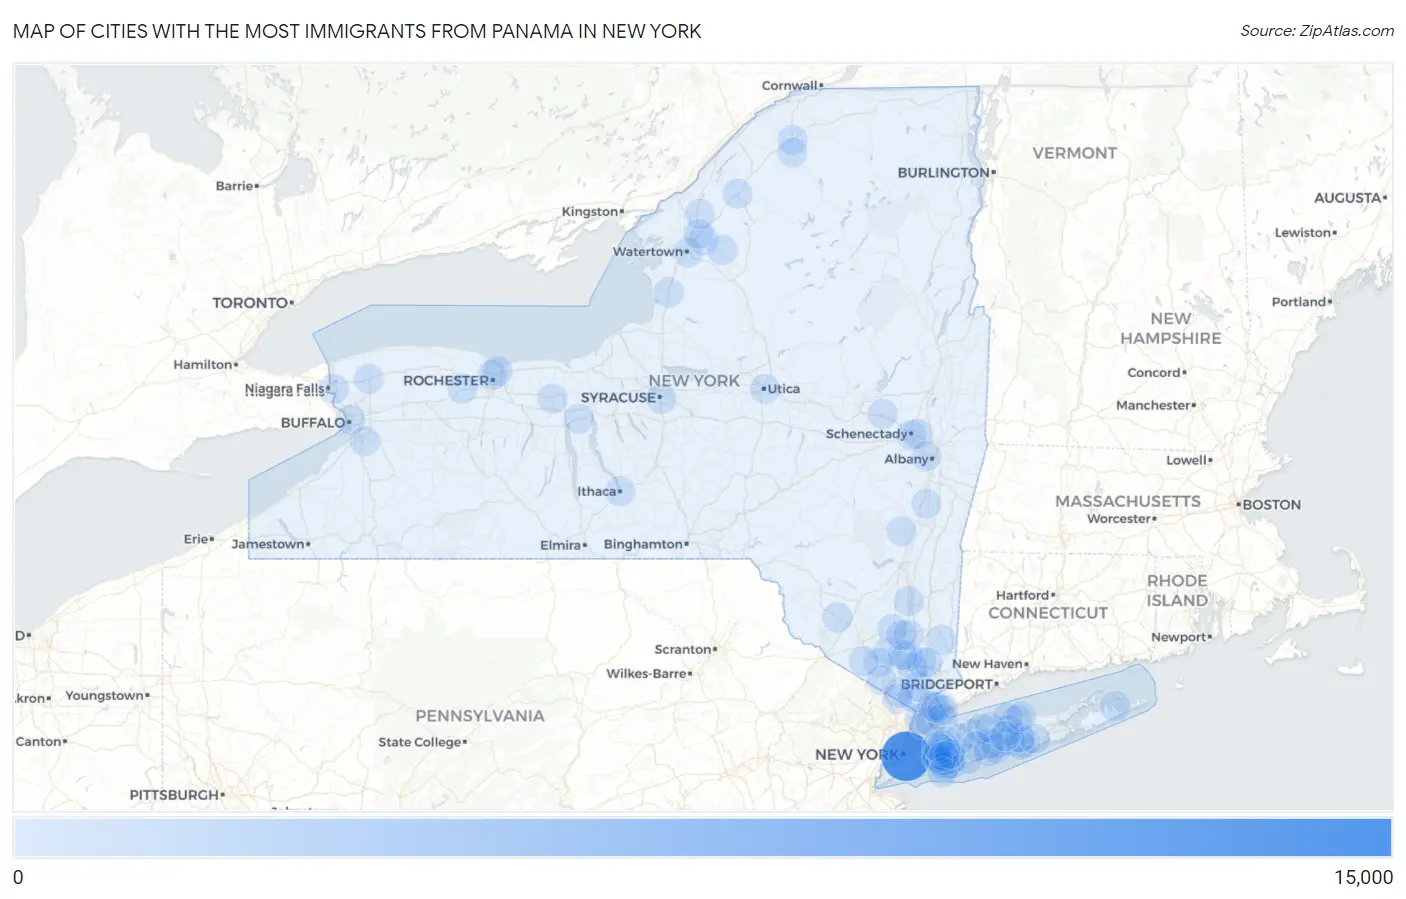
Map of Cities with the Most Immigrants from Panama in New York
0
15,000
Cities with the Most Immigrants from Panama in New York
| City | Panama | vs State | vs National | |
| 1. | New York | 14,179 | 18,218(77.83%)#1 | 105,274(13.47%)#1 |
| 2. | Freeport | 346 | 18,218(1.90%)#2 | 105,274(0.33%)#27 |
| 3. | Yonkers | 274 | 18,218(1.50%)#3 | 105,274(0.26%)#40 |
| 4. | Mount Vernon | 256 | 18,218(1.41%)#4 | 105,274(0.24%)#43 |
| 5. | Nyack | 235 | 18,218(1.29%)#5 | 105,274(0.22%)#50 |
| 6. | North Bellport | 157 | 18,218(0.86%)#6 | 105,274(0.15%)#92 |
| 7. | Hempstead | 78 | 18,218(0.43%)#7 | 105,274(0.07%)#221 |
| 8. | Rochester | 73 | 18,218(0.40%)#8 | 105,274(0.07%)#240 |
| 9. | Baldwin | 73 | 18,218(0.40%)#9 | 105,274(0.07%)#245 |
| 10. | Ossining | 68 | 18,218(0.37%)#10 | 105,274(0.06%)#271 |
| 11. | Highland Falls | 62 | 18,218(0.34%)#11 | 105,274(0.06%)#304 |
| 12. | Peekskill | 59 | 18,218(0.32%)#12 | 105,274(0.06%)#316 |
| 13. | Roosevelt | 59 | 18,218(0.32%)#13 | 105,274(0.06%)#318 |
| 14. | Huntington Station | 58 | 18,218(0.32%)#14 | 105,274(0.06%)#324 |
| 15. | Rye Brook | 58 | 18,218(0.32%)#15 | 105,274(0.06%)#325 |
| 16. | Mineola | 55 | 18,218(0.30%)#16 | 105,274(0.05%)#345 |
| 17. | Lake Mohegan | 55 | 18,218(0.30%)#17 | 105,274(0.05%)#349 |
| 18. | Syracuse | 54 | 18,218(0.30%)#18 | 105,274(0.05%)#351 |
| 19. | Mountain Lodge Park | 54 | 18,218(0.30%)#19 | 105,274(0.05%)#358 |
| 20. | Buffalo | 53 | 18,218(0.29%)#20 | 105,274(0.05%)#360 |
| 21. | Fort Drum | 52 | 18,218(0.29%)#21 | 105,274(0.05%)#368 |
| 22. | Central Islip | 49 | 18,218(0.27%)#22 | 105,274(0.05%)#390 |
| 23. | New Rochelle | 47 | 18,218(0.26%)#23 | 105,274(0.04%)#404 |
| 24. | Rye | 44 | 18,218(0.24%)#24 | 105,274(0.04%)#441 |
| 25. | White Plains | 43 | 18,218(0.24%)#25 | 105,274(0.04%)#442 |
| 26. | Brentwood | 41 | 18,218(0.23%)#26 | 105,274(0.04%)#455 |
| 27. | Holbrook | 41 | 18,218(0.23%)#27 | 105,274(0.04%)#459 |
| 28. | Newark | 37 | 18,218(0.20%)#28 | 105,274(0.04%)#502 |
| 29. | East Patchogue | 36 | 18,218(0.20%)#29 | 105,274(0.03%)#507 |
| 30. | East Hills | 36 | 18,218(0.20%)#30 | 105,274(0.03%)#509 |
| 31. | Carthage | 34 | 18,218(0.19%)#31 | 105,274(0.03%)#528 |
| 32. | Palenville | 34 | 18,218(0.19%)#32 | 105,274(0.03%)#529 |
| 33. | Niagara Falls | 33 | 18,218(0.18%)#33 | 105,274(0.03%)#534 |
| 34. | Elmont | 31 | 18,218(0.17%)#34 | 105,274(0.03%)#561 |
| 35. | Beacon | 31 | 18,218(0.17%)#35 | 105,274(0.03%)#568 |
| 36. | Bay Shore | 30 | 18,218(0.16%)#36 | 105,274(0.03%)#582 |
| 37. | Orange Lake | 29 | 18,218(0.16%)#37 | 105,274(0.03%)#606 |
| 38. | Lynbrook | 27 | 18,218(0.15%)#38 | 105,274(0.03%)#640 |
| 39. | Springs | 27 | 18,218(0.15%)#39 | 105,274(0.03%)#648 |
| 40. | Mastic | 26 | 18,218(0.14%)#40 | 105,274(0.02%)#666 |
| 41. | Searingtown | 24 | 18,218(0.13%)#41 | 105,274(0.02%)#722 |
| 42. | Amsterdam | 23 | 18,218(0.13%)#42 | 105,274(0.02%)#743 |
| 43. | Gouverneur | 23 | 18,218(0.13%)#43 | 105,274(0.02%)#751 |
| 44. | Schenectady | 21 | 18,218(0.12%)#44 | 105,274(0.02%)#780 |
| 45. | West Point | 21 | 18,218(0.12%)#45 | 105,274(0.02%)#799 |
| 46. | Irondequoit | 20 | 18,218(0.11%)#46 | 105,274(0.02%)#808 |
| 47. | Ithaca | 19 | 18,218(0.10%)#47 | 105,274(0.02%)#839 |
| 48. | Rockville Centre | 19 | 18,218(0.10%)#48 | 105,274(0.02%)#842 |
| 49. | Mount Sinai | 19 | 18,218(0.10%)#49 | 105,274(0.02%)#848 |
| 50. | Malverne | 19 | 18,218(0.10%)#50 | 105,274(0.02%)#851 |
| 51. | Medford | 17 | 18,218(0.09%)#51 | 105,274(0.02%)#899 |
| 52. | Garden City | 17 | 18,218(0.09%)#52 | 105,274(0.02%)#900 |
| 53. | Niskayuna | 17 | 18,218(0.09%)#53 | 105,274(0.02%)#902 |
| 54. | East Northport | 17 | 18,218(0.09%)#54 | 105,274(0.02%)#903 |
| 55. | Utica | 16 | 18,218(0.09%)#55 | 105,274(0.02%)#927 |
| 56. | Lake Carmel | 16 | 18,218(0.09%)#56 | 105,274(0.02%)#942 |
| 57. | Walton Park | 16 | 18,218(0.09%)#57 | 105,274(0.02%)#946 |
| 58. | Albany | 15 | 18,218(0.08%)#58 | 105,274(0.01%)#951 |
| 59. | Centereach | 15 | 18,218(0.08%)#59 | 105,274(0.01%)#960 |
| 60. | Harrison | 15 | 18,218(0.08%)#60 | 105,274(0.01%)#962 |
| 61. | Watertown | 15 | 18,218(0.08%)#61 | 105,274(0.01%)#965 |
| 62. | Spring Valley | 14 | 18,218(0.08%)#62 | 105,274(0.01%)#995 |
| 63. | Islip Terrace | 14 | 18,218(0.08%)#63 | 105,274(0.01%)#1,013 |
| 64. | Oceanside | 13 | 18,218(0.07%)#64 | 105,274(0.01%)#1,033 |
| 65. | Newburgh | 13 | 18,218(0.07%)#65 | 105,274(0.01%)#1,035 |
| 66. | East Massapequa | 13 | 18,218(0.07%)#66 | 105,274(0.01%)#1,040 |
| 67. | Syosset | 13 | 18,218(0.07%)#67 | 105,274(0.01%)#1,042 |
| 68. | Waterloo | 13 | 18,218(0.07%)#68 | 105,274(0.01%)#1,059 |
| 69. | Lockport | 12 | 18,218(0.07%)#69 | 105,274(0.01%)#1,088 |
| 70. | North Valley Stream | 12 | 18,218(0.07%)#70 | 105,274(0.01%)#1,090 |
| 71. | North New Hyde Park | 11 | 18,218(0.06%)#71 | 105,274(0.01%)#1,144 |
| 72. | Tuxedo Park | 11 | 18,218(0.06%)#72 | 105,274(0.01%)#1,161 |
| 73. | Wheatley Heights | 10 | 18,218(0.05%)#73 | 105,274(0.01%)#1,198 |
| 74. | Jefferson Valley Yorktown | 8 | 18,218(0.04%)#74 | 105,274(0.01%)#1,282 |
| 75. | Orchard Park | 8 | 18,218(0.04%)#75 | 105,274(0.01%)#1,298 |
| 76. | Lake Success | 8 | 18,218(0.04%)#76 | 105,274(0.01%)#1,299 |
| 77. | Rock Hill | 7 | 18,218(0.04%)#77 | 105,274(0.01%)#1,361 |
| 78. | Long Beach | 6 | 18,218(0.03%)#78 | 105,274(0.01%)#1,383 |
| 79. | Fallsburg | 6 | 18,218(0.03%)#79 | 105,274(0.01%)#1,399 |
| 80. | Uniondale | 5 | 18,218(0.03%)#80 | 105,274(0.00%)#1,408 |
| 81. | West Hempstead | 5 | 18,218(0.03%)#81 | 105,274(0.00%)#1,414 |
| 82. | Port Chester | 4 | 18,218(0.02%)#82 | 105,274(0.00%)#1,457 |
| 83. | Florida | 4 | 18,218(0.02%)#83 | 105,274(0.00%)#1,470 |
| 84. | Coxsackie | 4 | 18,218(0.02%)#84 | 105,274(0.00%)#1,472 |
| 85. | Kings Park | 3 | 18,218(0.02%)#85 | 105,274(0.00%)#1,501 |
| 86. | Potsdam | 3 | 18,218(0.02%)#86 | 105,274(0.00%)#1,504 |
| 87. | Highland | 3 | 18,218(0.02%)#87 | 105,274(0.00%)#1,509 |
| 88. | Churchville | 3 | 18,218(0.02%)#88 | 105,274(0.00%)#1,518 |
| 89. | Poquott | 3 | 18,218(0.02%)#89 | 105,274(0.00%)#1,529 |
| 90. | Lake Ronkonkoma | 2 | 18,218(0.01%)#90 | 105,274(0.00%)#1,547 |
| 91. | Sound Beach | 2 | 18,218(0.01%)#91 | 105,274(0.00%)#1,551 |
| 92. | Theresa | 2 | 18,218(0.01%)#92 | 105,274(0.00%)#1,560 |
| 93. | Hannawa Falls | 2 | 18,218(0.01%)#93 | 105,274(0.00%)#1,562 |
| 94. | Evans Mills | 2 | 18,218(0.01%)#94 | 105,274(0.00%)#1,571 |
| 95. | Chestnut Ridge | 1 | 18,218(0.01%)#95 | 105,274(0.00%)#1,586 |
| 96. | Mannsville | 1 | 18,218(0.01%)#96 | 105,274(0.00%)#1,608 |
Common Questions
What are the Top 10 Cities with the Most Immigrants from Panama in New York?
Top 10 Cities with the Most Immigrants from Panama in New York are:
#1
14,179
#2
346
#3
274
#4
256
#5
235
#6
157
#7
78
#8
73
#9
73
#10
68
What city has the Most Immigrants from Panama in New York?
New York has the Most Immigrants from Panama in New York with 14,179.
What is the Total Immigrants from Panama in the State of New York?
Total Immigrants from Panama in New York is 18,218.
What is the Total Immigrants from Panama in the United States?
Total Immigrants from Panama in the United States is 105,274.