Cities with the Highest Percentage of Immigrants from Lebanon in New York
RELATED REPORTS & OPTIONS
Lebanon
New York
Compare Cities
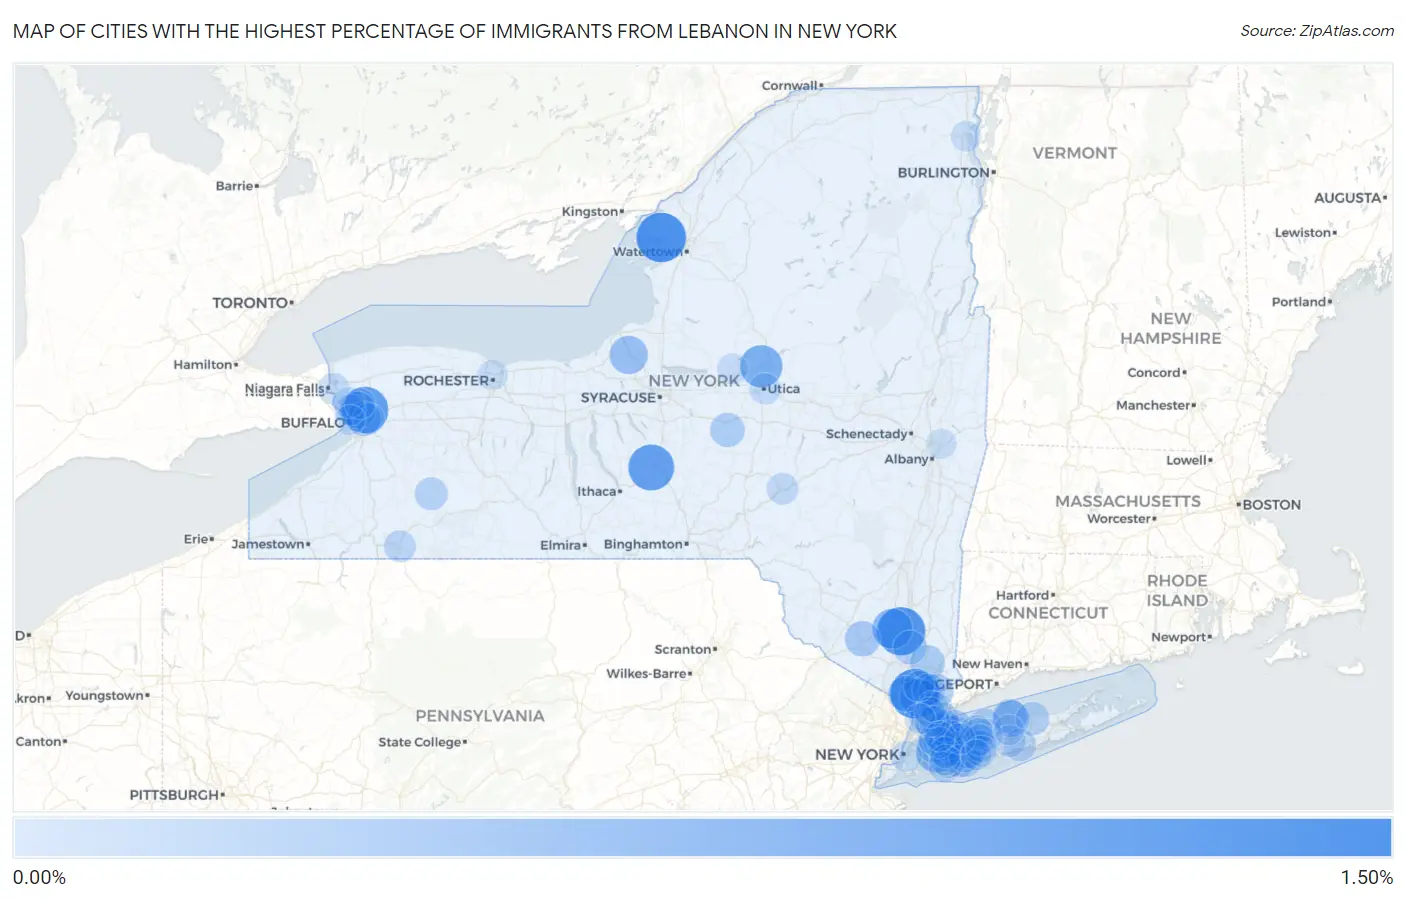
Map of Cities with the Highest Percentage of Immigrants from Lebanon in New York
0.00%
1.50%
Cities with the Highest Percentage of Immigrants from Lebanon in New York
| City | Lebanon | vs State | vs National | |
| 1. | Upper Nyack | 1.17% | 0.040%(+1.13)#158 | 0.040%(+1.13)#840 |
| 2. | Chaumont | 1.17% | 0.040%(+1.13)#159 | 0.040%(+1.13)#841 |
| 3. | Balmville | 1.08% | 0.040%(+1.04)#160 | 0.040%(+1.04)#842 |
| 4. | Williamsville | 0.98% | 0.040%(+0.939)#161 | 0.040%(+0.939)#843 |
| 5. | Cortland West | 0.94% | 0.040%(+0.902)#162 | 0.040%(+0.902)#844 |
| 6. | Holland Patent | 0.72% | 0.040%(+0.679)#163 | 0.040%(+0.679)#845 |
| 7. | Old Bethpage | 0.64% | 0.040%(+0.600)#164 | 0.040%(+0.600)#846 |
| 8. | Bellerose | 0.60% | 0.040%(+0.560)#165 | 0.040%(+0.560)#847 |
| 9. | Orange Lake | 0.59% | 0.040%(+0.546)#166 | 0.040%(+0.546)#848 |
| 10. | Sea Cliff | 0.55% | 0.040%(+0.513)#167 | 0.040%(+0.513)#849 |
| 11. | Latham | 0.55% | 0.040%(+0.509)#168 | 0.040%(+0.509)#850 |
| 12. | Sleepy Hollow | 0.50% | 0.040%(+0.460)#169 | 0.040%(+0.460)#851 |
| 13. | Fulton | 0.47% | 0.040%(+0.434)#170 | 0.040%(+0.434)#852 |
| 14. | De Witt | 0.43% | 0.040%(+0.386)#171 | 0.040%(+0.386)#853 |
| 15. | Eggertsville | 0.38% | 0.040%(+0.338)#172 | 0.040%(+0.338)#854 |
| 16. | Upper Brookville | 0.37% | 0.040%(+0.332)#173 | 0.040%(+0.332)#855 |
| 17. | University Gardens | 0.36% | 0.040%(+0.319)#174 | 0.040%(+0.319)#856 |
| 18. | Bardonia | 0.34% | 0.040%(+0.302)#175 | 0.040%(+0.302)#857 |
| 19. | Port Jefferson | 0.34% | 0.040%(+0.298)#176 | 0.040%(+0.298)#858 |
| 20. | Loudonville | 0.32% | 0.040%(+0.275)#177 | 0.040%(+0.275)#859 |
| 21. | Scotchtown | 0.31% | 0.040%(+0.269)#178 | 0.040%(+0.269)#860 |
| 22. | Mineola | 0.29% | 0.040%(+0.246)#179 | 0.040%(+0.246)#861 |
| 23. | Jefferson Valley Yorktown | 0.28% | 0.040%(+0.237)#180 | 0.040%(+0.237)#862 |
| 24. | Armonk | 0.27% | 0.040%(+0.234)#181 | 0.040%(+0.234)#863 |
| 25. | Mill Neck | 0.27% | 0.040%(+0.231)#182 | 0.040%(+0.231)#864 |
| 26. | Brookville | 0.27% | 0.040%(+0.228)#183 | 0.040%(+0.228)#865 |
| 27. | Melville | 0.26% | 0.040%(+0.219)#184 | 0.040%(+0.219)#866 |
| 28. | Hamilton | 0.26% | 0.040%(+0.217)#185 | 0.040%(+0.217)#867 |
| 29. | Cheektowaga | 0.25% | 0.040%(+0.214)#186 | 0.040%(+0.213)#908 |
| 30. | Belle Terre | 0.25% | 0.040%(+0.206)#187 | 0.040%(+0.206)#909 |
| 31. | Salisbury | 0.24% | 0.040%(+0.201)#188 | 0.040%(+0.201)#910 |
| 32. | Massapequa | 0.22% | 0.040%(+0.184)#189 | 0.040%(+0.184)#911 |
| 33. | Cold Spring | 0.22% | 0.040%(+0.177)#190 | 0.040%(+0.177)#912 |
| 34. | Setauket | 0.21% | 0.040%(+0.174)#191 | 0.040%(+0.174)#913 |
| 35. | Larchmont | 0.20% | 0.040%(+0.158)#192 | 0.040%(+0.158)#914 |
| 36. | East Shoreham | 0.19% | 0.040%(+0.150)#193 | 0.040%(+0.150)#915 |
| 37. | Roslyn Heights | 0.17% | 0.040%(+0.133)#194 | 0.040%(+0.133)#916 |
| 38. | Houghton | 0.17% | 0.040%(+0.129)#195 | 0.040%(+0.129)#917 |
| 39. | East Setauket | 0.17% | 0.040%(+0.126)#196 | 0.040%(+0.126)#918 |
| 40. | Eastchester | 0.16% | 0.040%(+0.125)#197 | 0.040%(+0.125)#919 |
| 41. | Pleasantville | 0.16% | 0.040%(+0.121)#198 | 0.040%(+0.121)#920 |
| 42. | Old Westbury | 0.16% | 0.040%(+0.119)#199 | 0.040%(+0.119)#921 |
| 43. | Fort Salonga | 0.15% | 0.040%(+0.112)#200 | 0.040%(+0.112)#922 |
| 44. | Rye | 0.15% | 0.040%(+0.112)#201 | 0.040%(+0.112)#923 |
| 45. | East Patchogue | 0.14% | 0.040%(+0.100)#202 | 0.040%(+0.100)#924 |
| 46. | Oceanside | 0.14% | 0.040%(+0.096)#203 | 0.040%(+0.096)#925 |
| 47. | Commack | 0.12% | 0.040%(+0.083)#204 | 0.040%(+0.083)#999 |
| 48. | Wantagh | 0.12% | 0.040%(+0.082)#205 | 0.040%(+0.082)#1,000 |
| 49. | North Massapequa | 0.12% | 0.040%(+0.081)#206 | 0.040%(+0.081)#1,001 |
| 50. | Great Neck | 0.12% | 0.040%(+0.077)#207 | 0.040%(+0.077)#1,002 |
| 51. | Greenlawn | 0.11% | 0.040%(+0.072)#208 | 0.040%(+0.072)#1,003 |
| 52. | Old Brookville | 0.11% | 0.040%(+0.069)#209 | 0.040%(+0.069)#1,004 |
| 53. | Olean | 0.11% | 0.040%(+0.068)#210 | 0.040%(+0.068)#1,005 |
| 54. | Glen Cove | 0.11% | 0.040%(+0.066)#211 | 0.040%(+0.066)#1,006 |
| 55. | Holbrook | 0.11% | 0.040%(+0.066)#212 | 0.040%(+0.066)#1,007 |
| 56. | Oneonta | 0.092% | 0.040%(+0.052)#213 | 0.040%(+0.052)#1,008 |
| 57. | Deer Park | 0.092% | 0.040%(+0.051)#214 | 0.040%(+0.051)#1,009 |
| 58. | Harrison | 0.084% | 0.040%(+0.043)#215 | 0.040%(+0.043)#1,010 |
| 59. | Niagara Falls | 0.082% | 0.040%(+0.042)#216 | 0.040%(+0.042)#1,011 |
| 60. | Elwood | 0.081% | 0.040%(+0.041)#217 | 0.040%(+0.041)#1,056 |
| 61. | Utica | 0.079% | 0.040%(+0.039)#218 | 0.040%(+0.039)#1,057 |
| 62. | Manhasset | 0.078% | 0.040%(+0.038)#219 | 0.040%(+0.038)#1,058 |
| 63. | Dix Hills | 0.077% | 0.040%(+0.037)#220 | 0.040%(+0.037)#1,059 |
| 64. | Depew | 0.073% | 0.040%(+0.033)#221 | 0.040%(+0.032)#1,060 |
| 65. | Baldwin | 0.068% | 0.040%(+0.028)#222 | 0.040%(+0.028)#1,061 |
| 66. | New Rochelle | 0.068% | 0.040%(+0.028)#223 | 0.040%(+0.028)#1,062 |
| 67. | Mamaroneck | 0.060% | 0.040%(+0.020)#224 | 0.040%(+0.020)#1,063 |
| 68. | Kenmore | 0.059% | 0.040%(+0.019)#225 | 0.040%(+0.019)#1,064 |
| 69. | New York | 0.055% | 0.040%(+0.014)#226 | 0.040%(+0.014)#1,065 |
| 70. | Garden City | 0.052% | 0.040%(+0.012)#227 | 0.040%(+0.012)#1,066 |
| 71. | North Babylon | 0.049% | 0.040%(+0.009)#228 | 0.040%(+0.009)#1,067 |
| 72. | Syosset | 0.043% | 0.040%(+0.002)#229 | 0.040%(+0.002)#1,068 |
| 73. | Rome | 0.041% | 0.040%(+0.000)#230 | 0.040%(+0.000)#1,069 |
| 74. | Plattsburgh | 0.035% | 0.040%(-0.005)#231 | 0.040%(-0.005)#1,070 |
| 75. | Tonawanda | 0.035% | 0.040%(-0.005)#232 | 0.040%(-0.005)#1,071 |
| 76. | Rockville Centre | 0.035% | 0.040%(-0.005)#233 | 0.040%(-0.005)#1,072 |
| 77. | Scarsdale | 0.033% | 0.040%(-0.007)#234 | 0.040%(-0.007)#1,073 |
| 78. | University At Buffalo | 0.032% | 0.040%(-0.008)#235 | 0.040%(-0.008)#1,074 |
| 79. | White Plains | 0.030% | 0.040%(-0.010)#236 | 0.040%(-0.010)#1,075 |
| 80. | Ossining | 0.026% | 0.040%(-0.014)#237 | 0.040%(-0.014)#1,076 |
| 81. | West Babylon | 0.026% | 0.040%(-0.014)#238 | 0.040%(-0.014)#1,077 |
| 82. | Yonkers | 0.019% | 0.040%(-0.022)#239 | 0.040%(-0.022)#1,078 |
| 83. | Port Washington | 0.018% | 0.040%(-0.023)#240 | 0.040%(-0.023)#1,079 |
| 84. | Centereach | 0.016% | 0.040%(-0.024)#241 | 0.040%(-0.024)#1,080 |
| 85. | Rochester | 0.014% | 0.040%(-0.026)#242 | 0.040%(-0.026)#1,210 |
| 86. | Buffalo | 0.012% | 0.040%(-0.028)#243 | 0.040%(-0.028)#1,211 |
| 87. | Troy | 0.012% | 0.040%(-0.028)#244 | 0.040%(-0.028)#1,212 |
Common Questions
What are the Top 10 Cities with the Highest Percentage of Immigrants from Lebanon in New York?
Top 10 Cities with the Highest Percentage of Immigrants from Lebanon in New York are:
#1
1.17%
#2
1.17%
#3
1.08%
#4
0.98%
#5
0.94%
#6
0.72%
#7
0.64%
#8
0.60%
#9
0.59%
#10
0.55%
What city has the Highest Percentage of Immigrants from Lebanon in New York?
Upper Nyack has the Highest Percentage of Immigrants from Lebanon in New York with 1.17%.
What is the Percentage of Immigrants from Lebanon in the State of New York?
Percentage of Immigrants from Lebanon in New York is 0.040%.
What is the Percentage of Immigrants from Lebanon in the United States?
Percentage of Immigrants from Lebanon in the United States is 0.040%.