Tannersville, NY
Tannersville Map
Tannersville Overview
466
TOTAL POPULATION
288
MALE POPULATION
178
FEMALE POPULATION
161.80
MALES / 100 FEMALES
61.81
FEMALES / 100 MALES
33.9
MEDIAN AGE
4.5
AVG FAMILY SIZE
3.3
AVG HOUSEHOLD SIZE
$30,897
PER CAPITA INCOME
$78,214
AVG FAMILY INCOME
$61,510
AVG HOUSEHOLD INCOME
31.4%
WAGE / INCOME GAP [ % ]
68.6¢/ $1
WAGE / INCOME GAP [ $ ]
0.47
INEQUALITY / GINI INDEX
207
LABOR FORCE [ PEOPLE ]
73.4%
PERCENT IN LABOR FORCE
7.7%
UNEMPLOYMENT RATE
Tannersville Zip Codes
Tannersville Area Codes
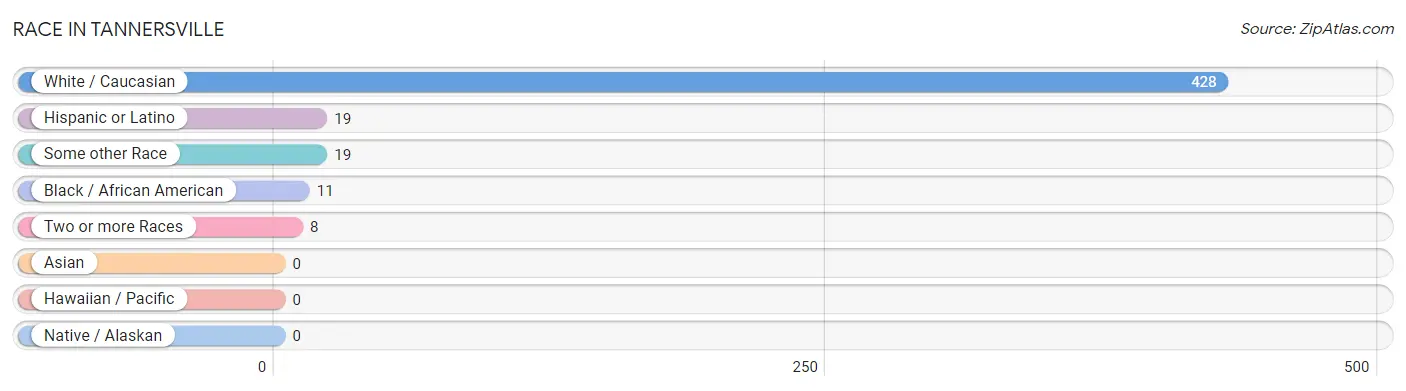
Race in Tannersville
The most populous races in Tannersville are White / Caucasian (428 | 91.8%), Hispanic or Latino (19 | 4.1%), and Some other Race (19 | 4.1%).
| Race | # Population | % Population |
| Asian | 0 | 0.0% |
| Black / African American | 11 | 2.4% |
| Hawaiian / Pacific | 0 | 0.0% |
| Hispanic or Latino | 19 | 4.1% |
| Native / Alaskan | 0 | 0.0% |
| White / Caucasian | 428 | 91.8% |
| Two or more Races | 8 | 1.7% |
| Some other Race | 19 | 4.1% |
| Total | 466 | 100.0% |
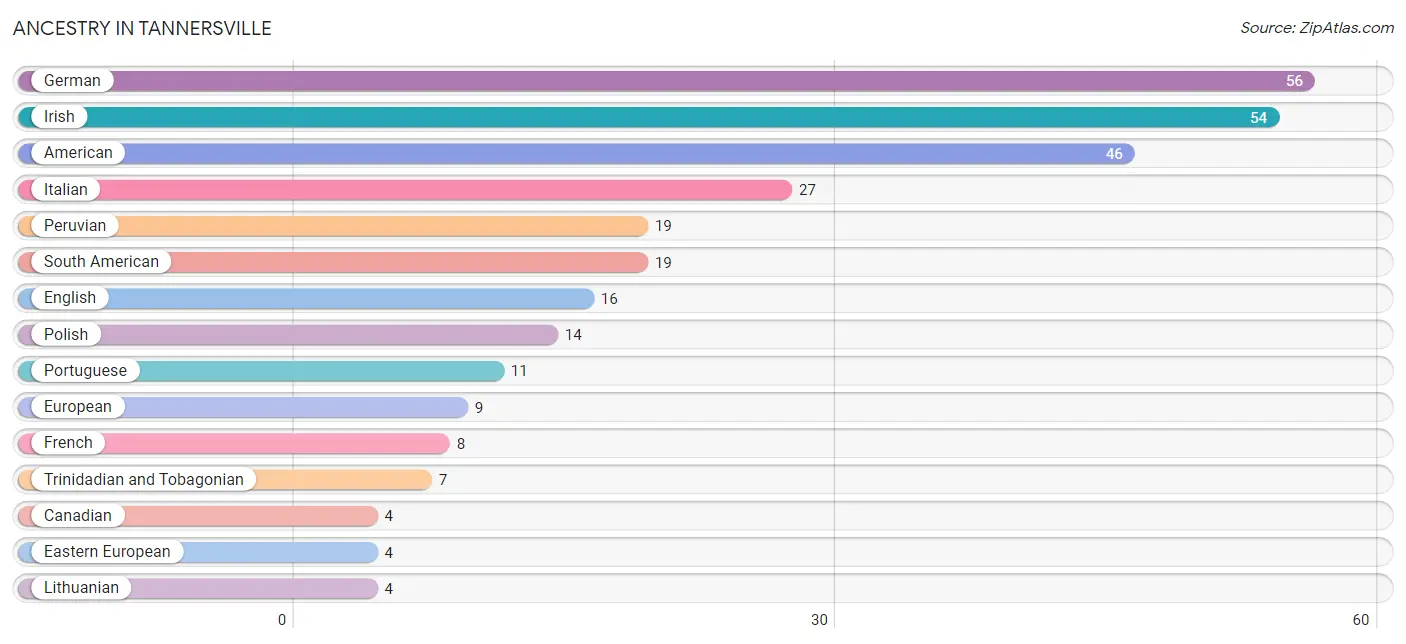
Ancestry in Tannersville
The most populous ancestries reported in Tannersville are German (56 | 12.0%), Irish (54 | 11.6%), American (46 | 9.9%), Italian (27 | 5.8%), and Peruvian (19 | 4.1%), together accounting for 43.3% of all Tannersville residents.
| Ancestry | # Population | % Population |
| American | 46 | 9.9% |
| Canadian | 4 | 0.9% |
| Dutch | 3 | 0.6% |
| Eastern European | 4 | 0.9% |
| English | 16 | 3.4% |
| European | 9 | 1.9% |
| French | 8 | 1.7% |
| German | 56 | 12.0% |
| Irish | 54 | 11.6% |
| Italian | 27 | 5.8% |
| Lithuanian | 4 | 0.9% |
| Peruvian | 19 | 4.1% |
| Polish | 14 | 3.0% |
| Portuguese | 11 | 2.4% |
| Scottish | 3 | 0.6% |
| South American | 19 | 4.1% |
| Trinidadian and Tobagonian | 7 | 1.5% | View All 17 Rows |
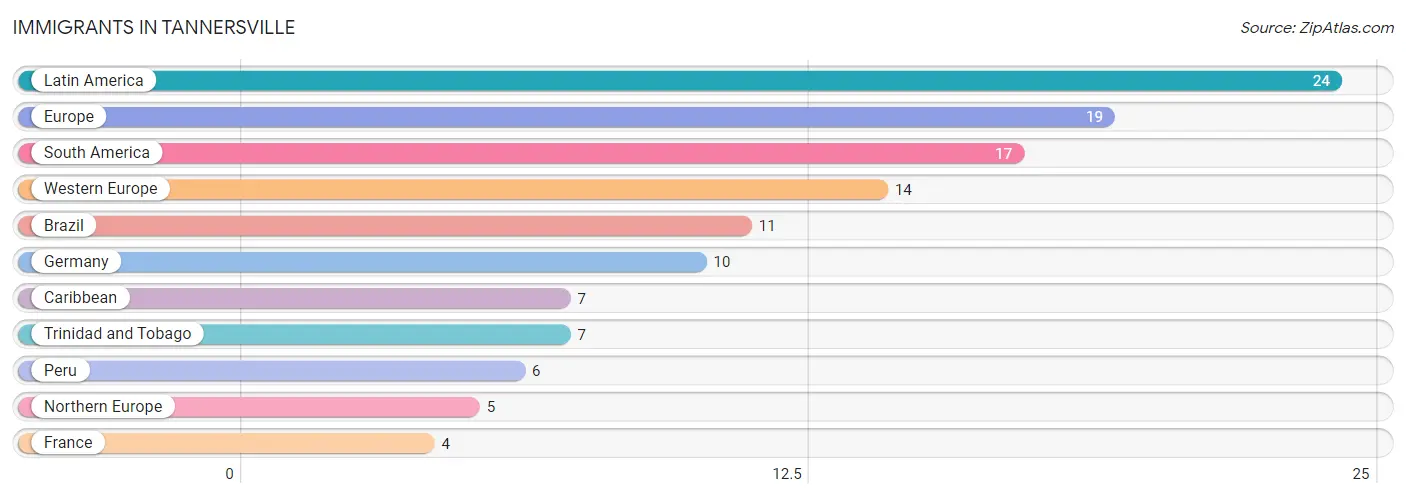
Immigrants in Tannersville
The most numerous immigrant groups reported in Tannersville came from Latin America (24 | 5.1%), Europe (19 | 4.1%), South America (17 | 3.6%), Western Europe (14 | 3.0%), and Brazil (11 | 2.4%), together accounting for 18.2% of all Tannersville residents.
| Immigration Origin | # Population | % Population |
| Brazil | 11 | 2.4% |
| Caribbean | 7 | 1.5% |
| Europe | 19 | 4.1% |
| France | 4 | 0.9% |
| Germany | 10 | 2.1% |
| Latin America | 24 | 5.1% |
| Northern Europe | 5 | 1.1% |
| Peru | 6 | 1.3% |
| South America | 17 | 3.6% |
| Trinidad and Tobago | 7 | 1.5% |
| Western Europe | 14 | 3.0% | View All 11 Rows |
Sex and Age in Tannersville
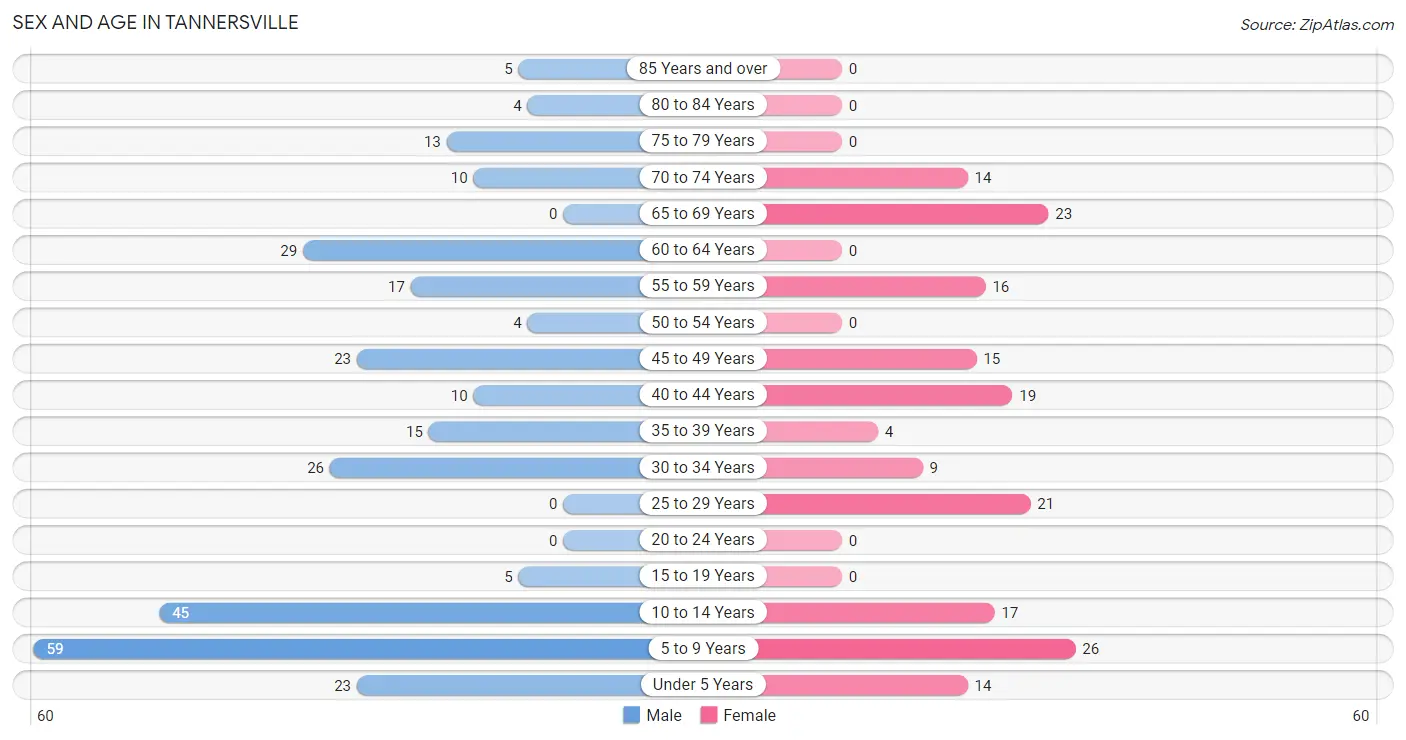
Sex and Age in Tannersville
The most populous age groups in Tannersville are 5 to 9 Years (59 | 20.5%) for men and 5 to 9 Years (26 | 14.6%) for women.
| Age Bracket | Male | Female |
| Under 5 Years | 23 (8.0%) | 14 (7.9%) |
| 5 to 9 Years | 59 (20.5%) | 26 (14.6%) |
| 10 to 14 Years | 45 (15.6%) | 17 (9.6%) |
| 15 to 19 Years | 5 (1.7%) | 0 (0.0%) |
| 20 to 24 Years | 0 (0.0%) | 0 (0.0%) |
| 25 to 29 Years | 0 (0.0%) | 21 (11.8%) |
| 30 to 34 Years | 26 (9.0%) | 9 (5.1%) |
| 35 to 39 Years | 15 (5.2%) | 4 (2.2%) |
| 40 to 44 Years | 10 (3.5%) | 19 (10.7%) |
| 45 to 49 Years | 23 (8.0%) | 15 (8.4%) |
| 50 to 54 Years | 4 (1.4%) | 0 (0.0%) |
| 55 to 59 Years | 17 (5.9%) | 16 (9.0%) |
| 60 to 64 Years | 29 (10.1%) | 0 (0.0%) |
| 65 to 69 Years | 0 (0.0%) | 23 (12.9%) |
| 70 to 74 Years | 10 (3.5%) | 14 (7.9%) |
| 75 to 79 Years | 13 (4.5%) | 0 (0.0%) |
| 80 to 84 Years | 4 (1.4%) | 0 (0.0%) |
| 85 Years and over | 5 (1.7%) | 0 (0.0%) |
| Total | 288 (100.0%) | 178 (100.0%) |
Families and Households in Tannersville
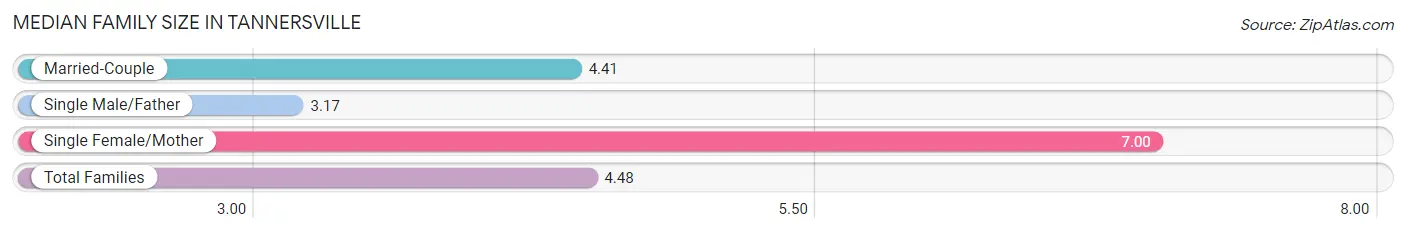
Median Family Size in Tannersville
The median family size in Tannersville is 4.48 persons per family, with single female/mother families (5 | 6.1%) accounting for the largest median family size of 7 persons per family. On the other hand, single male/father families (6 | 7.3%) represent the smallest median family size with 3.17 persons per family.
| Family Type | # Families | Family Size |
| Married-Couple | 71 (86.6%) | 4.41 |
| Single Male/Father | 6 (7.3%) | 3.17 |
| Single Female/Mother | 5 (6.1%) | 7.00 |
| Total Families | 82 (100.0%) | 4.48 |
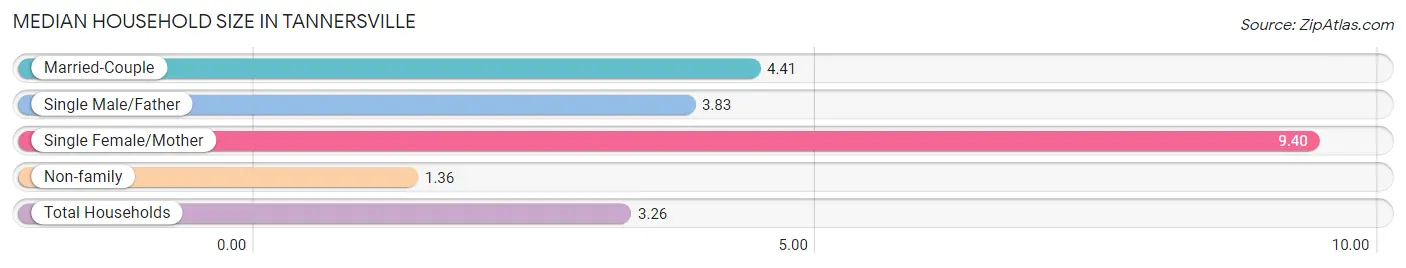
Median Household Size in Tannersville
The median household size in Tannersville is 3.26 persons per household, with single female/mother households (5 | 3.5%) accounting for the largest median household size of 9.4 persons per household. non-family households (61 | 42.7%) represent the smallest median household size with 1.36 persons per household.
| Household Type | # Households | Household Size |
| Married-Couple | 71 (49.6%) | 4.41 |
| Single Male/Father | 6 (4.2%) | 3.83 |
| Single Female/Mother | 5 (3.5%) | 9.40 |
| Non-family | 61 (42.7%) | 1.36 |
| Total Households | 143 (100.0%) | 3.26 |
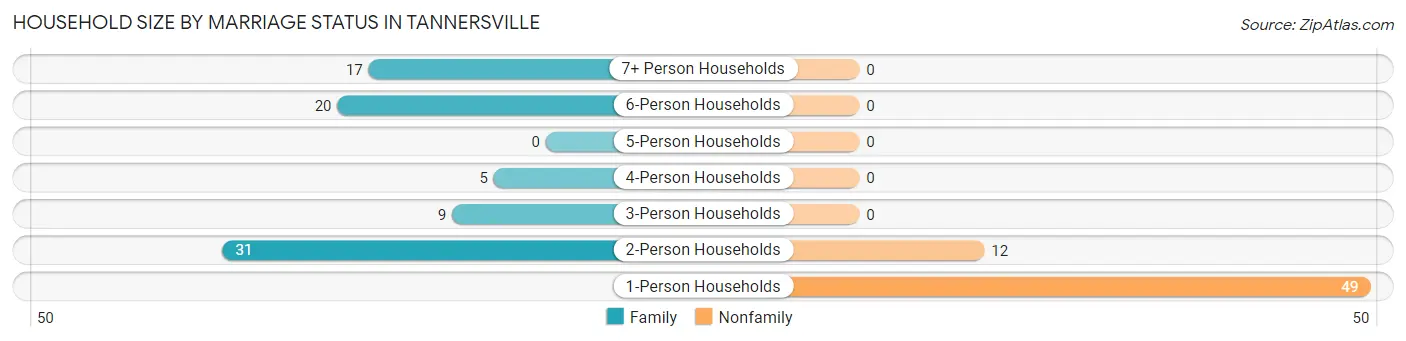
Household Size by Marriage Status in Tannersville
Out of a total of 143 households in Tannersville, 82 (57.3%) are family households, while 61 (42.7%) are nonfamily households. The most numerous type of family households are 2-person households, comprising 31, and the most common type of nonfamily households are 1-person households, comprising 49.
| Household Size | Family Households | Nonfamily Households |
| 1-Person Households | - | 49 (34.3%) |
| 2-Person Households | 31 (21.7%) | 12 (8.4%) |
| 3-Person Households | 9 (6.3%) | 0 (0.0%) |
| 4-Person Households | 5 (3.5%) | 0 (0.0%) |
| 5-Person Households | 0 (0.0%) | 0 (0.0%) |
| 6-Person Households | 20 (14.0%) | 0 (0.0%) |
| 7+ Person Households | 17 (11.9%) | 0 (0.0%) |
| Total | 82 (57.3%) | 61 (42.7%) |
Female Fertility in Tannersville
Fertility by Age in Tannersville
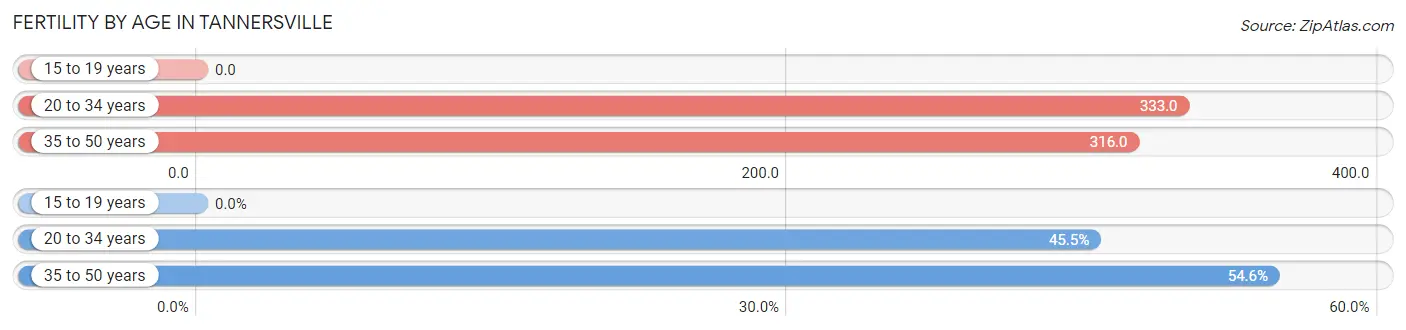
Average fertility rate in Tannersville is 324.0 births per 1,000 women. Women in the age bracket of 20 to 34 years have the highest fertility rate with 333.0 births per 1,000 women. Women in the age bracket of 35 to 50 years acount for 54.5% of all women with births.
| Age Bracket | Women with Births | Births / 1,000 Women |
| 15 to 19 years | 0 (0.0%) | 0.0 |
| 20 to 34 years | 10 (45.5%) | 333.0 |
| 35 to 50 years | 12 (54.5%) | 316.0 |
| Total | 22 (100.0%) | 324.0 |
Fertility by Age by Marriage Status in Tannersville
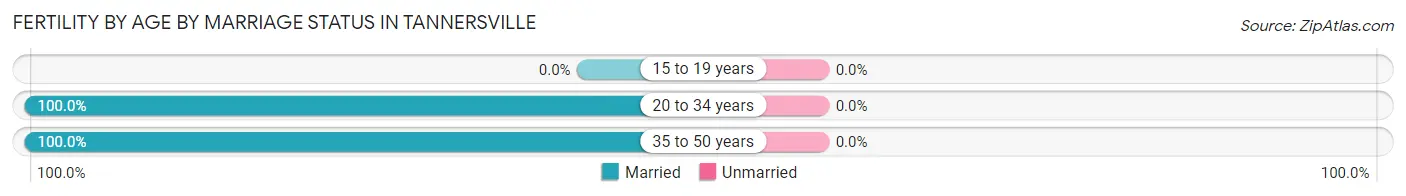
| Age Bracket | Married | Unmarried |
| 15 to 19 years | 0 (0.0%) | 0 (0.0%) |
| 20 to 34 years | 10 (100.0%) | 0 (0.0%) |
| 35 to 50 years | 12 (100.0%) | 0 (0.0%) |
| Total | 22 (100.0%) | 0 (0.0%) |
Fertility by Education in Tannersville
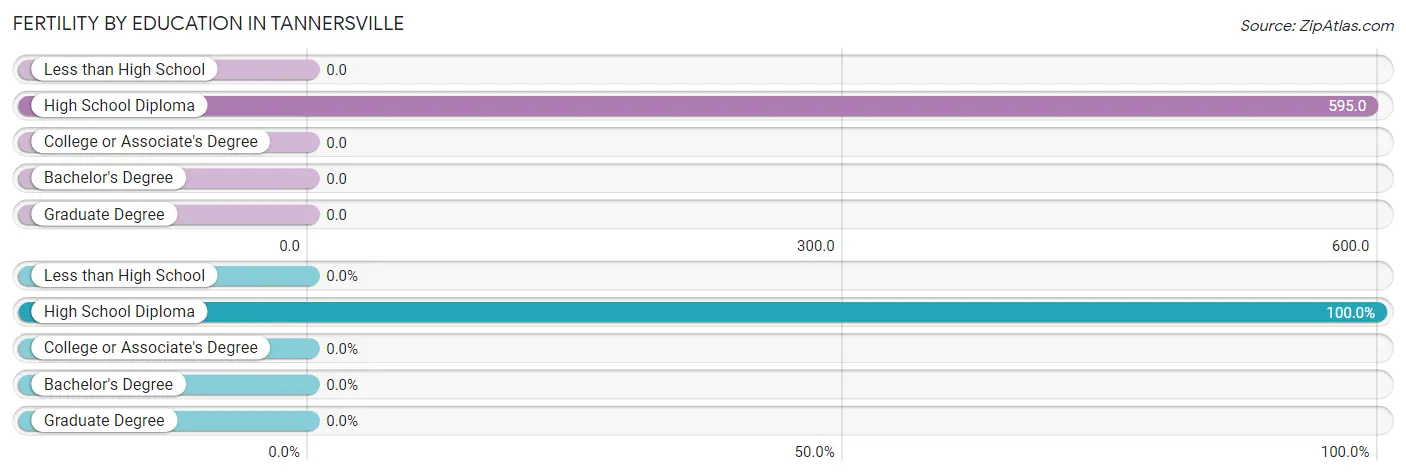
| Educational Attainment | Women with Births | Births / 1,000 Women |
| Less than High School | 0 (0.0%) | 0.0 |
| High School Diploma | 22 (100.0%) | 595.0 |
| College or Associate's Degree | 0 (0.0%) | 0.0 |
| Bachelor's Degree | 0 (0.0%) | 0.0 |
| Graduate Degree | 0 (0.0%) | 0.0 |
| Total | 22 (100.0%) | 324.0 |
Fertility by Education by Marriage Status in Tannersville
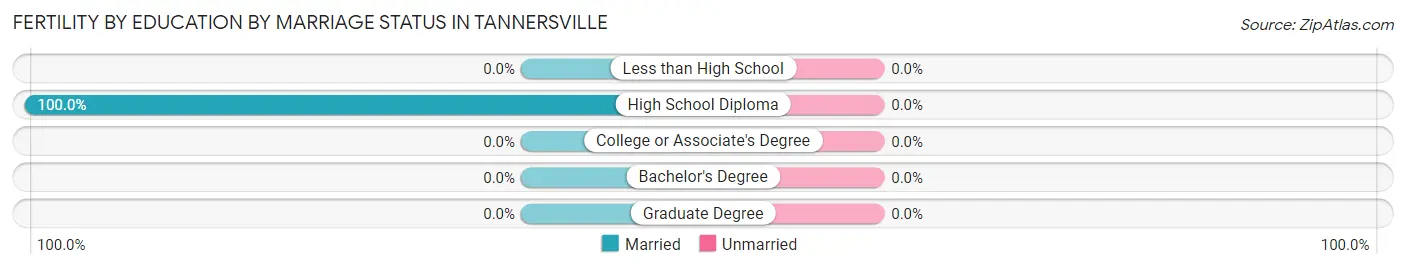
| Educational Attainment | Married | Unmarried |
| Less than High School | 0 (0.0%) | 0 (0.0%) |
| High School Diploma | 22 (100.0%) | 0 (0.0%) |
| College or Associate's Degree | 0 (0.0%) | 0 (0.0%) |
| Bachelor's Degree | 0 (0.0%) | 0 (0.0%) |
| Graduate Degree | 0 (0.0%) | 0 (0.0%) |
| Total | 22 (100.0%) | 0 (0.0%) |
Income in Tannersville
Income Overview in Tannersville
Per Capita Income in Tannersville is $30,897, while median incomes of families and households are $78,214 and $61,510 respectively.
| Characteristic | Number | Measure |
| Per Capita Income | 466 | $30,897 |
| Median Family Income | 82 | $78,214 |
| Mean Family Income | 82 | $100,883 |
| Median Household Income | 143 | $61,510 |
| Mean Household Income | 143 | $93,678 |
| Income Deficit | 82 | $0 |
| Wage / Income Gap (%) | 466 | 31.35% |
| Wage / Income Gap ($) | 466 | 68.65¢ per $1 |
| Gini / Inequality Index | 466 | 0.47 |
Earnings by Sex in Tannersville
Average Earnings in Tannersville are $32,500, $40,515 for men and $27,813 for women, a difference of 31.4%.
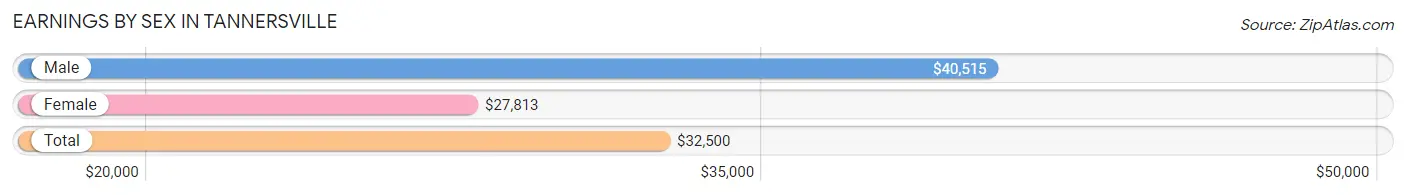
| Sex | Number | Average Earnings |
| Male | 123 (62.8%) | $40,515 |
| Female | 73 (37.2%) | $27,813 |
| Total | 196 (100.0%) | $32,500 |
Earnings by Sex by Income Bracket in Tannersville
The most common earnings brackets in Tannersville are $15,000 to $17,499 for men (26 | 21.1%) and $25,000 to $29,999 for women (17 | 23.3%).
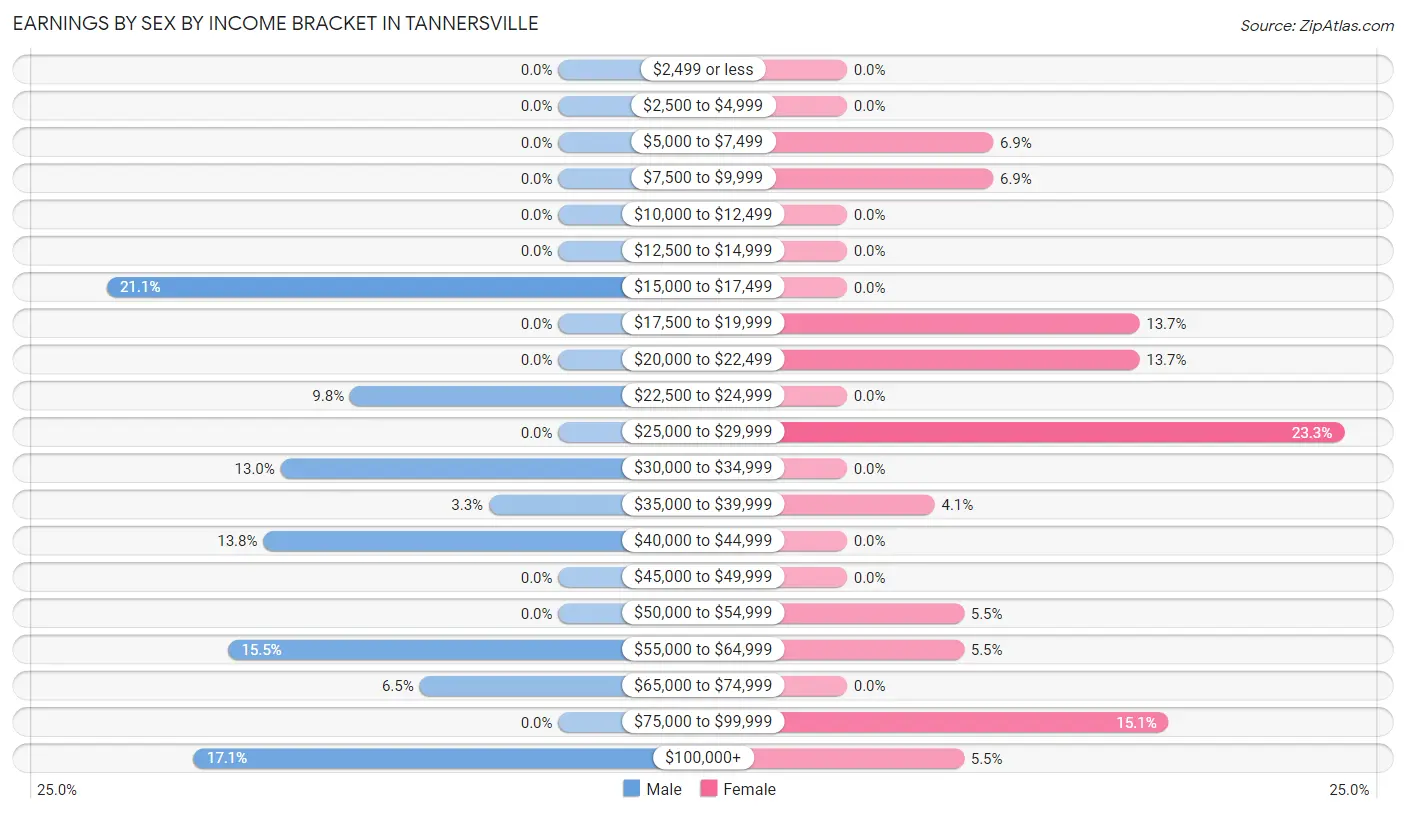
| Income | Male | Female |
| $2,499 or less | 0 (0.0%) | 0 (0.0%) |
| $2,500 to $4,999 | 0 (0.0%) | 0 (0.0%) |
| $5,000 to $7,499 | 0 (0.0%) | 5 (6.9%) |
| $7,500 to $9,999 | 0 (0.0%) | 5 (6.9%) |
| $10,000 to $12,499 | 0 (0.0%) | 0 (0.0%) |
| $12,500 to $14,999 | 0 (0.0%) | 0 (0.0%) |
| $15,000 to $17,499 | 26 (21.1%) | 0 (0.0%) |
| $17,500 to $19,999 | 0 (0.0%) | 10 (13.7%) |
| $20,000 to $22,499 | 0 (0.0%) | 10 (13.7%) |
| $22,500 to $24,999 | 12 (9.8%) | 0 (0.0%) |
| $25,000 to $29,999 | 0 (0.0%) | 17 (23.3%) |
| $30,000 to $34,999 | 16 (13.0%) | 0 (0.0%) |
| $35,000 to $39,999 | 4 (3.3%) | 3 (4.1%) |
| $40,000 to $44,999 | 17 (13.8%) | 0 (0.0%) |
| $45,000 to $49,999 | 0 (0.0%) | 0 (0.0%) |
| $50,000 to $54,999 | 0 (0.0%) | 4 (5.5%) |
| $55,000 to $64,999 | 19 (15.4%) | 4 (5.5%) |
| $65,000 to $74,999 | 8 (6.5%) | 0 (0.0%) |
| $75,000 to $99,999 | 0 (0.0%) | 11 (15.1%) |
| $100,000+ | 21 (17.1%) | 4 (5.5%) |
| Total | 123 (100.0%) | 73 (100.0%) |
Earnings by Sex by Educational Attainment in Tannersville
Average earnings in Tannersville are $40,515 for men and $27,813 for women, a difference of 31.4%. Men with an educational attainment of high school diploma enjoy the highest average annual earnings of $33,333, while those with high school diploma education earn the least with $33,333. Women with an educational attainment of bachelor's degree earn the most with the average annual earnings of $76,250, while those with high school diploma education have the smallest earnings of $20,250.
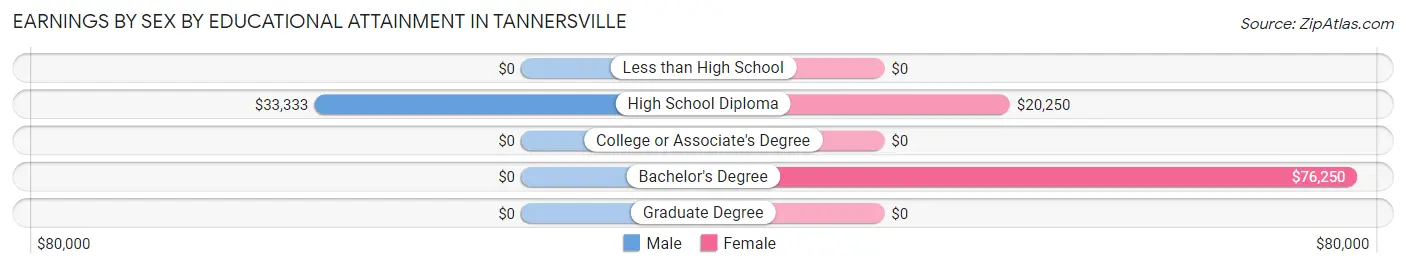
| Educational Attainment | Male Income | Female Income |
| Less than High School | - | - |
| High School Diploma | $33,333 | $20,250 |
| College or Associate's Degree | - | - |
| Bachelor's Degree | - | - |
| Graduate Degree | - | - |
| Total | $40,515 | $27,813 |
Family Income in Tannersville
Family Income Brackets in Tannersville
According to the Tannersville family income data, there are 19 families falling into the $35,000 to $49,999 income range, which is the most common income bracket and makes up 23.2% of all families.
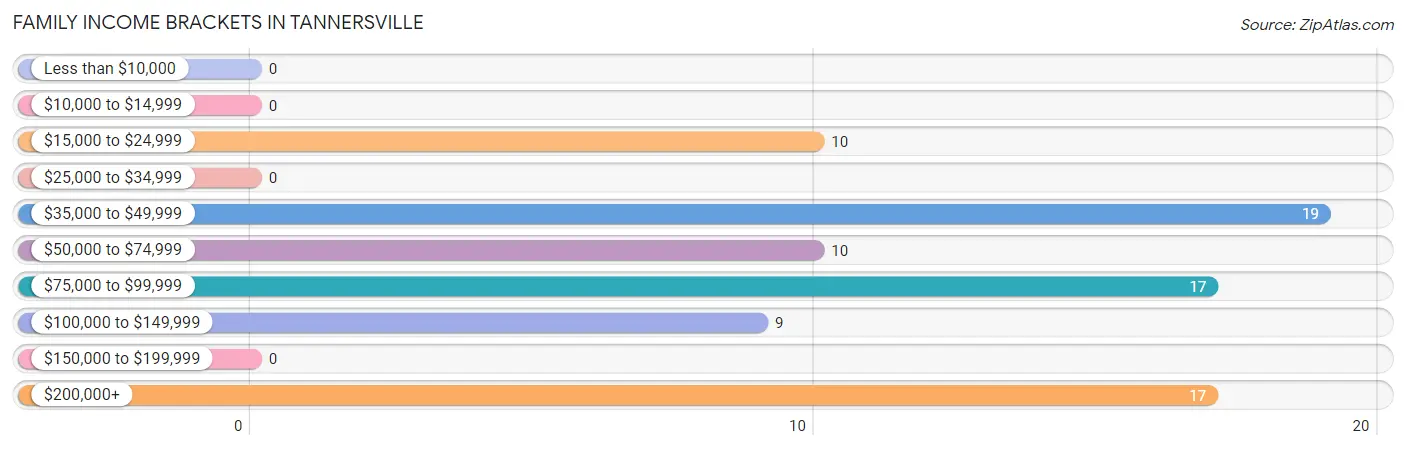
| Income Bracket | # Families | % Families |
| Less than $10,000 | 0 | 0.0% |
| $10,000 to $14,999 | 0 | 0.0% |
| $15,000 to $24,999 | 10 | 12.2% |
| $25,000 to $34,999 | 0 | 0.0% |
| $35,000 to $49,999 | 19 | 23.2% |
| $50,000 to $74,999 | 10 | 12.2% |
| $75,000 to $99,999 | 17 | 20.7% |
| $100,000 to $149,999 | 9 | 11.0% |
| $150,000 to $199,999 | 0 | 0.0% |
| $200,000+ | 17 | 20.7% |
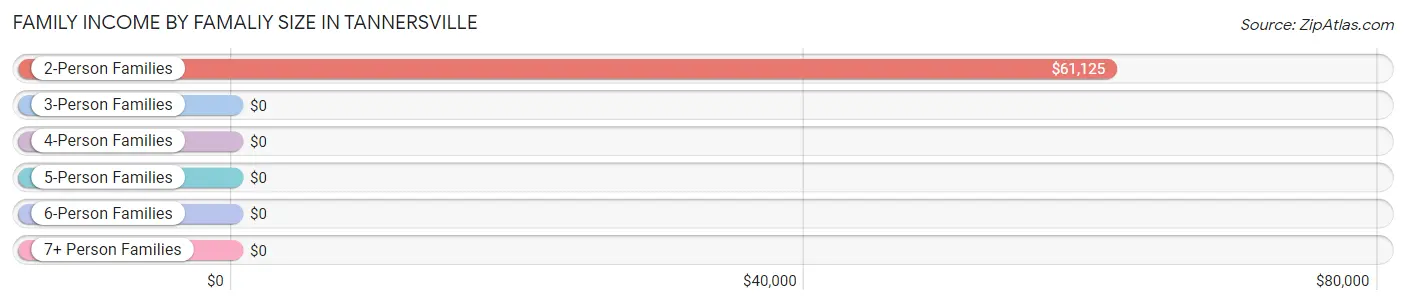
Family Income by Famaliy Size in Tannersville
2-person families (37 | 45.1%) account for the highest median family income in Tannersville with $61,125 per family, while 2-person families (37 | 45.1%) have the highest median income of $30,562 per family member.
| Income Bracket | # Families | Median Income |
| 2-Person Families | 37 (45.1%) | $61,125 |
| 3-Person Families | 3 (3.7%) | $0 |
| 4-Person Families | 5 (6.1%) | $0 |
| 5-Person Families | 5 (6.1%) | $0 |
| 6-Person Families | 15 (18.3%) | $0 |
| 7+ Person Families | 17 (20.7%) | $0 |
| Total | 82 (100.0%) | $78,214 |
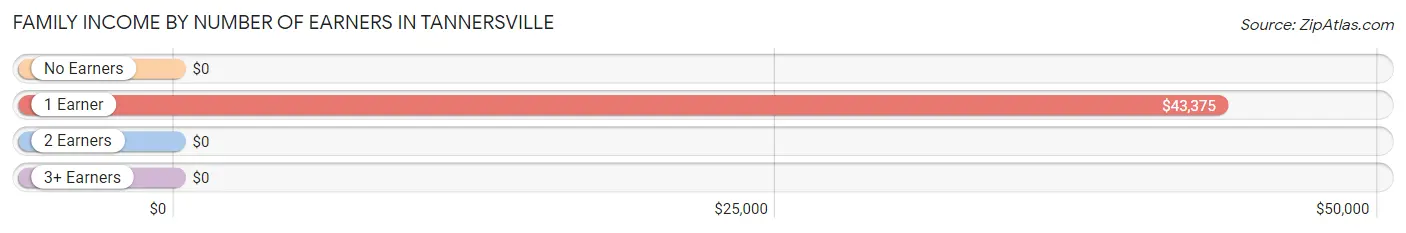
Family Income by Number of Earners in Tannersville
| Number of Earners | # Families | Median Income |
| No Earners | 4 (4.9%) | $0 |
| 1 Earner | 27 (32.9%) | $43,375 |
| 2 Earners | 51 (62.2%) | $0 |
| 3+ Earners | 0 (0.0%) | $0 |
| Total | 82 (100.0%) | $78,214 |
Household Income in Tannersville
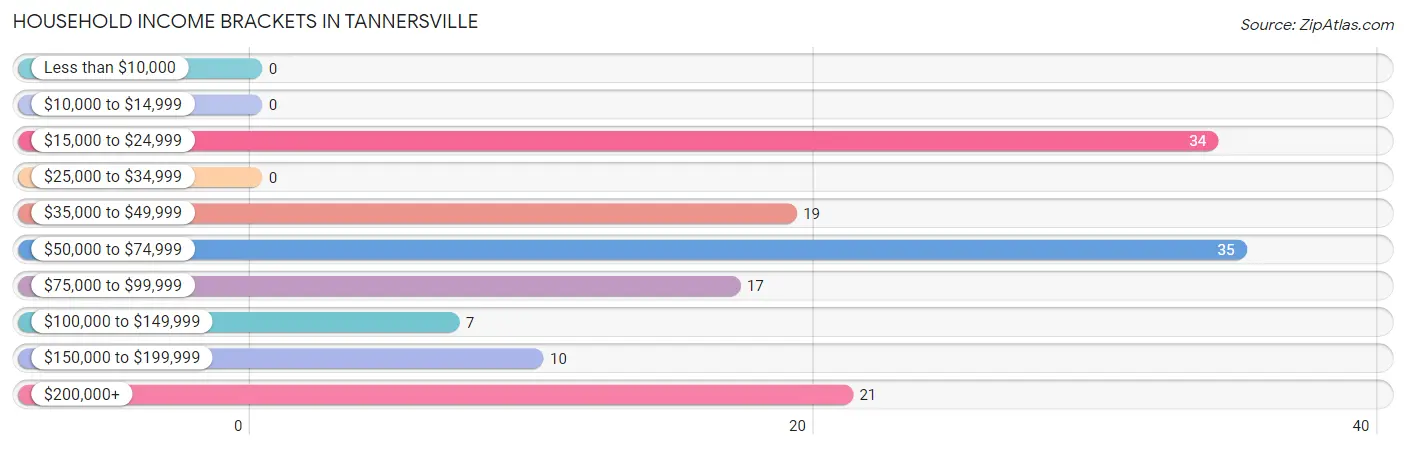
Household Income Brackets in Tannersville
With 35 households falling in the category, the $50,000 to $74,999 income range is the most frequent in Tannersville, accounting for 24.5% of all households.
| Income Bracket | # Households | % Households |
| Less than $10,000 | 0 | 0.0% |
| $10,000 to $14,999 | 0 | 0.0% |
| $15,000 to $24,999 | 34 | 23.8% |
| $25,000 to $34,999 | 0 | 0.0% |
| $35,000 to $49,999 | 19 | 13.3% |
| $50,000 to $74,999 | 35 | 24.5% |
| $75,000 to $99,999 | 17 | 11.9% |
| $100,000 to $149,999 | 7 | 4.9% |
| $150,000 to $199,999 | 10 | 7.0% |
| $200,000+ | 21 | 14.7% |
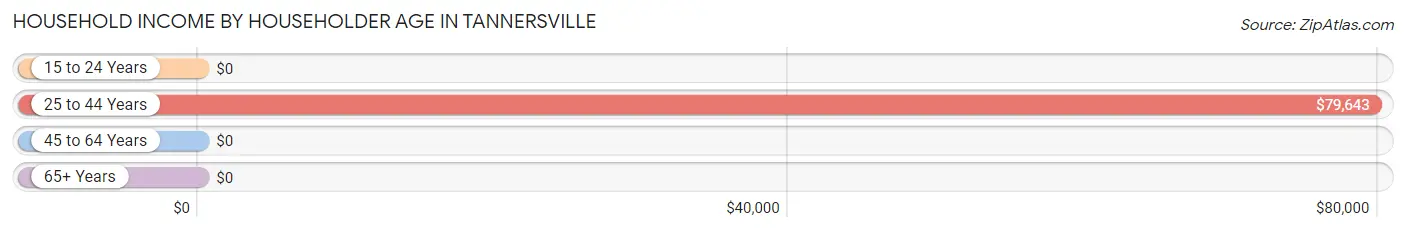
Household Income by Householder Age in Tannersville
The median household income in Tannersville is $61,510, with the highest median household income of $79,643 found in the 25 to 44 years age bracket for the primary householder. A total of 46 households (32.2%) fall into this category.
| Income Bracket | # Households | Median Income |
| 15 to 24 Years | 0 (0.0%) | $0 |
| 25 to 44 Years | 46 (32.2%) | $79,643 |
| 45 to 64 Years | 46 (32.2%) | $0 |
| 65+ Years | 51 (35.7%) | $0 |
| Total | 143 (100.0%) | $61,510 |
Poverty in Tannersville
Income Below Poverty by Sex and Age in Tannersville
With 19.4% poverty level for males and 11.8% for females among the residents of Tannersville, 5 year old males and 55 to 64 year old females are the most vulnerable to poverty, with 11 males (100.0%) and 11 females (68.8%) in their respective age groups living below the poverty level.
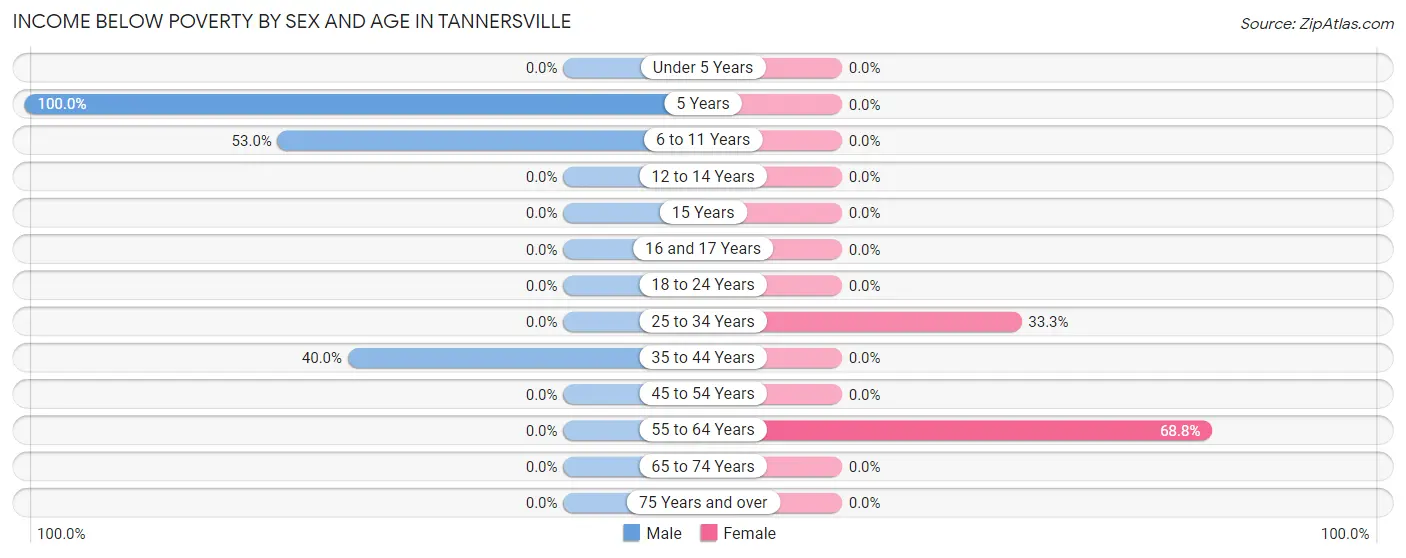
| Age Bracket | Male | Female |
| Under 5 Years | 0 (0.0%) | 0 (0.0%) |
| 5 Years | 11 (100.0%) | 0 (0.0%) |
| 6 to 11 Years | 35 (53.0%) | 0 (0.0%) |
| 12 to 14 Years | 0 (0.0%) | 0 (0.0%) |
| 15 Years | 0 (0.0%) | 0 (0.0%) |
| 16 and 17 Years | 0 (0.0%) | 0 (0.0%) |
| 18 to 24 Years | 0 (0.0%) | 0 (0.0%) |
| 25 to 34 Years | 0 (0.0%) | 10 (33.3%) |
| 35 to 44 Years | 10 (40.0%) | 0 (0.0%) |
| 45 to 54 Years | 0 (0.0%) | 0 (0.0%) |
| 55 to 64 Years | 0 (0.0%) | 11 (68.8%) |
| 65 to 74 Years | 0 (0.0%) | 0 (0.0%) |
| 75 Years and over | 0 (0.0%) | 0 (0.0%) |
| Total | 56 (19.4%) | 21 (11.8%) |
Income Above Poverty by Sex and Age in Tannersville
According to the poverty statistics in Tannersville, males aged under 5 years and females aged under 5 years are the age groups that are most secure financially, with 100.0% of males and 100.0% of females in these age groups living above the poverty line.
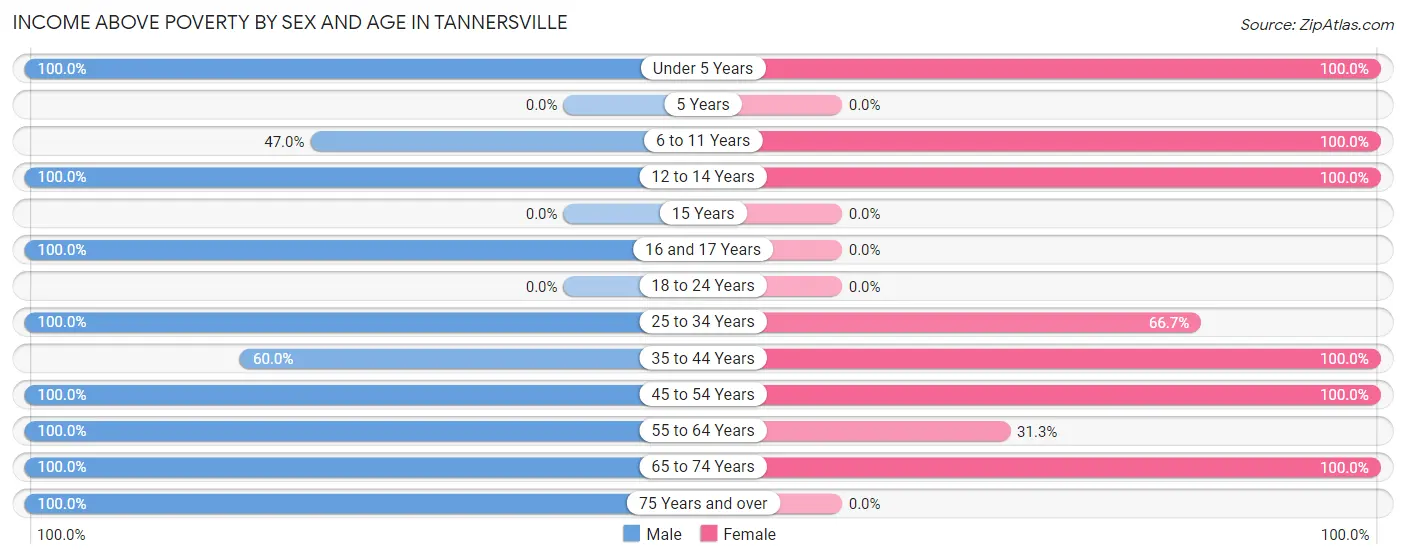
| Age Bracket | Male | Female |
| Under 5 Years | 23 (100.0%) | 14 (100.0%) |
| 5 Years | 0 (0.0%) | 0 (0.0%) |
| 6 to 11 Years | 31 (47.0%) | 31 (100.0%) |
| 12 to 14 Years | 27 (100.0%) | 12 (100.0%) |
| 15 Years | 0 (0.0%) | 0 (0.0%) |
| 16 and 17 Years | 5 (100.0%) | 0 (0.0%) |
| 18 to 24 Years | 0 (0.0%) | 0 (0.0%) |
| 25 to 34 Years | 26 (100.0%) | 20 (66.7%) |
| 35 to 44 Years | 15 (60.0%) | 23 (100.0%) |
| 45 to 54 Years | 27 (100.0%) | 15 (100.0%) |
| 55 to 64 Years | 46 (100.0%) | 5 (31.2%) |
| 65 to 74 Years | 10 (100.0%) | 37 (100.0%) |
| 75 Years and over | 22 (100.0%) | 0 (0.0%) |
| Total | 232 (80.6%) | 157 (88.2%) |
Income Below Poverty Among Married-Couple Families in Tannersville
The poverty statistics for married-couple families in Tannersville show that 14.1% or 10 of the total 71 families live below the poverty line. Families with 3 or 4 children have the highest poverty rate of 66.7%, comprising of 10 families. On the other hand, families with no children have the lowest poverty rate of 0.0%, which includes 0 families.
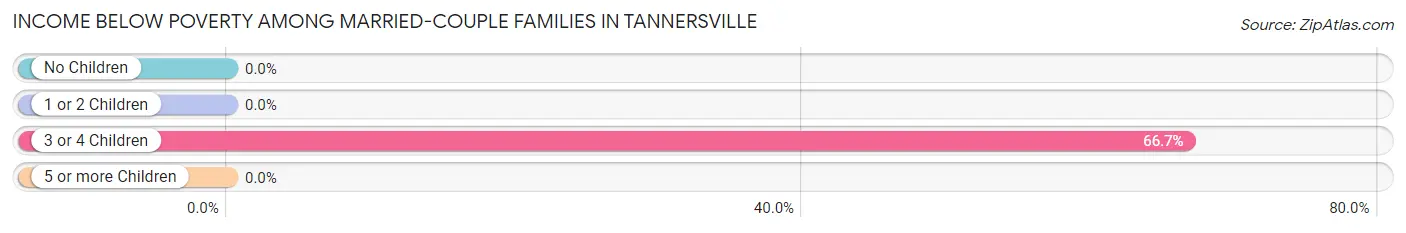
| Children | Above Poverty | Below Poverty |
| No Children | 31 (100.0%) | 0 (0.0%) |
| 1 or 2 Children | 8 (100.0%) | 0 (0.0%) |
| 3 or 4 Children | 5 (33.3%) | 10 (66.7%) |
| 5 or more Children | 17 (100.0%) | 0 (0.0%) |
| Total | 61 (85.9%) | 10 (14.1%) |
Income Below Poverty Among Single-Parent Households in Tannersville
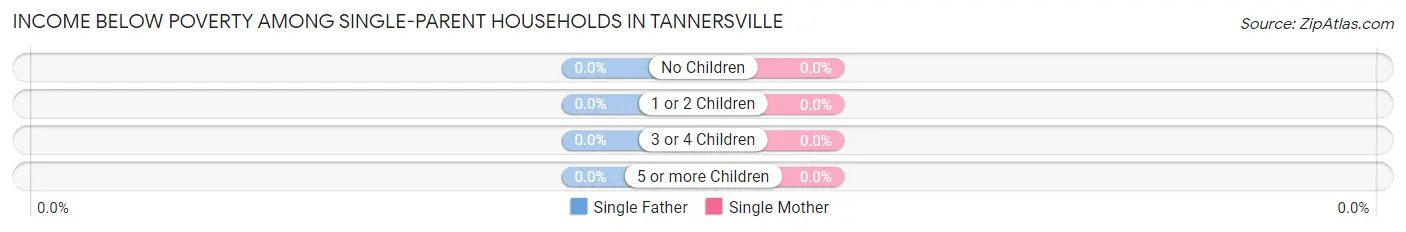
| Children | Single Father | Single Mother |
| No Children | 0 (0.0%) | 0 (0.0%) |
| 1 or 2 Children | 0 (0.0%) | 0 (0.0%) |
| 3 or 4 Children | 0 (0.0%) | 0 (0.0%) |
| 5 or more Children | 0 (0.0%) | 0 (0.0%) |
| Total | 0 (0.0%) | 0 (0.0%) |
Income Below Poverty Among Married-Couple vs Single-Parent Households in Tannersville
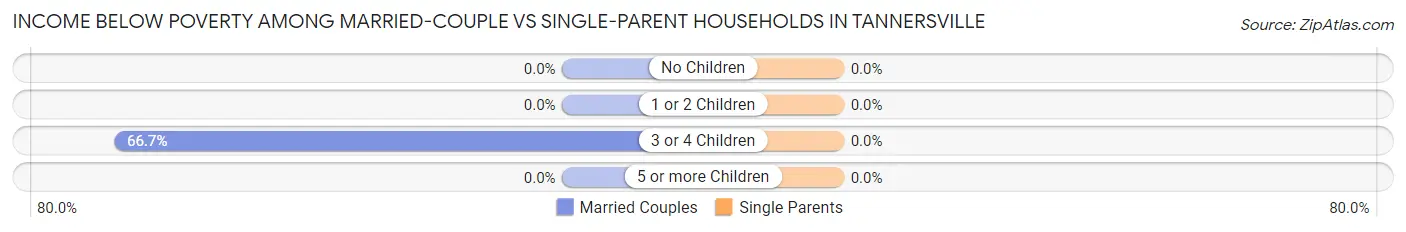
| Children | Married-Couple Families | Single-Parent Households |
| No Children | 0 (0.0%) | 0 (0.0%) |
| 1 or 2 Children | 0 (0.0%) | 0 (0.0%) |
| 3 or 4 Children | 10 (66.7%) | 0 (0.0%) |
| 5 or more Children | 0 (0.0%) | 0 (0.0%) |
| Total | 10 (14.1%) | 0 (0.0%) |
Employment Characteristics in Tannersville
Employment by Class of Employer in Tannersville
Among the 188 employed individuals in Tannersville, private company employees (140 | 74.5%), not-for-profit organizations (23 | 12.2%), and local government employees (9 | 4.8%) make up the most common classes of employment.
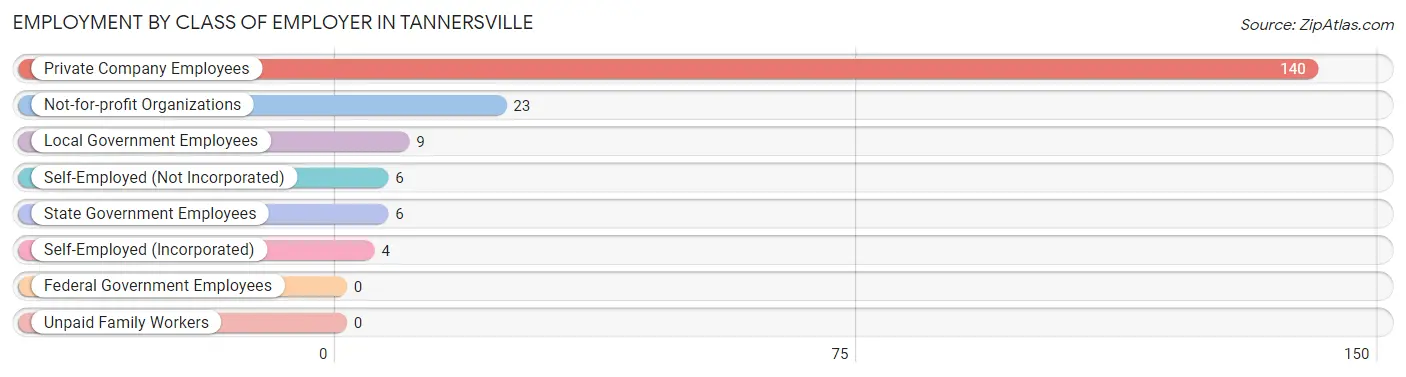
| Employer Class | # Employees | % Employees |
| Private Company Employees | 140 | 74.5% |
| Self-Employed (Incorporated) | 4 | 2.1% |
| Self-Employed (Not Incorporated) | 6 | 3.2% |
| Not-for-profit Organizations | 23 | 12.2% |
| Local Government Employees | 9 | 4.8% |
| State Government Employees | 6 | 3.2% |
| Federal Government Employees | 0 | 0.0% |
| Unpaid Family Workers | 0 | 0.0% |
| Total | 188 | 100.0% |
Employment Status by Age in Tannersville
According to the labor force statistics for Tannersville, out of the total population over 16 years of age (282), 73.4% or 207 individuals are in the labor force, with 7.7% or 16 of them unemployed. The age group with the highest labor force participation rate is 25 to 29 years, with 100.0% or 21 individuals in the labor force. Within the labor force, the 55 to 59 years age range has the highest percentage of unemployed individuals, with 48.5% or 16 of them being unemployed.
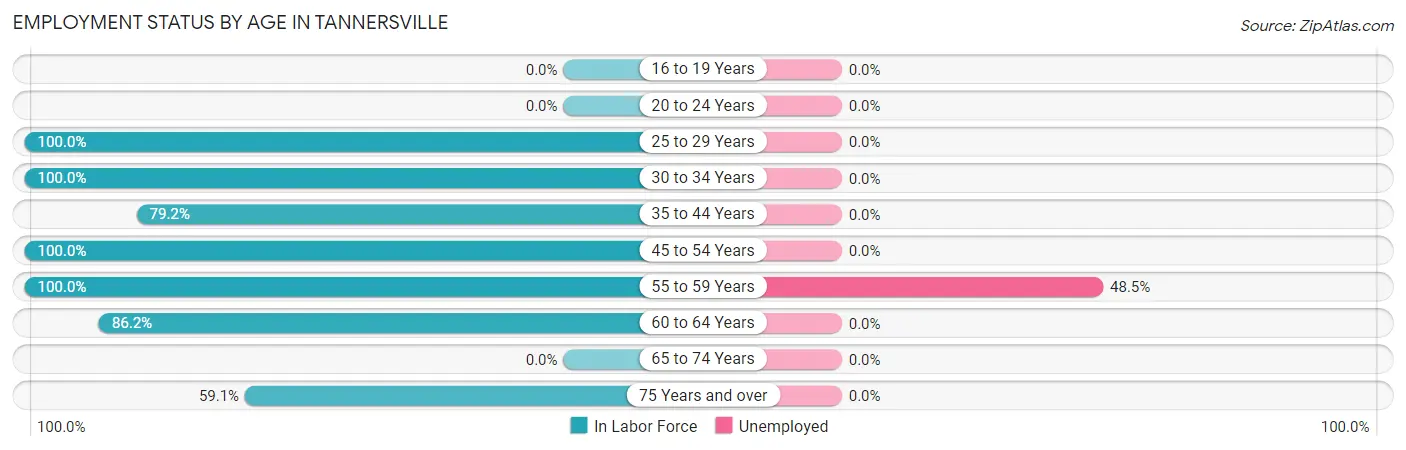
| Age Bracket | In Labor Force | Unemployed |
| 16 to 19 Years | 0 (0.0%) | 0 (0.0%) |
| 20 to 24 Years | 0 (0.0%) | 0 (0.0%) |
| 25 to 29 Years | 21 (100.0%) | 0 (0.0%) |
| 30 to 34 Years | 35 (100.0%) | 0 (0.0%) |
| 35 to 44 Years | 38 (79.2%) | 0 (0.0%) |
| 45 to 54 Years | 42 (100.0%) | 0 (0.0%) |
| 55 to 59 Years | 33 (100.0%) | 16 (48.5%) |
| 60 to 64 Years | 25 (86.2%) | 0 (0.0%) |
| 65 to 74 Years | 0 (0.0%) | 0 (0.0%) |
| 75 Years and over | 13 (59.1%) | 0 (0.0%) |
| Total | 207 (73.4%) | 16 (7.7%) |
Employment Status by Educational Attainment in Tannersville
According to labor force statistics for Tannersville, 93.3% of individuals (194) out of the total population between 25 and 64 years of age (208) are in the labor force, with 8.2% or 16 of them being unemployed. The group with the highest labor force participation rate are those with the educational attainment of less than high school, with 100.0% or 10 individuals in the labor force. Within the labor force, individuals with bachelor's degree or higher education have the highest percentage of unemployment, with 29.7% or 11 of them being unemployed.
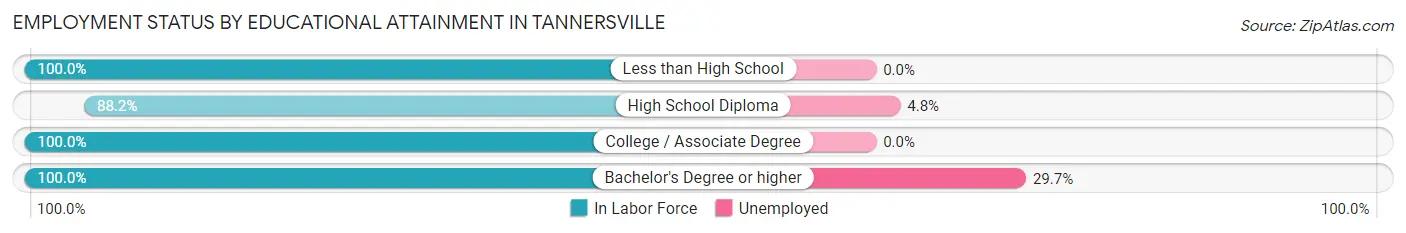
| Educational Attainment | In Labor Force | Unemployed |
| Less than High School | 10 (100.0%) | 0 (0.0%) |
| High School Diploma | 105 (88.2%) | 6 (4.8%) |
| College / Associate Degree | 42 (100.0%) | 0 (0.0%) |
| Bachelor's Degree or higher | 37 (100.0%) | 11 (29.7%) |
| Total | 194 (93.3%) | 17 (8.2%) |
Employment Occupations by Sex in Tannersville
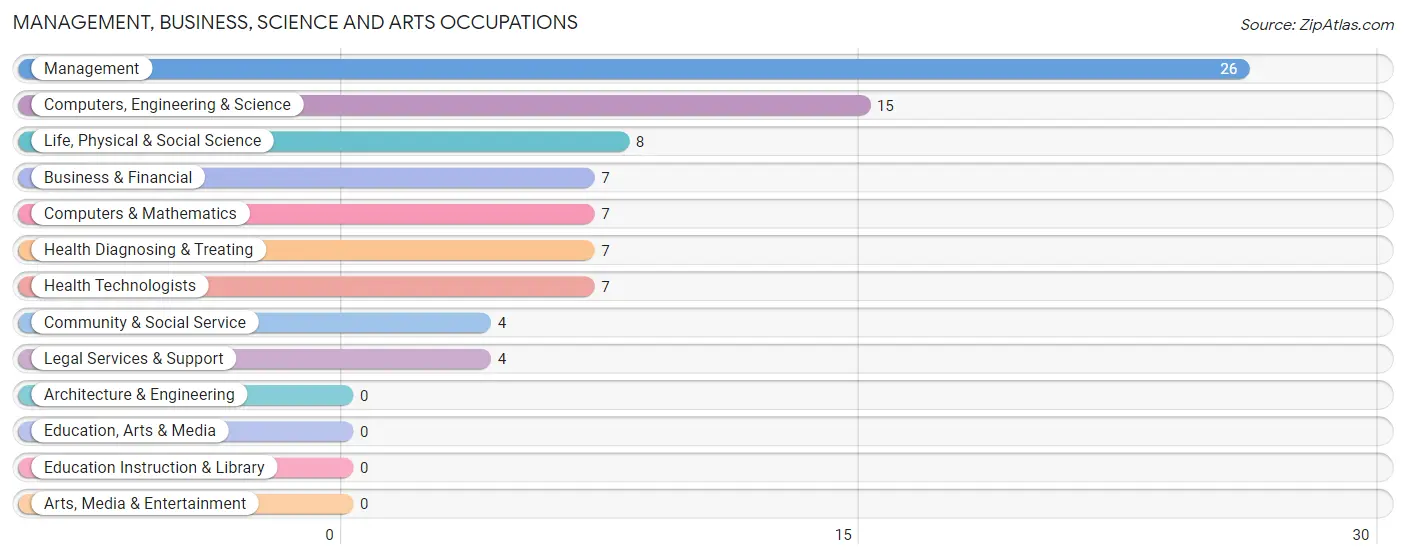
Management, Business, Science and Arts Occupations
The most common Management, Business, Science and Arts occupations in Tannersville are Management (26 | 13.6%), Computers, Engineering & Science (15 | 7.9%), Life, Physical & Social Science (8 | 4.2%), Business & Financial (7 | 3.7%), and Computers & Mathematics (7 | 3.7%).
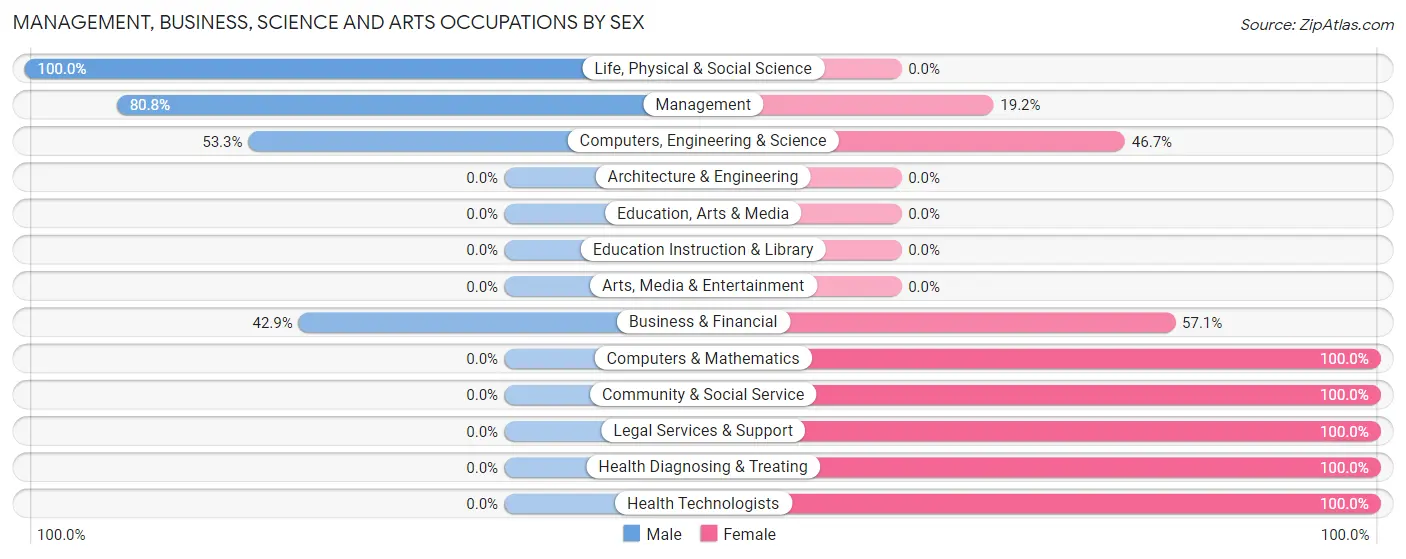
Management, Business, Science and Arts Occupations by Sex
Within the Management, Business, Science and Arts occupations in Tannersville, the most male-oriented occupations are Life, Physical & Social Science (100.0%), Management (80.8%), and Computers, Engineering & Science (53.3%), while the most female-oriented occupations are Computers & Mathematics (100.0%), Community & Social Service (100.0%), and Legal Services & Support (100.0%).
| Occupation | Male | Female |
| Management | 21 (80.8%) | 5 (19.2%) |
| Business & Financial | 3 (42.9%) | 4 (57.1%) |
| Computers, Engineering & Science | 8 (53.3%) | 7 (46.7%) |
| Computers & Mathematics | 0 (0.0%) | 7 (100.0%) |
| Architecture & Engineering | 0 (0.0%) | 0 (0.0%) |
| Life, Physical & Social Science | 8 (100.0%) | 0 (0.0%) |
| Community & Social Service | 0 (0.0%) | 4 (100.0%) |
| Education, Arts & Media | 0 (0.0%) | 0 (0.0%) |
| Legal Services & Support | 0 (0.0%) | 4 (100.0%) |
| Education Instruction & Library | 0 (0.0%) | 0 (0.0%) |
| Arts, Media & Entertainment | 0 (0.0%) | 0 (0.0%) |
| Health Diagnosing & Treating | 0 (0.0%) | 7 (100.0%) |
| Health Technologists | 0 (0.0%) | 7 (100.0%) |
| Total (Category) | 32 (54.2%) | 27 (45.8%) |
| Total (Overall) | 118 (61.8%) | 73 (38.2%) |
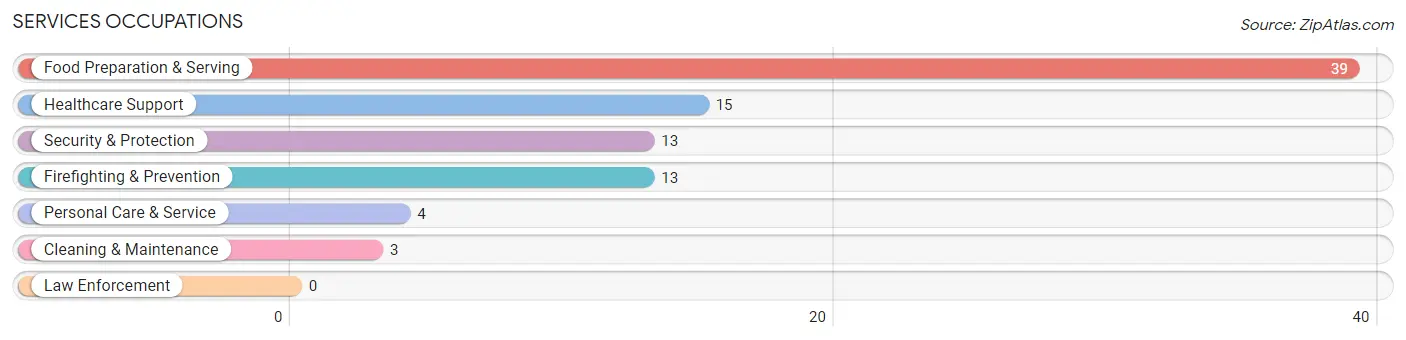
Services Occupations
The most common Services occupations in Tannersville are Food Preparation & Serving (39 | 20.4%), Healthcare Support (15 | 7.9%), Security & Protection (13 | 6.8%), Firefighting & Prevention (13 | 6.8%), and Personal Care & Service (4 | 2.1%).
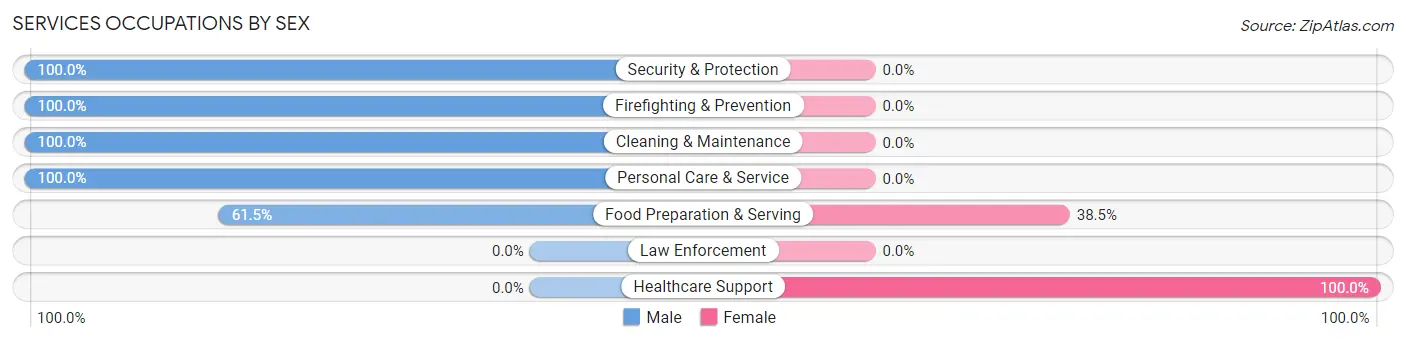
Services Occupations by Sex
Within the Services occupations in Tannersville, the most male-oriented occupations are Security & Protection (100.0%), Firefighting & Prevention (100.0%), and Cleaning & Maintenance (100.0%), while the most female-oriented occupations are Healthcare Support (100.0%), and Food Preparation & Serving (38.5%).
| Occupation | Male | Female |
| Healthcare Support | 0 (0.0%) | 15 (100.0%) |
| Security & Protection | 13 (100.0%) | 0 (0.0%) |
| Firefighting & Prevention | 13 (100.0%) | 0 (0.0%) |
| Law Enforcement | 0 (0.0%) | 0 (0.0%) |
| Food Preparation & Serving | 24 (61.5%) | 15 (38.5%) |
| Cleaning & Maintenance | 3 (100.0%) | 0 (0.0%) |
| Personal Care & Service | 4 (100.0%) | 0 (0.0%) |
| Total (Category) | 44 (59.5%) | 30 (40.5%) |
| Total (Overall) | 118 (61.8%) | 73 (38.2%) |
Sales and Office Occupations
The most common Sales and Office occupations in Tannersville are , and Office & Administration (12 | 6.3%).

Sales and Office Occupations by Sex

| Occupation | Male | Female |
| Sales & Related | 0 (0.0%) | 0 (0.0%) |
| Office & Administration | 0 (0.0%) | 12 (100.0%) |
| Total (Category) | 0 (0.0%) | 12 (100.0%) |
| Total (Overall) | 118 (61.8%) | 73 (38.2%) |
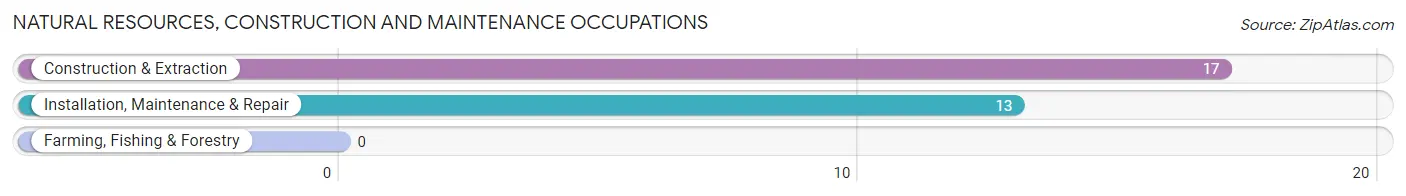
Natural Resources, Construction and Maintenance Occupations
The most common Natural Resources, Construction and Maintenance occupations in Tannersville are Construction & Extraction (17 | 8.9%), and Installation, Maintenance & Repair (13 | 6.8%).
Natural Resources, Construction and Maintenance Occupations by Sex
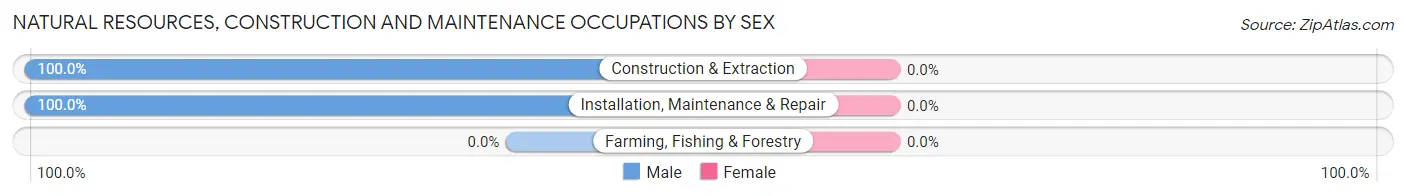
| Occupation | Male | Female |
| Farming, Fishing & Forestry | 0 (0.0%) | 0 (0.0%) |
| Construction & Extraction | 17 (100.0%) | 0 (0.0%) |
| Installation, Maintenance & Repair | 13 (100.0%) | 0 (0.0%) |
| Total (Category) | 30 (100.0%) | 0 (0.0%) |
| Total (Overall) | 118 (61.8%) | 73 (38.2%) |
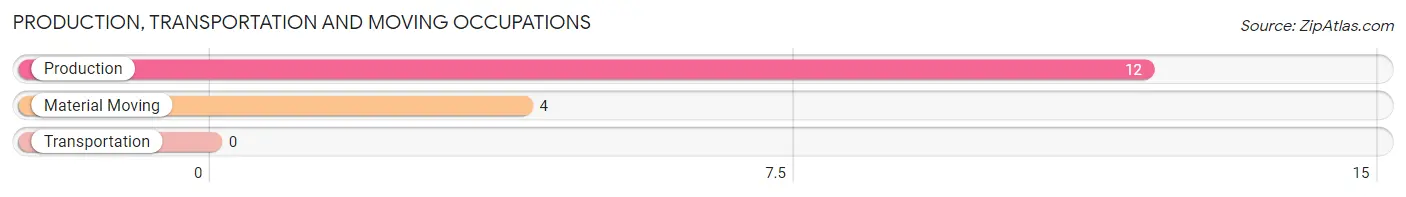
Production, Transportation and Moving Occupations
The most common Production, Transportation and Moving occupations in Tannersville are Production (12 | 6.3%), and Material Moving (4 | 2.1%).
Production, Transportation and Moving Occupations by Sex
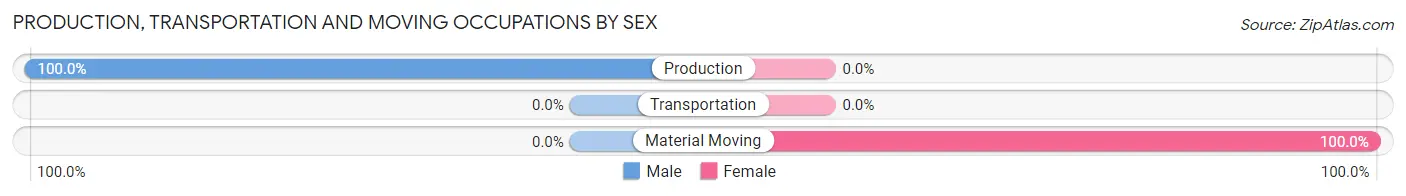
| Occupation | Male | Female |
| Production | 12 (100.0%) | 0 (0.0%) |
| Transportation | 0 (0.0%) | 0 (0.0%) |
| Material Moving | 0 (0.0%) | 4 (100.0%) |
| Total (Category) | 12 (75.0%) | 4 (25.0%) |
| Total (Overall) | 118 (61.8%) | 73 (38.2%) |
Employment Industries by Sex in Tannersville
Employment Industries in Tannersville
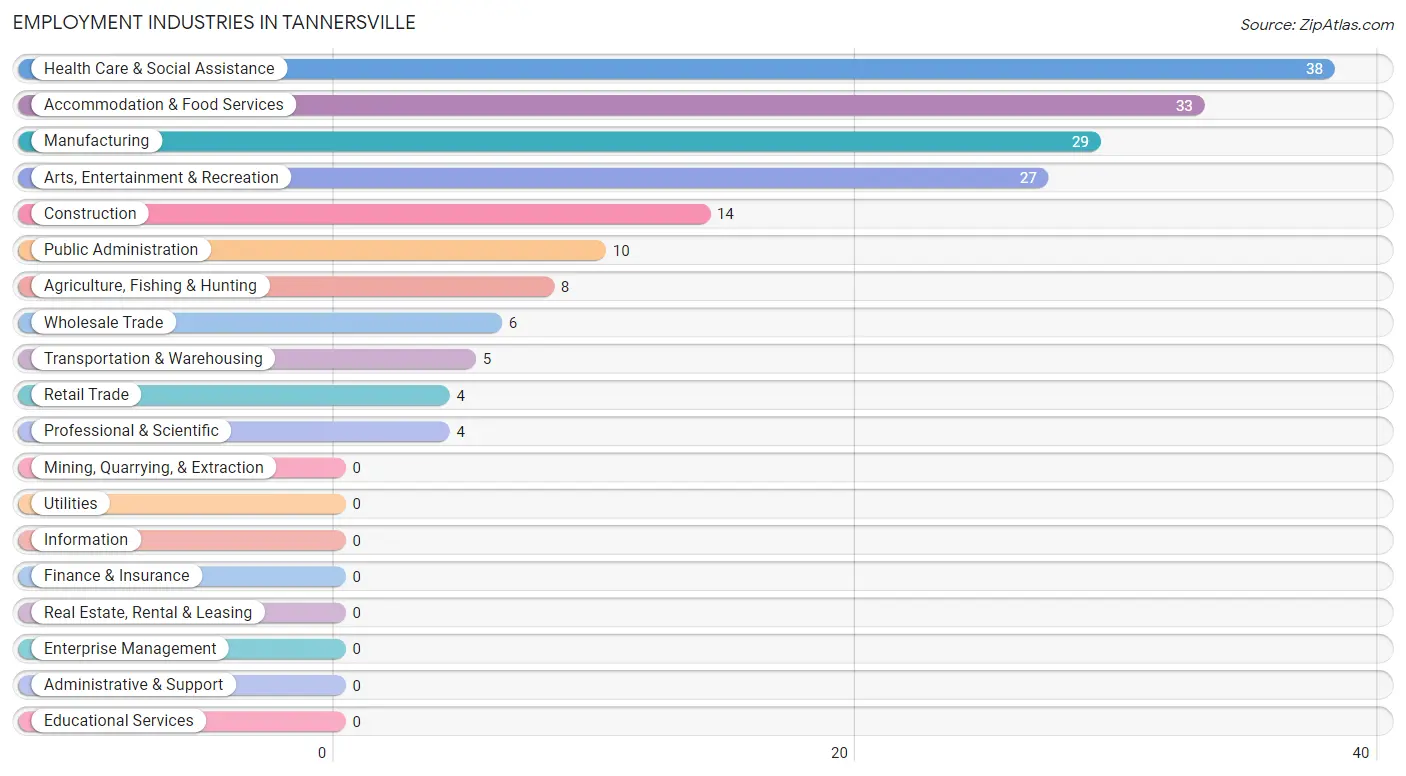
The major employment industries in Tannersville include Health Care & Social Assistance (38 | 19.9%), Accommodation & Food Services (33 | 17.3%), Manufacturing (29 | 15.2%), Arts, Entertainment & Recreation (27 | 14.1%), and Construction (14 | 7.3%).
Employment Industries by Sex in Tannersville
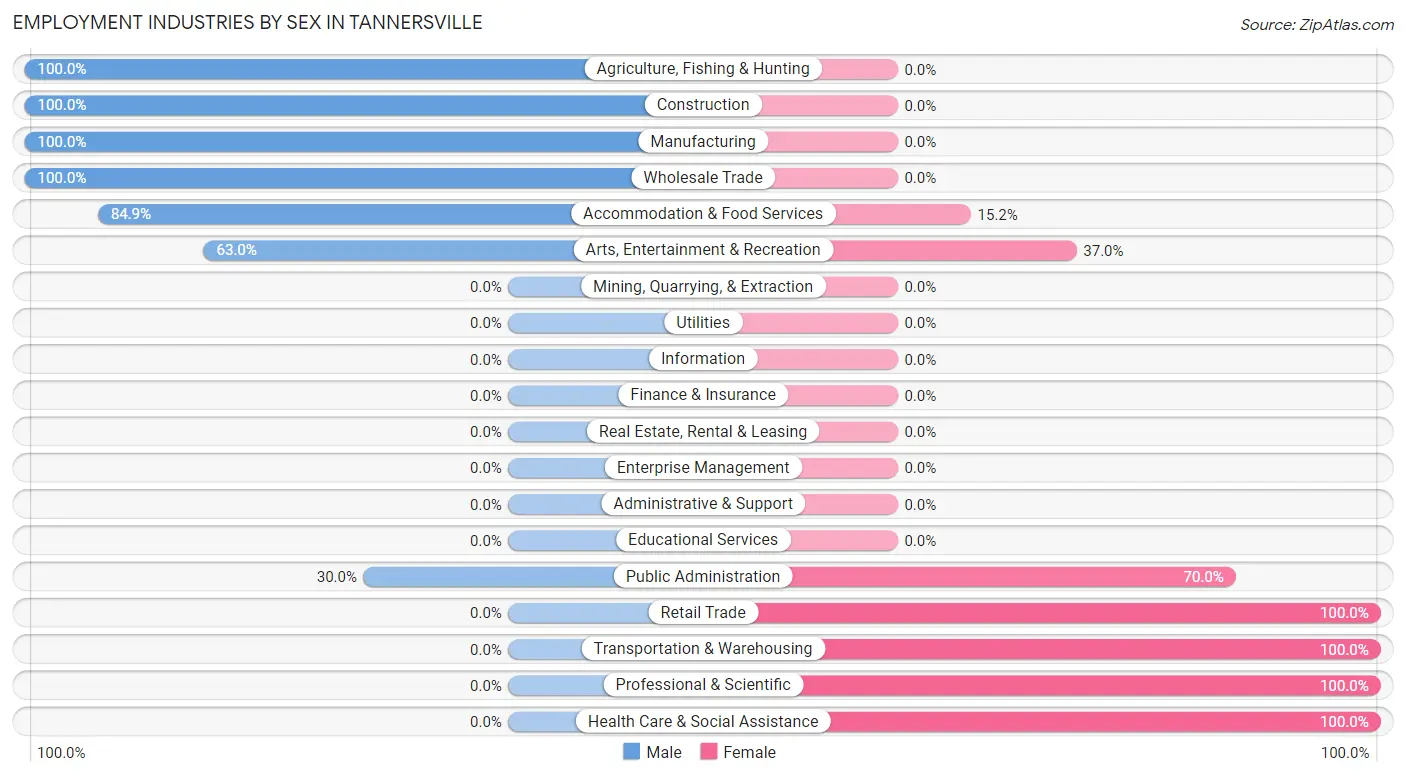
The Tannersville industries that see more men than women are Agriculture, Fishing & Hunting (100.0%), Construction (100.0%), and Manufacturing (100.0%), whereas the industries that tend to have a higher number of women are Retail Trade (100.0%), Transportation & Warehousing (100.0%), and Professional & Scientific (100.0%).
| Industry | Male | Female |
| Agriculture, Fishing & Hunting | 8 (100.0%) | 0 (0.0%) |
| Mining, Quarrying, & Extraction | 0 (0.0%) | 0 (0.0%) |
| Construction | 14 (100.0%) | 0 (0.0%) |
| Manufacturing | 29 (100.0%) | 0 (0.0%) |
| Wholesale Trade | 6 (100.0%) | 0 (0.0%) |
| Retail Trade | 0 (0.0%) | 4 (100.0%) |
| Transportation & Warehousing | 0 (0.0%) | 5 (100.0%) |
| Utilities | 0 (0.0%) | 0 (0.0%) |
| Information | 0 (0.0%) | 0 (0.0%) |
| Finance & Insurance | 0 (0.0%) | 0 (0.0%) |
| Real Estate, Rental & Leasing | 0 (0.0%) | 0 (0.0%) |
| Professional & Scientific | 0 (0.0%) | 4 (100.0%) |
| Enterprise Management | 0 (0.0%) | 0 (0.0%) |
| Administrative & Support | 0 (0.0%) | 0 (0.0%) |
| Educational Services | 0 (0.0%) | 0 (0.0%) |
| Health Care & Social Assistance | 0 (0.0%) | 38 (100.0%) |
| Arts, Entertainment & Recreation | 17 (63.0%) | 10 (37.0%) |
| Accommodation & Food Services | 28 (84.9%) | 5 (15.1%) |
| Public Administration | 3 (30.0%) | 7 (70.0%) |
| Total | 118 (61.8%) | 73 (38.2%) |
Education in Tannersville
School Enrollment in Tannersville
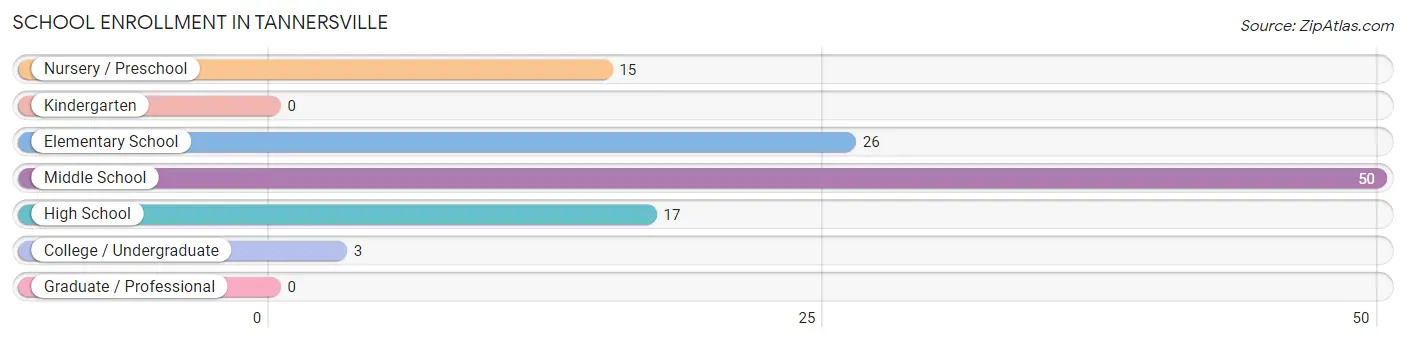
The most common levels of schooling among the 111 students in Tannersville are middle school (50 | 45.1%), elementary school (26 | 23.4%), and high school (17 | 15.3%).
| School Level | # Students | % Students |
| Nursery / Preschool | 15 | 13.5% |
| Kindergarten | 0 | 0.0% |
| Elementary School | 26 | 23.4% |
| Middle School | 50 | 45.1% |
| High School | 17 | 15.3% |
| College / Undergraduate | 3 | 2.7% |
| Graduate / Professional | 0 | 0.0% |
| Total | 111 | 100.0% |
School Enrollment by Age by Funding Source in Tannersville
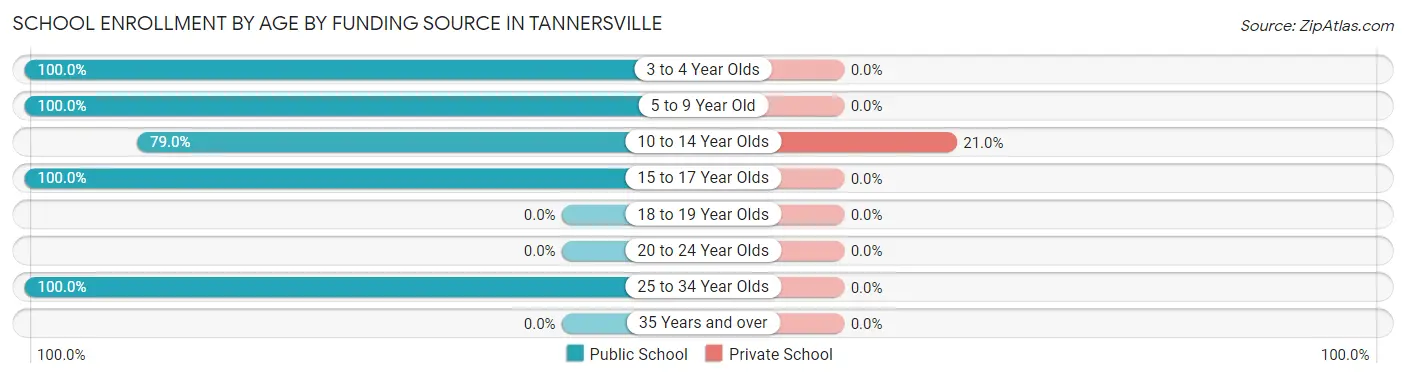
Out of a total of 111 students who are enrolled in schools in Tannersville, 13 (11.7%) attend a private institution, while the remaining 98 (88.3%) are enrolled in public schools. The age group of 10 to 14 year olds has the highest likelihood of being enrolled in private schools, with 13 (21.0% in the age bracket) enrolled. Conversely, the age group of 3 to 4 year olds has the lowest likelihood of being enrolled in a private school, with 15 (100.0% in the age bracket) attending a public institution.
| Age Bracket | Public School | Private School |
| 3 to 4 Year Olds | 15 (100.0%) | 0 (0.0%) |
| 5 to 9 Year Old | 26 (100.0%) | 0 (0.0%) |
| 10 to 14 Year Olds | 49 (79.0%) | 13 (21.0%) |
| 15 to 17 Year Olds | 5 (100.0%) | 0 (0.0%) |
| 18 to 19 Year Olds | 0 (0.0%) | 0 (0.0%) |
| 20 to 24 Year Olds | 0 (0.0%) | 0 (0.0%) |
| 25 to 34 Year Olds | 3 (100.0%) | 0 (0.0%) |
| 35 Years and over | 0 (0.0%) | 0 (0.0%) |
| Total | 98 (88.3%) | 13 (11.7%) |
Educational Attainment by Field of Study in Tannersville
Education (24 | 30.0%), social sciences (21 | 26.3%), visual & performing arts (17 | 21.2%), bio, nature & agricultural (7 | 8.7%), and science & technology (7 | 8.7%) are the most common fields of study among 80 individuals in Tannersville who have obtained a bachelor's degree or higher.
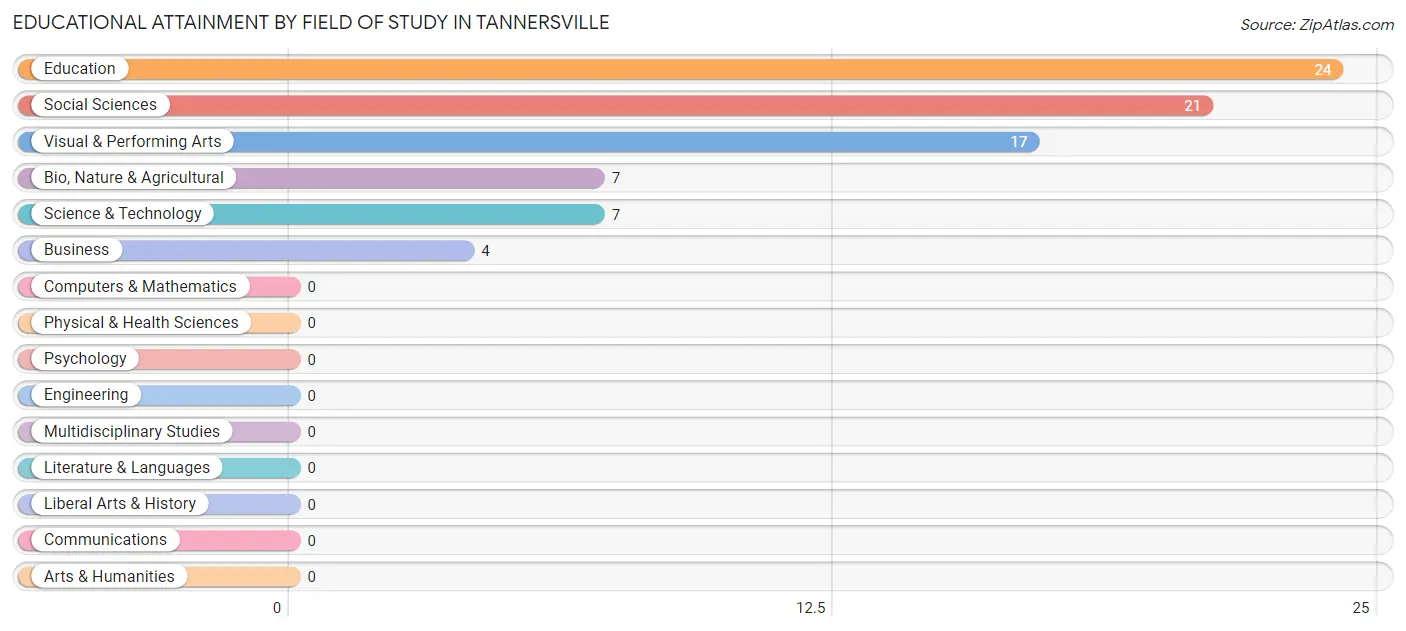
| Field of Study | # Graduates | % Graduates |
| Computers & Mathematics | 0 | 0.0% |
| Bio, Nature & Agricultural | 7 | 8.7% |
| Physical & Health Sciences | 0 | 0.0% |
| Psychology | 0 | 0.0% |
| Social Sciences | 21 | 26.3% |
| Engineering | 0 | 0.0% |
| Multidisciplinary Studies | 0 | 0.0% |
| Science & Technology | 7 | 8.7% |
| Business | 4 | 5.0% |
| Education | 24 | 30.0% |
| Literature & Languages | 0 | 0.0% |
| Liberal Arts & History | 0 | 0.0% |
| Visual & Performing Arts | 17 | 21.2% |
| Communications | 0 | 0.0% |
| Arts & Humanities | 0 | 0.0% |
| Total | 80 | 100.0% |
Transportation & Commute in Tannersville
Vehicle Availability by Sex in Tannersville
The most prevalent vehicle ownership categories in Tannersville are males with 2 vehicles (58, accounting for 50.4%) and females with 2 vehicles (38, making up 79.4%).
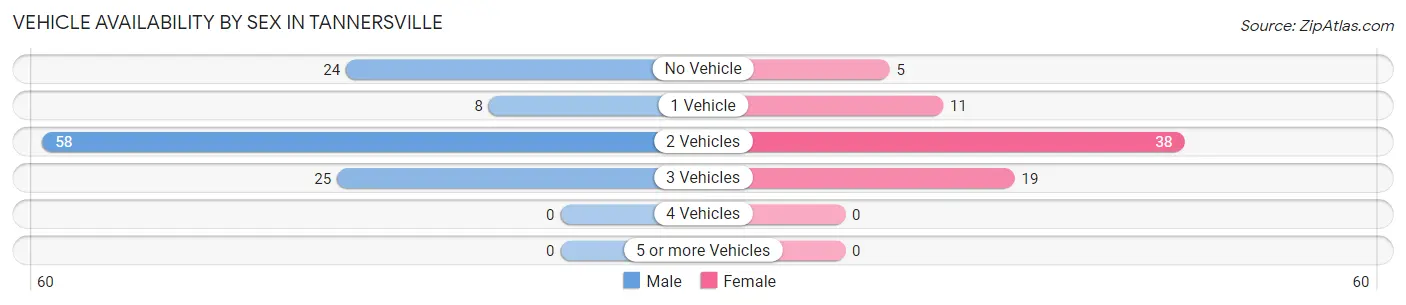
| Vehicles Available | Male | Female |
| No Vehicle | 24 (20.9%) | 5 (6.9%) |
| 1 Vehicle | 8 (7.0%) | 11 (15.1%) |
| 2 Vehicles | 58 (50.4%) | 38 (52.0%) |
| 3 Vehicles | 25 (21.7%) | 19 (26.0%) |
| 4 Vehicles | 0 (0.0%) | 0 (0.0%) |
| 5 or more Vehicles | 0 (0.0%) | 0 (0.0%) |
| Total | 115 (100.0%) | 73 (100.0%) |
Commute Time in Tannersville
The most frequently occuring commute durations in Tannersville are 5 to 9 minutes (33 commuters, 19.8%), 25 to 29 minutes (31 commuters, 18.6%), and 10 to 14 minutes (28 commuters, 16.8%).
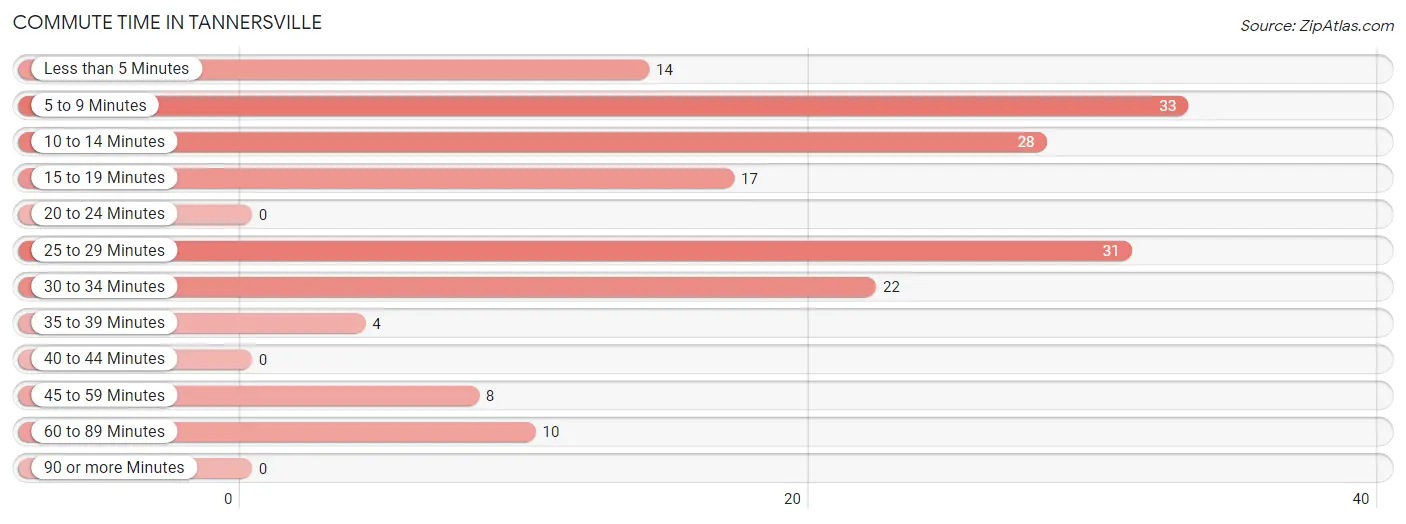
| Commute Time | # Commuters | % Commuters |
| Less than 5 Minutes | 14 | 8.4% |
| 5 to 9 Minutes | 33 | 19.8% |
| 10 to 14 Minutes | 28 | 16.8% |
| 15 to 19 Minutes | 17 | 10.2% |
| 20 to 24 Minutes | 0 | 0.0% |
| 25 to 29 Minutes | 31 | 18.6% |
| 30 to 34 Minutes | 22 | 13.2% |
| 35 to 39 Minutes | 4 | 2.4% |
| 40 to 44 Minutes | 0 | 0.0% |
| 45 to 59 Minutes | 8 | 4.8% |
| 60 to 89 Minutes | 10 | 6.0% |
| 90 or more Minutes | 0 | 0.0% |
Commute Time by Sex in Tannersville
The most common commute times in Tannersville are 25 to 29 minutes (31 commuters, 31.6%) for males and 5 to 9 minutes (27 commuters, 39.1%) for females.
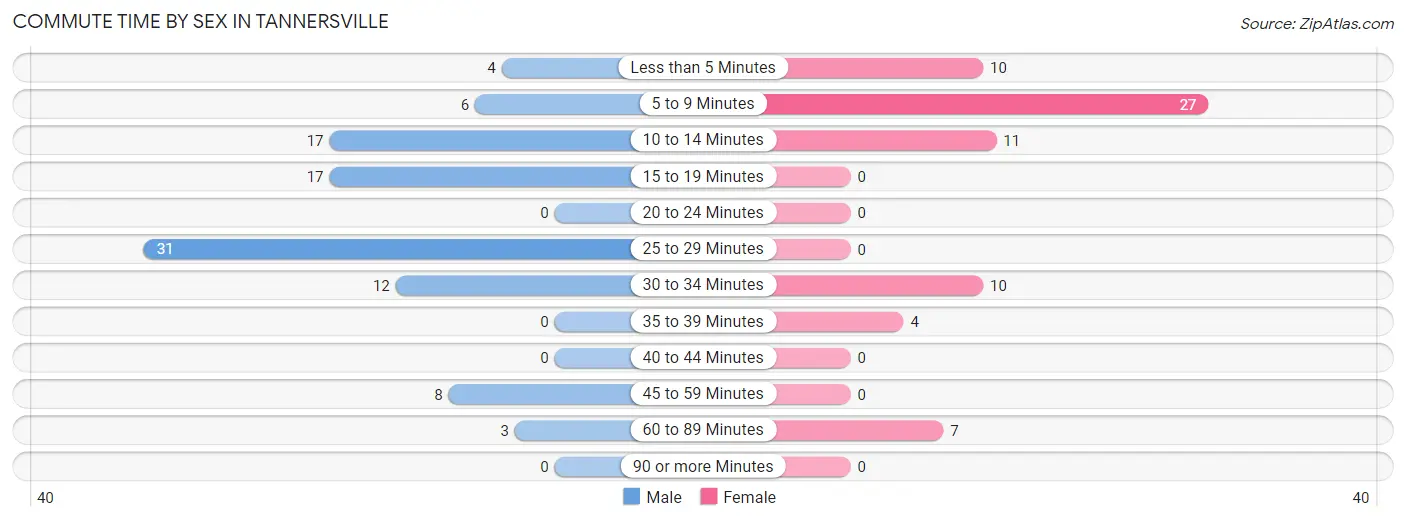
| Commute Time | Male | Female |
| Less than 5 Minutes | 4 (4.1%) | 10 (14.5%) |
| 5 to 9 Minutes | 6 (6.1%) | 27 (39.1%) |
| 10 to 14 Minutes | 17 (17.3%) | 11 (15.9%) |
| 15 to 19 Minutes | 17 (17.3%) | 0 (0.0%) |
| 20 to 24 Minutes | 0 (0.0%) | 0 (0.0%) |
| 25 to 29 Minutes | 31 (31.6%) | 0 (0.0%) |
| 30 to 34 Minutes | 12 (12.2%) | 10 (14.5%) |
| 35 to 39 Minutes | 0 (0.0%) | 4 (5.8%) |
| 40 to 44 Minutes | 0 (0.0%) | 0 (0.0%) |
| 45 to 59 Minutes | 8 (8.2%) | 0 (0.0%) |
| 60 to 89 Minutes | 3 (3.1%) | 7 (10.1%) |
| 90 or more Minutes | 0 (0.0%) | 0 (0.0%) |
Time of Departure to Work by Sex in Tannersville
The most frequent times of departure to work in Tannersville are 7:00 AM to 7:29 AM (24, 24.5%) for males and 7:00 AM to 7:29 AM (19, 27.5%) for females.
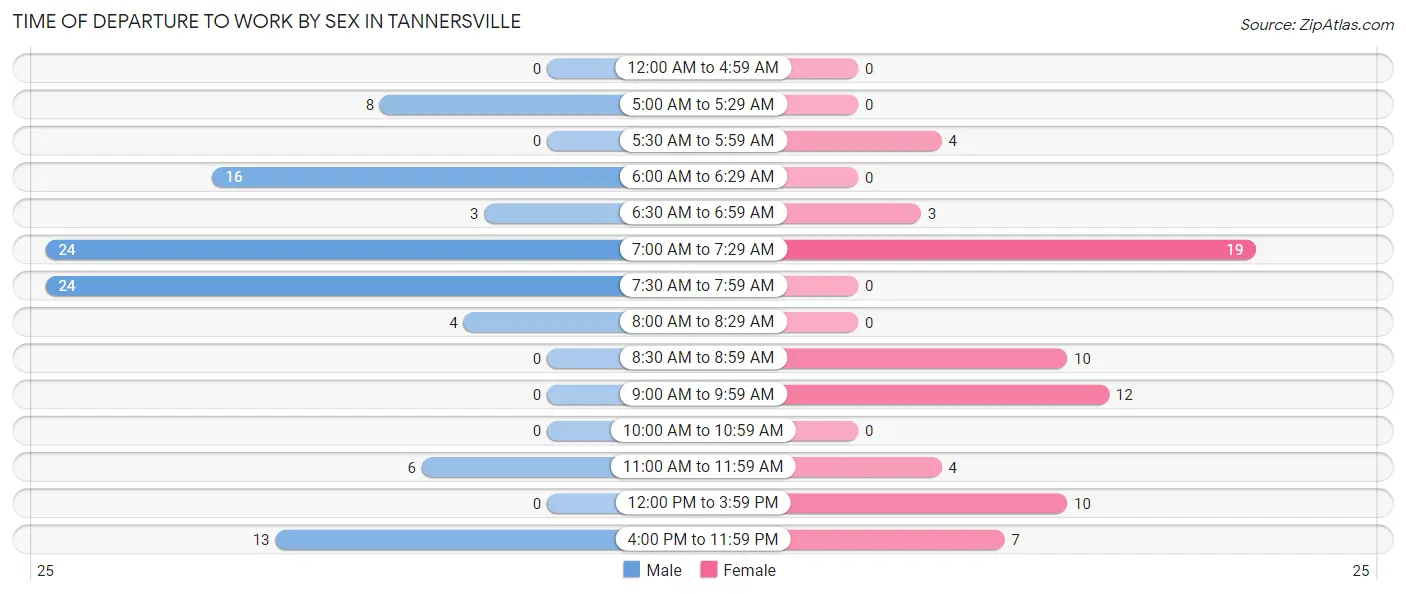
| Time of Departure | Male | Female |
| 12:00 AM to 4:59 AM | 0 (0.0%) | 0 (0.0%) |
| 5:00 AM to 5:29 AM | 8 (8.2%) | 0 (0.0%) |
| 5:30 AM to 5:59 AM | 0 (0.0%) | 4 (5.8%) |
| 6:00 AM to 6:29 AM | 16 (16.3%) | 0 (0.0%) |
| 6:30 AM to 6:59 AM | 3 (3.1%) | 3 (4.3%) |
| 7:00 AM to 7:29 AM | 24 (24.5%) | 19 (27.5%) |
| 7:30 AM to 7:59 AM | 24 (24.5%) | 0 (0.0%) |
| 8:00 AM to 8:29 AM | 4 (4.1%) | 0 (0.0%) |
| 8:30 AM to 8:59 AM | 0 (0.0%) | 10 (14.5%) |
| 9:00 AM to 9:59 AM | 0 (0.0%) | 12 (17.4%) |
| 10:00 AM to 10:59 AM | 0 (0.0%) | 0 (0.0%) |
| 11:00 AM to 11:59 AM | 6 (6.1%) | 4 (5.8%) |
| 12:00 PM to 3:59 PM | 0 (0.0%) | 10 (14.5%) |
| 4:00 PM to 11:59 PM | 13 (13.3%) | 7 (10.1%) |
| Total | 98 (100.0%) | 69 (100.0%) |
Housing Occupancy in Tannersville
Occupancy by Ownership in Tannersville
Of the total 143 dwellings in Tannersville, owner-occupied units account for 76 (53.1%), while renter-occupied units make up 67 (46.9%).
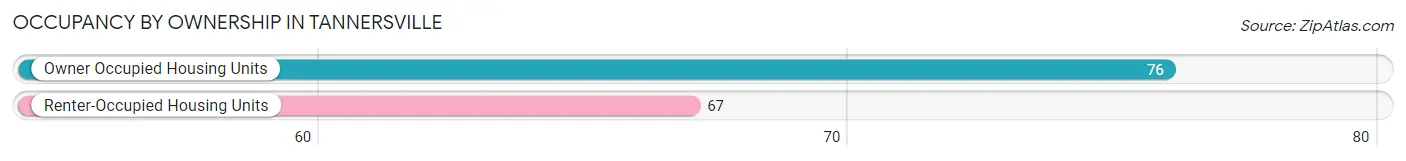
| Occupancy | # Housing Units | % Housing Units |
| Owner Occupied Housing Units | 76 | 53.1% |
| Renter-Occupied Housing Units | 67 | 46.9% |
| Total Occupied Housing Units | 143 | 100.0% |
Occupancy by Household Size in Tannersville
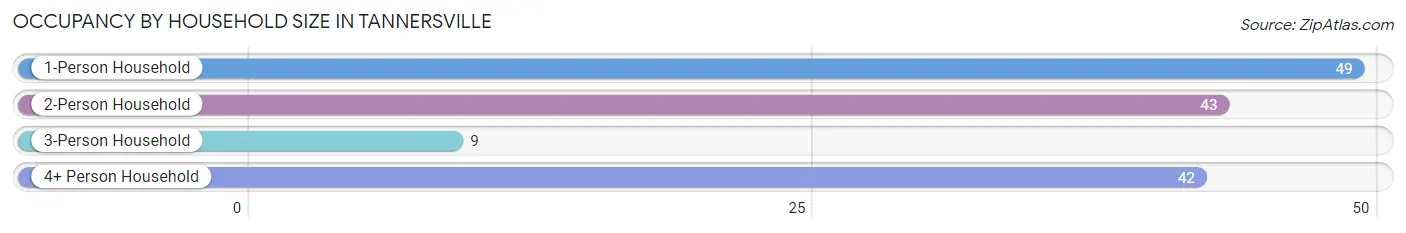
| Household Size | # Housing Units | % Housing Units |
| 1-Person Household | 49 | 34.3% |
| 2-Person Household | 43 | 30.1% |
| 3-Person Household | 9 | 6.3% |
| 4+ Person Household | 42 | 29.4% |
| Total Housing Units | 143 | 100.0% |
Occupancy by Ownership by Household Size in Tannersville
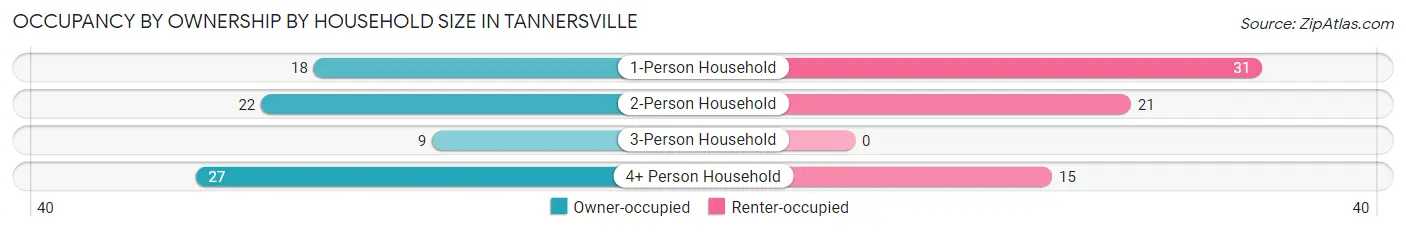
| Household Size | Owner-occupied | Renter-occupied |
| 1-Person Household | 18 (36.7%) | 31 (63.3%) |
| 2-Person Household | 22 (51.2%) | 21 (48.8%) |
| 3-Person Household | 9 (100.0%) | 0 (0.0%) |
| 4+ Person Household | 27 (64.3%) | 15 (35.7%) |
| Total Housing Units | 76 (53.1%) | 67 (46.9%) |
Occupancy by Educational Attainment in Tannersville
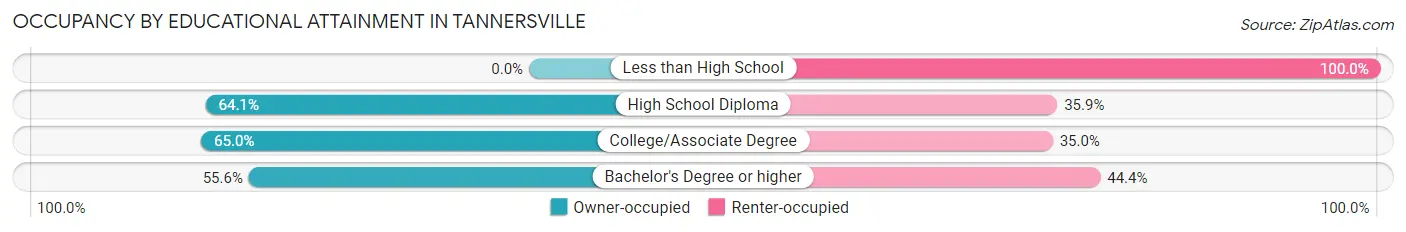
| Household Size | Owner-occupied | Renter-occupied |
| Less than High School | 0 (0.0%) | 19 (100.0%) |
| High School Diploma | 25 (64.1%) | 14 (35.9%) |
| College/Associate Degree | 26 (65.0%) | 14 (35.0%) |
| Bachelor's Degree or higher | 25 (55.6%) | 20 (44.4%) |
Occupancy by Age of Householder in Tannersville
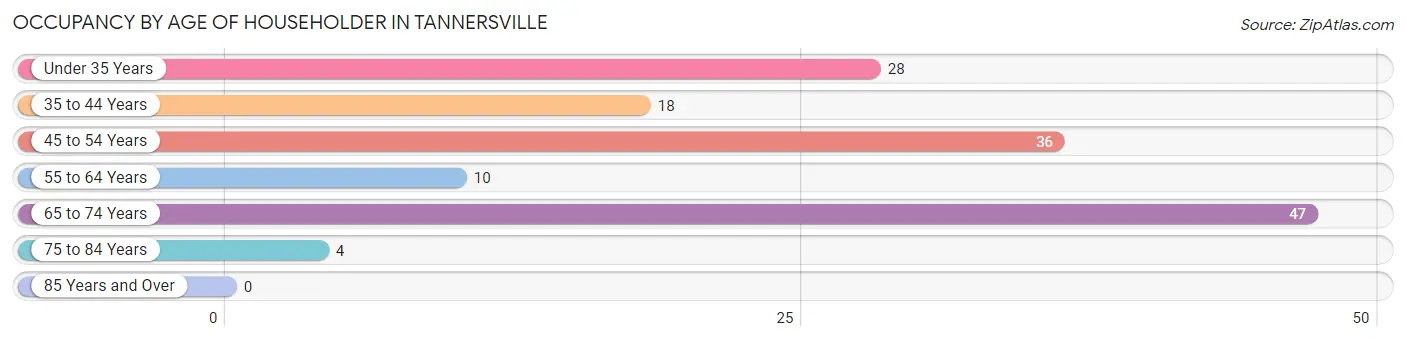
| Age Bracket | # Households | % Households |
| Under 35 Years | 28 | 19.6% |
| 35 to 44 Years | 18 | 12.6% |
| 45 to 54 Years | 36 | 25.2% |
| 55 to 64 Years | 10 | 7.0% |
| 65 to 74 Years | 47 | 32.9% |
| 75 to 84 Years | 4 | 2.8% |
| 85 Years and Over | 0 | 0.0% |
| Total | 143 | 100.0% |
Housing Finances in Tannersville
Median Income by Occupancy in Tannersville
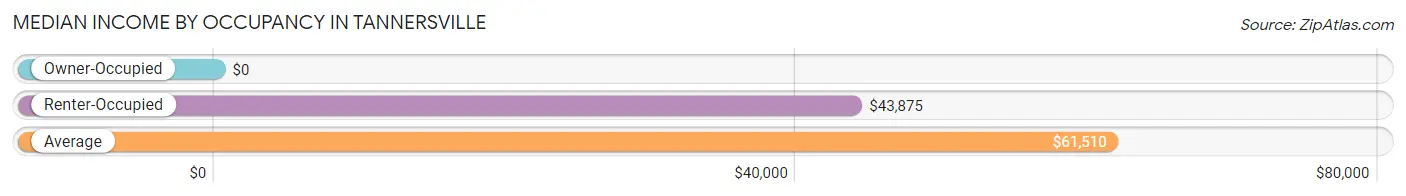
| Occupancy Type | # Households | Median Income |
| Owner-Occupied | 76 (53.1%) | $0 |
| Renter-Occupied | 67 (46.9%) | $43,875 |
| Average | 143 (100.0%) | $61,510 |
Occupancy by Householder Income Bracket in Tannersville
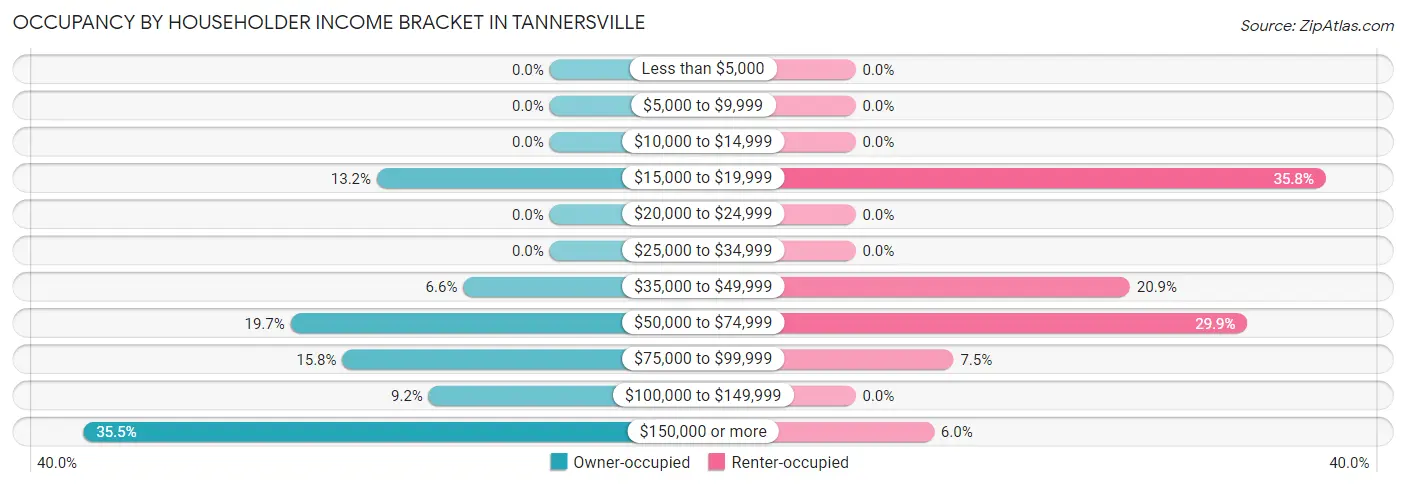
| Income Bracket | Owner-occupied | Renter-occupied |
| Less than $5,000 | 0 (0.0%) | 0 (0.0%) |
| $5,000 to $9,999 | 0 (0.0%) | 0 (0.0%) |
| $10,000 to $14,999 | 0 (0.0%) | 0 (0.0%) |
| $15,000 to $19,999 | 10 (13.2%) | 24 (35.8%) |
| $20,000 to $24,999 | 0 (0.0%) | 0 (0.0%) |
| $25,000 to $34,999 | 0 (0.0%) | 0 (0.0%) |
| $35,000 to $49,999 | 5 (6.6%) | 14 (20.9%) |
| $50,000 to $74,999 | 15 (19.7%) | 20 (29.8%) |
| $75,000 to $99,999 | 12 (15.8%) | 5 (7.5%) |
| $100,000 to $149,999 | 7 (9.2%) | 0 (0.0%) |
| $150,000 or more | 27 (35.5%) | 4 (6.0%) |
| Total | 76 (100.0%) | 67 (100.0%) |
Monthly Housing Cost Tiers in Tannersville
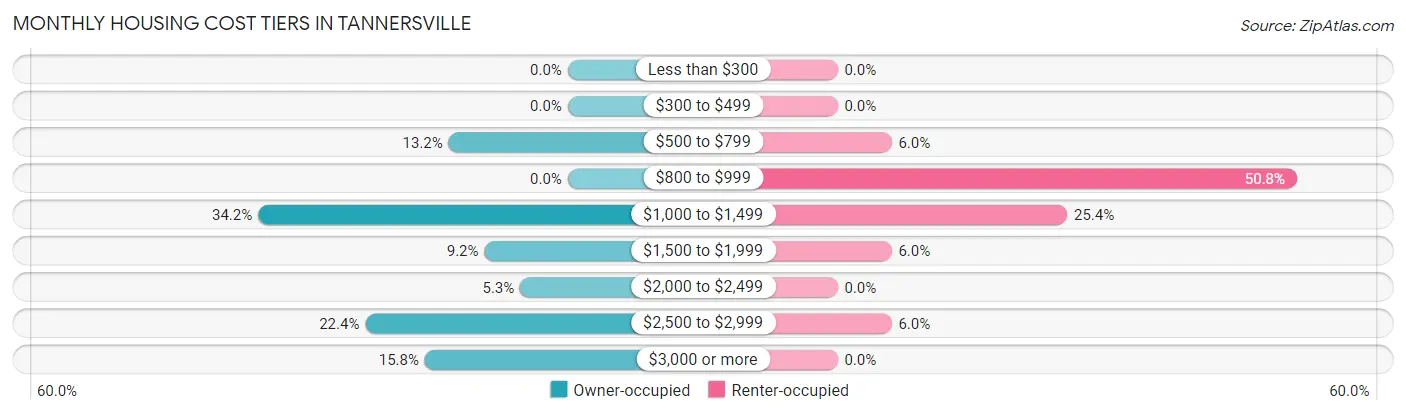
| Monthly Cost | Owner-occupied | Renter-occupied |
| Less than $300 | 0 (0.0%) | 0 (0.0%) |
| $300 to $499 | 0 (0.0%) | 0 (0.0%) |
| $500 to $799 | 10 (13.2%) | 4 (6.0%) |
| $800 to $999 | 0 (0.0%) | 34 (50.7%) |
| $1,000 to $1,499 | 26 (34.2%) | 17 (25.4%) |
| $1,500 to $1,999 | 7 (9.2%) | 4 (6.0%) |
| $2,000 to $2,499 | 4 (5.3%) | 0 (0.0%) |
| $2,500 to $2,999 | 17 (22.4%) | 4 (6.0%) |
| $3,000 or more | 12 (15.8%) | 0 (0.0%) |
| Total | 76 (100.0%) | 67 (100.0%) |
Physical Housing Characteristics in Tannersville
Housing Structures in Tannersville
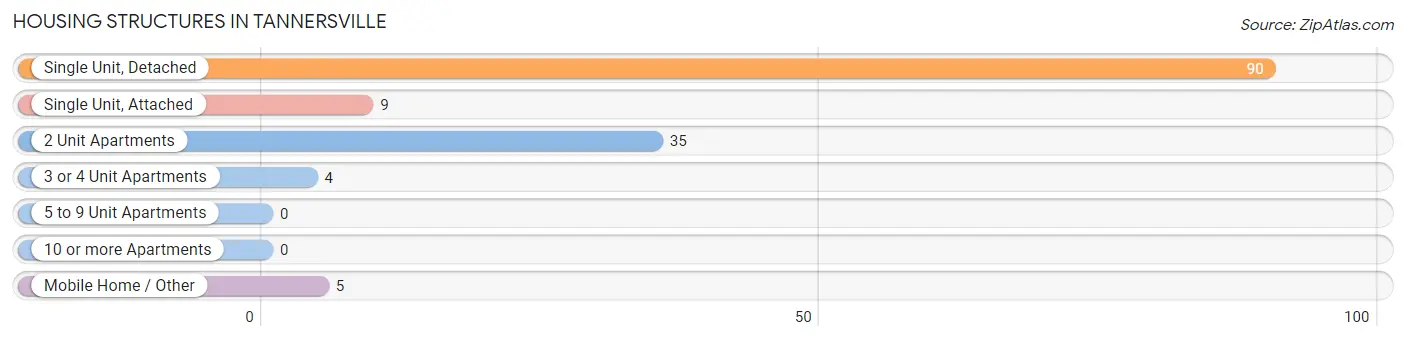
| Structure Type | # Housing Units | % Housing Units |
| Single Unit, Detached | 90 | 62.9% |
| Single Unit, Attached | 9 | 6.3% |
| 2 Unit Apartments | 35 | 24.5% |
| 3 or 4 Unit Apartments | 4 | 2.8% |
| 5 to 9 Unit Apartments | 0 | 0.0% |
| 10 or more Apartments | 0 | 0.0% |
| Mobile Home / Other | 5 | 3.5% |
| Total | 143 | 100.0% |
Housing Structures by Occupancy in Tannersville
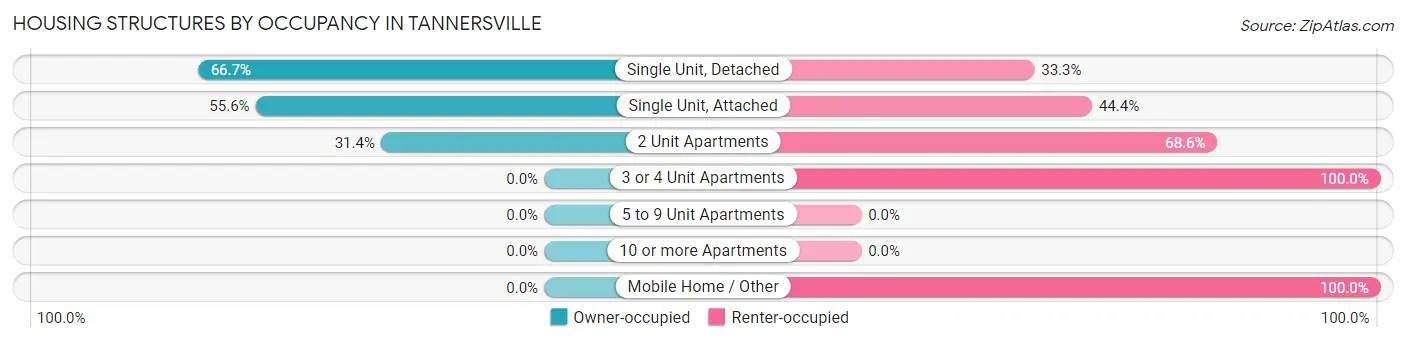
| Structure Type | Owner-occupied | Renter-occupied |
| Single Unit, Detached | 60 (66.7%) | 30 (33.3%) |
| Single Unit, Attached | 5 (55.6%) | 4 (44.4%) |
| 2 Unit Apartments | 11 (31.4%) | 24 (68.6%) |
| 3 or 4 Unit Apartments | 0 (0.0%) | 4 (100.0%) |
| 5 to 9 Unit Apartments | 0 (0.0%) | 0 (0.0%) |
| 10 or more Apartments | 0 (0.0%) | 0 (0.0%) |
| Mobile Home / Other | 0 (0.0%) | 5 (100.0%) |
| Total | 76 (53.1%) | 67 (46.9%) |
Housing Structures by Number of Rooms in Tannersville
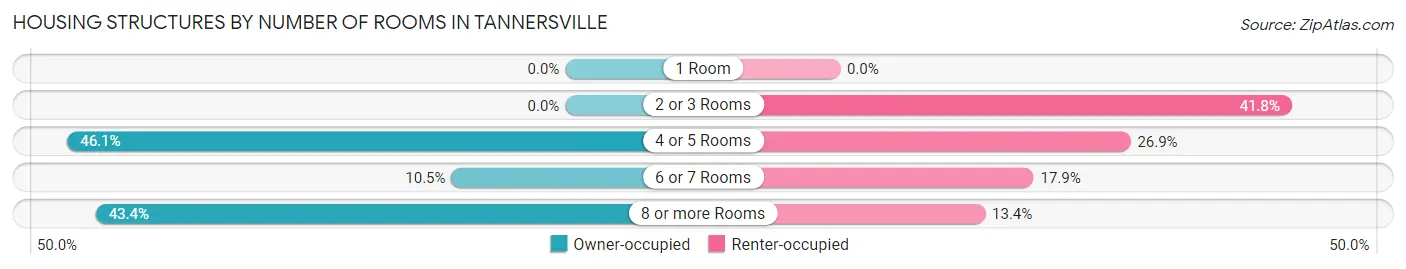
| Number of Rooms | Owner-occupied | Renter-occupied |
| 1 Room | 0 (0.0%) | 0 (0.0%) |
| 2 or 3 Rooms | 0 (0.0%) | 28 (41.8%) |
| 4 or 5 Rooms | 35 (46.1%) | 18 (26.9%) |
| 6 or 7 Rooms | 8 (10.5%) | 12 (17.9%) |
| 8 or more Rooms | 33 (43.4%) | 9 (13.4%) |
| Total | 76 (100.0%) | 67 (100.0%) |
Housing Structure by Heating Type in Tannersville
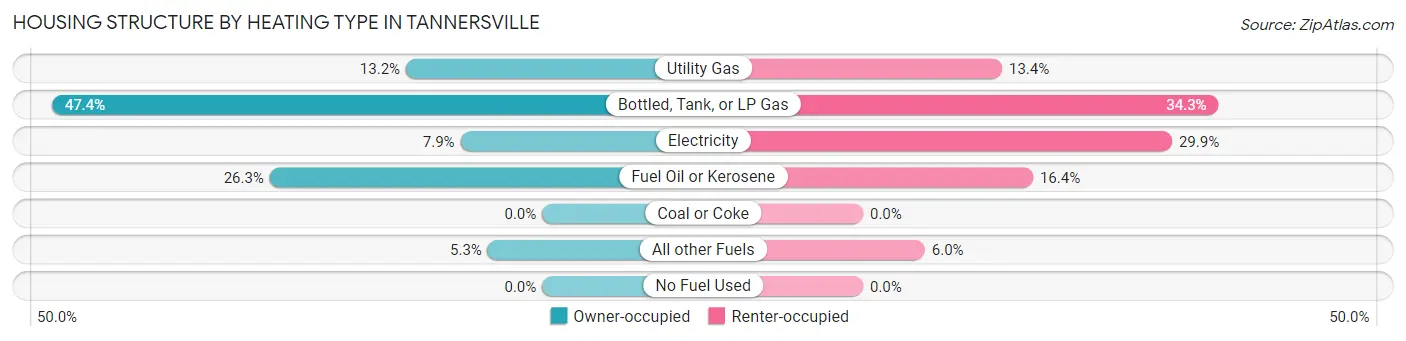
| Heating Type | Owner-occupied | Renter-occupied |
| Utility Gas | 10 (13.2%) | 9 (13.4%) |
| Bottled, Tank, or LP Gas | 36 (47.4%) | 23 (34.3%) |
| Electricity | 6 (7.9%) | 20 (29.8%) |
| Fuel Oil or Kerosene | 20 (26.3%) | 11 (16.4%) |
| Coal or Coke | 0 (0.0%) | 0 (0.0%) |
| All other Fuels | 4 (5.3%) | 4 (6.0%) |
| No Fuel Used | 0 (0.0%) | 0 (0.0%) |
| Total | 76 (100.0%) | 67 (100.0%) |
Household Vehicle Usage in Tannersville
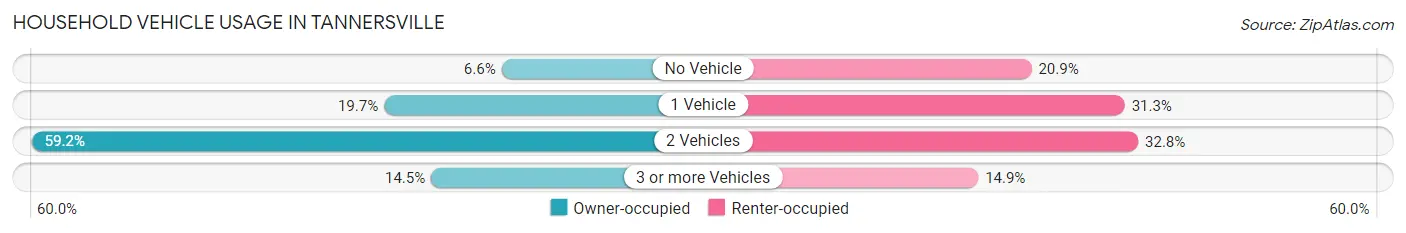
| Vehicles per Household | Owner-occupied | Renter-occupied |
| No Vehicle | 5 (6.6%) | 14 (20.9%) |
| 1 Vehicle | 15 (19.7%) | 21 (31.3%) |
| 2 Vehicles | 45 (59.2%) | 22 (32.8%) |
| 3 or more Vehicles | 11 (14.5%) | 10 (14.9%) |
| Total | 76 (100.0%) | 67 (100.0%) |
Real Estate & Mortgages in Tannersville
Real Estate and Mortgage Overview in Tannersville
| Characteristic | Without Mortgage | With Mortgage |
| Housing Units | 15 | 61 |
| Median Property Value | - | - |
| Median Household Income | - | - |
| Monthly Housing Costs | - | - |
| Real Estate Taxes | - | - |
Property Value by Mortgage Status in Tannersville
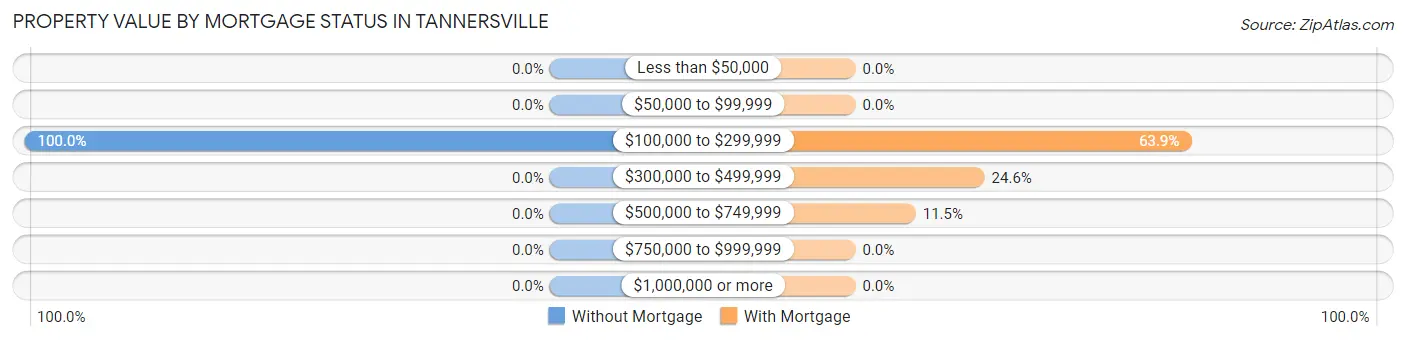
| Property Value | Without Mortgage | With Mortgage |
| Less than $50,000 | 0 (0.0%) | 0 (0.0%) |
| $50,000 to $99,999 | 0 (0.0%) | 0 (0.0%) |
| $100,000 to $299,999 | 15 (100.0%) | 39 (63.9%) |
| $300,000 to $499,999 | 0 (0.0%) | 15 (24.6%) |
| $500,000 to $749,999 | 0 (0.0%) | 7 (11.5%) |
| $750,000 to $999,999 | 0 (0.0%) | 0 (0.0%) |
| $1,000,000 or more | 0 (0.0%) | 0 (0.0%) |
| Total | 15 (100.0%) | 61 (100.0%) |
Household Income by Mortgage Status in Tannersville
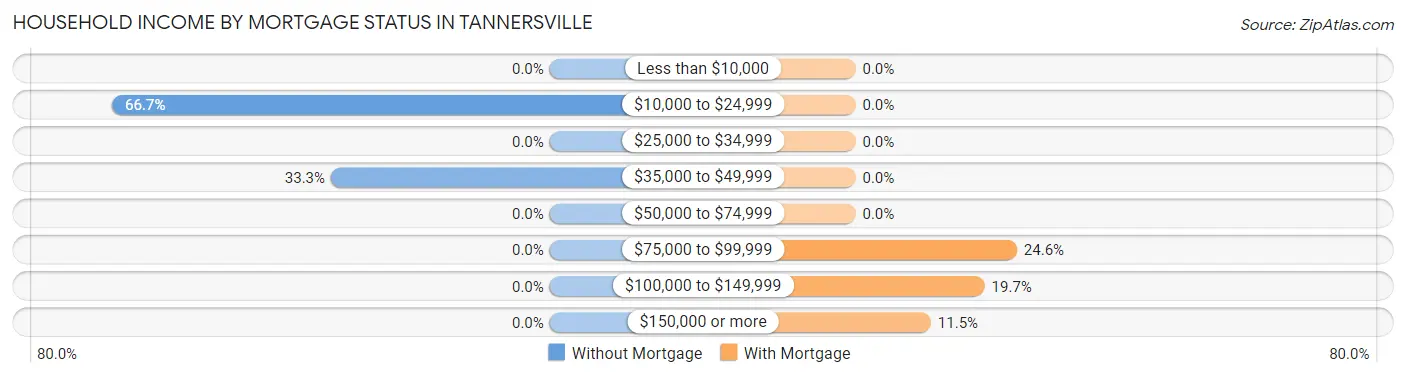
| Household Income | Without Mortgage | With Mortgage |
| Less than $10,000 | 0 (0.0%) | 0 (0.0%) |
| $10,000 to $24,999 | 10 (66.7%) | 0 (0.0%) |
| $25,000 to $34,999 | 0 (0.0%) | 0 (0.0%) |
| $35,000 to $49,999 | 5 (33.3%) | 0 (0.0%) |
| $50,000 to $74,999 | 0 (0.0%) | 0 (0.0%) |
| $75,000 to $99,999 | 0 (0.0%) | 15 (24.6%) |
| $100,000 to $149,999 | 0 (0.0%) | 12 (19.7%) |
| $150,000 or more | 0 (0.0%) | 7 (11.5%) |
| Total | 15 (100.0%) | 61 (100.0%) |
Property Value to Household Income Ratio in Tannersville
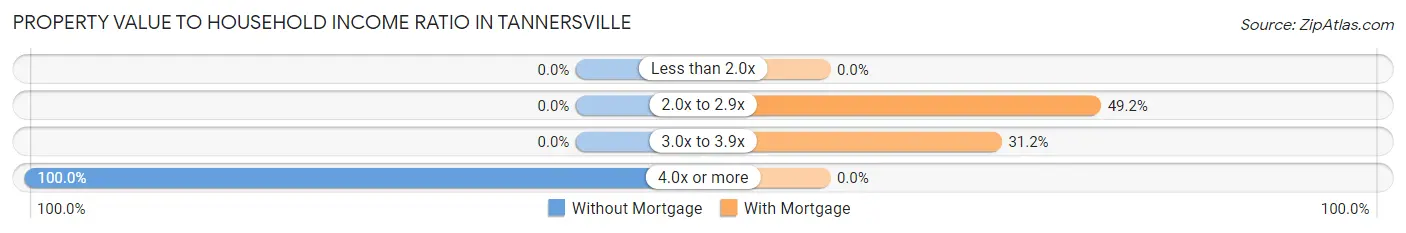
| Value-to-Income Ratio | Without Mortgage | With Mortgage |
| Less than 2.0x | 0 (0.0%) | 0 (0.0%) |
| 2.0x to 2.9x | 0 (0.0%) | 30 (49.2%) |
| 3.0x to 3.9x | 0 (0.0%) | 19 (31.1%) |
| 4.0x or more | 15 (100.0%) | 0 (0.0%) |
| Total | 15 (100.0%) | 61 (100.0%) |
Real Estate Taxes by Mortgage Status in Tannersville
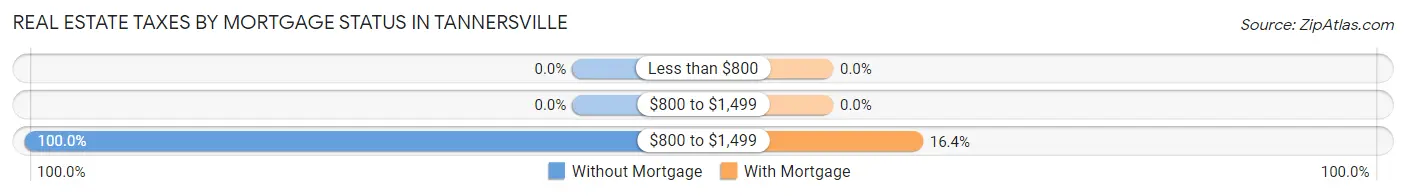
| Property Taxes | Without Mortgage | With Mortgage |
| Less than $800 | 0 (0.0%) | 0 (0.0%) |
| $800 to $1,499 | 0 (0.0%) | 0 (0.0%) |
| $800 to $1,499 | 15 (100.0%) | 10 (16.4%) |
| Total | 15 (100.0%) | 61 (100.0%) |
Health & Disability in Tannersville
Health Insurance Coverage by Age in Tannersville
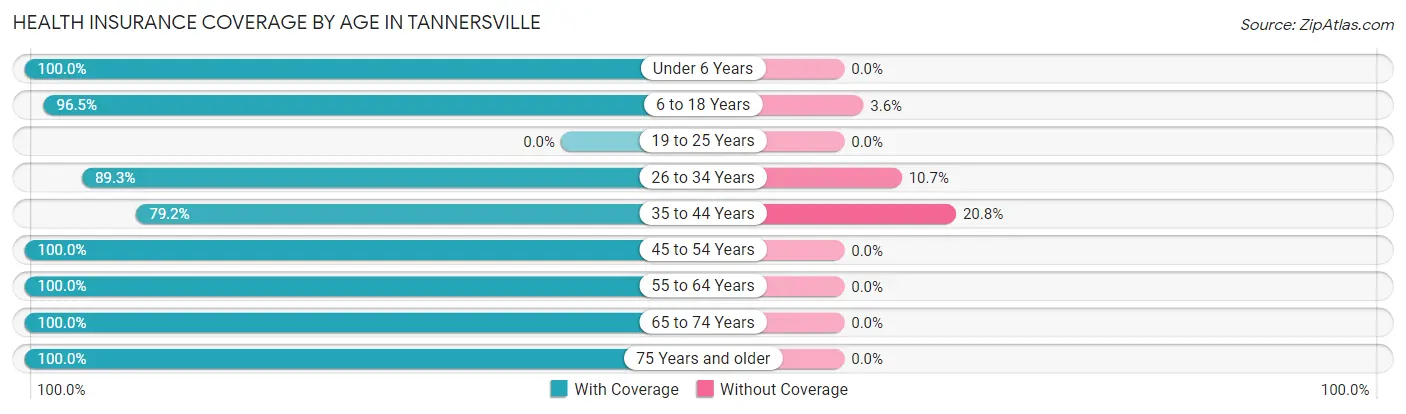
| Age Bracket | With Coverage | Without Coverage |
| Under 6 Years | 48 (100.0%) | 0 (0.0%) |
| 6 to 18 Years | 136 (96.5%) | 5 (3.5%) |
| 19 to 25 Years | 0 (0.0%) | 0 (0.0%) |
| 26 to 34 Years | 50 (89.3%) | 6 (10.7%) |
| 35 to 44 Years | 38 (79.2%) | 10 (20.8%) |
| 45 to 54 Years | 42 (100.0%) | 0 (0.0%) |
| 55 to 64 Years | 62 (100.0%) | 0 (0.0%) |
| 65 to 74 Years | 47 (100.0%) | 0 (0.0%) |
| 75 Years and older | 22 (100.0%) | 0 (0.0%) |
| Total | 445 (95.5%) | 21 (4.5%) |
Health Insurance Coverage by Citizenship Status in Tannersville

| Citizenship Status | With Coverage | Without Coverage |
| Native Born | 48 (100.0%) | 0 (0.0%) |
| Foreign Born, Citizen | 136 (96.5%) | 5 (3.5%) |
| Foreign Born, not a Citizen | 0 (0.0%) | 0 (0.0%) |
Health Insurance Coverage by Household Income in Tannersville
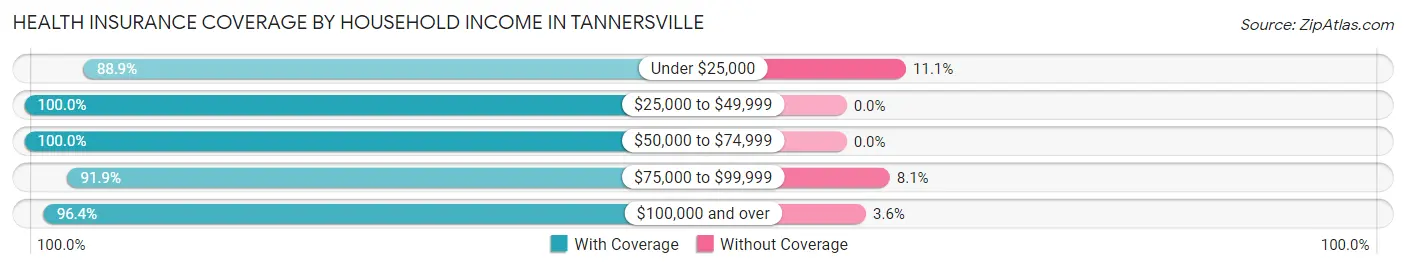
| Household Income | With Coverage | Without Coverage |
| Under $25,000 | 80 (88.9%) | 10 (11.1%) |
| $25,000 to $49,999 | 48 (100.0%) | 0 (0.0%) |
| $50,000 to $74,999 | 100 (100.0%) | 0 (0.0%) |
| $75,000 to $99,999 | 57 (91.9%) | 5 (8.1%) |
| $100,000 and over | 160 (96.4%) | 6 (3.6%) |
Public vs Private Health Insurance Coverage by Age in Tannersville
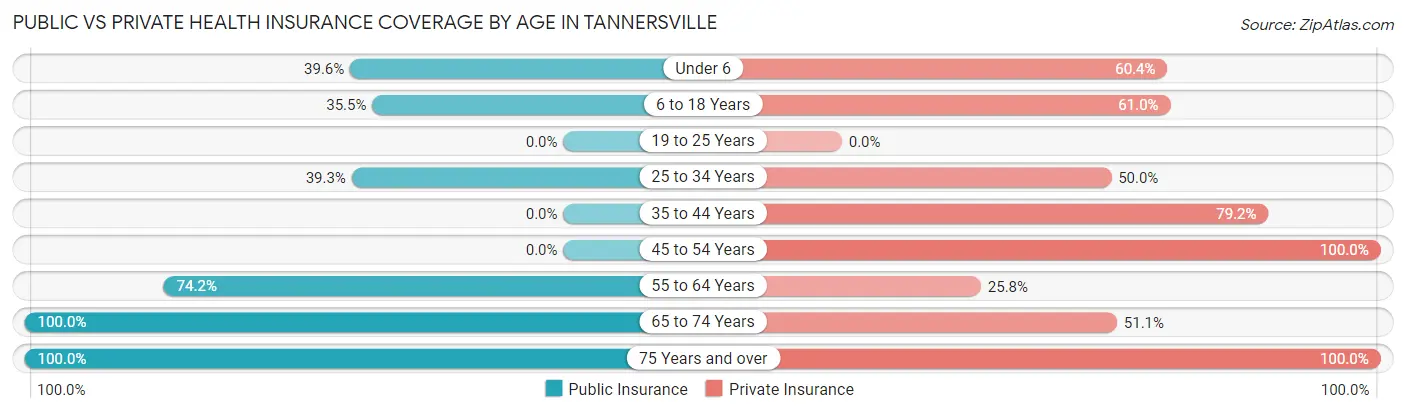
| Age Bracket | Public Insurance | Private Insurance |
| Under 6 | 19 (39.6%) | 29 (60.4%) |
| 6 to 18 Years | 50 (35.5%) | 86 (61.0%) |
| 19 to 25 Years | 0 (0.0%) | 0 (0.0%) |
| 25 to 34 Years | 22 (39.3%) | 28 (50.0%) |
| 35 to 44 Years | 0 (0.0%) | 38 (79.2%) |
| 45 to 54 Years | 0 (0.0%) | 42 (100.0%) |
| 55 to 64 Years | 46 (74.2%) | 16 (25.8%) |
| 65 to 74 Years | 47 (100.0%) | 24 (51.1%) |
| 75 Years and over | 22 (100.0%) | 22 (100.0%) |
| Total | 206 (44.2%) | 285 (61.2%) |
Disability Status by Sex by Age in Tannersville
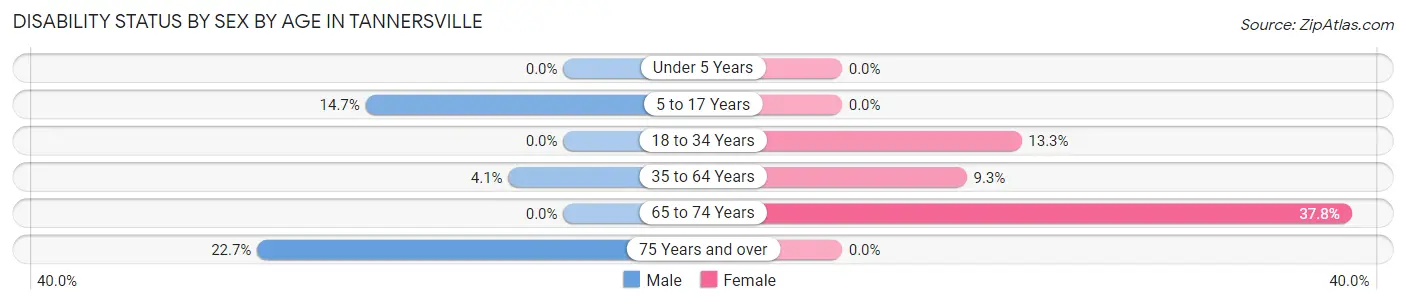
| Age Bracket | Male | Female |
| Under 5 Years | 0 (0.0%) | 0 (0.0%) |
| 5 to 17 Years | 16 (14.7%) | 0 (0.0%) |
| 18 to 34 Years | 0 (0.0%) | 4 (13.3%) |
| 35 to 64 Years | 4 (4.1%) | 5 (9.3%) |
| 65 to 74 Years | 0 (0.0%) | 14 (37.8%) |
| 75 Years and over | 5 (22.7%) | 0 (0.0%) |
Disability Class by Sex by Age in Tannersville
Disability Class: Hearing Difficulty
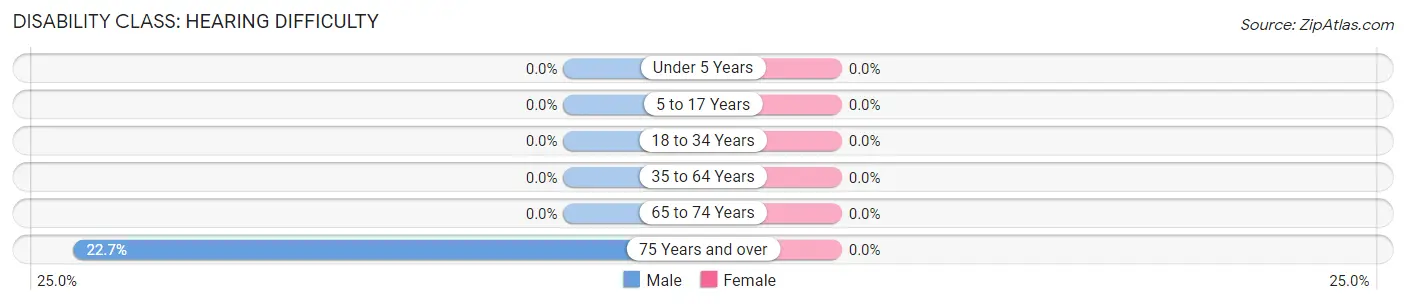
| Age Bracket | Male | Female |
| Under 5 Years | 0 (0.0%) | 0 (0.0%) |
| 5 to 17 Years | 0 (0.0%) | 0 (0.0%) |
| 18 to 34 Years | 0 (0.0%) | 0 (0.0%) |
| 35 to 64 Years | 0 (0.0%) | 0 (0.0%) |
| 65 to 74 Years | 0 (0.0%) | 0 (0.0%) |
| 75 Years and over | 5 (22.7%) | 0 (0.0%) |
Disability Class: Vision Difficulty
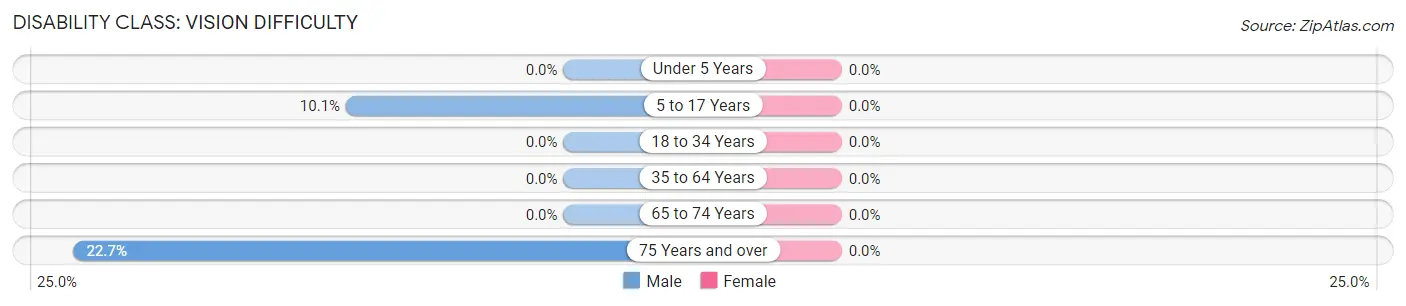
| Age Bracket | Male | Female |
| Under 5 Years | 0 (0.0%) | 0 (0.0%) |
| 5 to 17 Years | 11 (10.1%) | 0 (0.0%) |
| 18 to 34 Years | 0 (0.0%) | 0 (0.0%) |
| 35 to 64 Years | 0 (0.0%) | 0 (0.0%) |
| 65 to 74 Years | 0 (0.0%) | 0 (0.0%) |
| 75 Years and over | 5 (22.7%) | 0 (0.0%) |
Disability Class: Cognitive Difficulty
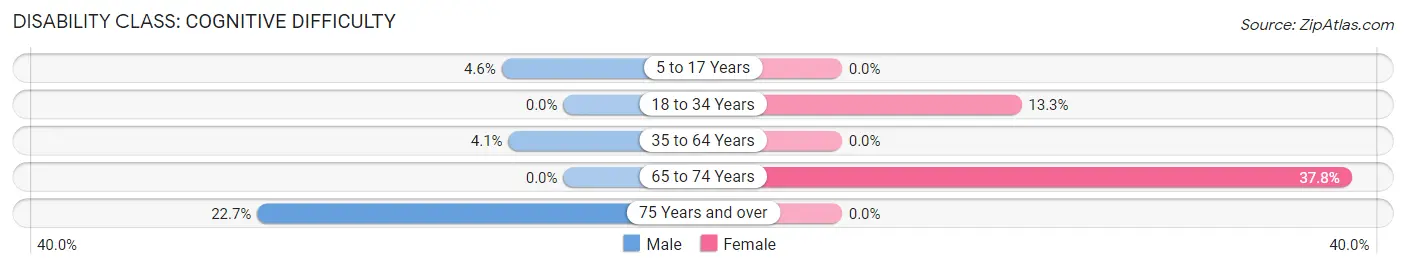
| Age Bracket | Male | Female |
| 5 to 17 Years | 5 (4.6%) | 0 (0.0%) |
| 18 to 34 Years | 0 (0.0%) | 4 (13.3%) |
| 35 to 64 Years | 4 (4.1%) | 0 (0.0%) |
| 65 to 74 Years | 0 (0.0%) | 14 (37.8%) |
| 75 Years and over | 5 (22.7%) | 0 (0.0%) |
Disability Class: Ambulatory Difficulty
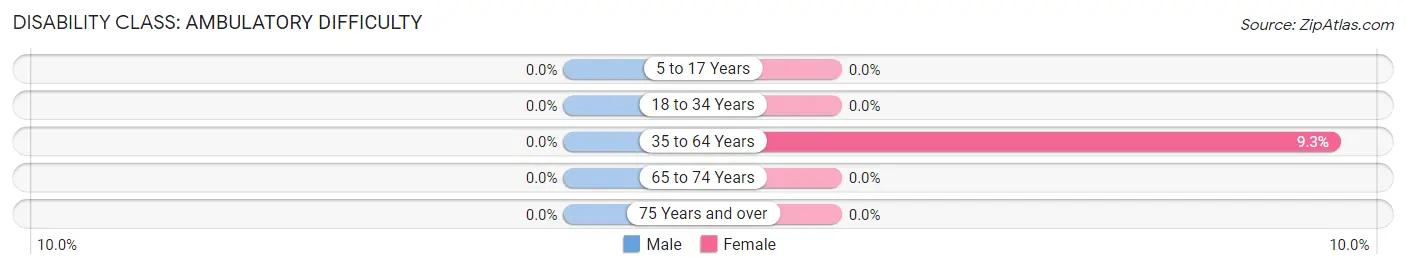
| Age Bracket | Male | Female |
| 5 to 17 Years | 0 (0.0%) | 0 (0.0%) |
| 18 to 34 Years | 0 (0.0%) | 0 (0.0%) |
| 35 to 64 Years | 0 (0.0%) | 5 (9.3%) |
| 65 to 74 Years | 0 (0.0%) | 0 (0.0%) |
| 75 Years and over | 0 (0.0%) | 0 (0.0%) |
Disability Class: Self-Care Difficulty
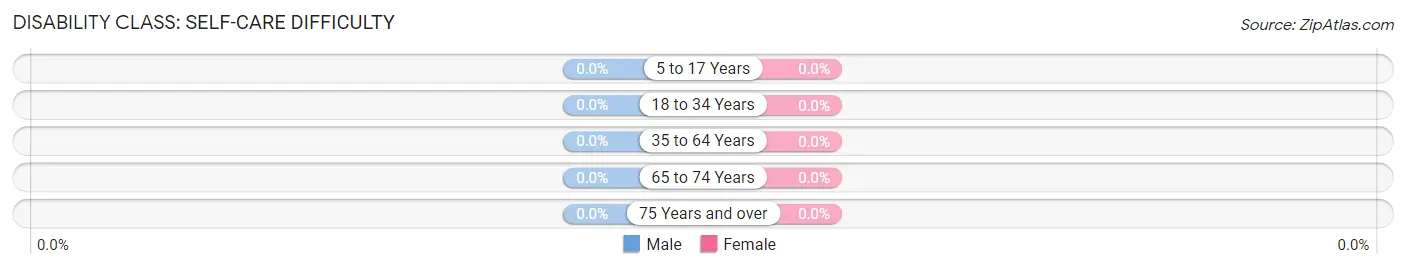
| Age Bracket | Male | Female |
| 5 to 17 Years | 0 (0.0%) | 0 (0.0%) |
| 18 to 34 Years | 0 (0.0%) | 0 (0.0%) |
| 35 to 64 Years | 0 (0.0%) | 0 (0.0%) |
| 65 to 74 Years | 0 (0.0%) | 0 (0.0%) |
| 75 Years and over | 0 (0.0%) | 0 (0.0%) |
Technology Access in Tannersville
Computing Device Access in Tannersville
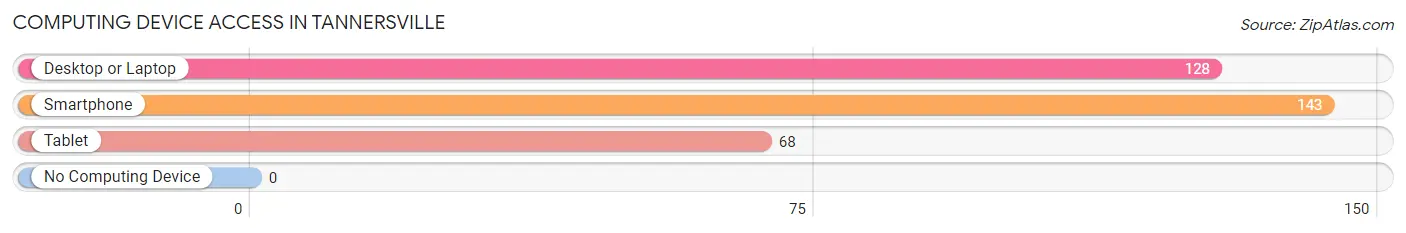
| Device Type | # Households | % Households |
| Desktop or Laptop | 128 | 89.5% |
| Smartphone | 143 | 100.0% |
| Tablet | 68 | 47.5% |
| No Computing Device | 0 | 0.0% |
| Total | 143 | 100.0% |
Internet Access in Tannersville
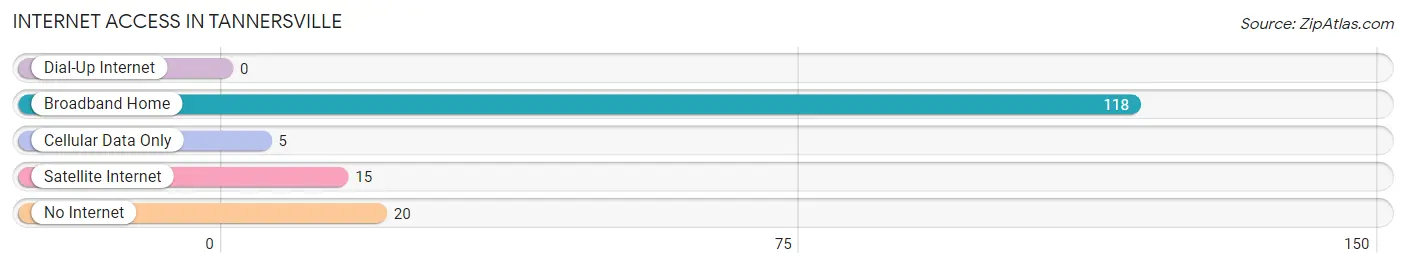
| Internet Type | # Households | % Households |
| Dial-Up Internet | 0 | 0.0% |
| Broadband Home | 118 | 82.5% |
| Cellular Data Only | 5 | 3.5% |
| Satellite Internet | 15 | 10.5% |
| No Internet | 20 | 14.0% |
| Total | 143 | 100.0% |
Tannersville Summary
Tannersville is a hamlet located in the town of Hunter in Greene County, New York. It is situated in the Catskill Mountains, about two hours north of New York City. The hamlet is a popular tourist destination, known for its outdoor activities, such as skiing, hiking, and camping.
History
Tannersville was first settled in the late 1700s by a group of German immigrants. The hamlet was originally known as “Tannersville Station”, as it was a stop on the Ulster and Delaware Railroad. The railroad was built in the late 1800s to transport coal and other goods from the Catskill Mountains to the Hudson River.
In the early 1900s, Tannersville became a popular tourist destination. The area was known for its scenic beauty and outdoor activities, such as skiing, hiking, and camping. The hamlet was also home to several resorts, including the Kaaterskill Hotel and the Tannersville Inn.
In the 1950s, Tannersville began to decline as a tourist destination. The resorts closed and the population decreased. However, in the late 1970s, the hamlet experienced a resurgence in popularity. The area was rediscovered by skiers and hikers, and the hamlet began to attract new businesses and residents.
Geography
Tannersville is located in the Catskill Mountains, about two hours north of New York City. The hamlet is situated at an elevation of 1,400 feet, and is surrounded by mountains and forests. The Kaaterskill Creek runs through the hamlet, and the nearby Kaaterskill Falls is a popular tourist attraction.
The climate in Tannersville is generally mild, with cold winters and warm summers. The average temperature in the winter is around 25 degrees Fahrenheit, and the average temperature in the summer is around 70 degrees Fahrenheit.
Economy
Tannersville’s economy is largely based on tourism. The hamlet is home to several ski resorts, including Hunter Mountain and Windham Mountain. The area is also popular for its outdoor activities, such as hiking, camping, and fishing.
In addition to tourism, Tannersville is home to several small businesses, including restaurants, shops, and galleries. The hamlet is also home to several bed and breakfasts, as well as a few small hotels.
Demographics
As of the 2010 census, the population of Tannersville was 1,845. The population is largely white (94.3%), with a small percentage of African Americans (2.2%) and Hispanics (2.2%). The median household income is $45,000, and the median age is 44.
Tannersville is a small, close-knit community. The hamlet is home to several churches, and the local school district serves students from kindergarten through 12th grade. The hamlet is also home to several parks and recreational areas, including the Kaaterskill Falls State Park.
Common Questions
What is the Total Population of Tannersville?
Total Population of Tannersville is 466.
What is the Total Male Population of Tannersville?
Total Male Population of Tannersville is 288.
What is the Total Female Population of Tannersville?
Total Female Population of Tannersville is 178.
What is the Ratio of Males per 100 Females in Tannersville?
There are 161.80 Males per 100 Females in Tannersville.
What is the Ratio of Females per 100 Males in Tannersville?
There are 61.81 Females per 100 Males in Tannersville.
What is the Median Population Age in Tannersville?
Median Population Age in Tannersville is 33.9 Years.
What is the Average Family Size in Tannersville
Average Family Size in Tannersville is 4.5 People.
What is the Average Household Size in Tannersville
Average Household Size in Tannersville is 3.3 People.
What is Per Capita Income in Tannersville?
Per Capita income in Tannersville is $30,897.
What is the Median Family Income in Tannersville?
Median Family Income in Tannersville is $78,214.
What is the Median Household income in Tannersville?
Median Household Income in Tannersville is $61,510.
What is Income or Wage Gap in Tannersville?
Income or Wage Gap in Tannersville is 31.4%.
Women in Tannersville earn 68.6 cents for every dollar earned by a man.
What is Inequality or Gini Index in Tannersville?
Inequality or Gini Index in Tannersville is 0.47.
How Large is the Labor Force in Tannersville?
There are 207 People in the Labor Forcein in Tannersville.
What is the Percentage of People in the Labor Force in Tannersville?
73.4% of People are in the Labor Force in Tannersville.
What is the Unemployment Rate in Tannersville?
Unemployment Rate in Tannersville is 7.7%.