Cities with the Highest Percentage of Mexican Population in New York
RELATED REPORTS & OPTIONS
Mexican
New York
Compare Cities
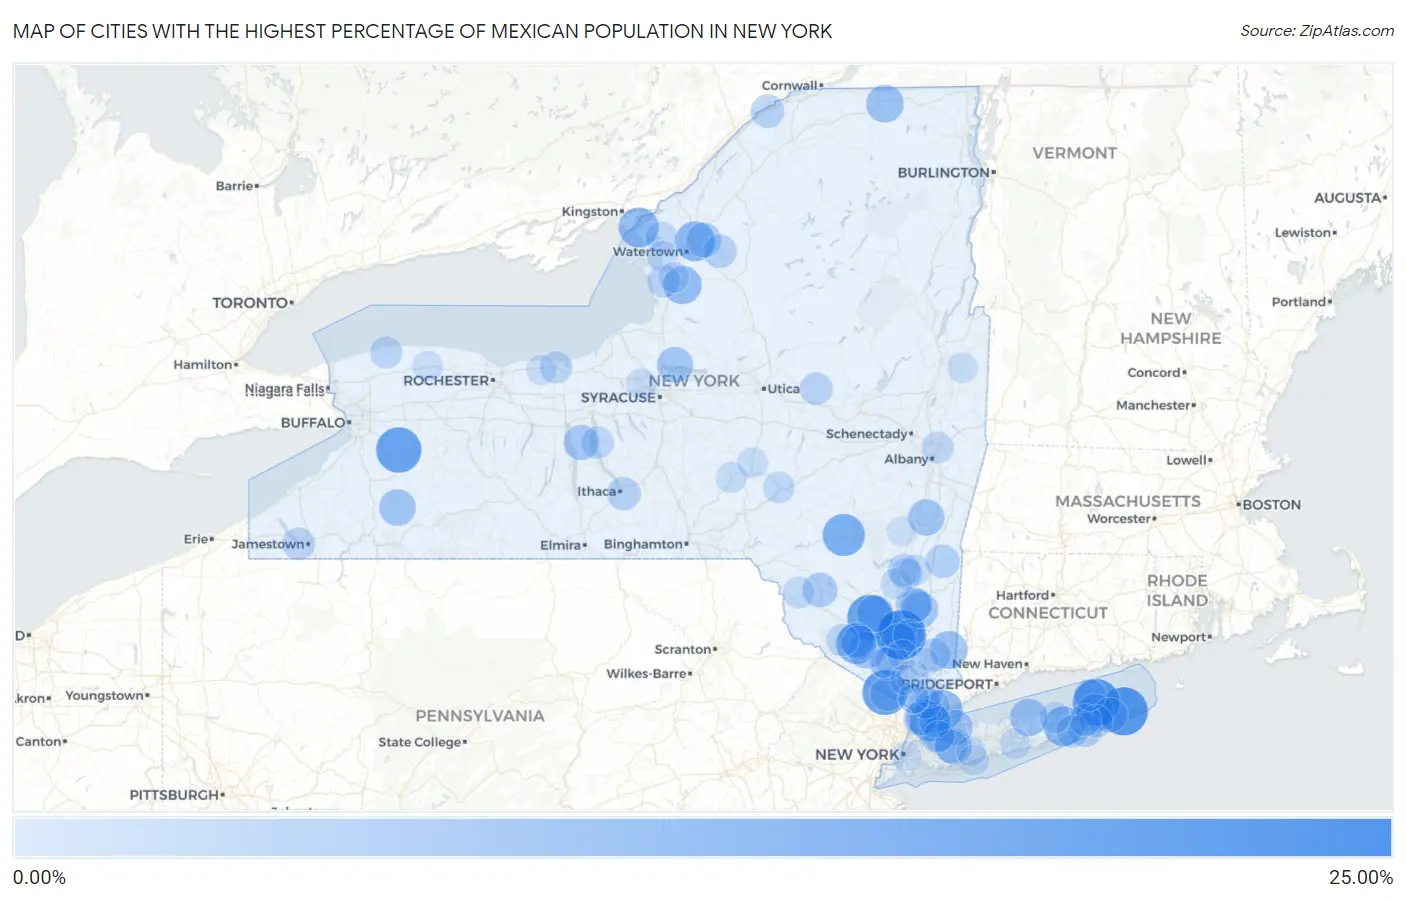
Map of Cities with the Highest Percentage of Mexican Population in New York
0.00%
25.00%
Cities with the Highest Percentage of Mexican Population in New York
| City | Mexican | vs State | vs National | |
| 1. | Newburgh | 22.19% | 2.46%(+19.7)#1 | 11.22%(+11.0)#2,805 |
| 2. | Napeague | 20.78% | 2.46%(+18.3)#2 | 11.22%(+9.56)#2,963 |
| 3. | Shelter Island | 19.70% | 2.46%(+17.2)#3 | 11.22%(+8.48)#3,116 |
| 4. | Pine Bush | 18.20% | 2.46%(+15.7)#4 | 11.22%(+6.98)#3,319 |
| 5. | Strykersville | 17.97% | 2.46%(+15.5)#5 | 11.22%(+6.75)#3,353 |
| 6. | Hillburn | 17.86% | 2.46%(+15.4)#6 | 11.22%(+6.64)#3,370 |
| 7. | Fleischmanns | 15.00% | 2.46%(+12.5)#7 | 11.22%(+3.78)#3,879 |
| 8. | Middletown | 13.39% | 2.46%(+10.9)#8 | 11.22%(+2.17)#4,251 |
| 9. | Port Chester | 13.00% | 2.46%(+10.5)#9 | 11.22%(+1.78)#4,339 |
| 10. | New Rochelle | 12.94% | 2.46%(+10.5)#10 | 11.22%(+1.72)#4,351 |
| 11. | Cape Vincent | 12.94% | 2.46%(+10.5)#11 | 11.22%(+1.72)#4,352 |
| 12. | Flanders | 12.81% | 2.46%(+10.3)#12 | 11.22%(+1.59)#4,392 |
| 13. | Calcium | 12.78% | 2.46%(+10.3)#13 | 11.22%(+1.56)#4,398 |
| 14. | Lorraine | 11.40% | 2.46%(+8.95)#14 | 11.22%(+0.184)#4,777 |
| 15. | Gardnertown | 10.93% | 2.46%(+8.47)#15 | 11.22%(-0.288)#4,918 |
| 16. | Brewster | 10.85% | 2.46%(+8.40)#16 | 11.22%(-0.365)#4,947 |
| 17. | Burke | 10.55% | 2.46%(+8.09)#17 | 11.22%(-0.666)#5,051 |
| 18. | Shoreham | 10.49% | 2.46%(+8.03)#18 | 11.22%(-0.728)#5,075 |
| 19. | Noyack | 10.30% | 2.46%(+7.84)#19 | 11.22%(-0.921)#5,141 |
| 20. | Goshen | 9.94% | 2.46%(+7.48)#20 | 11.22%(-1.28)#5,276 |
| 21. | Watchtower | 9.91% | 2.46%(+7.45)#21 | 11.22%(-1.31)#5,290 |
| 22. | Franklinville | 9.68% | 2.46%(+7.22)#22 | 11.22%(-1.54)#5,378 |
| 23. | Athens | 9.45% | 2.46%(+6.99)#23 | 11.22%(-1.77)#5,478 |
| 24. | Titusville | 9.30% | 2.46%(+6.84)#24 | 11.22%(-1.92)#5,539 |
| 25. | New Cassel | 9.27% | 2.46%(+6.82)#25 | 11.22%(-1.94)#5,551 |
| 26. | Constantia | 9.26% | 2.46%(+6.80)#26 | 11.22%(-1.96)#5,558 |
| 27. | Tuckahoe | 9.14% | 2.46%(+6.68)#27 | 11.22%(-2.08)#5,604 |
| 28. | New Baltimore | 9.01% | 2.46%(+6.55)#28 | 11.22%(-2.21)#5,664 |
| 29. | Manorhaven | 8.85% | 2.46%(+6.39)#29 | 11.22%(-2.37)#5,728 |
| 30. | Romulus | 8.62% | 2.46%(+6.16)#30 | 11.22%(-2.60)#5,839 |
| 31. | Mill Neck | 8.57% | 2.46%(+6.12)#31 | 11.22%(-2.65)#5,858 |
| 32. | Vails Gate | 8.50% | 2.46%(+6.05)#32 | 11.22%(-2.72)#5,897 |
| 33. | Washington Heights | 8.27% | 2.46%(+5.81)#33 | 11.22%(-2.95)#6,029 |
| 34. | Poughkeepsie | 8.19% | 2.46%(+5.73)#34 | 11.22%(-3.03)#6,067 |
| 35. | Fort Drum | 7.93% | 2.46%(+5.48)#35 | 11.22%(-3.29)#6,219 |
| 36. | Suffern | 7.90% | 2.46%(+5.44)#36 | 11.22%(-3.32)#6,228 |
| 37. | East Hampton North | 7.88% | 2.46%(+5.42)#37 | 11.22%(-3.34)#6,244 |
| 38. | Liberty | 7.87% | 2.46%(+5.41)#38 | 11.22%(-3.35)#6,246 |
| 39. | Mechanicstown | 7.42% | 2.46%(+4.97)#39 | 11.22%(-3.79)#6,492 |
| 40. | White Plains | 7.29% | 2.46%(+4.83)#40 | 11.22%(-3.93)#6,562 |
| 41. | Ruby | 7.23% | 2.46%(+4.77)#41 | 11.22%(-3.99)#6,598 |
| 42. | Southampton | 7.19% | 2.46%(+4.73)#42 | 11.22%(-4.03)#6,624 |
| 43. | Niagara University | 7.14% | 2.46%(+4.68)#43 | 11.22%(-4.08)#6,640 |
| 44. | Pine Plains | 6.94% | 2.46%(+4.48)#44 | 11.22%(-4.28)#6,760 |
| 45. | Westbury | 6.88% | 2.46%(+4.43)#45 | 11.22%(-4.33)#6,803 |
| 46. | Mahopac | 6.80% | 2.46%(+4.35)#46 | 11.22%(-4.41)#6,850 |
| 47. | West Carthage | 6.80% | 2.46%(+4.34)#47 | 11.22%(-4.42)#6,852 |
| 48. | Waddington | 6.70% | 2.46%(+4.24)#48 | 11.22%(-4.52)#6,925 |
| 49. | Yonkers | 6.67% | 2.46%(+4.22)#49 | 11.22%(-4.55)#6,936 |
| 50. | East Ithaca | 6.60% | 2.46%(+4.15)#50 | 11.22%(-4.61)#6,989 |
| 51. | Woodbury | 6.43% | 2.46%(+3.97)#51 | 11.22%(-4.79)#7,114 |
| 52. | Arlington | 6.36% | 2.46%(+3.90)#52 | 11.22%(-4.86)#7,169 |
| 53. | Belleville | 6.23% | 2.46%(+3.77)#53 | 11.22%(-4.99)#7,281 |
| 54. | Harriman | 6.19% | 2.46%(+3.73)#54 | 11.22%(-5.03)#7,305 |
| 55. | Dolgeville | 6.19% | 2.46%(+3.73)#55 | 11.22%(-5.03)#7,306 |
| 56. | Bridgehampton | 5.99% | 2.46%(+3.54)#56 | 11.22%(-5.22)#7,442 |
| 57. | Fly Creek | 5.99% | 2.46%(+3.53)#57 | 11.22%(-5.23)#7,444 |
| 58. | Kingston | 5.97% | 2.46%(+3.51)#58 | 11.22%(-5.25)#7,469 |
| 59. | Lakewood | 5.96% | 2.46%(+3.50)#59 | 11.22%(-5.26)#7,474 |
| 60. | Aurora | 5.78% | 2.46%(+3.32)#60 | 11.22%(-5.44)#7,610 |
| 61. | Hampton Bays | 5.76% | 2.46%(+3.30)#61 | 11.22%(-5.46)#7,624 |
| 62. | Fairview Cdp Dutchess County | 5.73% | 2.46%(+3.27)#62 | 11.22%(-5.49)#7,648 |
| 63. | Otisville | 5.66% | 2.46%(+3.20)#63 | 11.22%(-5.56)#7,726 |
| 64. | Crugers | 5.59% | 2.46%(+3.14)#64 | 11.22%(-5.63)#7,781 |
| 65. | North Sea | 5.58% | 2.46%(+3.12)#65 | 11.22%(-5.64)#7,793 |
| 66. | Elmsford | 5.49% | 2.46%(+3.03)#66 | 11.22%(-5.73)#7,872 |
| 67. | Barker | 5.48% | 2.46%(+3.02)#67 | 11.22%(-5.74)#7,879 |
| 68. | Sodus | 5.48% | 2.46%(+3.02)#68 | 11.22%(-5.74)#7,880 |
| 69. | Port Ewen | 5.46% | 2.46%(+3.01)#69 | 11.22%(-5.76)#7,893 |
| 70. | Jeffersonville | 5.30% | 2.46%(+2.84)#70 | 11.22%(-5.92)#8,053 |
| 71. | Chaumont | 5.25% | 2.46%(+2.79)#71 | 11.22%(-5.97)#8,106 |
| 72. | Mamaroneck | 5.24% | 2.46%(+2.78)#72 | 11.22%(-5.98)#8,115 |
| 73. | Watervliet | 5.21% | 2.46%(+2.75)#73 | 11.22%(-6.01)#8,143 |
| 74. | Greenport | 5.14% | 2.46%(+2.68)#74 | 11.22%(-6.08)#8,205 |
| 75. | West End | 5.04% | 2.46%(+2.58)#75 | 11.22%(-6.18)#8,309 |
| 76. | Beacon | 4.83% | 2.46%(+2.37)#76 | 11.22%(-6.39)#8,521 |
| 77. | Nyack | 4.78% | 2.46%(+2.32)#77 | 11.22%(-6.44)#8,584 |
| 78. | Riverhead | 4.77% | 2.46%(+2.32)#78 | 11.22%(-6.44)#8,585 |
| 79. | Tillson | 4.77% | 2.46%(+2.31)#79 | 11.22%(-6.45)#8,590 |
| 80. | Sackets Harbor | 4.70% | 2.46%(+2.24)#80 | 11.22%(-6.52)#8,668 |
| 81. | Norwich | 4.58% | 2.46%(+2.12)#81 | 11.22%(-6.64)#8,814 |
| 82. | North Patchogue | 4.56% | 2.46%(+2.11)#82 | 11.22%(-6.65)#8,829 |
| 83. | Rhinebeck | 4.53% | 2.46%(+2.07)#83 | 11.22%(-6.69)#8,871 |
| 84. | Village Green | 4.30% | 2.46%(+1.84)#84 | 11.22%(-6.92)#9,123 |
| 85. | Baxter Estates | 4.27% | 2.46%(+1.81)#85 | 11.22%(-6.95)#9,160 |
| 86. | New Berlin | 4.22% | 2.46%(+1.77)#86 | 11.22%(-7.00)#9,210 |
| 87. | Adams | 4.21% | 2.46%(+1.75)#87 | 11.22%(-7.01)#9,217 |
| 88. | Albion | 4.20% | 2.46%(+1.74)#88 | 11.22%(-7.02)#9,235 |
| 89. | Monroe | 4.19% | 2.46%(+1.74)#89 | 11.22%(-7.03)#9,242 |
| 90. | Copiague | 4.17% | 2.46%(+1.71)#90 | 11.22%(-7.05)#9,261 |
| 91. | Argyle | 4.10% | 2.46%(+1.64)#91 | 11.22%(-7.12)#9,345 |
| 92. | Williamson | 3.95% | 2.46%(+1.49)#92 | 11.22%(-7.27)#9,506 |
| 93. | New York | 3.92% | 2.46%(+1.46)#93 | 11.22%(-7.30)#9,543 |
| 94. | West Point | 3.91% | 2.46%(+1.46)#94 | 11.22%(-7.30)#9,552 |
| 95. | West Haverstraw | 3.82% | 2.46%(+1.36)#95 | 11.22%(-7.40)#9,654 |
| 96. | Thornwood | 3.71% | 2.46%(+1.25)#96 | 11.22%(-7.51)#9,806 |
| 97. | Palenville | 3.68% | 2.46%(+1.22)#97 | 11.22%(-7.54)#9,855 |
| 98. | Shrub Oak | 3.66% | 2.46%(+1.21)#98 | 11.22%(-7.55)#9,873 |
| 99. | South Nyack | 3.64% | 2.46%(+1.18)#99 | 11.22%(-7.58)#9,904 |
| 100. | East Farmingdale | 3.62% | 2.46%(+1.17)#100 | 11.22%(-7.60)#9,929 |
Common Questions
What are the Top 10 Cities with the Highest Percentage of Mexican Population in New York?
Top 10 Cities with the Highest Percentage of Mexican Population in New York are:
#1
22.19%
#2
20.78%
#3
19.70%
#4
18.20%
#5
17.97%
#6
17.86%
#7
15.00%
#8
13.39%
#9
13.00%
#10
12.94%
What city has the Highest Percentage of Mexican Population in New York?
Newburgh has the Highest Percentage of Mexican Population in New York with 22.19%.
What is the Percentage of Mexican Population in the State of New York?
Percentage of Mexican Population in New York is 2.46%.
What is the Percentage of Mexican Population in the United States?
Percentage of Mexican Population in the United States is 11.22%.