Dix Hills, NY
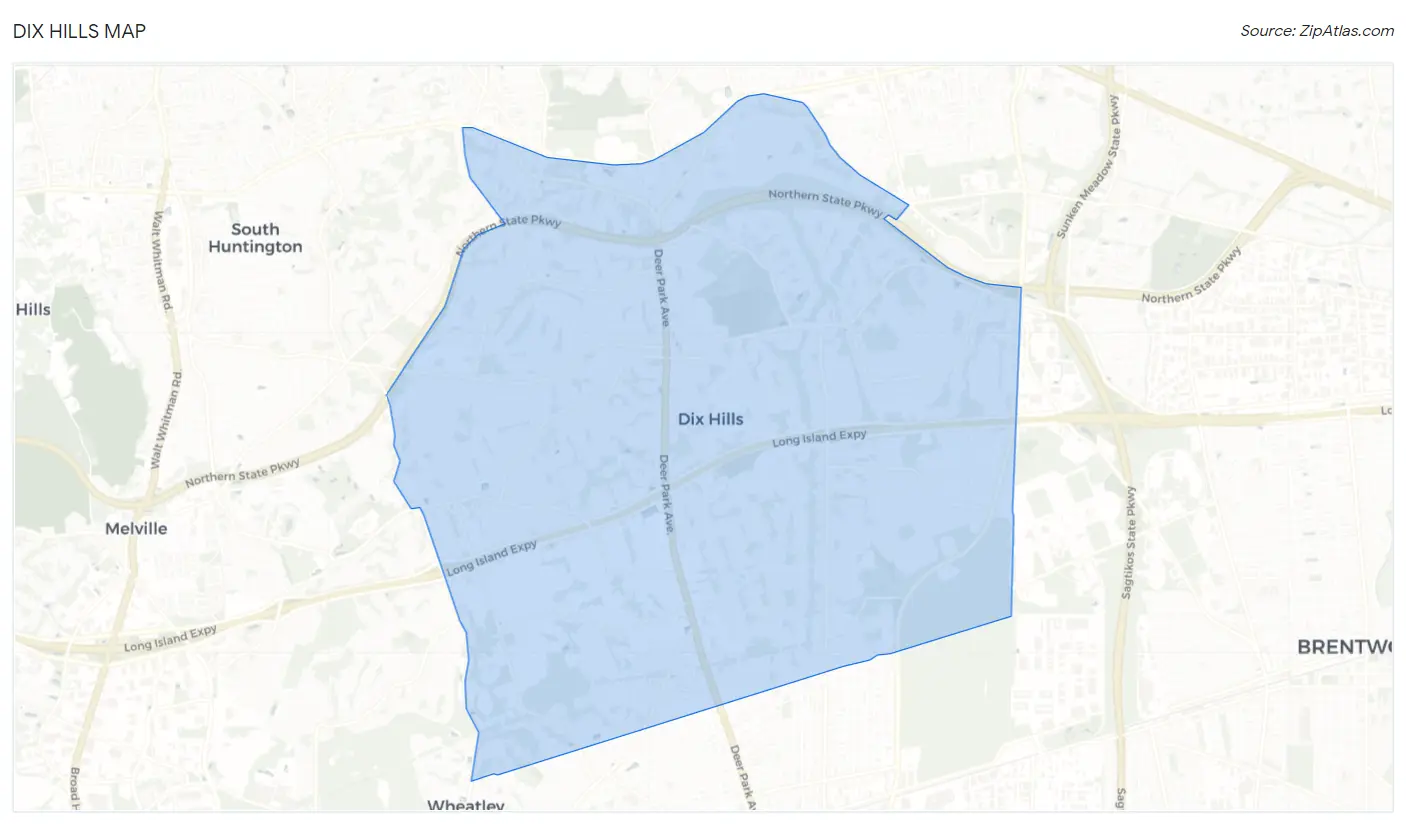
Dix Hills Map
Dix Hills Overview
24,652
TOTAL POPULATION
12,682
MALE POPULATION
11,970
FEMALE POPULATION
105.95
MALES / 100 FEMALES
94.39
FEMALES / 100 MALES
47.2
MEDIAN AGE
3.4
AVG FAMILY SIZE
3.2
AVG HOUSEHOLD SIZE
$85,209
PER CAPITA INCOME
$224,630
AVG FAMILY INCOME
$209,217
AVG HOUSEHOLD INCOME
41.2%
WAGE / INCOME GAP [ % ]
58.8¢/ $1
WAGE / INCOME GAP [ $ ]
0.43
INEQUALITY / GINI INDEX
13,213
LABOR FORCE [ PEOPLE ]
65.5%
PERCENT IN LABOR FORCE
4.0%
UNEMPLOYMENT RATE
Dix Hills Area Codes
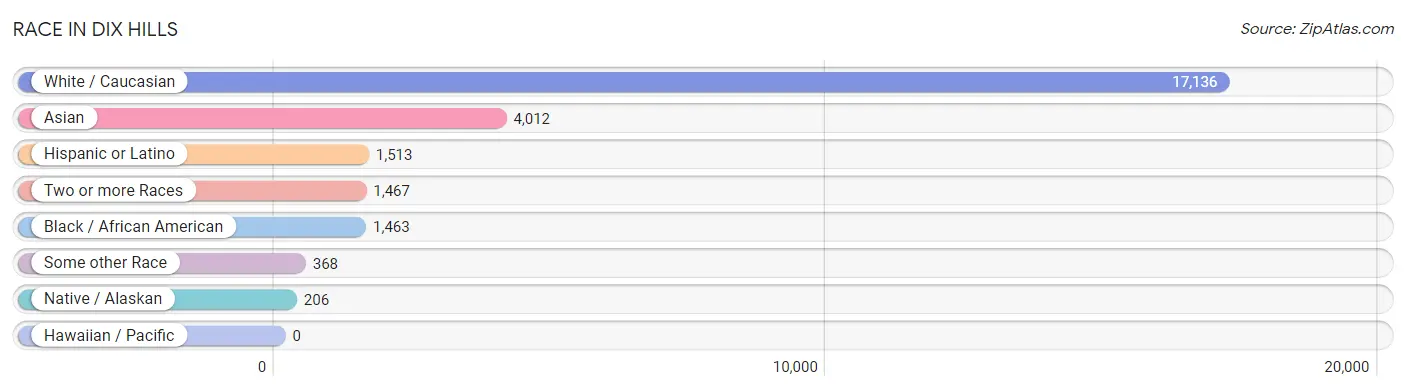
Race in Dix Hills
The most populous races in Dix Hills are White / Caucasian (17,136 | 69.5%), Asian (4,012 | 16.3%), and Hispanic or Latino (1,513 | 6.1%).
| Race | # Population | % Population |
| Asian | 4,012 | 16.3% |
| Black / African American | 1,463 | 5.9% |
| Hawaiian / Pacific | 0 | 0.0% |
| Hispanic or Latino | 1,513 | 6.1% |
| Native / Alaskan | 206 | 0.8% |
| White / Caucasian | 17,136 | 69.5% |
| Two or more Races | 1,467 | 5.9% |
| Some other Race | 368 | 1.5% |
| Total | 24,652 | 100.0% |
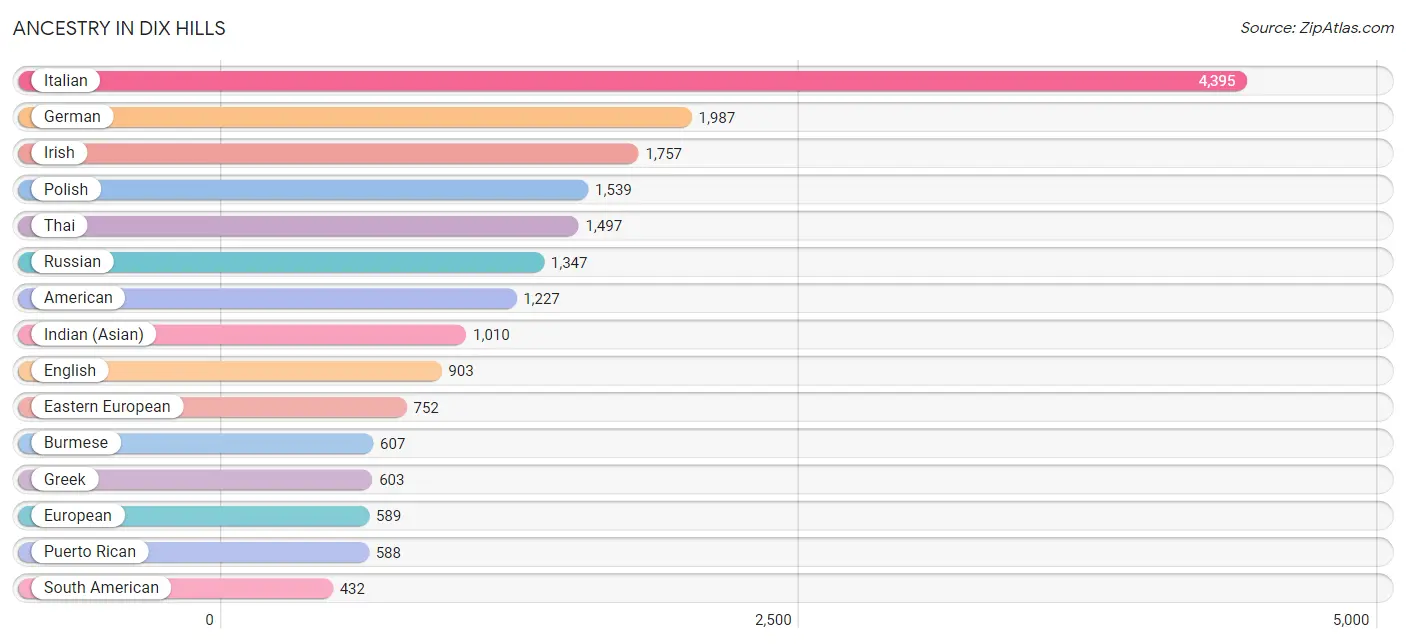
Ancestry in Dix Hills
The most populous ancestries reported in Dix Hills are Italian (4,395 | 17.8%), German (1,987 | 8.1%), Irish (1,757 | 7.1%), Polish (1,539 | 6.2%), and Thai (1,497 | 6.1%), together accounting for 45.3% of all Dix Hills residents.
| Ancestry | # Population | % Population |
| Afghan | 125 | 0.5% |
| African | 130 | 0.5% |
| Albanian | 43 | 0.2% |
| American | 1,227 | 5.0% |
| Arab | 150 | 0.6% |
| Armenian | 33 | 0.1% |
| Austrian | 176 | 0.7% |
| Bermudan | 15 | 0.1% |
| Bhutanese | 5 | 0.0% |
| Bolivian | 7 | 0.0% |
| Brazilian | 106 | 0.4% |
| British | 116 | 0.5% |
| Bulgarian | 9 | 0.0% |
| Burmese | 607 | 2.5% |
| Canadian | 84 | 0.3% |
| Cape Verdean | 2 | 0.0% |
| Central American | 121 | 0.5% |
| Cherokee | 22 | 0.1% |
| Chilean | 76 | 0.3% |
| Colombian | 167 | 0.7% |
| Costa Rican | 20 | 0.1% |
| Croatian | 78 | 0.3% |
| Cuban | 61 | 0.3% |
| Czech | 8 | 0.0% |
| Czechoslovakian | 9 | 0.0% |
| Danish | 58 | 0.2% |
| Dominican | 19 | 0.1% |
| Dutch | 33 | 0.1% |
| Eastern European | 752 | 3.0% |
| Ecuadorian | 57 | 0.2% |
| Egyptian | 34 | 0.1% |
| English | 903 | 3.7% |
| European | 589 | 2.4% |
| Filipino | 39 | 0.2% |
| Finnish | 40 | 0.2% |
| French | 107 | 0.4% |
| French Canadian | 35 | 0.1% |
| German | 1,987 | 8.1% |
| Ghanaian | 39 | 0.2% |
| Greek | 603 | 2.5% |
| Guyanese | 40 | 0.2% |
| Haitian | 190 | 0.8% |
| Honduran | 44 | 0.2% |
| Hungarian | 249 | 1.0% |
| Indian (Asian) | 1,010 | 4.1% |
| Iranian | 111 | 0.4% |
| Iraqi | 26 | 0.1% |
| Irish | 1,757 | 7.1% |
| Israeli | 28 | 0.1% |
| Italian | 4,395 | 17.8% |
| Jamaican | 48 | 0.2% |
| Korean | 264 | 1.1% |
| Latvian | 21 | 0.1% |
| Lebanese | 18 | 0.1% |
| Lithuanian | 150 | 0.6% |
| Moroccan | 33 | 0.1% |
| Nigerian | 224 | 0.9% |
| Norwegian | 116 | 0.5% |
| Pakistani | 1 | 0.0% |
| Palestinian | 48 | 0.2% |
| Peruvian | 125 | 0.5% |
| Polish | 1,539 | 6.2% |
| Portuguese | 131 | 0.5% |
| Puerto Rican | 588 | 2.4% |
| Romanian | 108 | 0.4% |
| Russian | 1,347 | 5.5% |
| Salvadoran | 57 | 0.2% |
| Scandinavian | 23 | 0.1% |
| Scotch-Irish | 44 | 0.2% |
| Scottish | 65 | 0.3% |
| South American | 432 | 1.8% |
| Spaniard | 213 | 0.9% |
| Sri Lankan | 25 | 0.1% |
| Subsaharan African | 369 | 1.5% |
| Swedish | 32 | 0.1% |
| Thai | 1,497 | 6.1% |
| Trinidadian and Tobagonian | 80 | 0.3% |
| Turkish | 52 | 0.2% |
| Ukrainian | 109 | 0.4% |
| Welsh | 29 | 0.1% |
| Yugoslavian | 40 | 0.2% | View All 81 Rows |
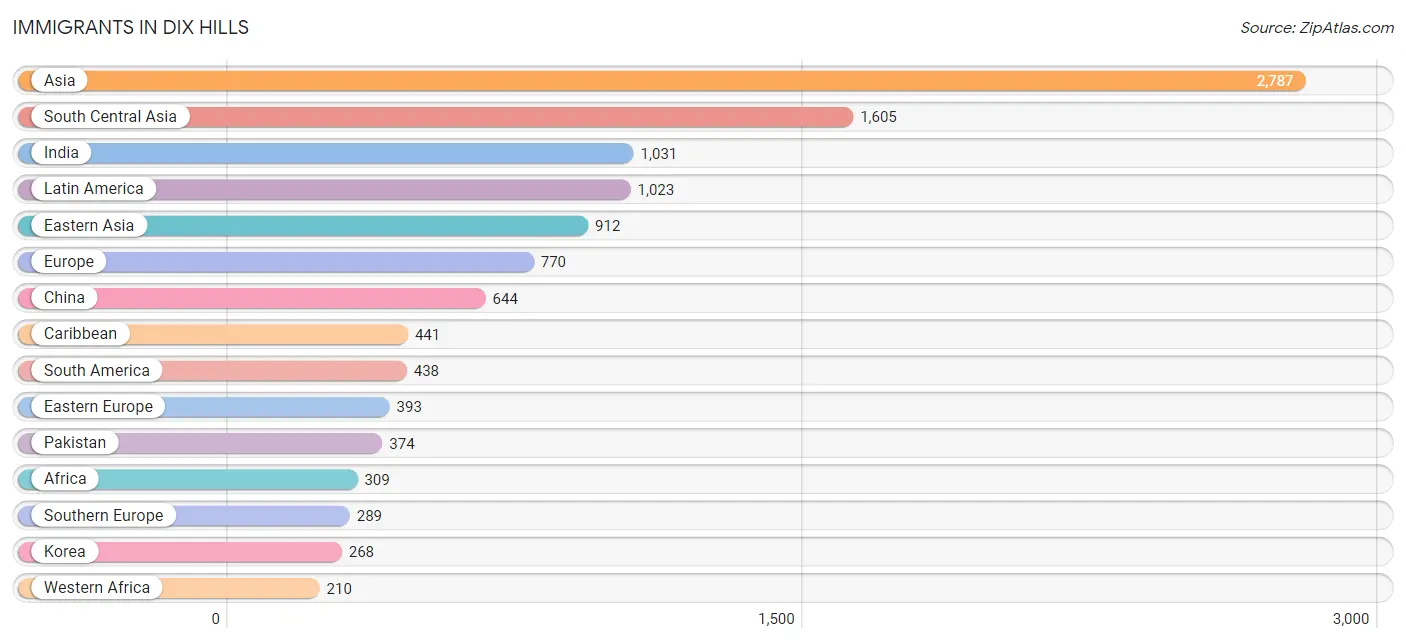
Immigrants in Dix Hills
The most numerous immigrant groups reported in Dix Hills came from Asia (2,787 | 11.3%), South Central Asia (1,605 | 6.5%), India (1,031 | 4.2%), Latin America (1,023 | 4.2%), and Eastern Asia (912 | 3.7%), together accounting for 29.8% of all Dix Hills residents.
| Immigration Origin | # Population | % Population |
| Afghanistan | 58 | 0.2% |
| Africa | 309 | 1.3% |
| Albania | 21 | 0.1% |
| Asia | 2,787 | 11.3% |
| Bangladesh | 25 | 0.1% |
| Bolivia | 7 | 0.0% |
| Bosnia and Herzegovina | 32 | 0.1% |
| Brazil | 106 | 0.4% |
| Canada | 80 | 0.3% |
| Caribbean | 441 | 1.8% |
| Central America | 144 | 0.6% |
| Chile | 8 | 0.0% |
| China | 644 | 2.6% |
| Colombia | 49 | 0.2% |
| Croatia | 30 | 0.1% |
| Cuba | 47 | 0.2% |
| Dominica | 13 | 0.1% |
| Dominican Republic | 39 | 0.2% |
| Eastern Africa | 19 | 0.1% |
| Eastern Asia | 912 | 3.7% |
| Eastern Europe | 393 | 1.6% |
| Ecuador | 57 | 0.2% |
| Egypt | 26 | 0.1% |
| El Salvador | 32 | 0.1% |
| England | 18 | 0.1% |
| Ethiopia | 9 | 0.0% |
| Europe | 770 | 3.1% |
| Germany | 10 | 0.0% |
| Greece | 90 | 0.4% |
| Grenada | 33 | 0.1% |
| Guyana | 67 | 0.3% |
| Haiti | 154 | 0.6% |
| Honduras | 112 | 0.4% |
| Hong Kong | 43 | 0.2% |
| India | 1,031 | 4.2% |
| Iran | 75 | 0.3% |
| Iraq | 13 | 0.1% |
| Israel | 82 | 0.3% |
| Italy | 151 | 0.6% |
| Jamaica | 60 | 0.2% |
| Kenya | 10 | 0.0% |
| Korea | 268 | 1.1% |
| Kuwait | 9 | 0.0% |
| Latin America | 1,023 | 4.2% |
| Lebanon | 19 | 0.1% |
| Middle Africa | 1 | 0.0% |
| Morocco | 7 | 0.0% |
| Nigeria | 184 | 0.7% |
| Northern Africa | 33 | 0.1% |
| Northern Europe | 78 | 0.3% |
| Pakistan | 374 | 1.5% |
| Peru | 106 | 0.4% |
| Philippines | 60 | 0.2% |
| Poland | 127 | 0.5% |
| Portugal | 31 | 0.1% |
| Romania | 22 | 0.1% |
| Russia | 83 | 0.3% |
| Senegal | 26 | 0.1% |
| Singapore | 16 | 0.1% |
| South Africa | 32 | 0.1% |
| South America | 438 | 1.8% |
| South Central Asia | 1,605 | 6.5% |
| South Eastern Asia | 89 | 0.4% |
| Southern Europe | 289 | 1.2% |
| Spain | 17 | 0.1% |
| St. Vincent and the Grenadines | 32 | 0.1% |
| Syria | 7 | 0.0% |
| Taiwan | 65 | 0.3% |
| Thailand | 1 | 0.0% |
| Trinidad and Tobago | 63 | 0.3% |
| Turkey | 39 | 0.2% |
| Ukraine | 78 | 0.3% |
| Uruguay | 38 | 0.2% |
| Uzbekistan | 42 | 0.2% |
| Vietnam | 12 | 0.1% |
| Western Africa | 210 | 0.9% |
| Western Asia | 181 | 0.7% |
| Western Europe | 10 | 0.0% |
| Zaire | 1 | 0.0% | View All 79 Rows |
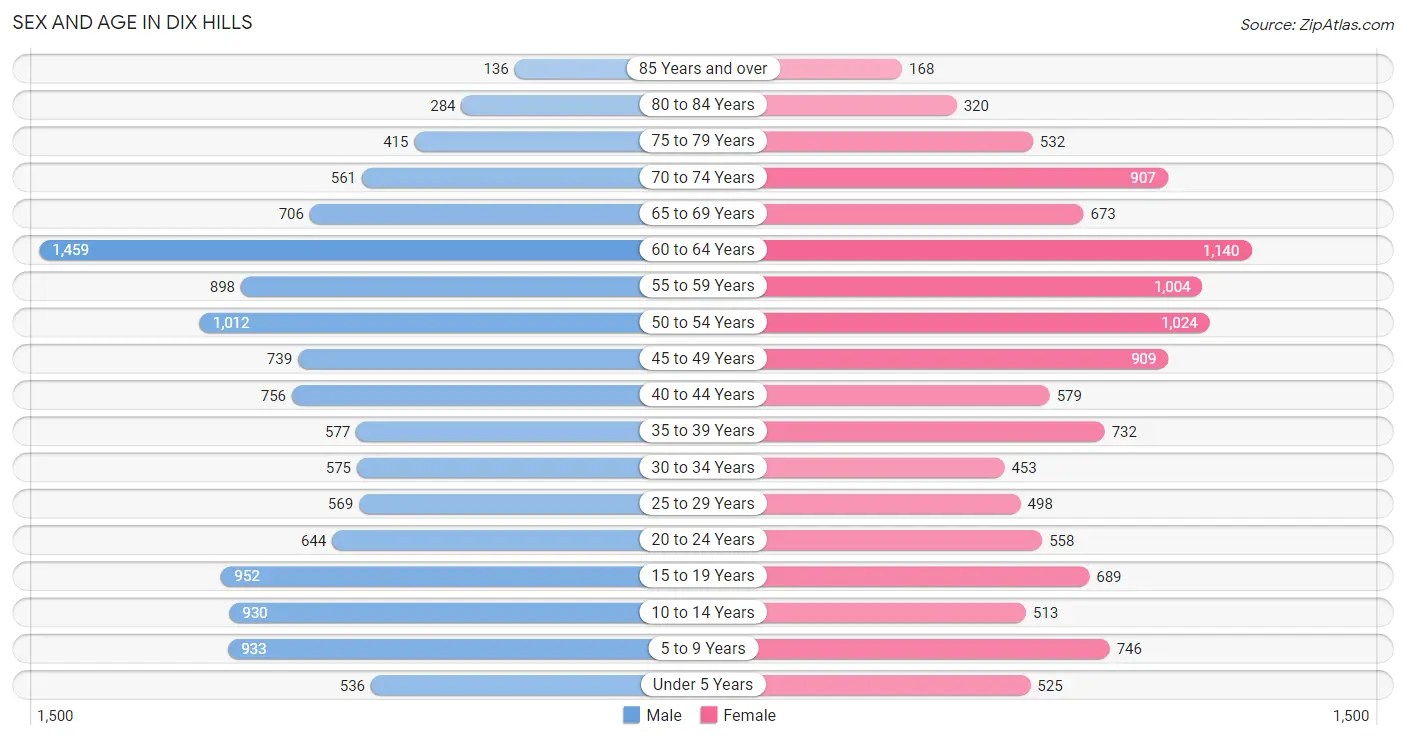
Sex and Age in Dix Hills
Sex and Age in Dix Hills
The most populous age groups in Dix Hills are 60 to 64 Years (1,459 | 11.5%) for men and 60 to 64 Years (1,140 | 9.5%) for women.
| Age Bracket | Male | Female |
| Under 5 Years | 536 (4.2%) | 525 (4.4%) |
| 5 to 9 Years | 933 (7.4%) | 746 (6.2%) |
| 10 to 14 Years | 930 (7.3%) | 513 (4.3%) |
| 15 to 19 Years | 952 (7.5%) | 689 (5.8%) |
| 20 to 24 Years | 644 (5.1%) | 558 (4.7%) |
| 25 to 29 Years | 569 (4.5%) | 498 (4.2%) |
| 30 to 34 Years | 575 (4.5%) | 453 (3.8%) |
| 35 to 39 Years | 577 (4.5%) | 732 (6.1%) |
| 40 to 44 Years | 756 (6.0%) | 579 (4.8%) |
| 45 to 49 Years | 739 (5.8%) | 909 (7.6%) |
| 50 to 54 Years | 1,012 (8.0%) | 1,024 (8.6%) |
| 55 to 59 Years | 898 (7.1%) | 1,004 (8.4%) |
| 60 to 64 Years | 1,459 (11.5%) | 1,140 (9.5%) |
| 65 to 69 Years | 706 (5.6%) | 673 (5.6%) |
| 70 to 74 Years | 561 (4.4%) | 907 (7.6%) |
| 75 to 79 Years | 415 (3.3%) | 532 (4.4%) |
| 80 to 84 Years | 284 (2.2%) | 320 (2.7%) |
| 85 Years and over | 136 (1.1%) | 168 (1.4%) |
| Total | 12,682 (100.0%) | 11,970 (100.0%) |
Families and Households in Dix Hills
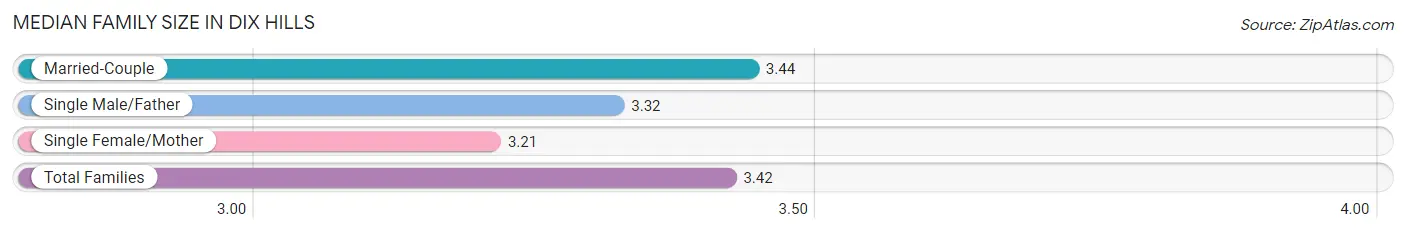
Median Family Size in Dix Hills
The median family size in Dix Hills is 3.42 persons per family, with married-couple families (6,046 | 91.2%) accounting for the largest median family size of 3.44 persons per family. On the other hand, single female/mother families (476 | 7.2%) represent the smallest median family size with 3.21 persons per family.
| Family Type | # Families | Family Size |
| Married-Couple | 6,046 (91.2%) | 3.44 |
| Single Male/Father | 110 (1.7%) | 3.32 |
| Single Female/Mother | 476 (7.2%) | 3.21 |
| Total Families | 6,632 (100.0%) | 3.42 |
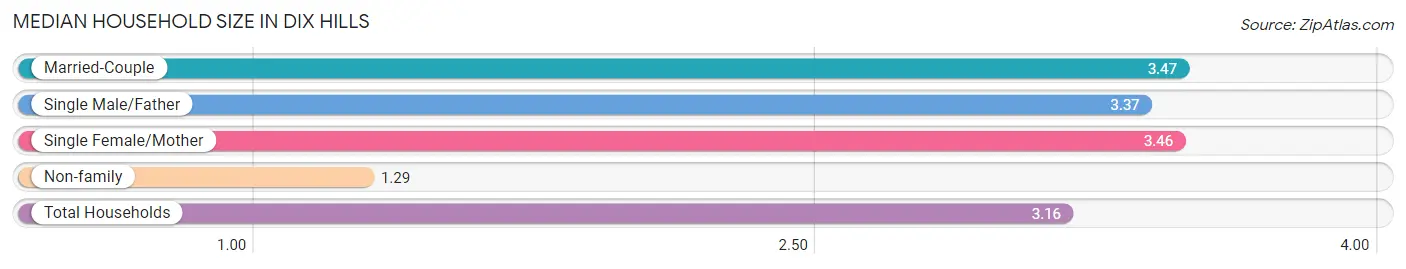
Median Household Size in Dix Hills
The median household size in Dix Hills is 3.16 persons per household, with married-couple households (6,046 | 78.4%) accounting for the largest median household size of 3.47 persons per household. non-family households (1,081 | 14.0%) represent the smallest median household size with 1.29 persons per household.
| Household Type | # Households | Household Size |
| Married-Couple | 6,046 (78.4%) | 3.47 |
| Single Male/Father | 110 (1.4%) | 3.37 |
| Single Female/Mother | 476 (6.2%) | 3.46 |
| Non-family | 1,081 (14.0%) | 1.29 |
| Total Households | 7,713 (100.0%) | 3.16 |
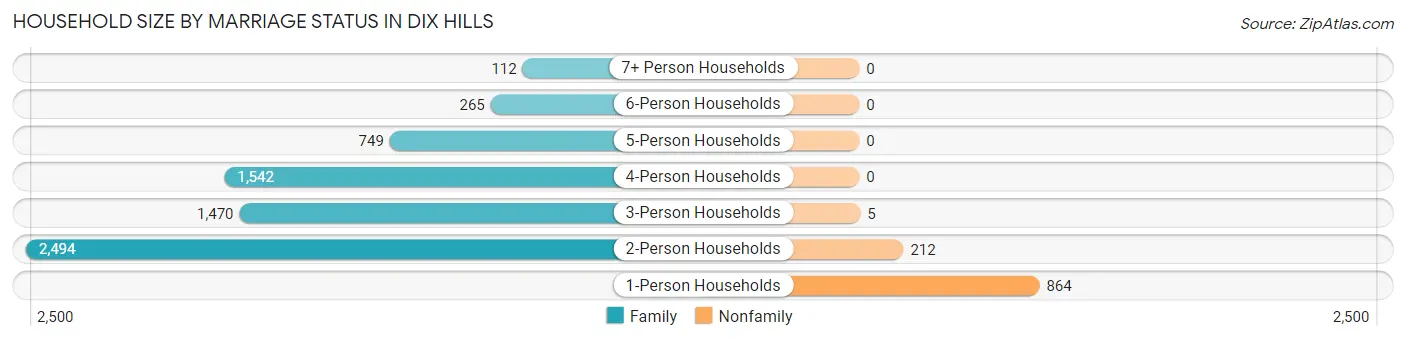
Household Size by Marriage Status in Dix Hills
Out of a total of 7,713 households in Dix Hills, 6,632 (86.0%) are family households, while 1,081 (14.0%) are nonfamily households. The most numerous type of family households are 2-person households, comprising 2,494, and the most common type of nonfamily households are 1-person households, comprising 864.
| Household Size | Family Households | Nonfamily Households |
| 1-Person Households | - | 864 (11.2%) |
| 2-Person Households | 2,494 (32.3%) | 212 (2.8%) |
| 3-Person Households | 1,470 (19.1%) | 5 (0.1%) |
| 4-Person Households | 1,542 (20.0%) | 0 (0.0%) |
| 5-Person Households | 749 (9.7%) | 0 (0.0%) |
| 6-Person Households | 265 (3.4%) | 0 (0.0%) |
| 7+ Person Households | 112 (1.5%) | 0 (0.0%) |
| Total | 6,632 (86.0%) | 1,081 (14.0%) |
Female Fertility in Dix Hills
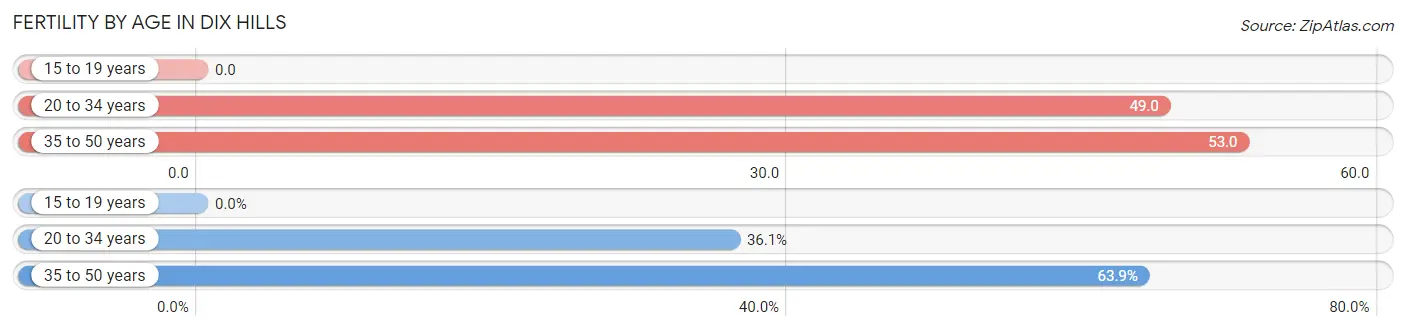
Fertility by Age in Dix Hills
Average fertility rate in Dix Hills is 44.0 births per 1,000 women. Women in the age bracket of 35 to 50 years have the highest fertility rate with 53.0 births per 1,000 women. Women in the age bracket of 35 to 50 years acount for 63.9% of all women with births.
| Age Bracket | Women with Births | Births / 1,000 Women |
| 15 to 19 years | 0 (0.0%) | 0.0 |
| 20 to 34 years | 74 (36.1%) | 49.0 |
| 35 to 50 years | 131 (63.9%) | 53.0 |
| Total | 205 (100.0%) | 44.0 |
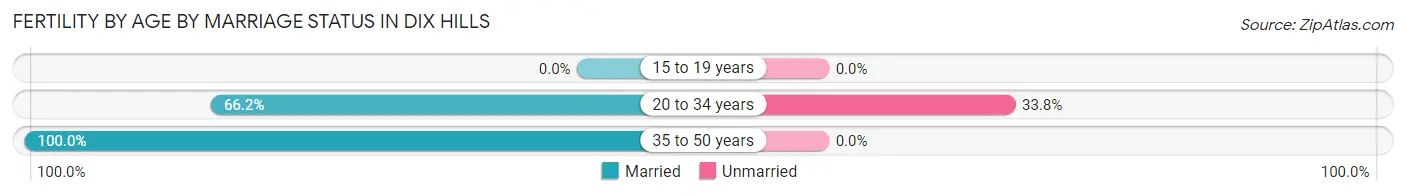
Fertility by Age by Marriage Status in Dix Hills
87.8% of women with births (205) in Dix Hills are married. The highest percentage of unmarried women with births falls into 20 to 34 years age bracket with 33.8% of them unmarried at the time of birth, while the lowest percentage of unmarried women with births belong to 35 to 50 years age bracket with 0.0% of them unmarried.
| Age Bracket | Married | Unmarried |
| 15 to 19 years | 0 (0.0%) | 0 (0.0%) |
| 20 to 34 years | 49 (66.2%) | 25 (33.8%) |
| 35 to 50 years | 131 (100.0%) | 0 (0.0%) |
| Total | 180 (87.8%) | 25 (12.2%) |
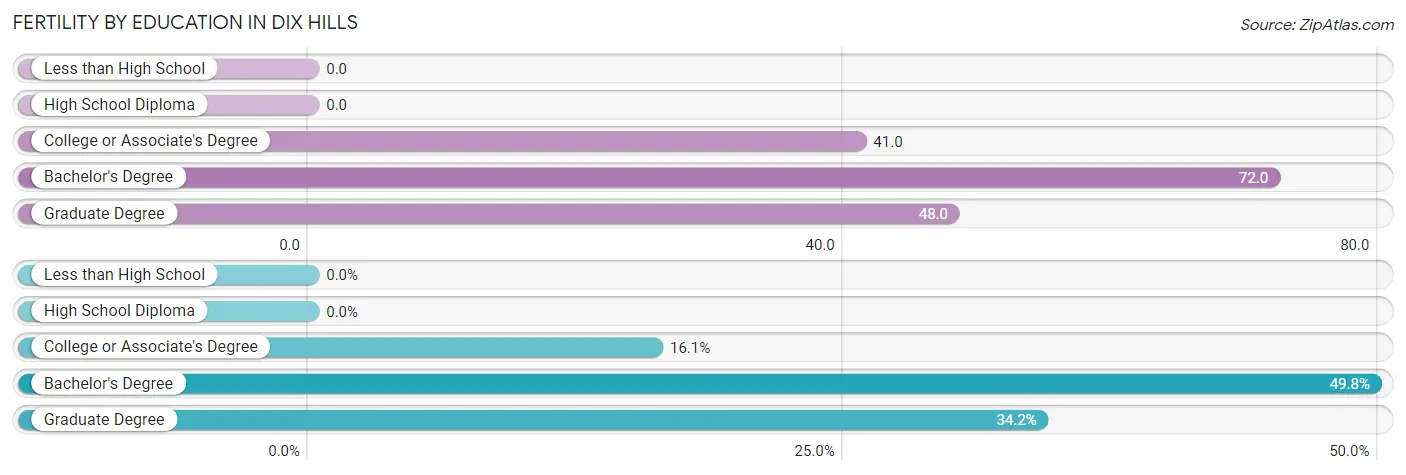
Fertility by Education in Dix Hills
| Educational Attainment | Women with Births | Births / 1,000 Women |
| Less than High School | 0 (0.0%) | 0.0 |
| High School Diploma | 0 (0.0%) | 0.0 |
| College or Associate's Degree | 33 (16.1%) | 41.0 |
| Bachelor's Degree | 102 (49.8%) | 72.0 |
| Graduate Degree | 70 (34.2%) | 48.0 |
| Total | 205 (100.0%) | 44.0 |
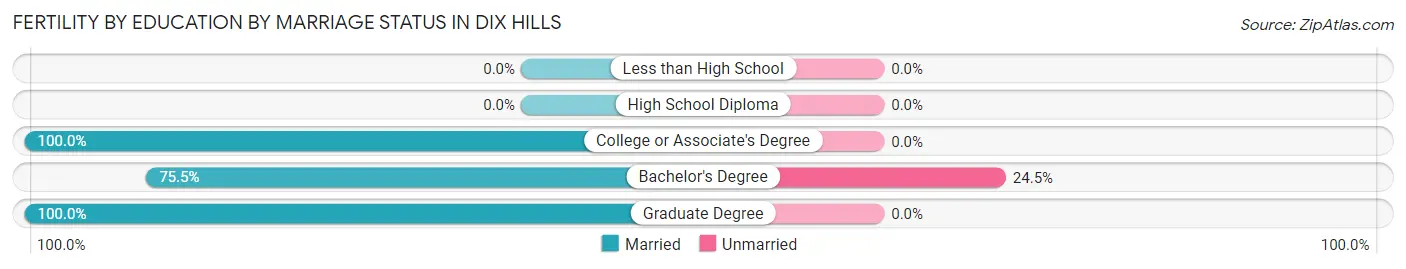
Fertility by Education by Marriage Status in Dix Hills
12.2% of women with births in Dix Hills are unmarried. Women with the educational attainment of college or associate's degree are most likely to be married with 100.0% of them married at childbirth, while women with the educational attainment of bachelor's degree are least likely to be married with 24.5% of them unmarried at childbirth.
| Educational Attainment | Married | Unmarried |
| Less than High School | 0 (0.0%) | 0 (0.0%) |
| High School Diploma | 0 (0.0%) | 0 (0.0%) |
| College or Associate's Degree | 33 (100.0%) | 0 (0.0%) |
| Bachelor's Degree | 77 (75.5%) | 25 (24.5%) |
| Graduate Degree | 70 (100.0%) | 0 (0.0%) |
| Total | 180 (87.8%) | 25 (12.2%) |
Income in Dix Hills
Income Overview in Dix Hills
Per Capita Income in Dix Hills is $85,209, while median incomes of families and households are $224,630 and $209,217 respectively.
| Characteristic | Number | Measure |
| Per Capita Income | 24,652 | $85,209 |
| Median Family Income | 6,632 | $224,630 |
| Mean Family Income | 6,632 | $283,169 |
| Median Household Income | 7,713 | $209,217 |
| Mean Household Income | 7,713 | $262,723 |
| Income Deficit | 6,632 | $0 |
| Wage / Income Gap (%) | 24,652 | 41.19% |
| Wage / Income Gap ($) | 24,652 | 58.81¢ per $1 |
| Gini / Inequality Index | 24,652 | 0.43 |
Earnings by Sex in Dix Hills
Average Earnings in Dix Hills are $90,637, $110,228 for men and $64,830 for women, a difference of 41.2%.
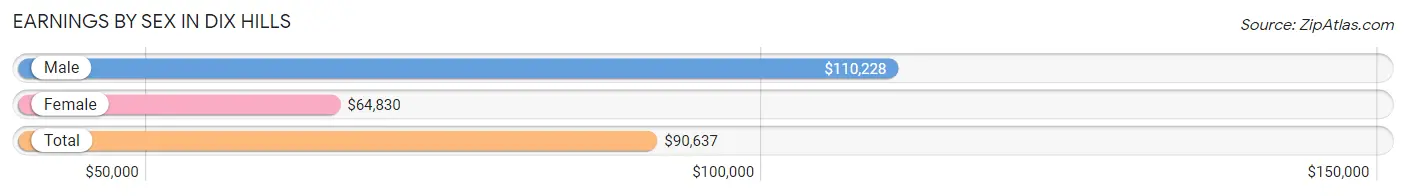
| Sex | Number | Average Earnings |
| Male | 7,475 (54.7%) | $110,228 |
| Female | 6,179 (45.3%) | $64,830 |
| Total | 13,654 (100.0%) | $90,637 |
Earnings by Sex by Income Bracket in Dix Hills
The most common earnings brackets in Dix Hills are $100,000+ for men (4,062 | 54.3%) and $100,000+ for women (2,327 | 37.7%).
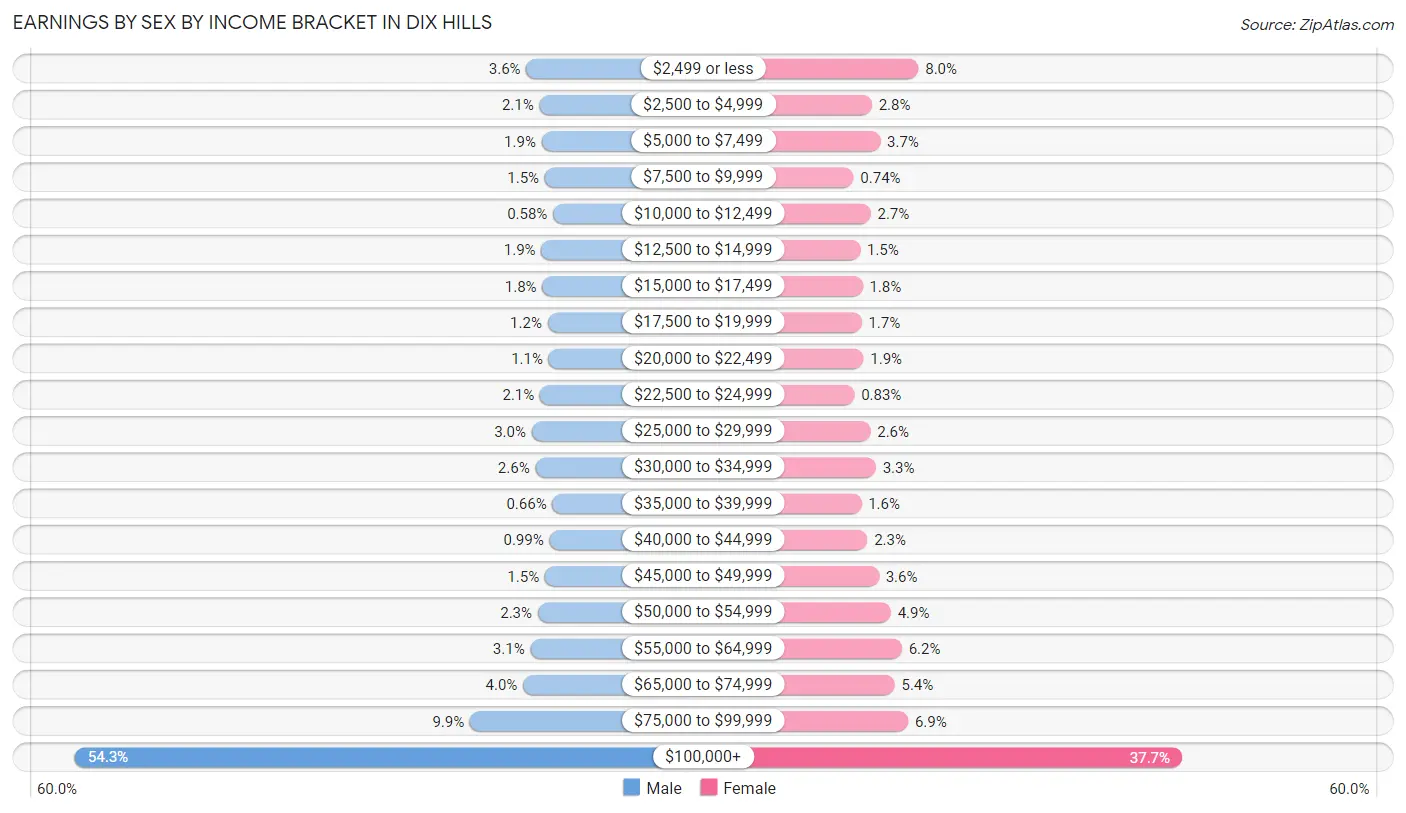
| Income | Male | Female |
| $2,499 or less | 268 (3.6%) | 497 (8.0%) |
| $2,500 to $4,999 | 158 (2.1%) | 173 (2.8%) |
| $5,000 to $7,499 | 140 (1.9%) | 231 (3.7%) |
| $7,500 to $9,999 | 113 (1.5%) | 46 (0.7%) |
| $10,000 to $12,499 | 43 (0.6%) | 165 (2.7%) |
| $12,500 to $14,999 | 142 (1.9%) | 92 (1.5%) |
| $15,000 to $17,499 | 134 (1.8%) | 109 (1.8%) |
| $17,500 to $19,999 | 89 (1.2%) | 102 (1.7%) |
| $20,000 to $22,499 | 80 (1.1%) | 115 (1.9%) |
| $22,500 to $24,999 | 153 (2.1%) | 51 (0.8%) |
| $25,000 to $29,999 | 223 (3.0%) | 163 (2.6%) |
| $30,000 to $34,999 | 192 (2.6%) | 201 (3.3%) |
| $35,000 to $39,999 | 49 (0.7%) | 100 (1.6%) |
| $40,000 to $44,999 | 74 (1.0%) | 142 (2.3%) |
| $45,000 to $49,999 | 112 (1.5%) | 222 (3.6%) |
| $50,000 to $54,999 | 172 (2.3%) | 305 (4.9%) |
| $55,000 to $64,999 | 234 (3.1%) | 381 (6.2%) |
| $65,000 to $74,999 | 295 (4.0%) | 332 (5.4%) |
| $75,000 to $99,999 | 742 (9.9%) | 425 (6.9%) |
| $100,000+ | 4,062 (54.3%) | 2,327 (37.7%) |
| Total | 7,475 (100.0%) | 6,179 (100.0%) |
Earnings by Sex by Educational Attainment in Dix Hills
Average earnings in Dix Hills are $125,491 for men and $73,205 for women, a difference of 41.7%. Men with an educational attainment of graduate degree enjoy the highest average annual earnings of $154,231, while those with high school diploma education earn the least with $45,469. Women with an educational attainment of graduate degree earn the most with the average annual earnings of $123,440, while those with college or associate's degree education have the smallest earnings of $45,368.
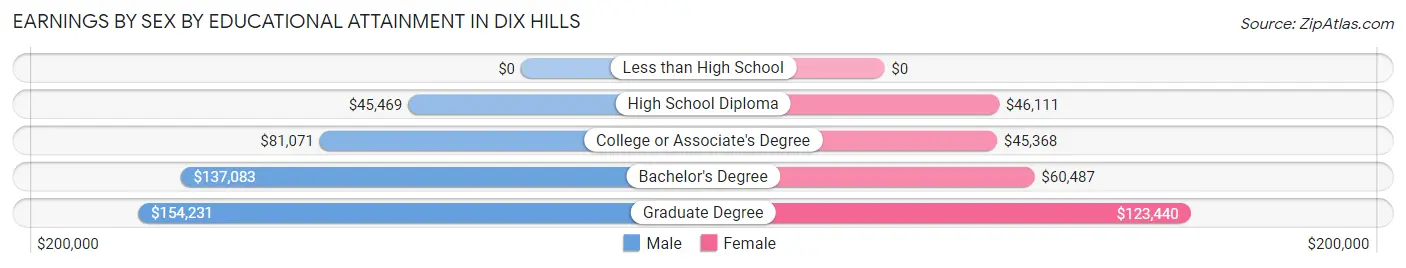
| Educational Attainment | Male Income | Female Income |
| Less than High School | - | - |
| High School Diploma | $45,469 | $46,111 |
| College or Associate's Degree | $81,071 | $45,368 |
| Bachelor's Degree | $137,083 | $60,487 |
| Graduate Degree | $154,231 | $123,440 |
| Total | $125,491 | $73,205 |
Family Income in Dix Hills
Family Income Brackets in Dix Hills
According to the Dix Hills family income data, there are 3,701 families falling into the $200,000+ income range, which is the most common income bracket and makes up 55.8% of all families. Conversely, the $10,000 to $14,999 income bracket is the least frequent group with only 27 families (0.4%) belonging to this category.
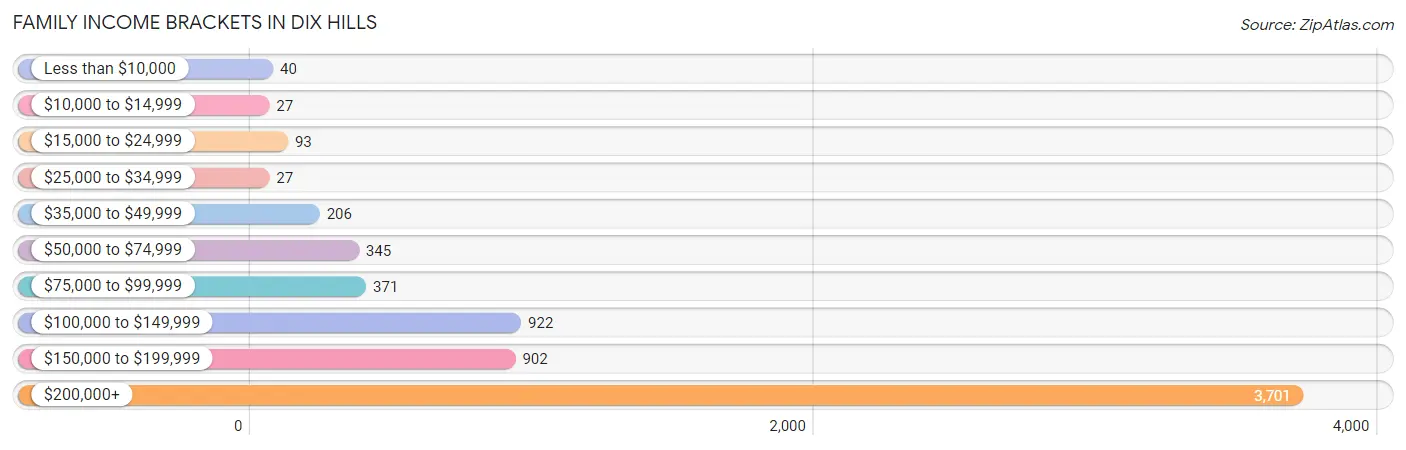
| Income Bracket | # Families | % Families |
| Less than $10,000 | 40 | 0.6% |
| $10,000 to $14,999 | 27 | 0.4% |
| $15,000 to $24,999 | 93 | 1.4% |
| $25,000 to $34,999 | 27 | 0.4% |
| $35,000 to $49,999 | 206 | 3.1% |
| $50,000 to $74,999 | 345 | 5.2% |
| $75,000 to $99,999 | 371 | 5.6% |
| $100,000 to $149,999 | 922 | 13.9% |
| $150,000 to $199,999 | 902 | 13.6% |
| $200,000+ | 3,701 | 55.8% |
Family Income by Famaliy Size in Dix Hills
5-person families (724 | 10.9%) account for the highest median family income in Dix Hills with $250,001 per family, while 2-person families (2,556 | 38.5%) have the highest median income of $95,282 per family member.
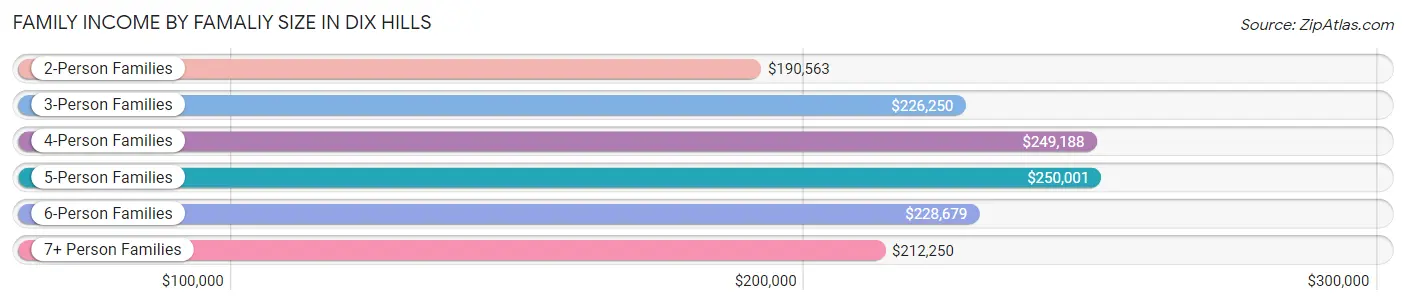
| Income Bracket | # Families | Median Income |
| 2-Person Families | 2,556 (38.5%) | $190,563 |
| 3-Person Families | 1,469 (22.2%) | $226,250 |
| 4-Person Families | 1,530 (23.1%) | $249,188 |
| 5-Person Families | 724 (10.9%) | $250,001 |
| 6-Person Families | 241 (3.6%) | $228,679 |
| 7+ Person Families | 112 (1.7%) | $212,250 |
| Total | 6,632 (100.0%) | $224,630 |
Family Income by Number of Earners in Dix Hills
The median family income in Dix Hills is $224,630, with families comprising 2 earners (3,195) having the highest median family income of $250,001, while families with no earners (610) have the lowest median family income of $98,333, accounting for 48.2% and 9.2% of families, respectively.
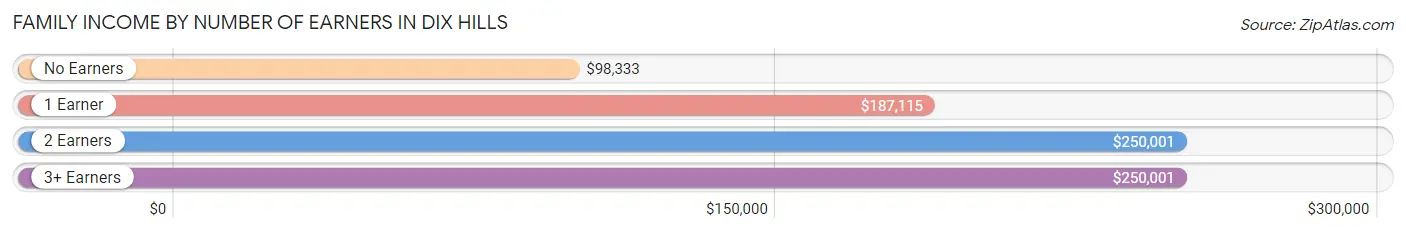
| Number of Earners | # Families | Median Income |
| No Earners | 610 (9.2%) | $98,333 |
| 1 Earner | 1,632 (24.6%) | $187,115 |
| 2 Earners | 3,195 (48.2%) | $250,001 |
| 3+ Earners | 1,195 (18.0%) | $250,001 |
| Total | 6,632 (100.0%) | $224,630 |
Household Income in Dix Hills
Household Income Brackets in Dix Hills
With 4,049 households falling in the category, the $200,000+ income range is the most frequent in Dix Hills, accounting for 52.5% of all households. In contrast, only 54 households (0.7%) fall into the $10,000 to $14,999 income bracket, making it the least populous group.
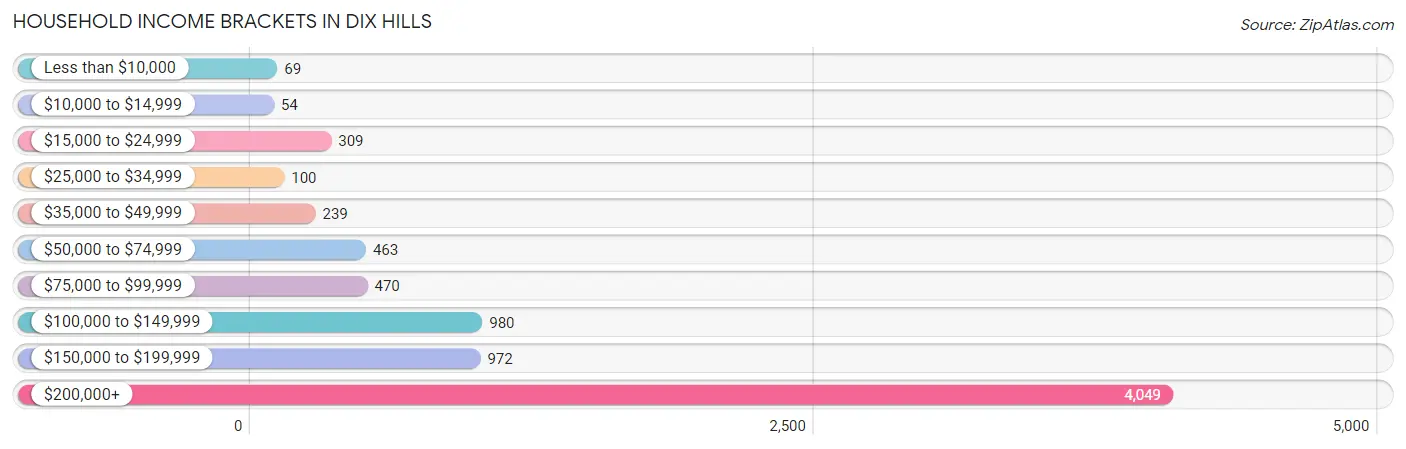
| Income Bracket | # Households | % Households |
| Less than $10,000 | 69 | 0.9% |
| $10,000 to $14,999 | 54 | 0.7% |
| $15,000 to $24,999 | 309 | 4.0% |
| $25,000 to $34,999 | 100 | 1.3% |
| $35,000 to $49,999 | 239 | 3.1% |
| $50,000 to $74,999 | 463 | 6.0% |
| $75,000 to $99,999 | 470 | 6.1% |
| $100,000 to $149,999 | 980 | 12.7% |
| $150,000 to $199,999 | 972 | 12.6% |
| $200,000+ | 4,049 | 52.5% |
Household Income by Householder Age in Dix Hills
The median household income in Dix Hills is $209,217, with the highest median household income of $238,897 found in the 45 to 64 years age bracket for the primary householder. A total of 4,098 households (53.1%) fall into this category.
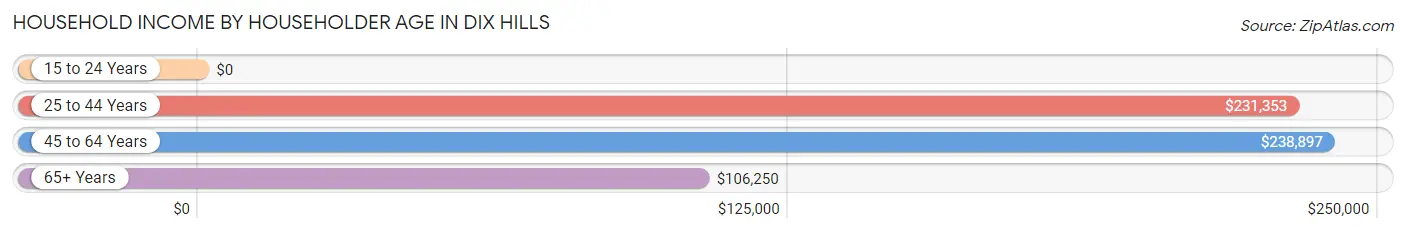
| Income Bracket | # Households | Median Income |
| 15 to 24 Years | 0 (0.0%) | $0 |
| 25 to 44 Years | 1,394 (18.1%) | $231,353 |
| 45 to 64 Years | 4,098 (53.1%) | $238,897 |
| 65+ Years | 2,221 (28.8%) | $106,250 |
| Total | 7,713 (100.0%) | $209,217 |
Poverty in Dix Hills
Income Below Poverty by Sex and Age in Dix Hills
With 2.6% poverty level for males and 4.2% for females among the residents of Dix Hills, 16 and 17 year old males and 18 to 24 year old females are the most vulnerable to poverty, with 25 males (5.1%) and 164 females (21.3%) in their respective age groups living below the poverty level.
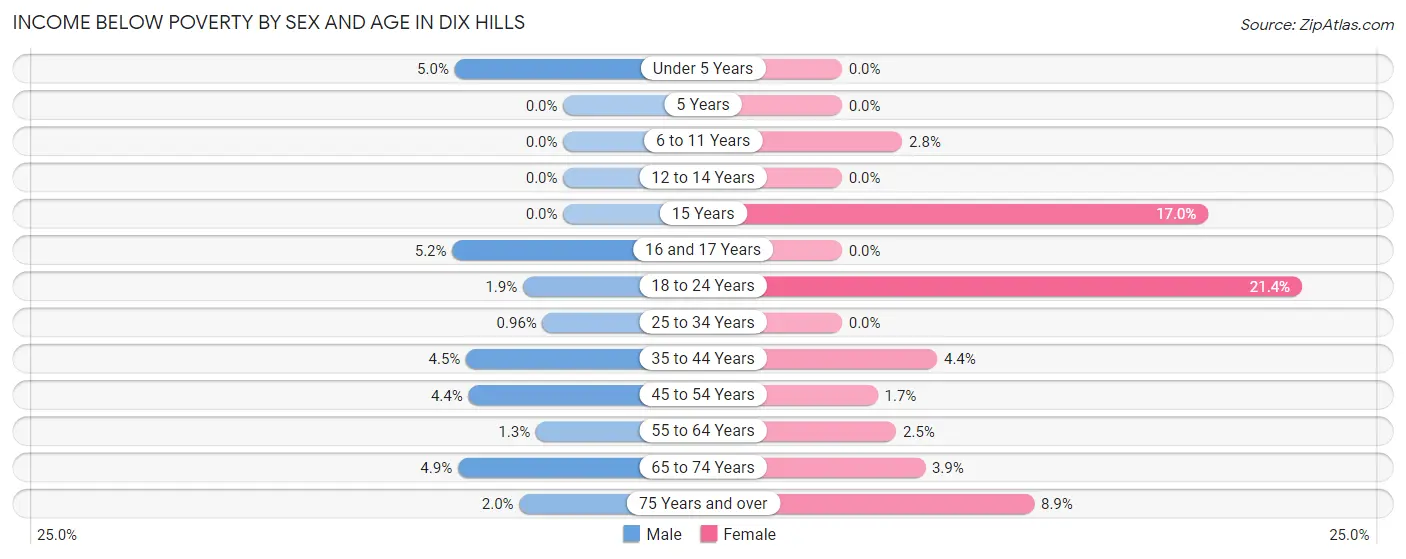
| Age Bracket | Male | Female |
| Under 5 Years | 27 (5.0%) | 0 (0.0%) |
| 5 Years | 0 (0.0%) | 0 (0.0%) |
| 6 to 11 Years | 0 (0.0%) | 25 (2.8%) |
| 12 to 14 Years | 0 (0.0%) | 0 (0.0%) |
| 15 Years | 0 (0.0%) | 17 (17.0%) |
| 16 and 17 Years | 25 (5.1%) | 0 (0.0%) |
| 18 to 24 Years | 16 (1.9%) | 164 (21.3%) |
| 25 to 34 Years | 11 (1.0%) | 0 (0.0%) |
| 35 to 44 Years | 60 (4.5%) | 58 (4.4%) |
| 45 to 54 Years | 77 (4.4%) | 32 (1.7%) |
| 55 to 64 Years | 30 (1.3%) | 54 (2.5%) |
| 65 to 74 Years | 62 (4.9%) | 61 (3.9%) |
| 75 Years and over | 17 (2.0%) | 91 (8.9%) |
| Total | 325 (2.6%) | 502 (4.2%) |
Income Above Poverty by Sex and Age in Dix Hills
According to the poverty statistics in Dix Hills, males aged 5 years and females aged under 5 years are the age groups that are most secure financially, with 100.0% of males and 100.0% of females in these age groups living above the poverty line.
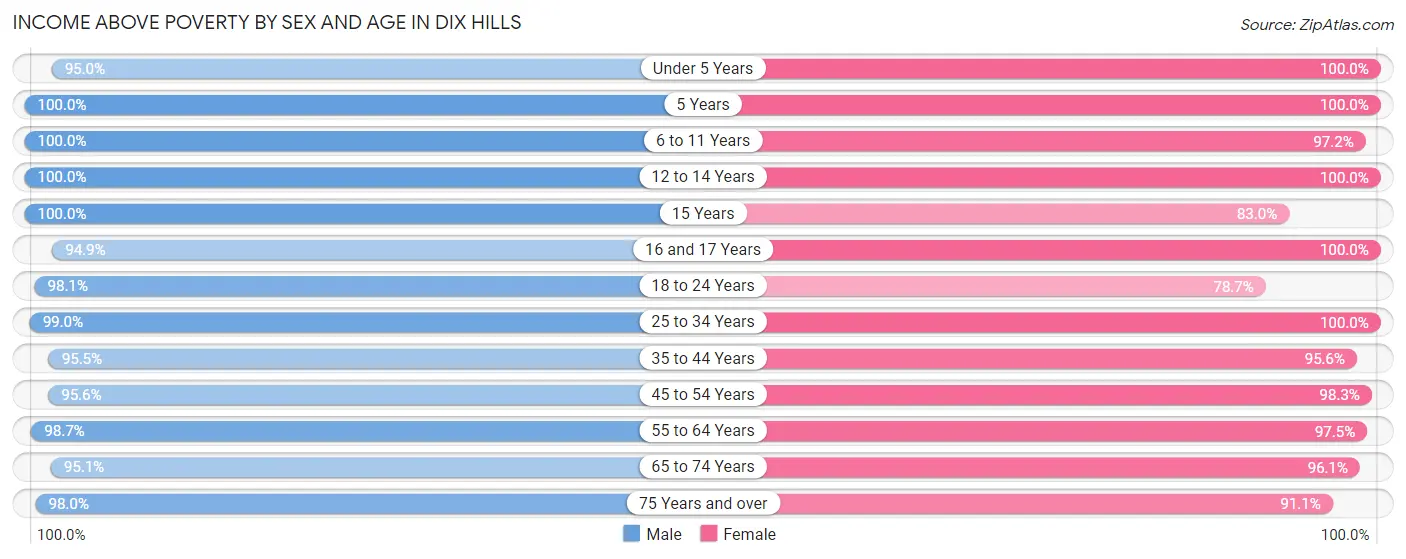
| Age Bracket | Male | Female |
| Under 5 Years | 509 (95.0%) | 525 (100.0%) |
| 5 Years | 57 (100.0%) | 50 (100.0%) |
| 6 to 11 Years | 1,305 (100.0%) | 868 (97.2%) |
| 12 to 14 Years | 500 (100.0%) | 310 (100.0%) |
| 15 Years | 189 (100.0%) | 83 (83.0%) |
| 16 and 17 Years | 460 (94.9%) | 300 (100.0%) |
| 18 to 24 Years | 839 (98.1%) | 604 (78.6%) |
| 25 to 34 Years | 1,131 (99.0%) | 948 (100.0%) |
| 35 to 44 Years | 1,270 (95.5%) | 1,253 (95.6%) |
| 45 to 54 Years | 1,674 (95.6%) | 1,901 (98.3%) |
| 55 to 64 Years | 2,327 (98.7%) | 2,090 (97.5%) |
| 65 to 74 Years | 1,205 (95.1%) | 1,519 (96.1%) |
| 75 Years and over | 818 (98.0%) | 929 (91.1%) |
| Total | 12,284 (97.4%) | 11,380 (95.8%) |
Income Below Poverty Among Married-Couple Families in Dix Hills
The poverty statistics for married-couple families in Dix Hills show that 1.4% or 87 of the total 6,046 families live below the poverty line. Families with 3 or 4 children have the highest poverty rate of 6.5%, comprising of 31 families. On the other hand, families with 1 or 2 children have the lowest poverty rate of 0.0%, which includes 0 families.
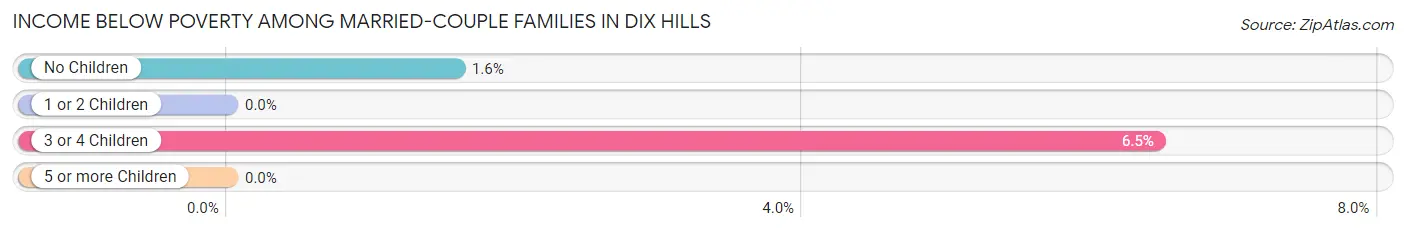
| Children | Above Poverty | Below Poverty |
| No Children | 3,488 (98.4%) | 56 (1.6%) |
| 1 or 2 Children | 2,000 (100.0%) | 0 (0.0%) |
| 3 or 4 Children | 449 (93.5%) | 31 (6.5%) |
| 5 or more Children | 22 (100.0%) | 0 (0.0%) |
| Total | 5,959 (98.6%) | 87 (1.4%) |
Income Below Poverty Among Single-Parent Households in Dix Hills
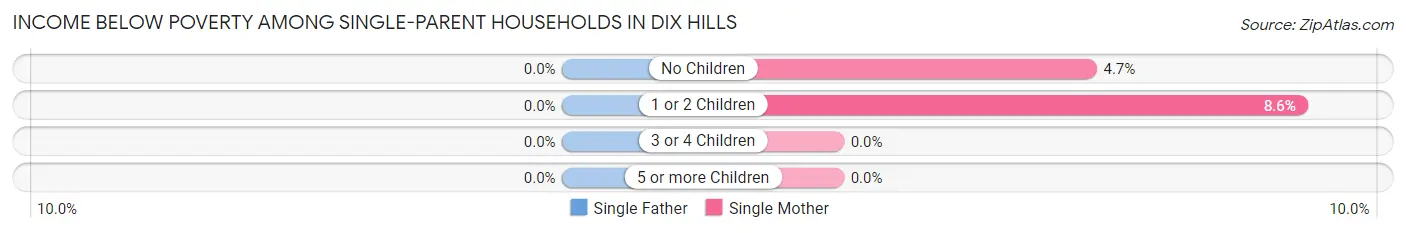
| Children | Single Father | Single Mother |
| No Children | 0 (0.0%) | 14 (4.7%) |
| 1 or 2 Children | 0 (0.0%) | 14 (8.6%) |
| 3 or 4 Children | 0 (0.0%) | 0 (0.0%) |
| 5 or more Children | 0 (0.0%) | 0 (0.0%) |
| Total | 0 (0.0%) | 28 (5.9%) |
Income Below Poverty Among Married-Couple vs Single-Parent Households in Dix Hills
The poverty data for Dix Hills shows that 87 of the married-couple family households (1.4%) and 28 of the single-parent households (4.8%) are living below the poverty level. Within the married-couple family households, those with 3 or 4 children have the highest poverty rate, with 31 households (6.5%) falling below the poverty line. Among the single-parent households, those with 1 or 2 children have the highest poverty rate, with 14 household (7.0%) living below poverty.
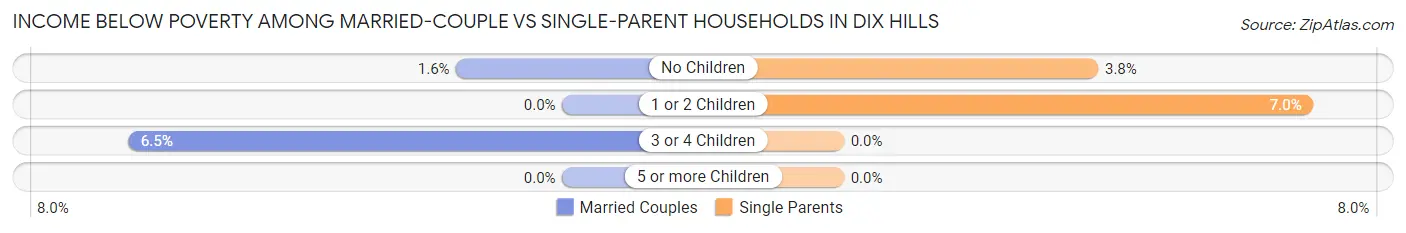
| Children | Married-Couple Families | Single-Parent Households |
| No Children | 56 (1.6%) | 14 (3.8%) |
| 1 or 2 Children | 0 (0.0%) | 14 (7.0%) |
| 3 or 4 Children | 31 (6.5%) | 0 (0.0%) |
| 5 or more Children | 0 (0.0%) | 0 (0.0%) |
| Total | 87 (1.4%) | 28 (4.8%) |
Employment Characteristics in Dix Hills
Employment by Class of Employer in Dix Hills
Among the 12,233 employed individuals in Dix Hills, private company employees (7,023 | 57.4%), self-employed (incorporated) (1,471 | 12.0%), and not-for-profit organizations (1,138 | 9.3%) make up the most common classes of employment.
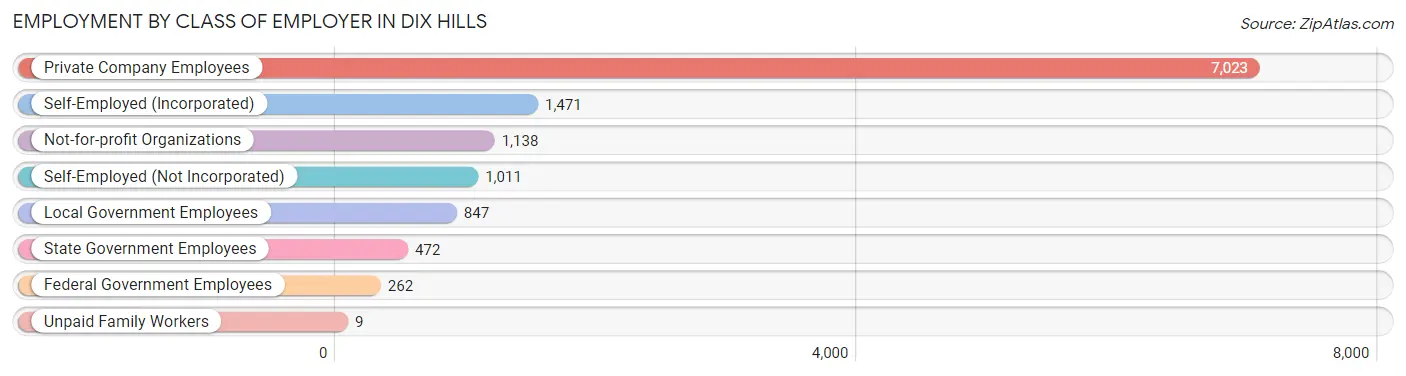
| Employer Class | # Employees | % Employees |
| Private Company Employees | 7,023 | 57.4% |
| Self-Employed (Incorporated) | 1,471 | 12.0% |
| Self-Employed (Not Incorporated) | 1,011 | 8.3% |
| Not-for-profit Organizations | 1,138 | 9.3% |
| Local Government Employees | 847 | 6.9% |
| State Government Employees | 472 | 3.9% |
| Federal Government Employees | 262 | 2.1% |
| Unpaid Family Workers | 9 | 0.1% |
| Total | 12,233 | 100.0% |
Employment Status by Age in Dix Hills
According to the labor force statistics for Dix Hills, out of the total population over 16 years of age (20,173), 65.5% or 13,213 individuals are in the labor force, with 4.0% or 529 of them unemployed. The age group with the highest labor force participation rate is 45 to 54 years, with 88.2% or 3,249 individuals in the labor force. Within the labor force, the 30 to 34 years age range has the highest percentage of unemployed individuals, with 13.5% or 115 of them being unemployed.
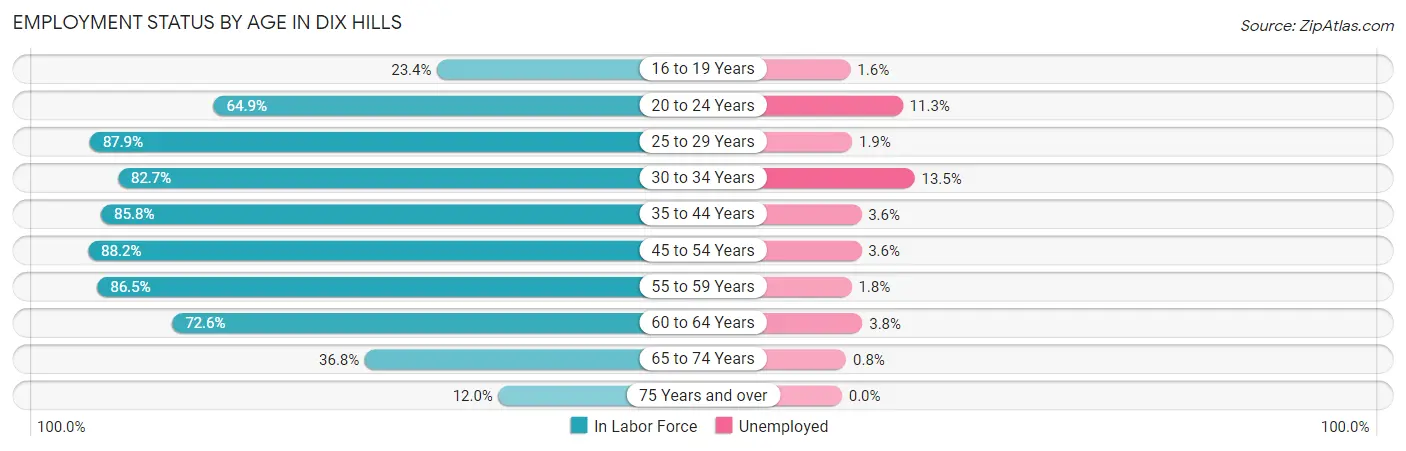
| Age Bracket | In Labor Force | Unemployed |
| 16 to 19 Years | 315 (23.4%) | 5 (1.6%) |
| 20 to 24 Years | 780 (64.9%) | 88 (11.3%) |
| 25 to 29 Years | 938 (87.9%) | 18 (1.9%) |
| 30 to 34 Years | 850 (82.7%) | 115 (13.5%) |
| 35 to 44 Years | 2,269 (85.8%) | 82 (3.6%) |
| 45 to 54 Years | 3,249 (88.2%) | 117 (3.6%) |
| 55 to 59 Years | 1,645 (86.5%) | 30 (1.8%) |
| 60 to 64 Years | 1,887 (72.6%) | 72 (3.8%) |
| 65 to 74 Years | 1,048 (36.8%) | 8 (0.8%) |
| 75 Years and over | 223 (12.0%) | 0 (0.0%) |
| Total | 13,213 (65.5%) | 529 (4.0%) |
Employment Status by Educational Attainment in Dix Hills
According to labor force statistics for Dix Hills, 83.9% of individuals (10,843) out of the total population between 25 and 64 years of age (12,924) are in the labor force, with 4.0% or 434 of them being unemployed. The group with the highest labor force participation rate are those with the educational attainment of bachelor's degree or higher, with 88.0% or 7,845 individuals in the labor force. Within the labor force, individuals with less than high school education have the highest percentage of unemployment, with 32.6% or 73 of them being unemployed.
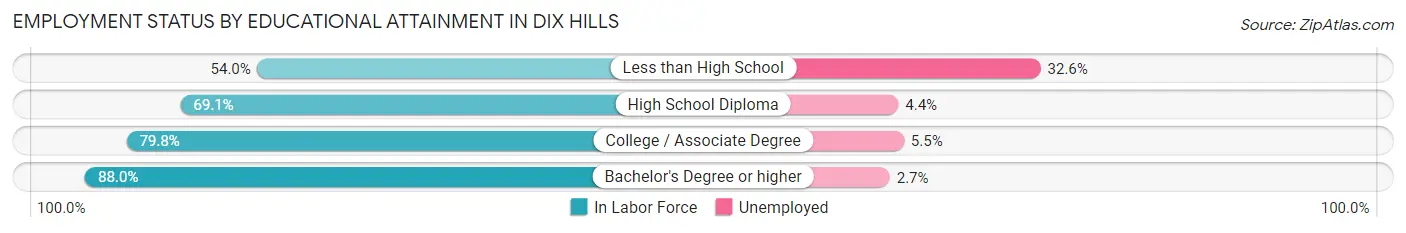
| Educational Attainment | In Labor Force | Unemployed |
| Less than High School | 224 (54.0%) | 135 (32.6%) |
| High School Diploma | 634 (69.1%) | 40 (4.4%) |
| College / Associate Degree | 2,135 (79.8%) | 147 (5.5%) |
| Bachelor's Degree or higher | 7,845 (88.0%) | 241 (2.7%) |
| Total | 10,843 (83.9%) | 517 (4.0%) |
Employment Occupations by Sex in Dix Hills
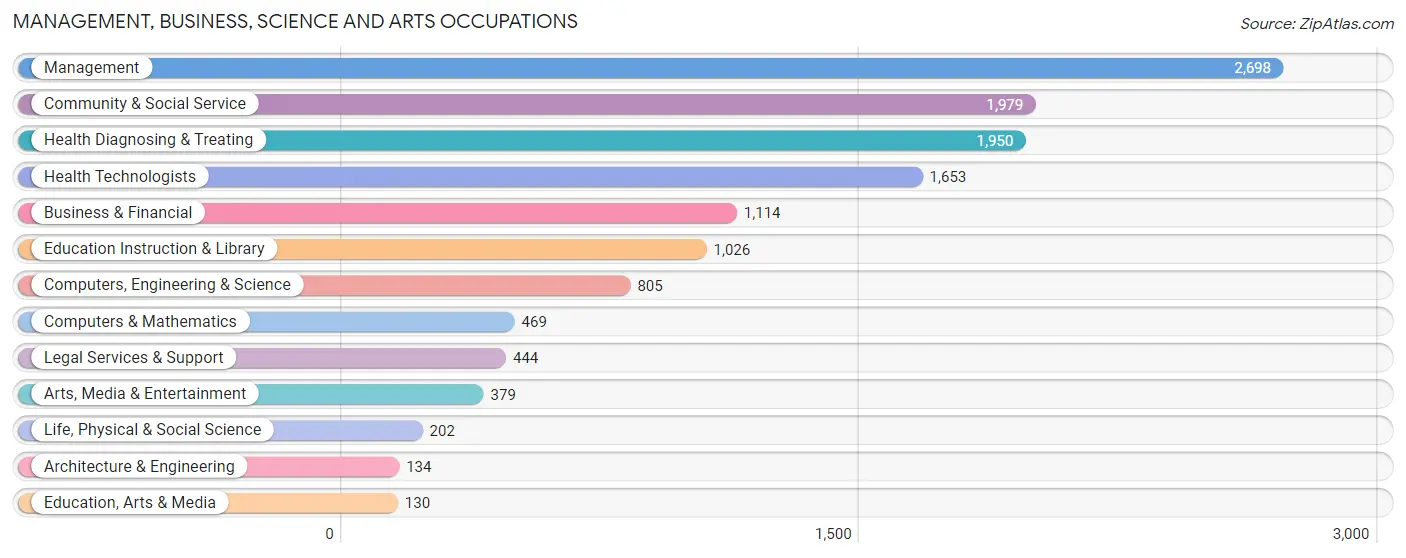
Management, Business, Science and Arts Occupations
The most common Management, Business, Science and Arts occupations in Dix Hills are Management (2,698 | 21.3%), Community & Social Service (1,979 | 15.6%), Health Diagnosing & Treating (1,950 | 15.4%), Health Technologists (1,653 | 13.1%), and Business & Financial (1,114 | 8.8%).
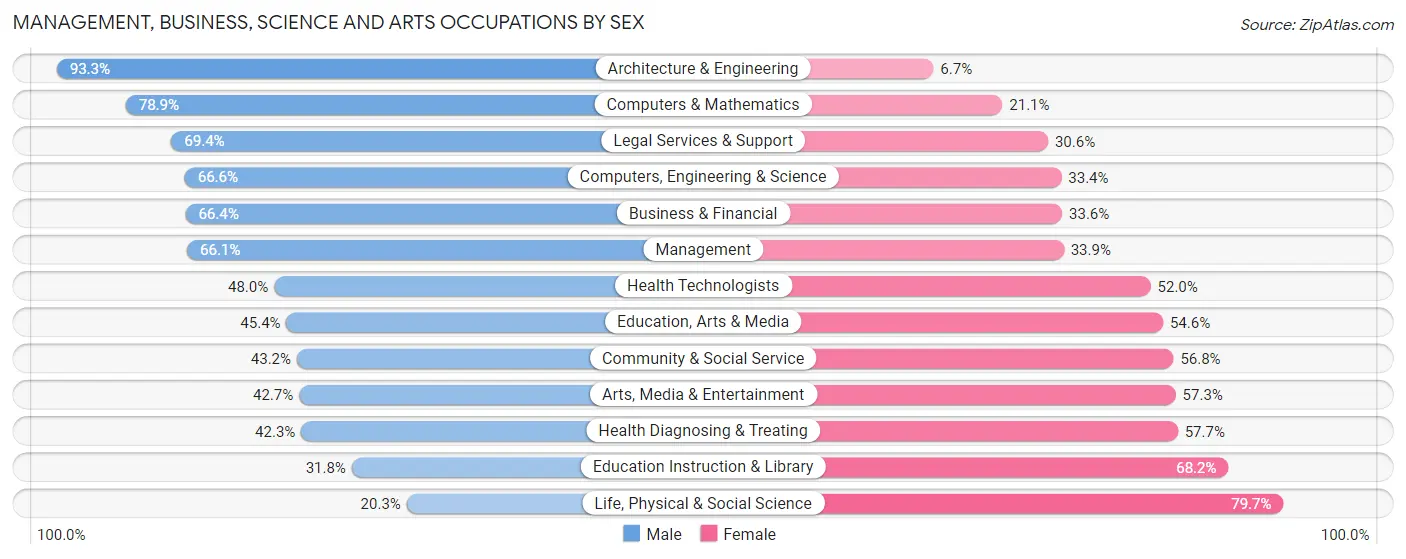
Management, Business, Science and Arts Occupations by Sex
Within the Management, Business, Science and Arts occupations in Dix Hills, the most male-oriented occupations are Architecture & Engineering (93.3%), Computers & Mathematics (78.9%), and Legal Services & Support (69.4%), while the most female-oriented occupations are Life, Physical & Social Science (79.7%), Education Instruction & Library (68.2%), and Health Diagnosing & Treating (57.7%).
| Occupation | Male | Female |
| Management | 1,783 (66.1%) | 915 (33.9%) |
| Business & Financial | 740 (66.4%) | 374 (33.6%) |
| Computers, Engineering & Science | 536 (66.6%) | 269 (33.4%) |
| Computers & Mathematics | 370 (78.9%) | 99 (21.1%) |
| Architecture & Engineering | 125 (93.3%) | 9 (6.7%) |
| Life, Physical & Social Science | 41 (20.3%) | 161 (79.7%) |
| Community & Social Service | 855 (43.2%) | 1,124 (56.8%) |
| Education, Arts & Media | 59 (45.4%) | 71 (54.6%) |
| Legal Services & Support | 308 (69.4%) | 136 (30.6%) |
| Education Instruction & Library | 326 (31.8%) | 700 (68.2%) |
| Arts, Media & Entertainment | 162 (42.7%) | 217 (57.3%) |
| Health Diagnosing & Treating | 825 (42.3%) | 1,125 (57.7%) |
| Health Technologists | 793 (48.0%) | 860 (52.0%) |
| Total (Category) | 4,739 (55.4%) | 3,807 (44.6%) |
| Total (Overall) | 6,962 (54.9%) | 5,708 (45.1%) |
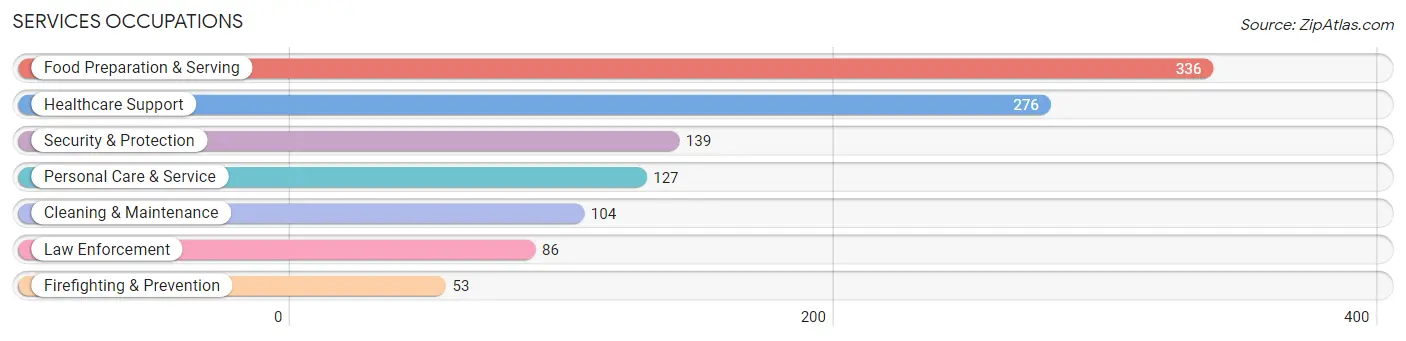
Services Occupations
The most common Services occupations in Dix Hills are Food Preparation & Serving (336 | 2.6%), Healthcare Support (276 | 2.2%), Security & Protection (139 | 1.1%), Personal Care & Service (127 | 1.0%), and Cleaning & Maintenance (104 | 0.8%).
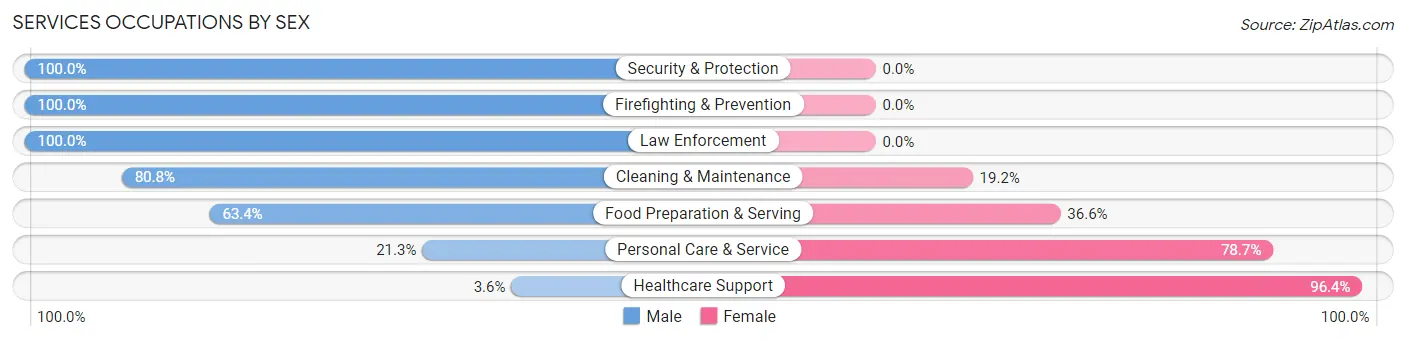
Services Occupations by Sex
Within the Services occupations in Dix Hills, the most male-oriented occupations are Security & Protection (100.0%), Firefighting & Prevention (100.0%), and Law Enforcement (100.0%), while the most female-oriented occupations are Healthcare Support (96.4%), Personal Care & Service (78.7%), and Food Preparation & Serving (36.6%).
| Occupation | Male | Female |
| Healthcare Support | 10 (3.6%) | 266 (96.4%) |
| Security & Protection | 139 (100.0%) | 0 (0.0%) |
| Firefighting & Prevention | 53 (100.0%) | 0 (0.0%) |
| Law Enforcement | 86 (100.0%) | 0 (0.0%) |
| Food Preparation & Serving | 213 (63.4%) | 123 (36.6%) |
| Cleaning & Maintenance | 84 (80.8%) | 20 (19.2%) |
| Personal Care & Service | 27 (21.3%) | 100 (78.7%) |
| Total (Category) | 473 (48.2%) | 509 (51.8%) |
| Total (Overall) | 6,962 (54.9%) | 5,708 (45.1%) |
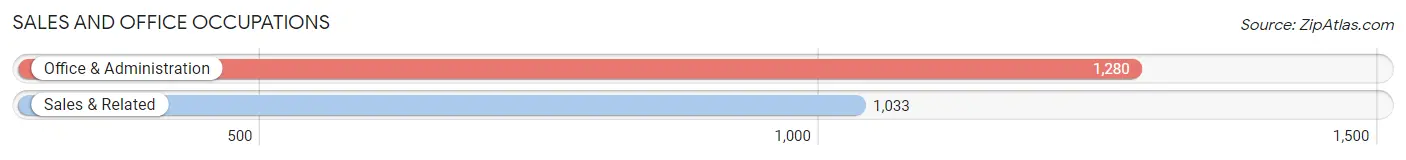
Sales and Office Occupations
The most common Sales and Office occupations in Dix Hills are Office & Administration (1,280 | 10.1%), and Sales & Related (1,033 | 8.2%).
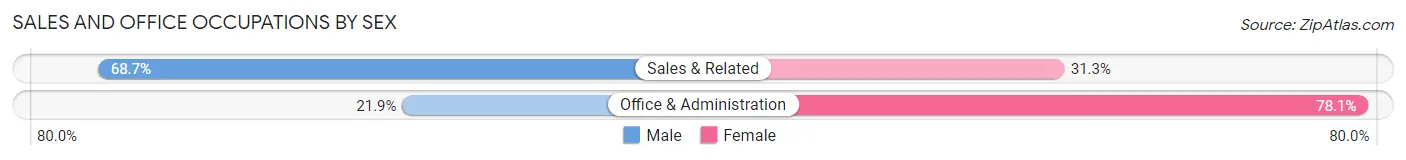
Sales and Office Occupations by Sex
| Occupation | Male | Female |
| Sales & Related | 710 (68.7%) | 323 (31.3%) |
| Office & Administration | 280 (21.9%) | 1,000 (78.1%) |
| Total (Category) | 990 (42.8%) | 1,323 (57.2%) |
| Total (Overall) | 6,962 (54.9%) | 5,708 (45.1%) |
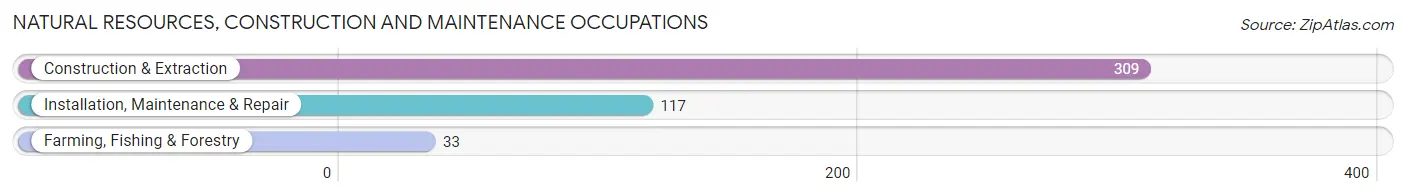
Natural Resources, Construction and Maintenance Occupations
The most common Natural Resources, Construction and Maintenance occupations in Dix Hills are Construction & Extraction (309 | 2.4%), Installation, Maintenance & Repair (117 | 0.9%), and Farming, Fishing & Forestry (33 | 0.3%).
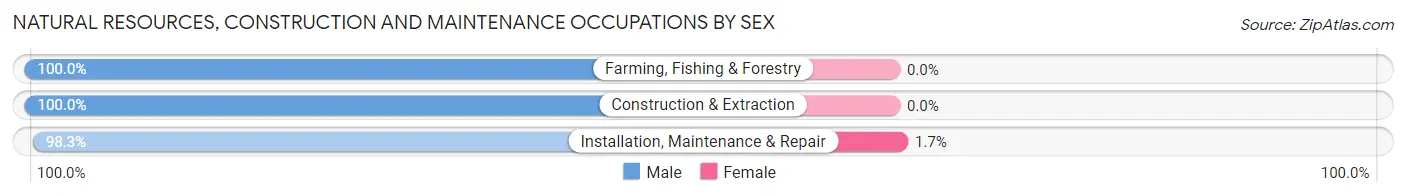
Natural Resources, Construction and Maintenance Occupations by Sex
| Occupation | Male | Female |
| Farming, Fishing & Forestry | 33 (100.0%) | 0 (0.0%) |
| Construction & Extraction | 309 (100.0%) | 0 (0.0%) |
| Installation, Maintenance & Repair | 115 (98.3%) | 2 (1.7%) |
| Total (Category) | 457 (99.6%) | 2 (0.4%) |
| Total (Overall) | 6,962 (54.9%) | 5,708 (45.1%) |
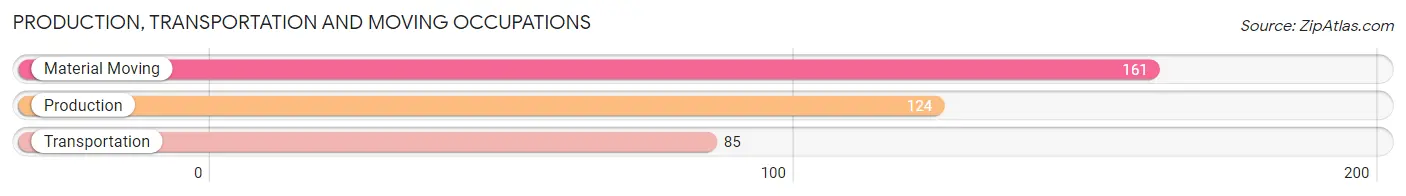
Production, Transportation and Moving Occupations
The most common Production, Transportation and Moving occupations in Dix Hills are Material Moving (161 | 1.3%), Production (124 | 1.0%), and Transportation (85 | 0.7%).
Production, Transportation and Moving Occupations by Sex
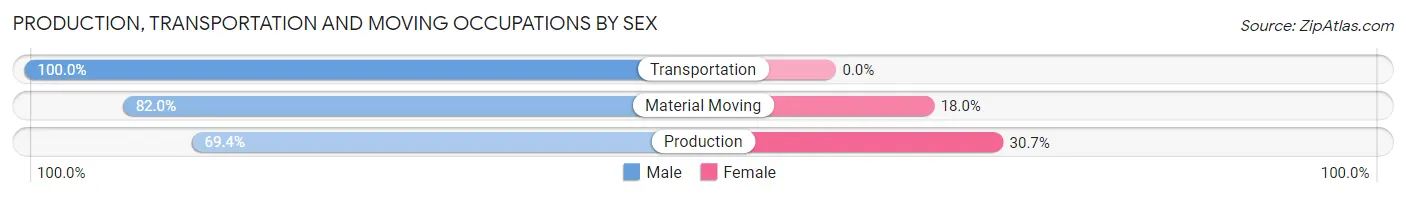
| Occupation | Male | Female |
| Production | 86 (69.4%) | 38 (30.6%) |
| Transportation | 85 (100.0%) | 0 (0.0%) |
| Material Moving | 132 (82.0%) | 29 (18.0%) |
| Total (Category) | 303 (81.9%) | 67 (18.1%) |
| Total (Overall) | 6,962 (54.9%) | 5,708 (45.1%) |
Employment Industries by Sex in Dix Hills
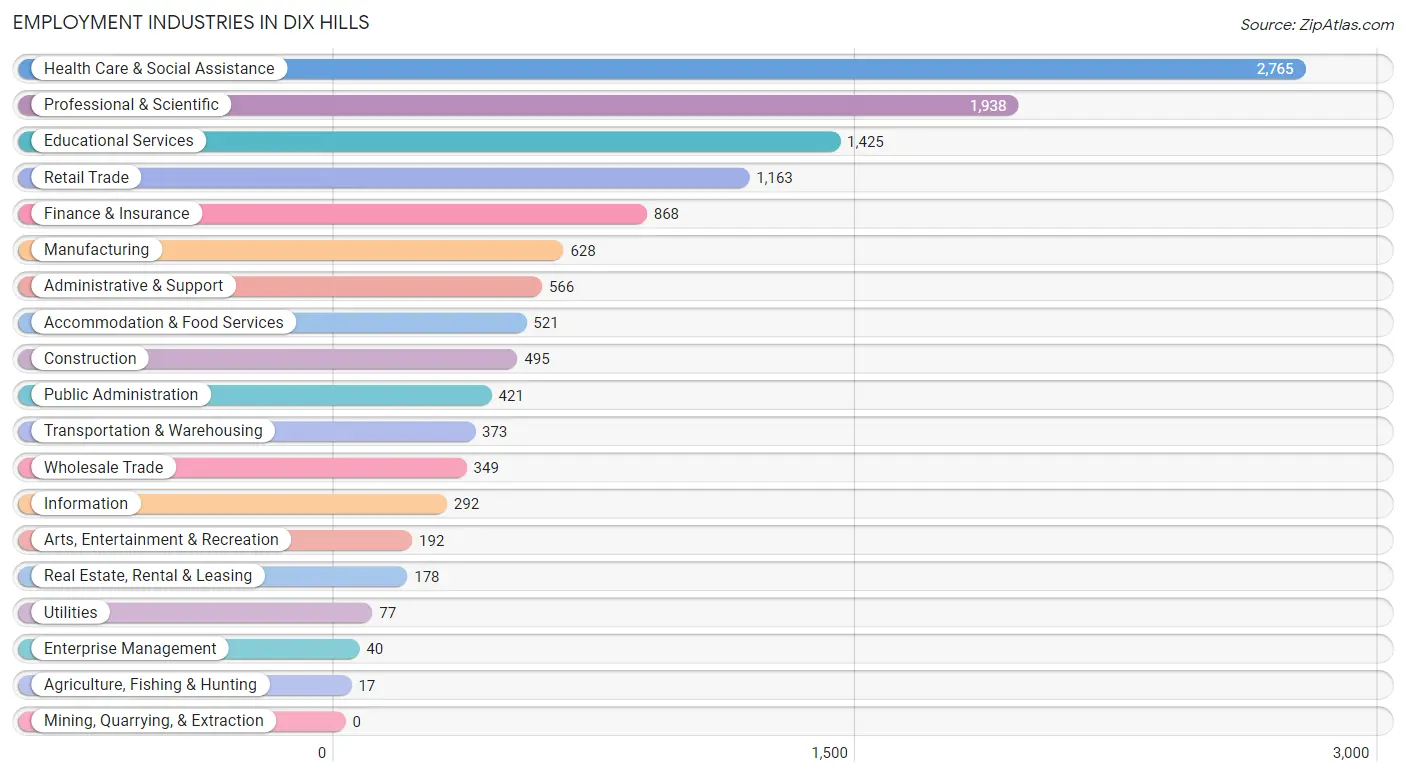
Employment Industries in Dix Hills
The major employment industries in Dix Hills include Health Care & Social Assistance (2,765 | 21.8%), Professional & Scientific (1,938 | 15.3%), Educational Services (1,425 | 11.3%), Retail Trade (1,163 | 9.2%), and Finance & Insurance (868 | 6.9%).
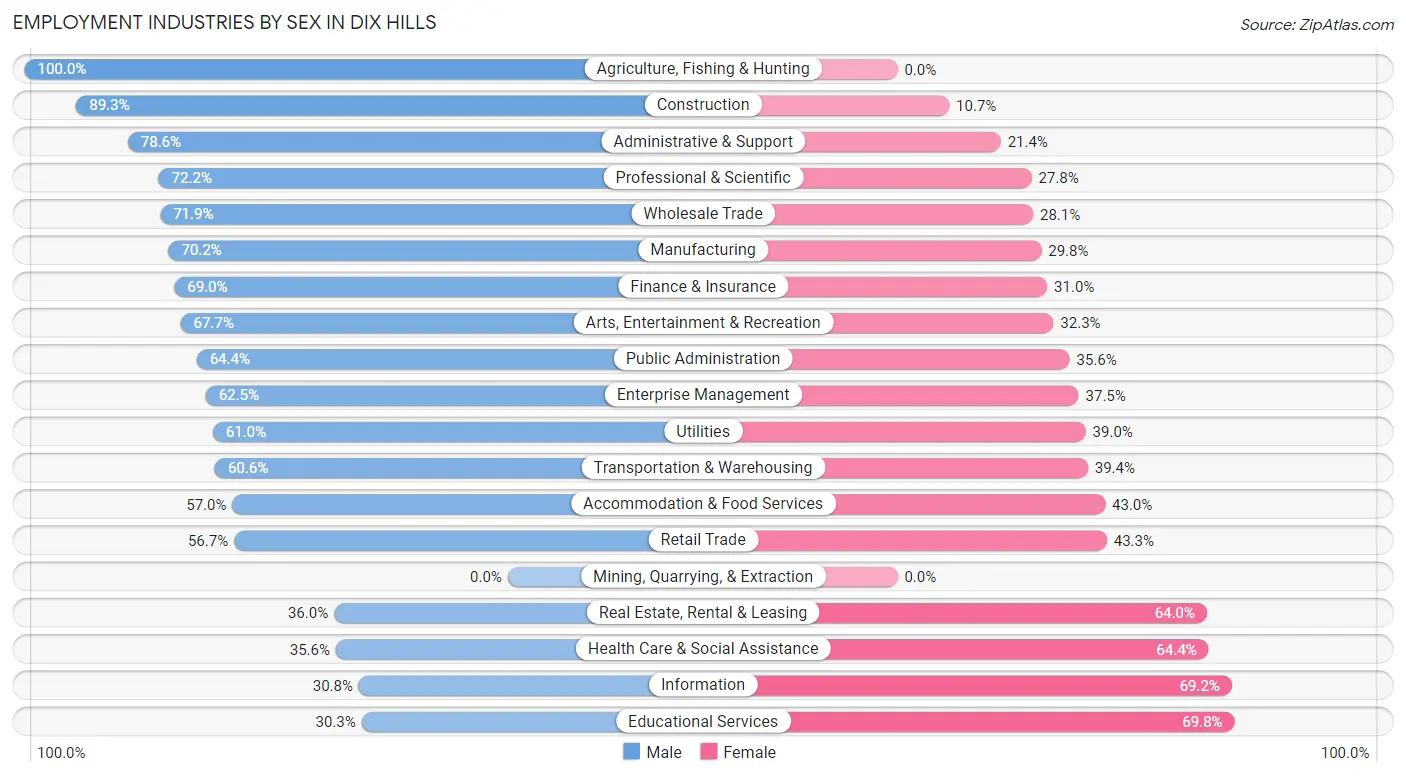
Employment Industries by Sex in Dix Hills
The Dix Hills industries that see more men than women are Agriculture, Fishing & Hunting (100.0%), Construction (89.3%), and Administrative & Support (78.6%), whereas the industries that tend to have a higher number of women are Educational Services (69.8%), Information (69.2%), and Health Care & Social Assistance (64.4%).
| Industry | Male | Female |
| Agriculture, Fishing & Hunting | 17 (100.0%) | 0 (0.0%) |
| Mining, Quarrying, & Extraction | 0 (0.0%) | 0 (0.0%) |
| Construction | 442 (89.3%) | 53 (10.7%) |
| Manufacturing | 441 (70.2%) | 187 (29.8%) |
| Wholesale Trade | 251 (71.9%) | 98 (28.1%) |
| Retail Trade | 659 (56.7%) | 504 (43.3%) |
| Transportation & Warehousing | 226 (60.6%) | 147 (39.4%) |
| Utilities | 47 (61.0%) | 30 (39.0%) |
| Information | 90 (30.8%) | 202 (69.2%) |
| Finance & Insurance | 599 (69.0%) | 269 (31.0%) |
| Real Estate, Rental & Leasing | 64 (36.0%) | 114 (64.0%) |
| Professional & Scientific | 1,400 (72.2%) | 538 (27.8%) |
| Enterprise Management | 25 (62.5%) | 15 (37.5%) |
| Administrative & Support | 445 (78.6%) | 121 (21.4%) |
| Educational Services | 431 (30.2%) | 994 (69.8%) |
| Health Care & Social Assistance | 984 (35.6%) | 1,781 (64.4%) |
| Arts, Entertainment & Recreation | 130 (67.7%) | 62 (32.3%) |
| Accommodation & Food Services | 297 (57.0%) | 224 (43.0%) |
| Public Administration | 271 (64.4%) | 150 (35.6%) |
| Total | 6,962 (54.9%) | 5,708 (45.1%) |
Education in Dix Hills
School Enrollment in Dix Hills
The most common levels of schooling among the 6,886 students in Dix Hills are college / undergraduate (1,376 | 20.0%), high school (1,372 | 19.9%), and elementary school (1,317 | 19.1%).
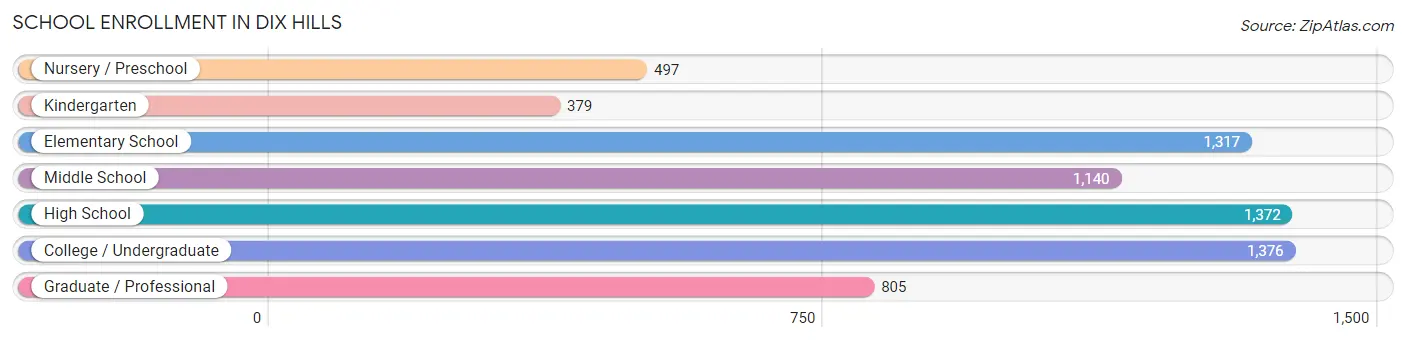
| School Level | # Students | % Students |
| Nursery / Preschool | 497 | 7.2% |
| Kindergarten | 379 | 5.5% |
| Elementary School | 1,317 | 19.1% |
| Middle School | 1,140 | 16.6% |
| High School | 1,372 | 19.9% |
| College / Undergraduate | 1,376 | 20.0% |
| Graduate / Professional | 805 | 11.7% |
| Total | 6,886 | 100.0% |
School Enrollment by Age by Funding Source in Dix Hills
Out of a total of 6,886 students who are enrolled in schools in Dix Hills, 1,577 (22.9%) attend a private institution, while the remaining 5,309 (77.1%) are enrolled in public schools. The age group of 25 to 34 year olds has the highest likelihood of being enrolled in private schools, with 307 (57.8% in the age bracket) enrolled. Conversely, the age group of 15 to 17 year olds has the lowest likelihood of being enrolled in a private school, with 1,017 (96.1% in the age bracket) attending a public institution.
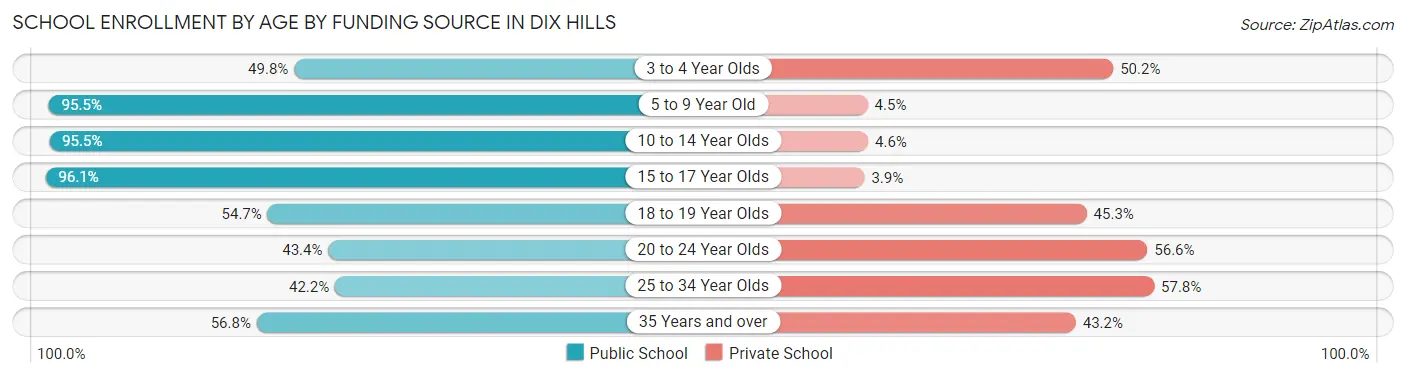
| Age Bracket | Public School | Private School |
| 3 to 4 Year Olds | 240 (49.8%) | 242 (50.2%) |
| 5 to 9 Year Old | 1,604 (95.5%) | 75 (4.5%) |
| 10 to 14 Year Olds | 1,344 (95.5%) | 64 (4.5%) |
| 15 to 17 Year Olds | 1,017 (96.1%) | 41 (3.9%) |
| 18 to 19 Year Olds | 283 (54.7%) | 234 (45.3%) |
| 20 to 24 Year Olds | 301 (43.4%) | 392 (56.6%) |
| 25 to 34 Year Olds | 224 (42.2%) | 307 (57.8%) |
| 35 Years and over | 294 (56.8%) | 224 (43.2%) |
| Total | 5,309 (77.1%) | 1,577 (22.9%) |
Educational Attainment by Field of Study in Dix Hills
Business (2,646 | 21.8%), science & technology (1,455 | 12.0%), education (1,320 | 10.9%), social sciences (1,018 | 8.4%), and bio, nature & agricultural (1,009 | 8.3%) are the most common fields of study among 12,154 individuals in Dix Hills who have obtained a bachelor's degree or higher.
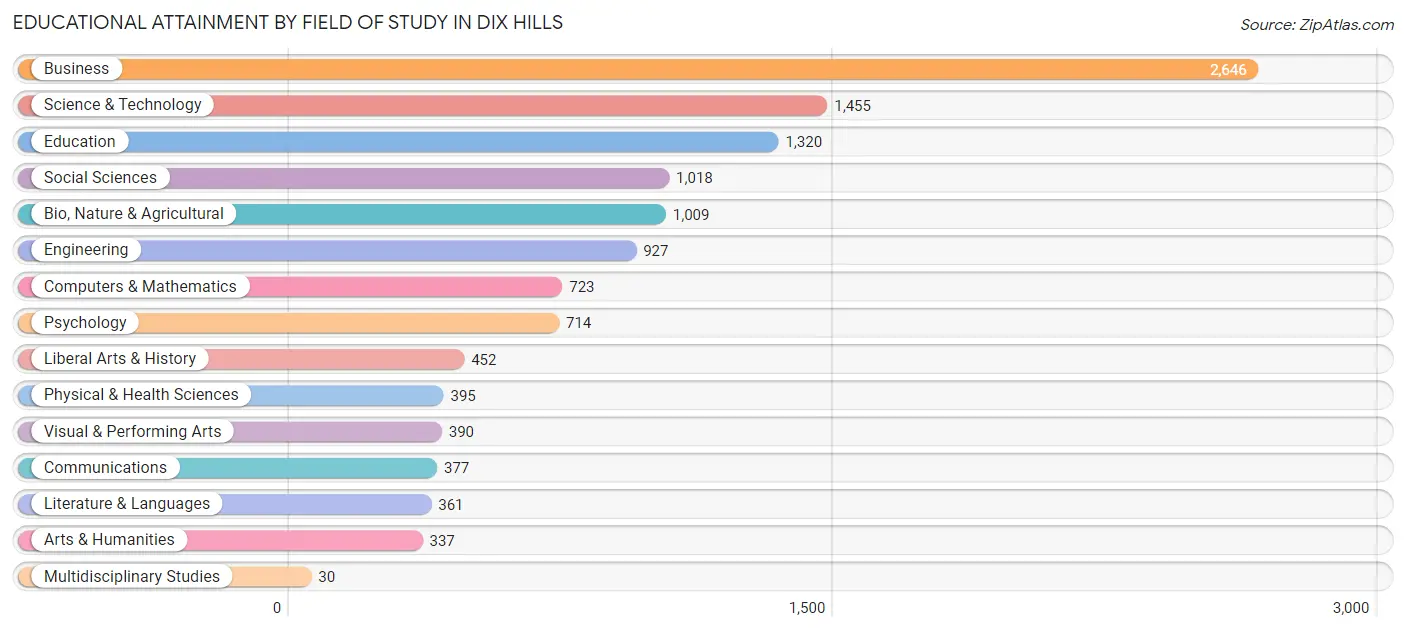
| Field of Study | # Graduates | % Graduates |
| Computers & Mathematics | 723 | 5.9% |
| Bio, Nature & Agricultural | 1,009 | 8.3% |
| Physical & Health Sciences | 395 | 3.3% |
| Psychology | 714 | 5.9% |
| Social Sciences | 1,018 | 8.4% |
| Engineering | 927 | 7.6% |
| Multidisciplinary Studies | 30 | 0.3% |
| Science & Technology | 1,455 | 12.0% |
| Business | 2,646 | 21.8% |
| Education | 1,320 | 10.9% |
| Literature & Languages | 361 | 3.0% |
| Liberal Arts & History | 452 | 3.7% |
| Visual & Performing Arts | 390 | 3.2% |
| Communications | 377 | 3.1% |
| Arts & Humanities | 337 | 2.8% |
| Total | 12,154 | 100.0% |
Transportation & Commute in Dix Hills
Vehicle Availability by Sex in Dix Hills
The most prevalent vehicle ownership categories in Dix Hills are males with 2 vehicles (2,723, accounting for 40.0%) and females with 2 vehicles (2,022, making up 50.6%).
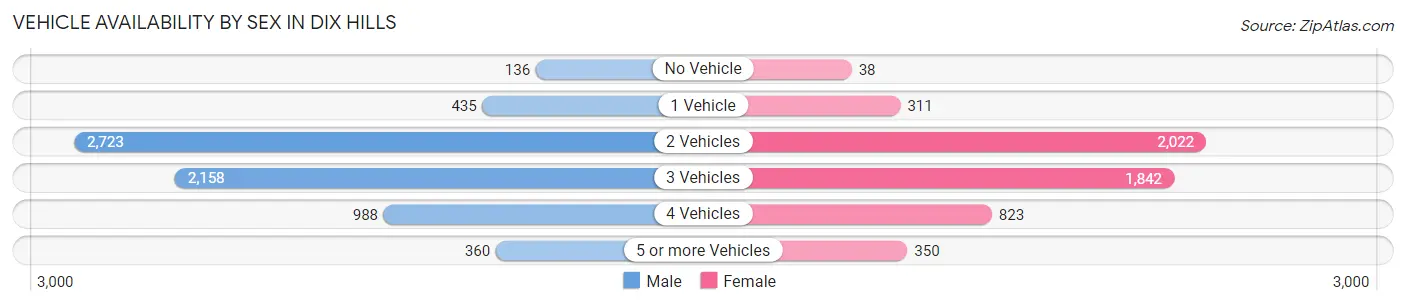
| Vehicles Available | Male | Female |
| No Vehicle | 136 (2.0%) | 38 (0.7%) |
| 1 Vehicle | 435 (6.4%) | 311 (5.8%) |
| 2 Vehicles | 2,723 (40.0%) | 2,022 (37.5%) |
| 3 Vehicles | 2,158 (31.7%) | 1,842 (34.2%) |
| 4 Vehicles | 988 (14.5%) | 823 (15.3%) |
| 5 or more Vehicles | 360 (5.3%) | 350 (6.5%) |
| Total | 6,800 (100.0%) | 5,386 (100.0%) |
Commute Time in Dix Hills
The most frequently occuring commute durations in Dix Hills are 20 to 24 minutes (1,532 commuters, 15.0%), 15 to 19 minutes (1,481 commuters, 14.5%), and 45 to 59 minutes (1,339 commuters, 13.1%).
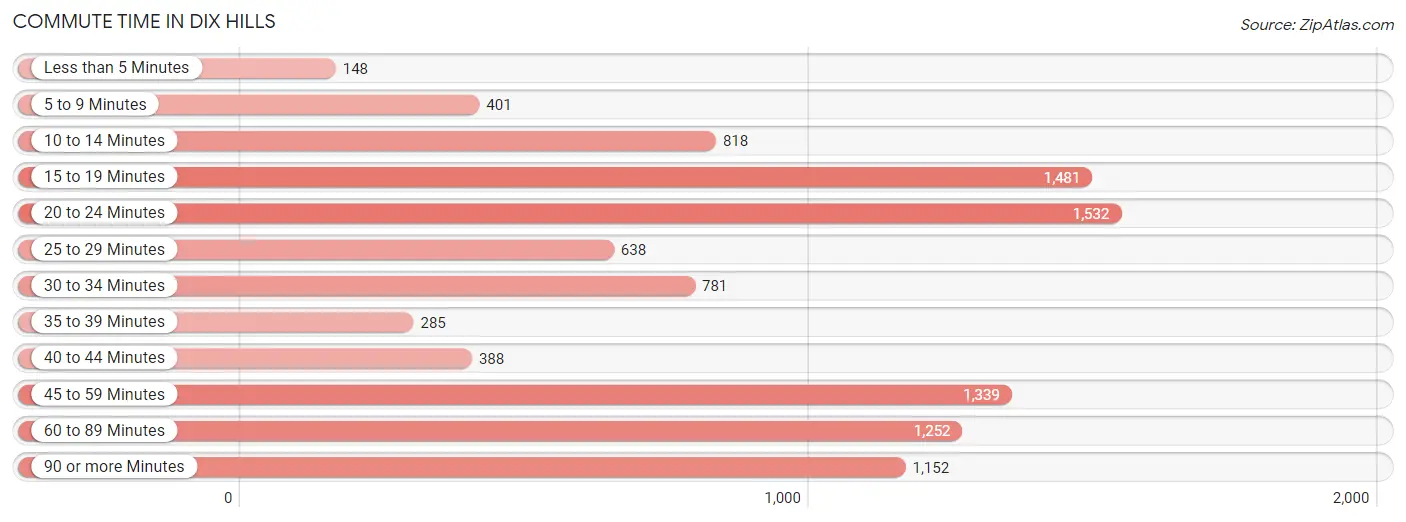
| Commute Time | # Commuters | % Commuters |
| Less than 5 Minutes | 148 | 1.5% |
| 5 to 9 Minutes | 401 | 3.9% |
| 10 to 14 Minutes | 818 | 8.0% |
| 15 to 19 Minutes | 1,481 | 14.5% |
| 20 to 24 Minutes | 1,532 | 15.0% |
| 25 to 29 Minutes | 638 | 6.2% |
| 30 to 34 Minutes | 781 | 7.6% |
| 35 to 39 Minutes | 285 | 2.8% |
| 40 to 44 Minutes | 388 | 3.8% |
| 45 to 59 Minutes | 1,339 | 13.1% |
| 60 to 89 Minutes | 1,252 | 12.3% |
| 90 or more Minutes | 1,152 | 11.3% |
Commute Time by Sex in Dix Hills
The most common commute times in Dix Hills are 20 to 24 minutes (919 commuters, 16.3%) for males and 15 to 19 minutes (780 commuters, 17.0%) for females.
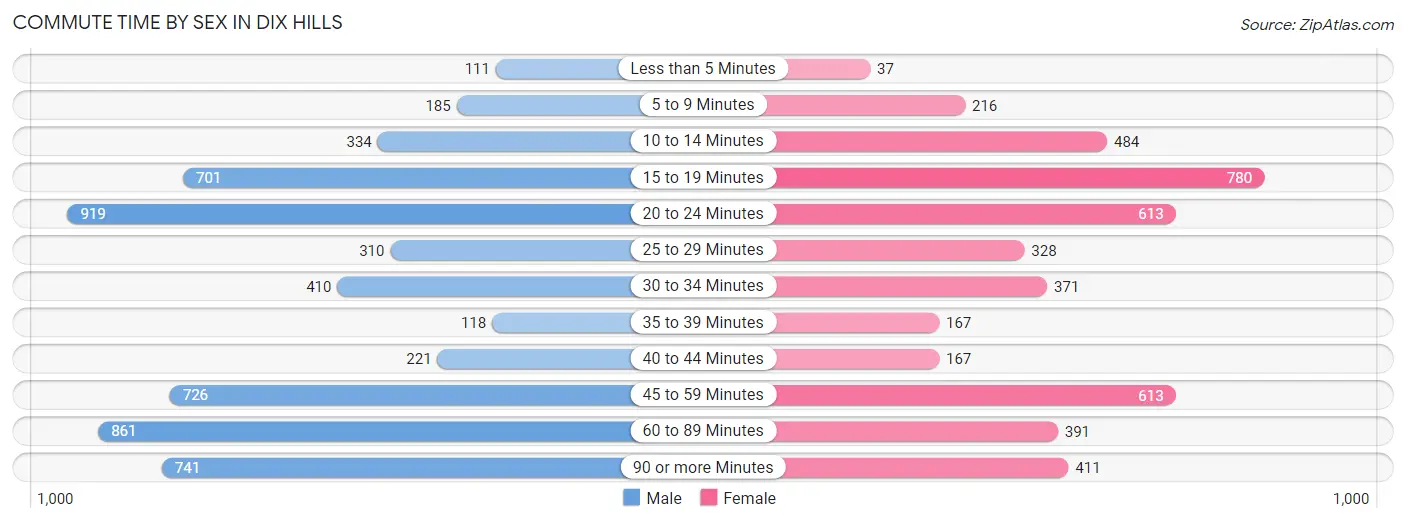
| Commute Time | Male | Female |
| Less than 5 Minutes | 111 (2.0%) | 37 (0.8%) |
| 5 to 9 Minutes | 185 (3.3%) | 216 (4.7%) |
| 10 to 14 Minutes | 334 (5.9%) | 484 (10.6%) |
| 15 to 19 Minutes | 701 (12.4%) | 780 (17.0%) |
| 20 to 24 Minutes | 919 (16.3%) | 613 (13.4%) |
| 25 to 29 Minutes | 310 (5.5%) | 328 (7.2%) |
| 30 to 34 Minutes | 410 (7.3%) | 371 (8.1%) |
| 35 to 39 Minutes | 118 (2.1%) | 167 (3.6%) |
| 40 to 44 Minutes | 221 (3.9%) | 167 (3.6%) |
| 45 to 59 Minutes | 726 (12.9%) | 613 (13.4%) |
| 60 to 89 Minutes | 861 (15.3%) | 391 (8.5%) |
| 90 or more Minutes | 741 (13.2%) | 411 (9.0%) |
Time of Departure to Work by Sex in Dix Hills
The most frequent times of departure to work in Dix Hills are 7:00 AM to 7:29 AM (788, 14.0%) for males and 8:00 AM to 8:29 AM (960, 21.0%) for females.
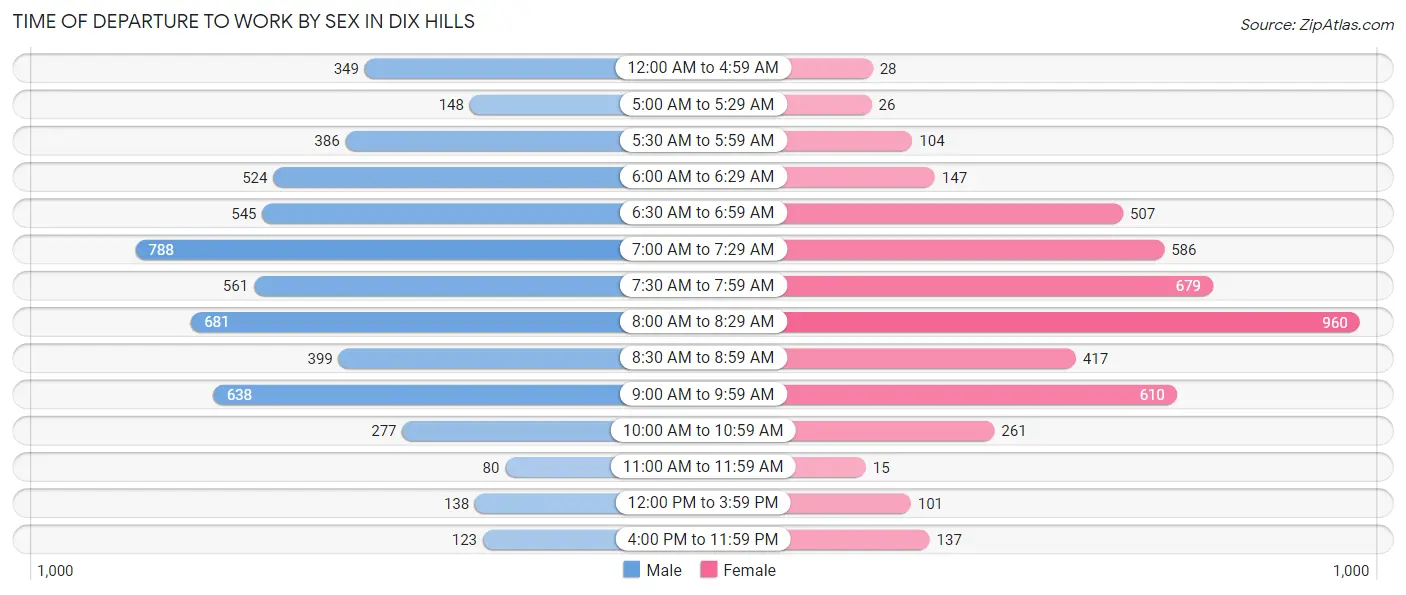
| Time of Departure | Male | Female |
| 12:00 AM to 4:59 AM | 349 (6.2%) | 28 (0.6%) |
| 5:00 AM to 5:29 AM | 148 (2.6%) | 26 (0.6%) |
| 5:30 AM to 5:59 AM | 386 (6.9%) | 104 (2.3%) |
| 6:00 AM to 6:29 AM | 524 (9.3%) | 147 (3.2%) |
| 6:30 AM to 6:59 AM | 545 (9.7%) | 507 (11.1%) |
| 7:00 AM to 7:29 AM | 788 (14.0%) | 586 (12.8%) |
| 7:30 AM to 7:59 AM | 561 (10.0%) | 679 (14.8%) |
| 8:00 AM to 8:29 AM | 681 (12.1%) | 960 (21.0%) |
| 8:30 AM to 8:59 AM | 399 (7.1%) | 417 (9.1%) |
| 9:00 AM to 9:59 AM | 638 (11.3%) | 610 (13.3%) |
| 10:00 AM to 10:59 AM | 277 (4.9%) | 261 (5.7%) |
| 11:00 AM to 11:59 AM | 80 (1.4%) | 15 (0.3%) |
| 12:00 PM to 3:59 PM | 138 (2.5%) | 101 (2.2%) |
| 4:00 PM to 11:59 PM | 123 (2.2%) | 137 (3.0%) |
| Total | 5,637 (100.0%) | 4,578 (100.0%) |
Housing Occupancy in Dix Hills
Occupancy by Ownership in Dix Hills
Of the total 7,713 dwellings in Dix Hills, owner-occupied units account for 7,441 (96.5%), while renter-occupied units make up 272 (3.5%).
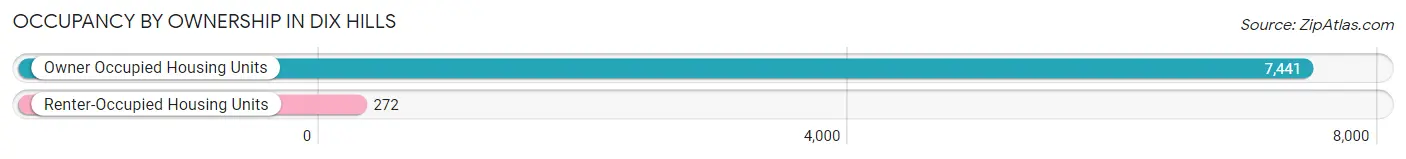
| Occupancy | # Housing Units | % Housing Units |
| Owner Occupied Housing Units | 7,441 | 96.5% |
| Renter-Occupied Housing Units | 272 | 3.5% |
| Total Occupied Housing Units | 7,713 | 100.0% |
Occupancy by Household Size in Dix Hills
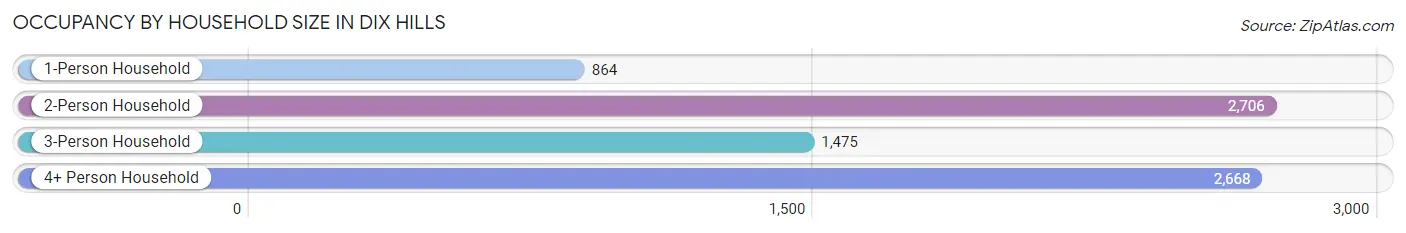
| Household Size | # Housing Units | % Housing Units |
| 1-Person Household | 864 | 11.2% |
| 2-Person Household | 2,706 | 35.1% |
| 3-Person Household | 1,475 | 19.1% |
| 4+ Person Household | 2,668 | 34.6% |
| Total Housing Units | 7,713 | 100.0% |
Occupancy by Ownership by Household Size in Dix Hills
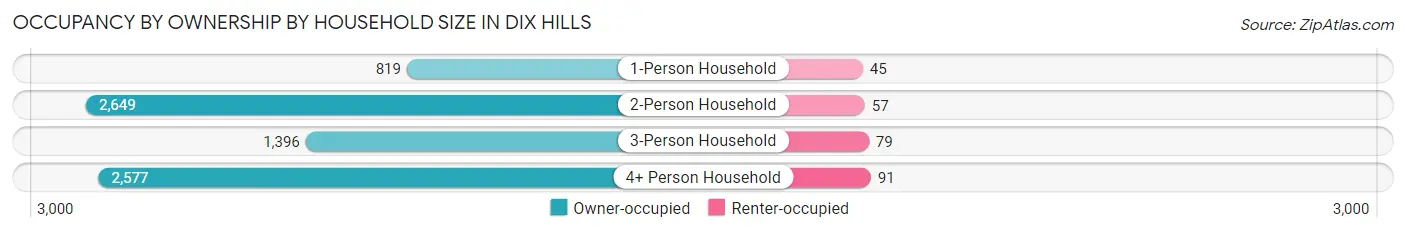
| Household Size | Owner-occupied | Renter-occupied |
| 1-Person Household | 819 (94.8%) | 45 (5.2%) |
| 2-Person Household | 2,649 (97.9%) | 57 (2.1%) |
| 3-Person Household | 1,396 (94.6%) | 79 (5.4%) |
| 4+ Person Household | 2,577 (96.6%) | 91 (3.4%) |
| Total Housing Units | 7,441 (96.5%) | 272 (3.5%) |
Occupancy by Educational Attainment in Dix Hills
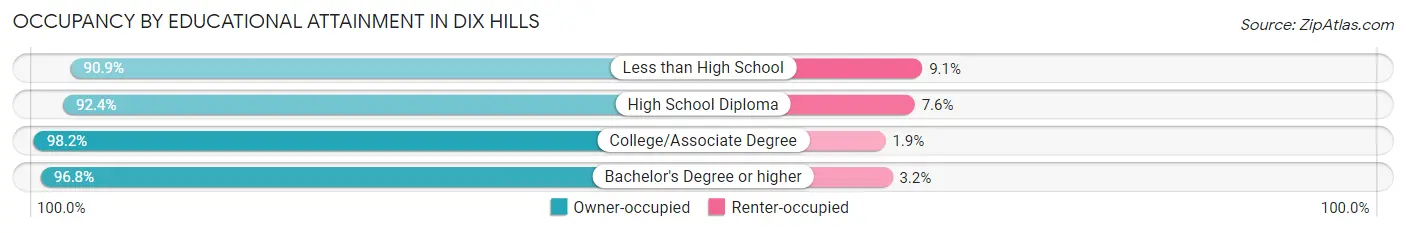
| Household Size | Owner-occupied | Renter-occupied |
| Less than High School | 199 (90.9%) | 20 (9.1%) |
| High School Diploma | 629 (92.4%) | 52 (7.6%) |
| College/Associate Degree | 1,429 (98.2%) | 27 (1.8%) |
| Bachelor's Degree or higher | 5,184 (96.8%) | 173 (3.2%) |
Occupancy by Age of Householder in Dix Hills
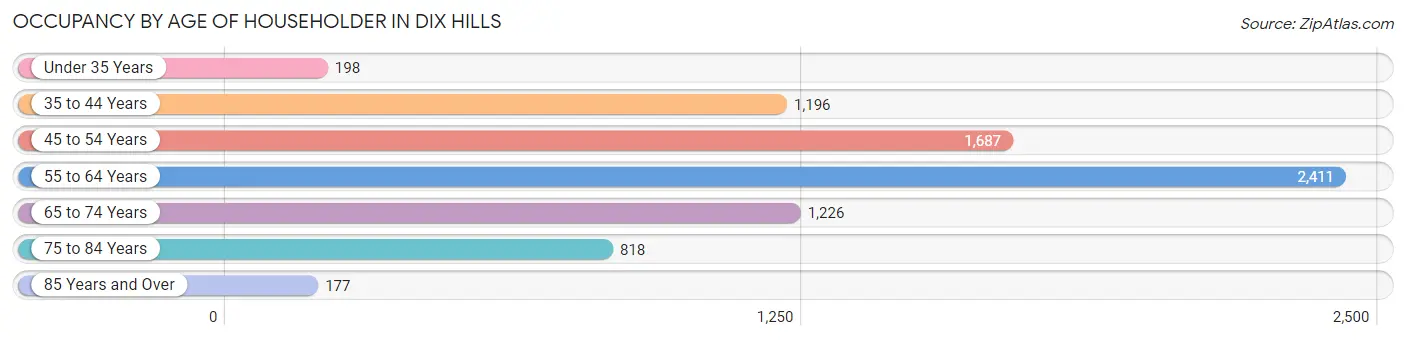
| Age Bracket | # Households | % Households |
| Under 35 Years | 198 | 2.6% |
| 35 to 44 Years | 1,196 | 15.5% |
| 45 to 54 Years | 1,687 | 21.9% |
| 55 to 64 Years | 2,411 | 31.3% |
| 65 to 74 Years | 1,226 | 15.9% |
| 75 to 84 Years | 818 | 10.6% |
| 85 Years and Over | 177 | 2.3% |
| Total | 7,713 | 100.0% |
Housing Finances in Dix Hills
Median Income by Occupancy in Dix Hills
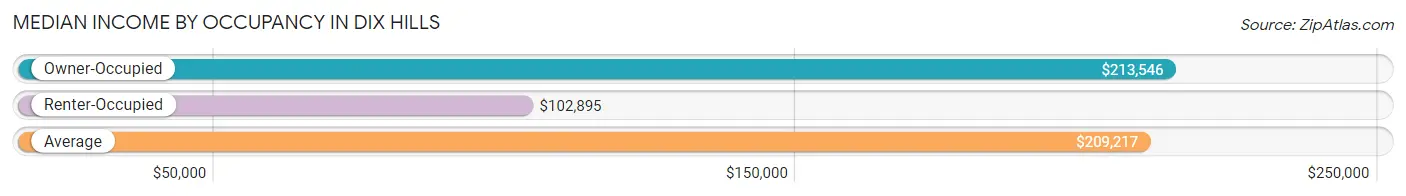
| Occupancy Type | # Households | Median Income |
| Owner-Occupied | 7,441 (96.5%) | $213,546 |
| Renter-Occupied | 272 (3.5%) | $102,895 |
| Average | 7,713 (100.0%) | $209,217 |
Occupancy by Householder Income Bracket in Dix Hills
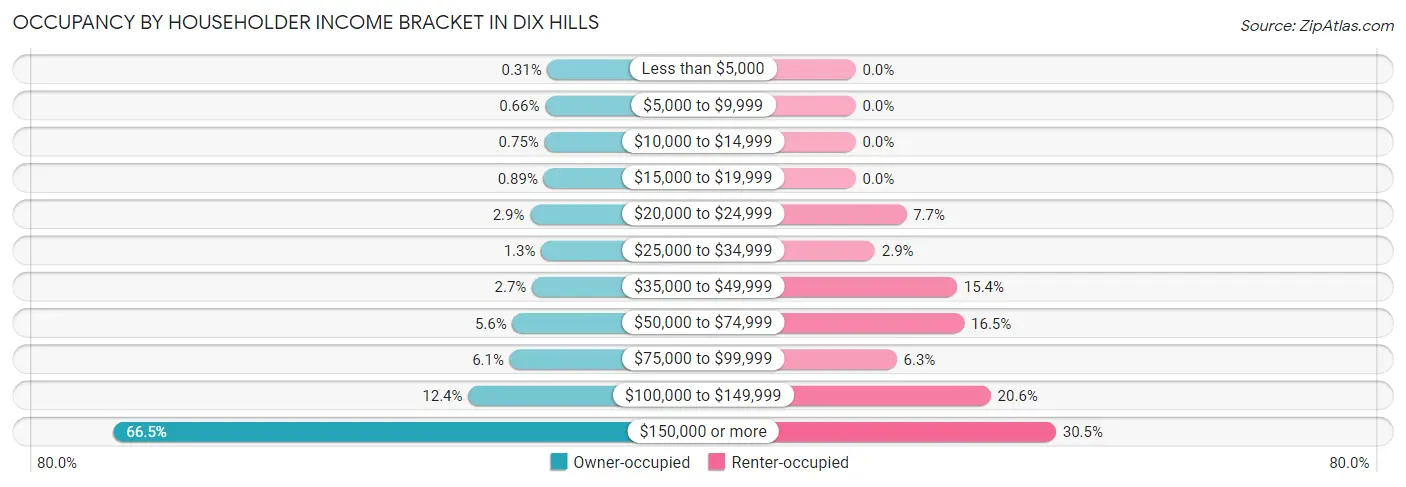
| Income Bracket | Owner-occupied | Renter-occupied |
| Less than $5,000 | 23 (0.3%) | 0 (0.0%) |
| $5,000 to $9,999 | 49 (0.7%) | 0 (0.0%) |
| $10,000 to $14,999 | 56 (0.7%) | 0 (0.0%) |
| $15,000 to $19,999 | 66 (0.9%) | 0 (0.0%) |
| $20,000 to $24,999 | 219 (2.9%) | 21 (7.7%) |
| $25,000 to $34,999 | 94 (1.3%) | 8 (2.9%) |
| $35,000 to $49,999 | 197 (2.6%) | 42 (15.4%) |
| $50,000 to $74,999 | 420 (5.6%) | 45 (16.5%) |
| $75,000 to $99,999 | 451 (6.1%) | 17 (6.2%) |
| $100,000 to $149,999 | 921 (12.4%) | 56 (20.6%) |
| $150,000 or more | 4,945 (66.5%) | 83 (30.5%) |
| Total | 7,441 (100.0%) | 272 (100.0%) |
Monthly Housing Cost Tiers in Dix Hills
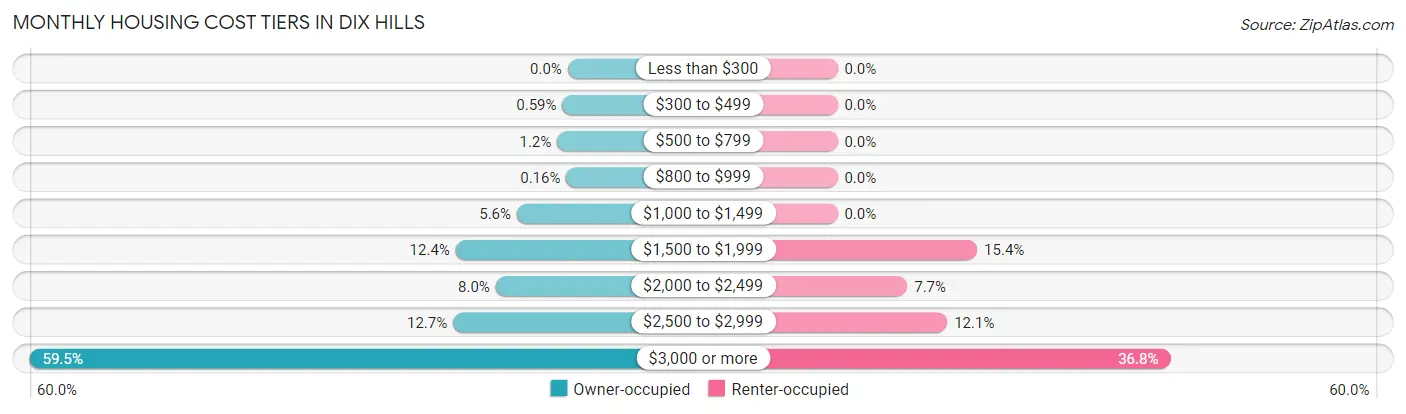
| Monthly Cost | Owner-occupied | Renter-occupied |
| Less than $300 | 0 (0.0%) | 0 (0.0%) |
| $300 to $499 | 44 (0.6%) | 0 (0.0%) |
| $500 to $799 | 87 (1.2%) | 0 (0.0%) |
| $800 to $999 | 12 (0.2%) | 0 (0.0%) |
| $1,000 to $1,499 | 418 (5.6%) | 0 (0.0%) |
| $1,500 to $1,999 | 921 (12.4%) | 42 (15.4%) |
| $2,000 to $2,499 | 592 (8.0%) | 21 (7.7%) |
| $2,500 to $2,999 | 943 (12.7%) | 33 (12.1%) |
| $3,000 or more | 4,424 (59.5%) | 100 (36.8%) |
| Total | 7,441 (100.0%) | 272 (100.0%) |
Physical Housing Characteristics in Dix Hills
Housing Structures in Dix Hills
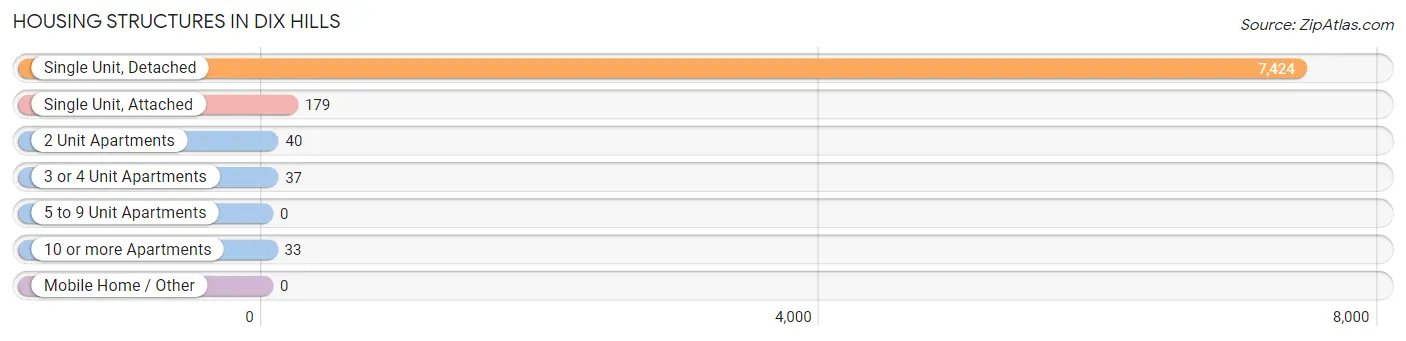
| Structure Type | # Housing Units | % Housing Units |
| Single Unit, Detached | 7,424 | 96.3% |
| Single Unit, Attached | 179 | 2.3% |
| 2 Unit Apartments | 40 | 0.5% |
| 3 or 4 Unit Apartments | 37 | 0.5% |
| 5 to 9 Unit Apartments | 0 | 0.0% |
| 10 or more Apartments | 33 | 0.4% |
| Mobile Home / Other | 0 | 0.0% |
| Total | 7,713 | 100.0% |
Housing Structures by Occupancy in Dix Hills
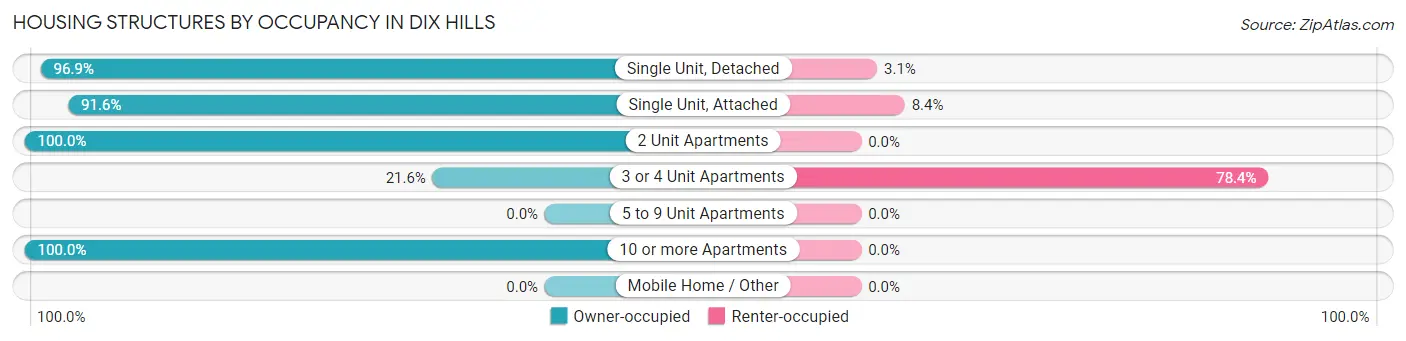
| Structure Type | Owner-occupied | Renter-occupied |
| Single Unit, Detached | 7,196 (96.9%) | 228 (3.1%) |
| Single Unit, Attached | 164 (91.6%) | 15 (8.4%) |
| 2 Unit Apartments | 40 (100.0%) | 0 (0.0%) |
| 3 or 4 Unit Apartments | 8 (21.6%) | 29 (78.4%) |
| 5 to 9 Unit Apartments | 0 (0.0%) | 0 (0.0%) |
| 10 or more Apartments | 33 (100.0%) | 0 (0.0%) |
| Mobile Home / Other | 0 (0.0%) | 0 (0.0%) |
| Total | 7,441 (96.5%) | 272 (3.5%) |
Housing Structures by Number of Rooms in Dix Hills
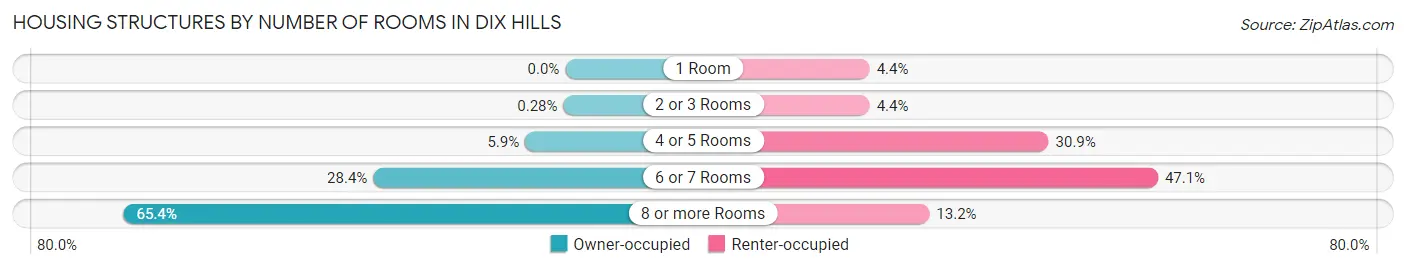
| Number of Rooms | Owner-occupied | Renter-occupied |
| 1 Room | 0 (0.0%) | 12 (4.4%) |
| 2 or 3 Rooms | 21 (0.3%) | 12 (4.4%) |
| 4 or 5 Rooms | 442 (5.9%) | 84 (30.9%) |
| 6 or 7 Rooms | 2,115 (28.4%) | 128 (47.1%) |
| 8 or more Rooms | 4,863 (65.3%) | 36 (13.2%) |
| Total | 7,441 (100.0%) | 272 (100.0%) |
Housing Structure by Heating Type in Dix Hills
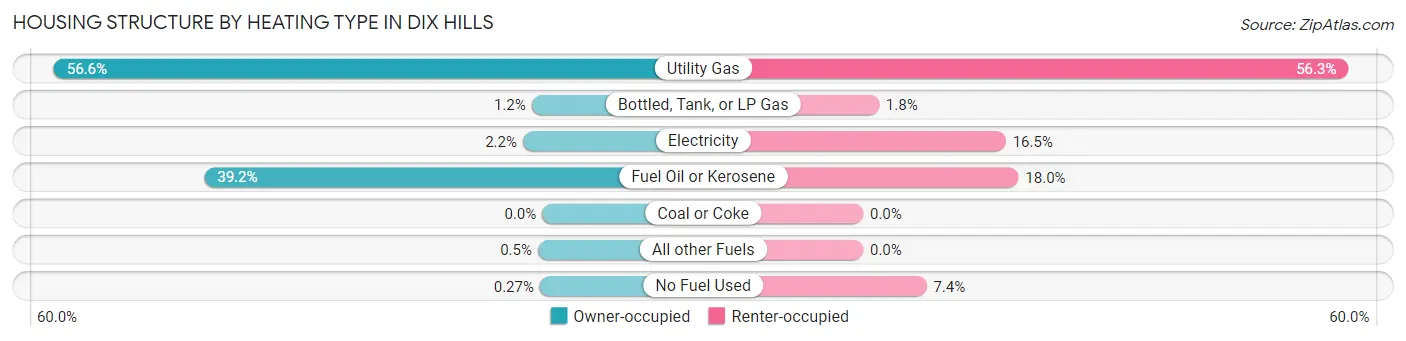
| Heating Type | Owner-occupied | Renter-occupied |
| Utility Gas | 4,212 (56.6%) | 153 (56.2%) |
| Bottled, Tank, or LP Gas | 91 (1.2%) | 5 (1.8%) |
| Electricity | 167 (2.2%) | 45 (16.5%) |
| Fuel Oil or Kerosene | 2,914 (39.2%) | 49 (18.0%) |
| Coal or Coke | 0 (0.0%) | 0 (0.0%) |
| All other Fuels | 37 (0.5%) | 0 (0.0%) |
| No Fuel Used | 20 (0.3%) | 20 (7.3%) |
| Total | 7,441 (100.0%) | 272 (100.0%) |
Household Vehicle Usage in Dix Hills
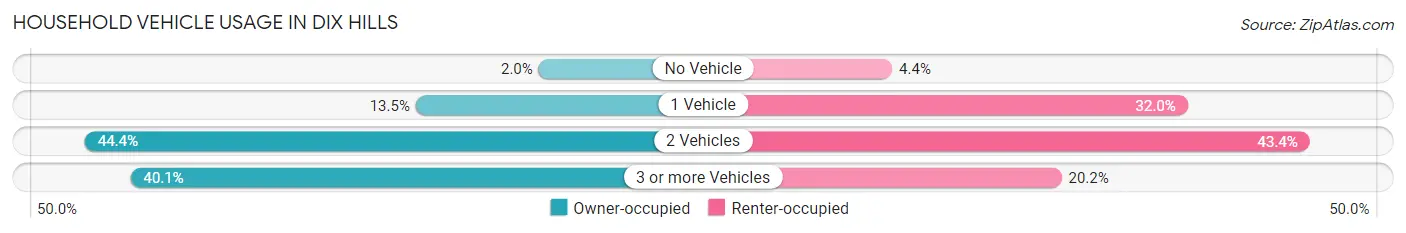
| Vehicles per Household | Owner-occupied | Renter-occupied |
| No Vehicle | 150 (2.0%) | 12 (4.4%) |
| 1 Vehicle | 1,004 (13.5%) | 87 (32.0%) |
| 2 Vehicles | 3,302 (44.4%) | 118 (43.4%) |
| 3 or more Vehicles | 2,985 (40.1%) | 55 (20.2%) |
| Total | 7,441 (100.0%) | 272 (100.0%) |
Real Estate & Mortgages in Dix Hills
Real Estate and Mortgage Overview in Dix Hills
| Characteristic | Without Mortgage | With Mortgage |
| Housing Units | 2,849 | 4,592 |
| Median Property Value | $813,100 | $867,300 |
| Median Household Income | $171,103 | $3,367 |
| Monthly Housing Costs | $1,501 | $3,945 |
| Real Estate Taxes | $10,001 | $32 |
Property Value by Mortgage Status in Dix Hills
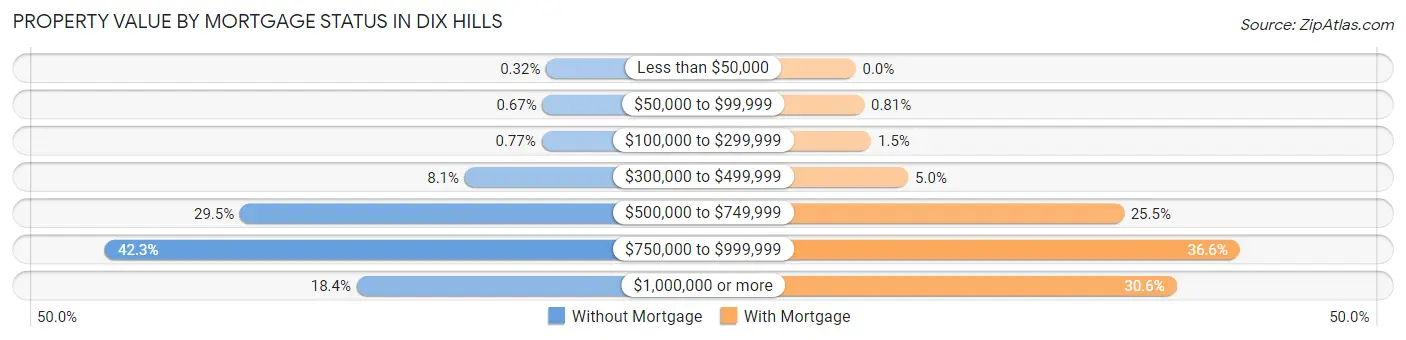
| Property Value | Without Mortgage | With Mortgage |
| Less than $50,000 | 9 (0.3%) | 0 (0.0%) |
| $50,000 to $99,999 | 19 (0.7%) | 37 (0.8%) |
| $100,000 to $299,999 | 22 (0.8%) | 68 (1.5%) |
| $300,000 to $499,999 | 230 (8.1%) | 230 (5.0%) |
| $500,000 to $749,999 | 840 (29.5%) | 1,173 (25.5%) |
| $750,000 to $999,999 | 1,206 (42.3%) | 1,680 (36.6%) |
| $1,000,000 or more | 523 (18.4%) | 1,404 (30.6%) |
| Total | 2,849 (100.0%) | 4,592 (100.0%) |
Household Income by Mortgage Status in Dix Hills
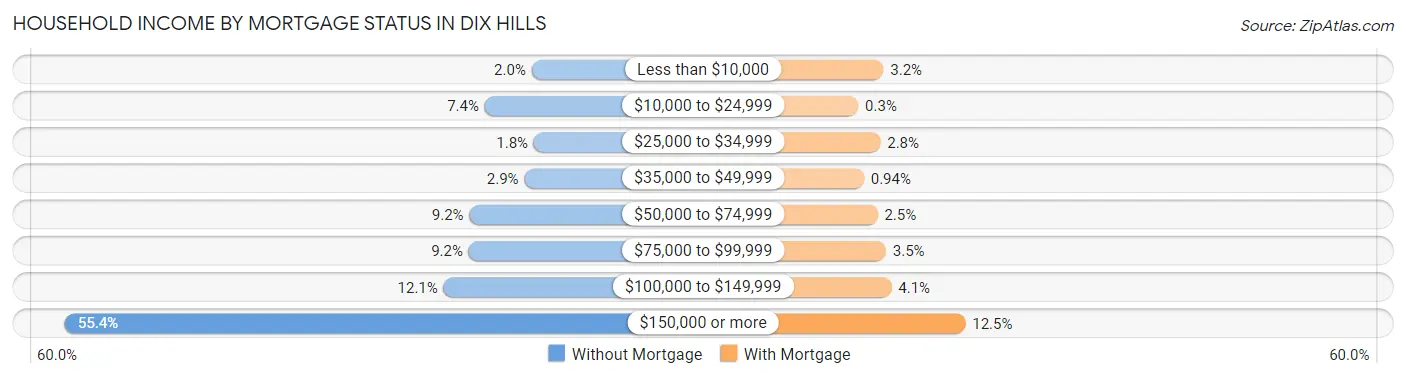
| Household Income | Without Mortgage | With Mortgage |
| Less than $10,000 | 58 (2.0%) | 146 (3.2%) |
| $10,000 to $24,999 | 211 (7.4%) | 14 (0.3%) |
| $25,000 to $34,999 | 51 (1.8%) | 130 (2.8%) |
| $35,000 to $49,999 | 82 (2.9%) | 43 (0.9%) |
| $50,000 to $74,999 | 261 (9.2%) | 115 (2.5%) |
| $75,000 to $99,999 | 263 (9.2%) | 159 (3.5%) |
| $100,000 to $149,999 | 345 (12.1%) | 188 (4.1%) |
| $150,000 or more | 1,578 (55.4%) | 576 (12.5%) |
| Total | 2,849 (100.0%) | 4,592 (100.0%) |
Property Value to Household Income Ratio in Dix Hills
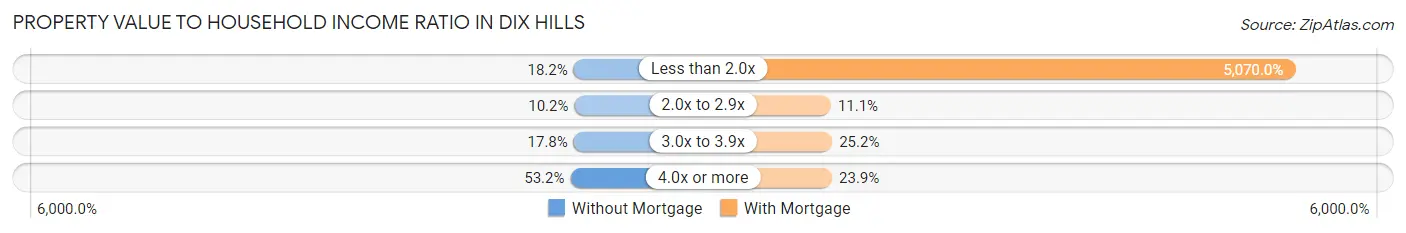
| Value-to-Income Ratio | Without Mortgage | With Mortgage |
| Less than 2.0x | 518 (18.2%) | 232,813 (5,070.0%) |
| 2.0x to 2.9x | 290 (10.2%) | 509 (11.1%) |
| 3.0x to 3.9x | 506 (17.8%) | 1,155 (25.2%) |
| 4.0x or more | 1,516 (53.2%) | 1,096 (23.9%) |
| Total | 2,849 (100.0%) | 4,592 (100.0%) |
Real Estate Taxes by Mortgage Status in Dix Hills
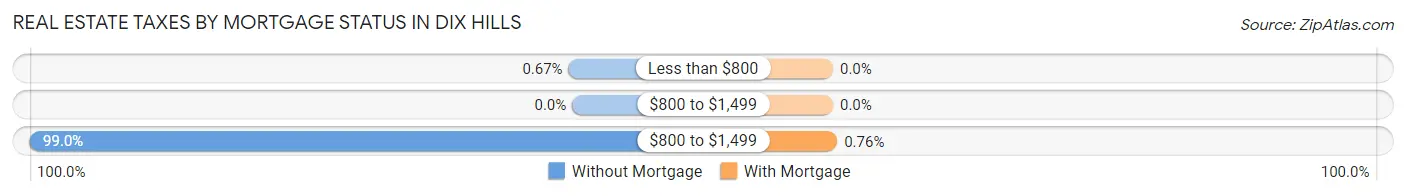
| Property Taxes | Without Mortgage | With Mortgage |
| Less than $800 | 19 (0.7%) | 0 (0.0%) |
| $800 to $1,499 | 0 (0.0%) | 0 (0.0%) |
| $800 to $1,499 | 2,821 (99.0%) | 35 (0.8%) |
| Total | 2,849 (100.0%) | 4,592 (100.0%) |
Health & Disability in Dix Hills
Health Insurance Coverage by Age in Dix Hills
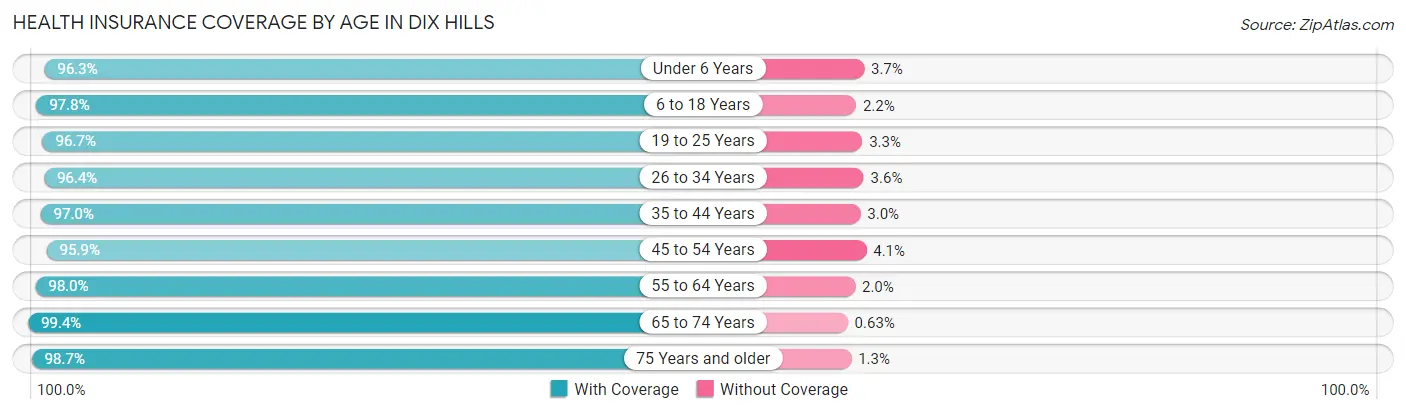
| Age Bracket | With Coverage | Without Coverage |
| Under 6 Years | 1,125 (96.3%) | 43 (3.7%) |
| 6 to 18 Years | 4,175 (97.8%) | 93 (2.2%) |
| 19 to 25 Years | 1,883 (96.7%) | 65 (3.3%) |
| 26 to 34 Years | 1,631 (96.4%) | 61 (3.6%) |
| 35 to 44 Years | 2,565 (97.0%) | 79 (3.0%) |
| 45 to 54 Years | 3,533 (95.9%) | 151 (4.1%) |
| 55 to 64 Years | 4,411 (98.0%) | 90 (2.0%) |
| 65 to 74 Years | 2,829 (99.4%) | 18 (0.6%) |
| 75 Years and older | 1,831 (98.7%) | 24 (1.3%) |
| Total | 23,983 (97.5%) | 624 (2.5%) |
Health Insurance Coverage by Citizenship Status in Dix Hills
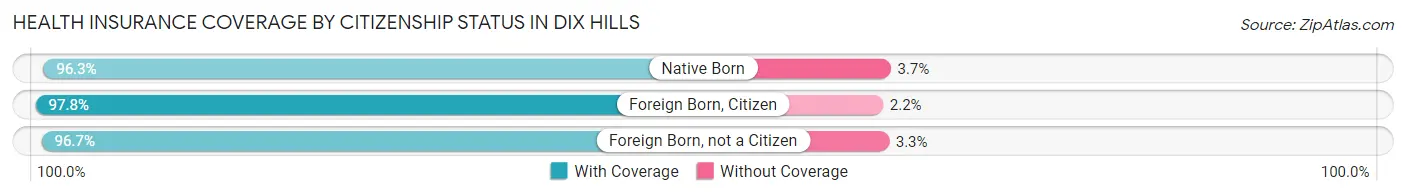
| Citizenship Status | With Coverage | Without Coverage |
| Native Born | 1,125 (96.3%) | 43 (3.7%) |
| Foreign Born, Citizen | 4,175 (97.8%) | 93 (2.2%) |
| Foreign Born, not a Citizen | 1,883 (96.7%) | 65 (3.3%) |
Health Insurance Coverage by Household Income in Dix Hills
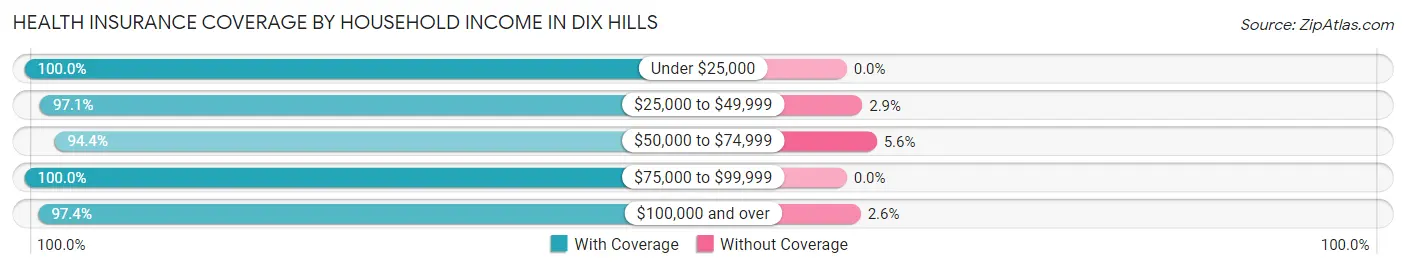
| Household Income | With Coverage | Without Coverage |
| Under $25,000 | 739 (100.0%) | 0 (0.0%) |
| $25,000 to $49,999 | 804 (97.1%) | 24 (2.9%) |
| $50,000 to $74,999 | 1,144 (94.4%) | 68 (5.6%) |
| $75,000 to $99,999 | 1,304 (100.0%) | 0 (0.0%) |
| $100,000 and over | 19,755 (97.4%) | 529 (2.6%) |
Public vs Private Health Insurance Coverage by Age in Dix Hills
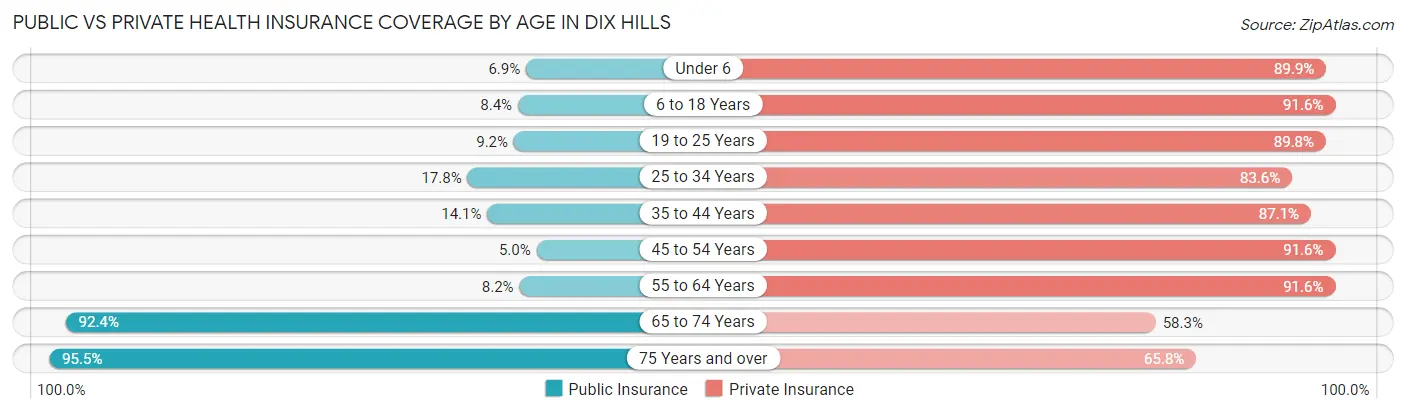
| Age Bracket | Public Insurance | Private Insurance |
| Under 6 | 81 (6.9%) | 1,050 (89.9%) |
| 6 to 18 Years | 360 (8.4%) | 3,908 (91.6%) |
| 19 to 25 Years | 179 (9.2%) | 1,750 (89.8%) |
| 25 to 34 Years | 301 (17.8%) | 1,414 (83.6%) |
| 35 to 44 Years | 373 (14.1%) | 2,302 (87.1%) |
| 45 to 54 Years | 183 (5.0%) | 3,374 (91.6%) |
| 55 to 64 Years | 367 (8.2%) | 4,122 (91.6%) |
| 65 to 74 Years | 2,630 (92.4%) | 1,659 (58.3%) |
| 75 Years and over | 1,771 (95.5%) | 1,220 (65.8%) |
| Total | 6,245 (25.4%) | 20,799 (84.5%) |
Disability Status by Sex by Age in Dix Hills
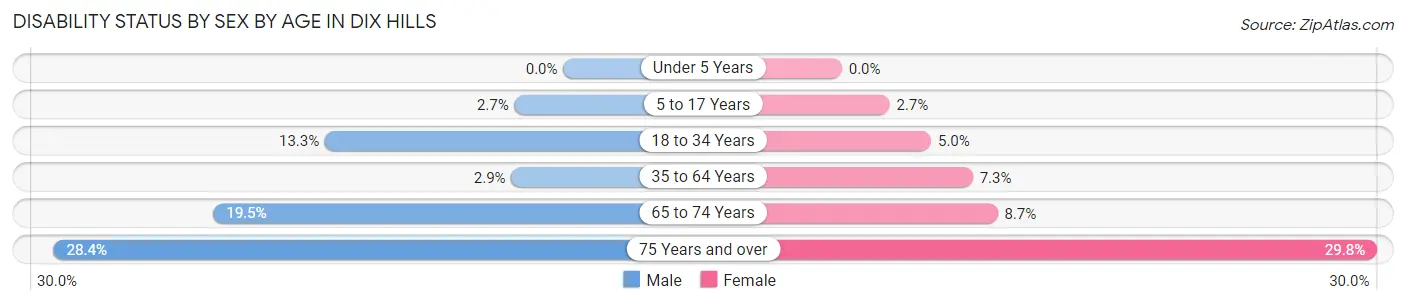
| Age Bracket | Male | Female |
| Under 5 Years | 0 (0.0%) | 0 (0.0%) |
| 5 to 17 Years | 69 (2.7%) | 44 (2.7%) |
| 18 to 34 Years | 273 (13.3%) | 88 (5.0%) |
| 35 to 64 Years | 157 (2.9%) | 393 (7.3%) |
| 65 to 74 Years | 247 (19.5%) | 137 (8.7%) |
| 75 Years and over | 237 (28.4%) | 304 (29.8%) |
Disability Class by Sex by Age in Dix Hills
Disability Class: Hearing Difficulty
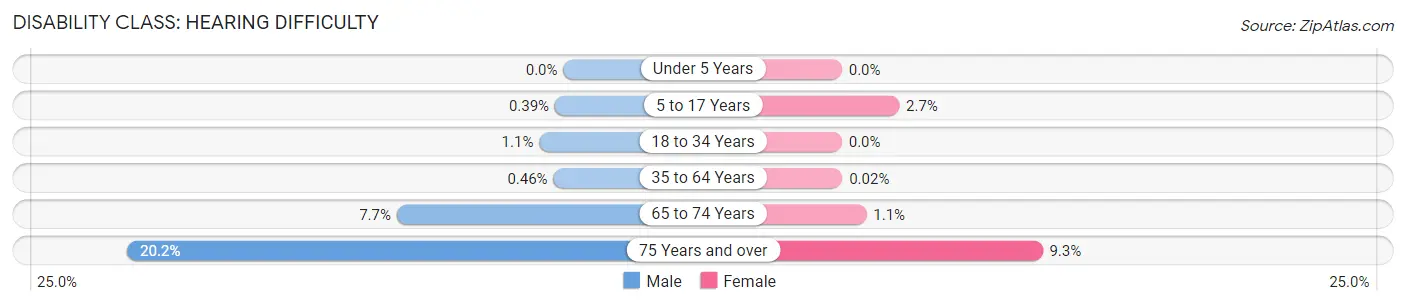
| Age Bracket | Male | Female |
| Under 5 Years | 0 (0.0%) | 0 (0.0%) |
| 5 to 17 Years | 10 (0.4%) | 44 (2.7%) |
| 18 to 34 Years | 23 (1.1%) | 0 (0.0%) |
| 35 to 64 Years | 25 (0.5%) | 1 (0.0%) |
| 65 to 74 Years | 98 (7.7%) | 18 (1.1%) |
| 75 Years and over | 169 (20.2%) | 95 (9.3%) |
Disability Class: Vision Difficulty
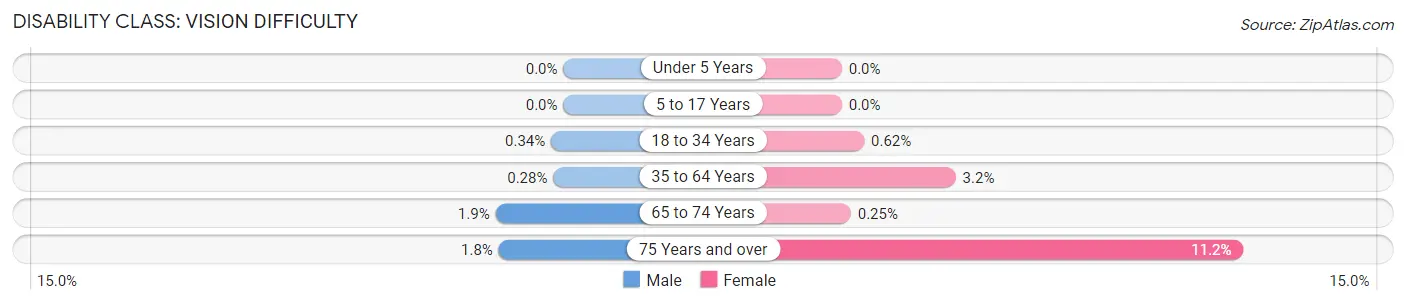
| Age Bracket | Male | Female |
| Under 5 Years | 0 (0.0%) | 0 (0.0%) |
| 5 to 17 Years | 0 (0.0%) | 0 (0.0%) |
| 18 to 34 Years | 7 (0.3%) | 11 (0.6%) |
| 35 to 64 Years | 15 (0.3%) | 171 (3.2%) |
| 65 to 74 Years | 24 (1.9%) | 4 (0.3%) |
| 75 Years and over | 15 (1.8%) | 114 (11.2%) |
Disability Class: Cognitive Difficulty
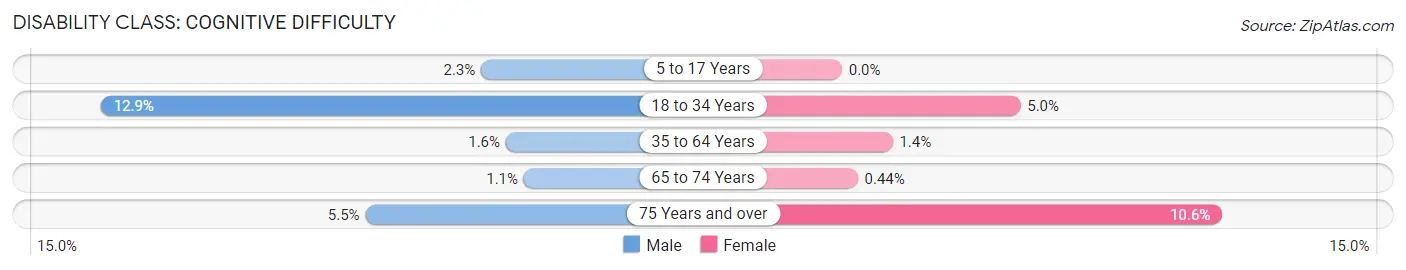
| Age Bracket | Male | Female |
| 5 to 17 Years | 58 (2.3%) | 0 (0.0%) |
| 18 to 34 Years | 265 (12.9%) | 88 (5.0%) |
| 35 to 64 Years | 87 (1.6%) | 76 (1.4%) |
| 65 to 74 Years | 14 (1.1%) | 7 (0.4%) |
| 75 Years and over | 46 (5.5%) | 108 (10.6%) |
Disability Class: Ambulatory Difficulty
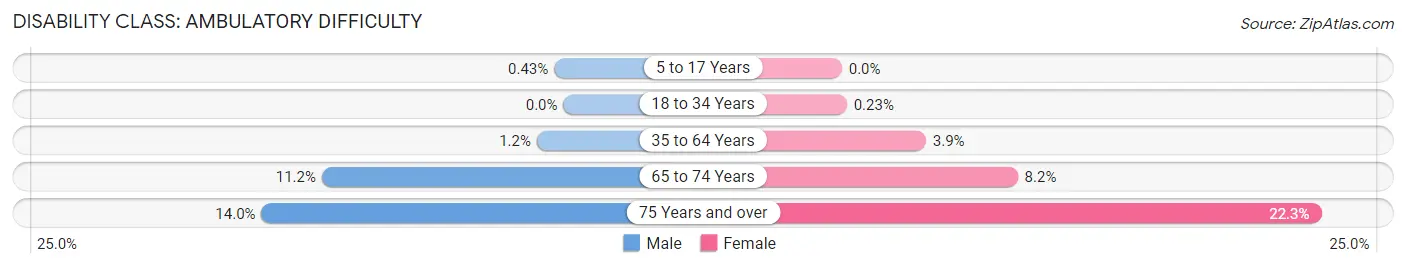
| Age Bracket | Male | Female |
| 5 to 17 Years | 11 (0.4%) | 0 (0.0%) |
| 18 to 34 Years | 0 (0.0%) | 4 (0.2%) |
| 35 to 64 Years | 67 (1.2%) | 210 (3.9%) |
| 65 to 74 Years | 142 (11.2%) | 129 (8.2%) |
| 75 Years and over | 117 (14.0%) | 227 (22.3%) |
Disability Class: Self-Care Difficulty
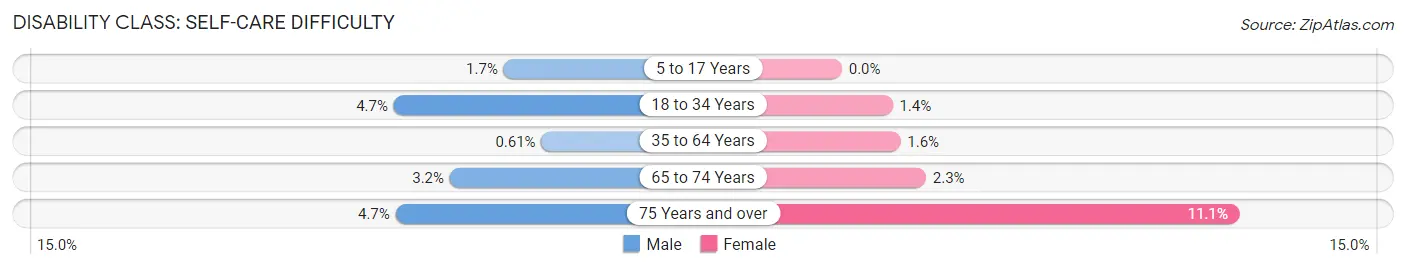
| Age Bracket | Male | Female |
| 5 to 17 Years | 42 (1.7%) | 0 (0.0%) |
| 18 to 34 Years | 97 (4.7%) | 25 (1.4%) |
| 35 to 64 Years | 33 (0.6%) | 88 (1.6%) |
| 65 to 74 Years | 40 (3.2%) | 37 (2.3%) |
| 75 Years and over | 39 (4.7%) | 113 (11.1%) |
Technology Access in Dix Hills
Computing Device Access in Dix Hills
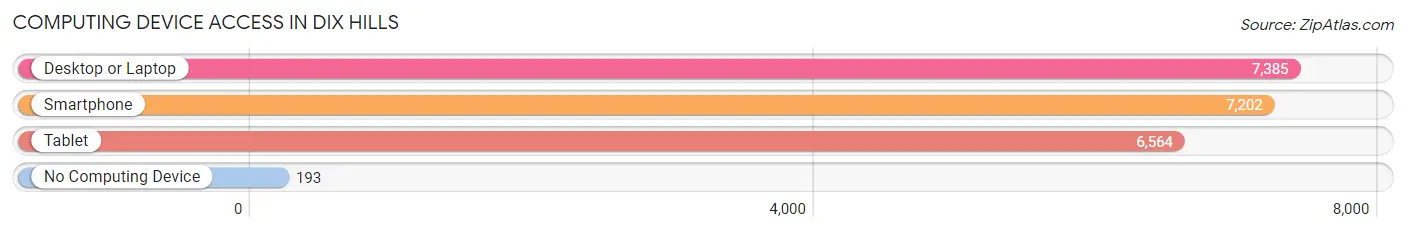
| Device Type | # Households | % Households |
| Desktop or Laptop | 7,385 | 95.8% |
| Smartphone | 7,202 | 93.4% |
| Tablet | 6,564 | 85.1% |
| No Computing Device | 193 | 2.5% |
| Total | 7,713 | 100.0% |
Internet Access in Dix Hills
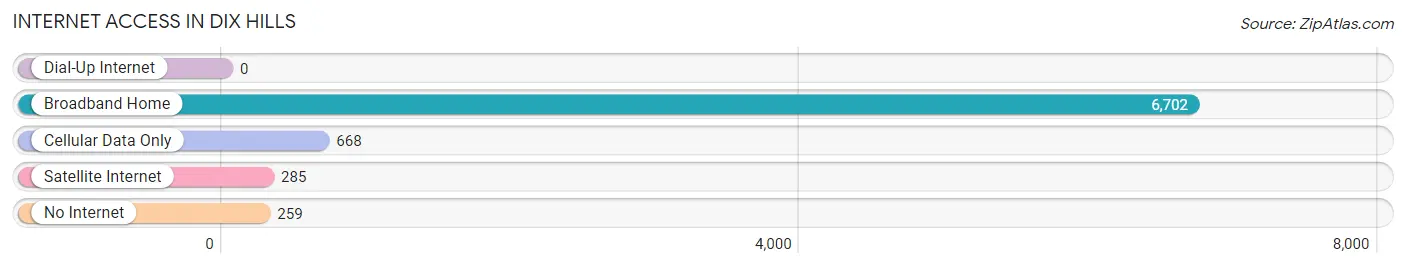
| Internet Type | # Households | % Households |
| Dial-Up Internet | 0 | 0.0% |
| Broadband Home | 6,702 | 86.9% |
| Cellular Data Only | 668 | 8.7% |
| Satellite Internet | 285 | 3.7% |
| No Internet | 259 | 3.4% |
| Total | 7,713 | 100.0% |
Dix Hills Summary
Dix Hills is a hamlet located in the Town of Huntington in Suffolk County, New York. It is situated on the north shore of Long Island, approximately 40 miles east of New York City. The hamlet is bordered by the towns of Smithtown, Babylon, Islip, and Oyster Bay. Dix Hills is home to approximately 26,000 people and is part of the larger Huntington-Oyster Bay-Smithtown metropolitan area.
History
The area that is now Dix Hills was originally inhabited by the Matinecock Native American tribe. The first European settlers arrived in the area in the 1650s, and the hamlet was officially established in 1793. The hamlet was named after the Dix family, who were among the first settlers in the area. The Dix family owned a large amount of land in the area, and the hamlet was named in their honor.
In the late 19th century, the hamlet began to grow rapidly as wealthy New Yorkers began to build large estates in the area. The hamlet was home to many prominent families, including the Vanderbilts, the Astors, and the Whitneys. The hamlet continued to grow throughout the 20th century, and by the 1970s, it had become a popular suburban community.
Geography
Dix Hills is located in the Town of Huntington in Suffolk County, New York. It is situated on the north shore of Long Island, approximately 40 miles east of New York City. The hamlet is bordered by the towns of Smithtown, Babylon, Islip, and Oyster Bay. The hamlet is located in the northern part of the town, and is bordered by the hamlets of Melville, Elwood, and Commack.
The hamlet is located in a hilly area, and is home to several parks and nature preserves. The hamlet is also home to several lakes, including Half Hollow Lake, Dix Hills Pond, and Lake Ronkonkoma. The hamlet is located in the Long Island Pine Barrens, and is home to a variety of wildlife, including deer, foxes, and hawks.
Economy
Dix Hills is a primarily residential community, and the majority of its residents are employed in the nearby cities of New York City and Long Island. The hamlet is home to several large businesses, including the Dix Hills Industrial Park, which is home to a variety of manufacturing and technology companies. The hamlet is also home to several retail stores, restaurants, and other businesses.
Demographics
As of the 2010 census, Dix Hills had a population of 26,000. The racial makeup of the hamlet was 79.3% White, 8.2% African American, 0.2% Native American, 8.2% Asian, and 4.1% from other races. The median household income was $107,000, and the median home value was $521,000. The hamlet is home to a large Jewish population, and is also home to a variety of other religious groups.
Conclusion
Dix Hills is a hamlet located in the Town of Huntington in Suffolk County, New York. It is situated on the north shore of Long Island, approximately 40 miles east of New York City. The hamlet was originally inhabited by the Matinecock Native American tribe, and was later settled by European settlers in the 1650s. The hamlet is primarily residential, and is home to several large businesses, including the Dix Hills Industrial Park. As of the 2010 census, the hamlet had a population of 26,000, and the median household income was $107,000. Dix Hills is home to a variety of religious groups, and is also home to several parks and nature preserves.
Common Questions
What is the Total Population of Dix Hills?
Total Population of Dix Hills is 24,652.
What is the Total Male Population of Dix Hills?
Total Male Population of Dix Hills is 12,682.
What is the Total Female Population of Dix Hills?
Total Female Population of Dix Hills is 11,970.
What is the Ratio of Males per 100 Females in Dix Hills?
There are 105.95 Males per 100 Females in Dix Hills.
What is the Ratio of Females per 100 Males in Dix Hills?
There are 94.39 Females per 100 Males in Dix Hills.
What is the Median Population Age in Dix Hills?
Median Population Age in Dix Hills is 47.2 Years.
What is the Average Family Size in Dix Hills
Average Family Size in Dix Hills is 3.4 People.
What is the Average Household Size in Dix Hills
Average Household Size in Dix Hills is 3.2 People.
What is Per Capita Income in Dix Hills?
Per Capita income in Dix Hills is $85,209.
What is the Median Family Income in Dix Hills?
Median Family Income in Dix Hills is $224,630.
What is the Median Household income in Dix Hills?
Median Household Income in Dix Hills is $209,217.
What is Income or Wage Gap in Dix Hills?
Income or Wage Gap in Dix Hills is 41.2%.
Women in Dix Hills earn 58.8 cents for every dollar earned by a man.
What is Inequality or Gini Index in Dix Hills?
Inequality or Gini Index in Dix Hills is 0.43.
How Large is the Labor Force in Dix Hills?
There are 13,213 People in the Labor Forcein in Dix Hills.
What is the Percentage of People in the Labor Force in Dix Hills?
65.5% of People are in the Labor Force in Dix Hills.
What is the Unemployment Rate in Dix Hills?
Unemployment Rate in Dix Hills is 4.0%.