Roosevelt, NY
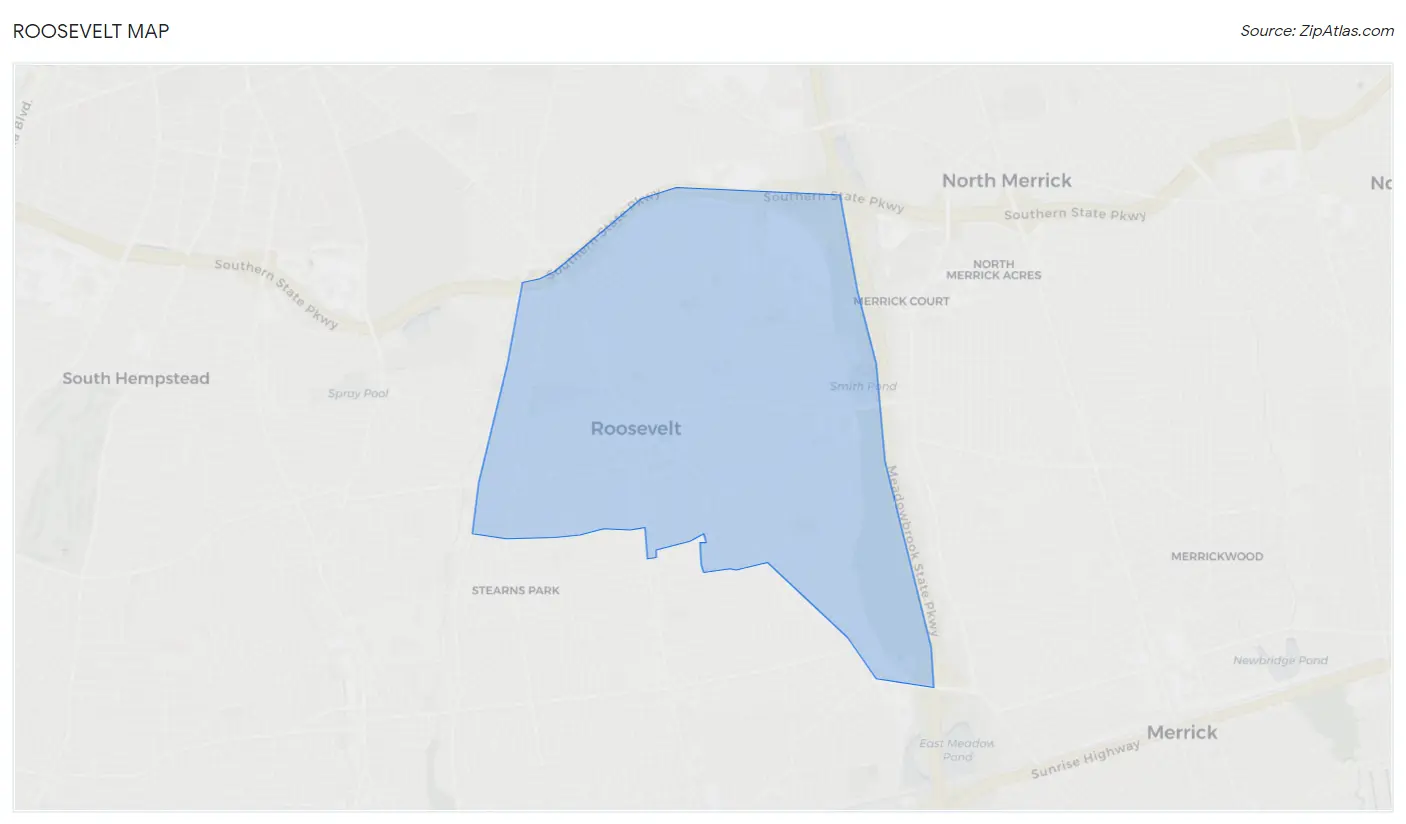
Roosevelt Map
Roosevelt Overview
19,233
TOTAL POPULATION
9,430
MALE POPULATION
9,803
FEMALE POPULATION
96.20
MALES / 100 FEMALES
103.96
FEMALES / 100 MALES
32.7
MEDIAN AGE
4.3
AVG FAMILY SIZE
4.2
AVG HOUSEHOLD SIZE
$35,132
PER CAPITA INCOME
$118,162
AVG FAMILY INCOME
$128,058
AVG HOUSEHOLD INCOME
6.5%
WAGE / INCOME GAP [ % ]
93.5¢/ $1
WAGE / INCOME GAP [ $ ]
$8,112
FAMILY INCOME DEFICIT
0.38
INEQUALITY / GINI INDEX
10,775
LABOR FORCE [ PEOPLE ]
72.6%
PERCENT IN LABOR FORCE
4.6%
UNEMPLOYMENT RATE
Roosevelt Zip Codes
Roosevelt Area Codes
Race in Roosevelt
The most populous races in Roosevelt are Black / African American (9,616 | 50.0%), Hispanic or Latino (8,425 | 43.8%), and Some other Race (3,951 | 20.5%).
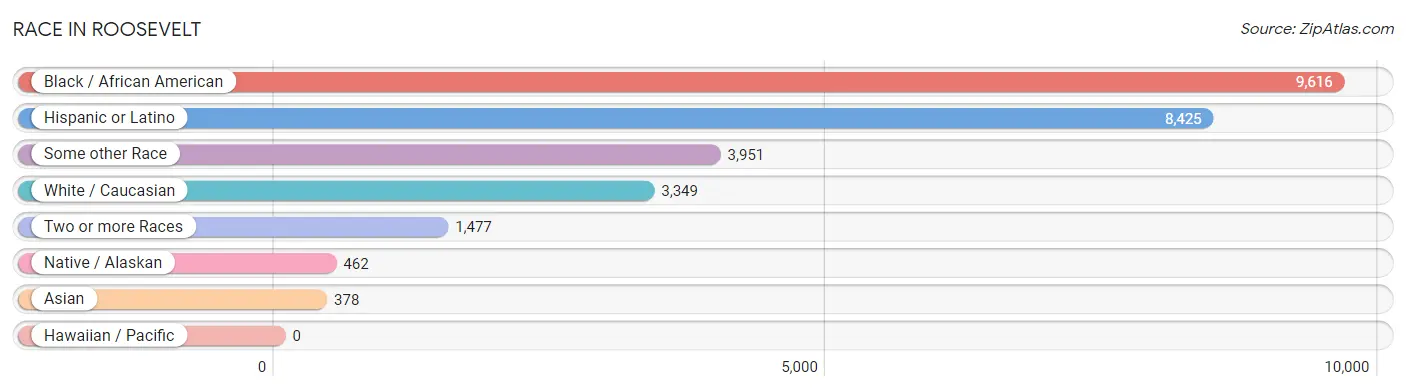
| Race | # Population | % Population |
| Asian | 378 | 2.0% |
| Black / African American | 9,616 | 50.0% |
| Hawaiian / Pacific | 0 | 0.0% |
| Hispanic or Latino | 8,425 | 43.8% |
| Native / Alaskan | 462 | 2.4% |
| White / Caucasian | 3,349 | 17.4% |
| Two or more Races | 1,477 | 7.7% |
| Some other Race | 3,951 | 20.5% |
| Total | 19,233 | 100.0% |
Ancestry in Roosevelt
The most populous ancestries reported in Roosevelt are Central American (5,512 | 28.7%), Salvadoran (4,565 | 23.7%), Jamaican (1,345 | 7.0%), Puerto Rican (1,110 | 5.8%), and Dominican (714 | 3.7%), together accounting for 68.9% of all Roosevelt residents.
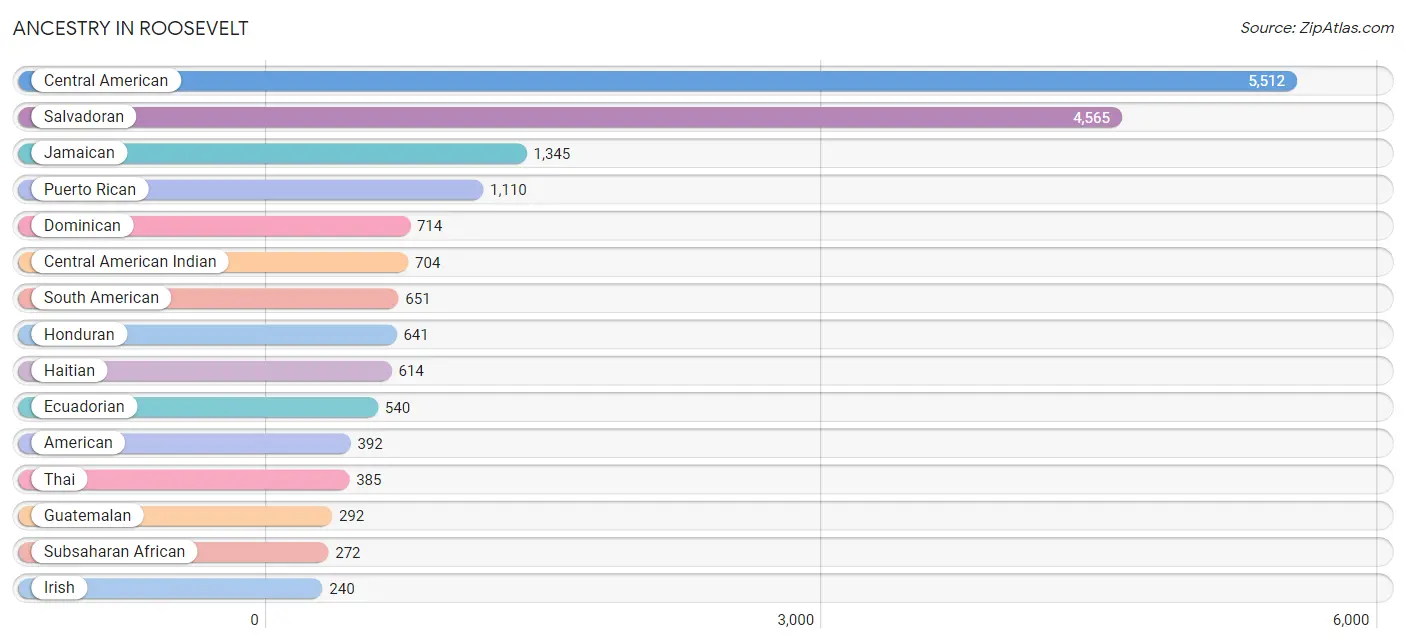
| Ancestry | # Population | % Population |
| African | 219 | 1.1% |
| American | 392 | 2.0% |
| Barbadian | 181 | 0.9% |
| Belizean | 15 | 0.1% |
| Blackfeet | 13 | 0.1% |
| British | 44 | 0.2% |
| British West Indian | 143 | 0.7% |
| Central American | 5,512 | 28.7% |
| Central American Indian | 704 | 3.7% |
| Cherokee | 35 | 0.2% |
| Colombian | 83 | 0.4% |
| Cuban | 13 | 0.1% |
| Dominican | 714 | 3.7% |
| Eastern European | 23 | 0.1% |
| Ecuadorian | 540 | 2.8% |
| English | 38 | 0.2% |
| German | 14 | 0.1% |
| Ghanaian | 32 | 0.2% |
| Guatemalan | 292 | 1.5% |
| Guyanese | 133 | 0.7% |
| Haitian | 614 | 3.2% |
| Honduran | 641 | 3.3% |
| Irish | 240 | 1.3% |
| Italian | 17 | 0.1% |
| Jamaican | 1,345 | 7.0% |
| Mexican | 48 | 0.3% |
| Mexican American Indian | 99 | 0.5% |
| Nigerian | 21 | 0.1% |
| Panamanian | 14 | 0.1% |
| Peruvian | 28 | 0.2% |
| Puerto Rican | 1,110 | 5.8% |
| Salvadoran | 4,565 | 23.7% |
| South American | 651 | 3.4% |
| Spanish | 107 | 0.6% |
| Subsaharan African | 272 | 1.4% |
| Thai | 385 | 2.0% |
| Trinidadian and Tobagonian | 229 | 1.2% |
| U.S. Virgin Islander | 74 | 0.4% |
| West Indian | 59 | 0.3% | View All 39 Rows |
Immigrants in Roosevelt
The most numerous immigrant groups reported in Roosevelt came from Latin America (6,619 | 34.4%), Central America (3,183 | 16.6%), Caribbean (2,589 | 13.5%), El Salvador (2,557 | 13.3%), and Jamaica (919 | 4.8%), together accounting for 82.5% of all Roosevelt residents.
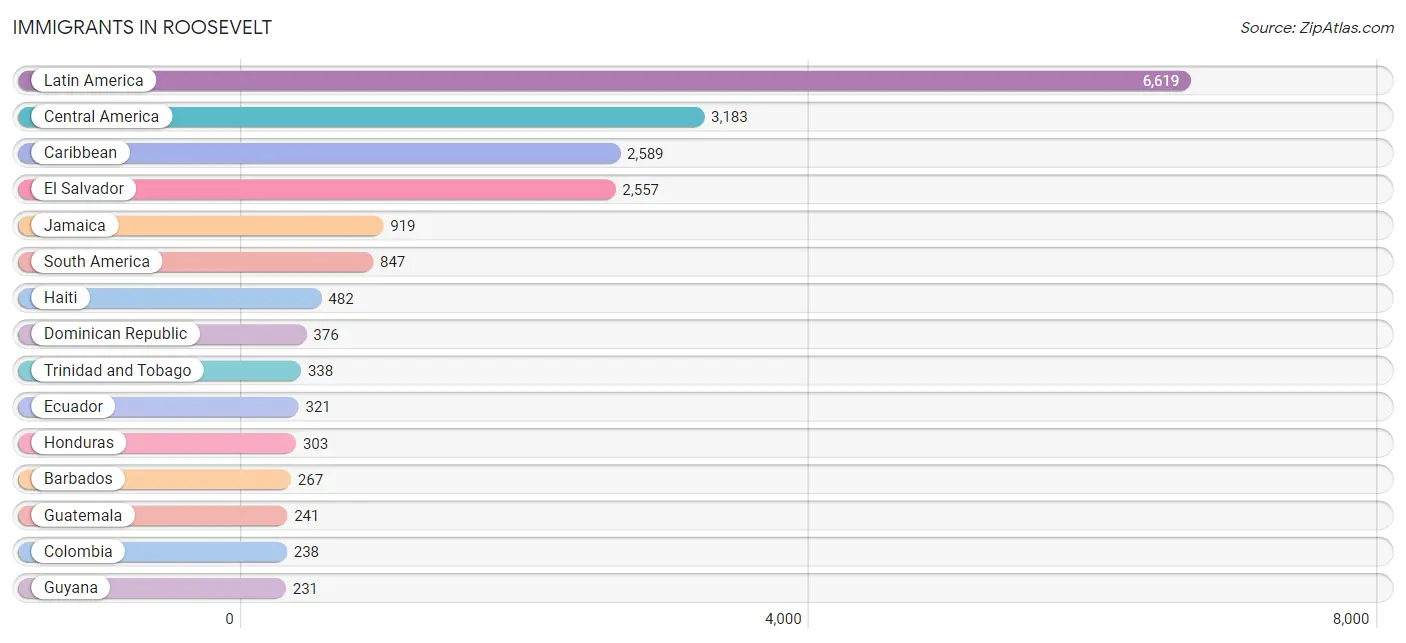
| Immigration Origin | # Population | % Population |
| Africa | 164 | 0.9% |
| Asia | 92 | 0.5% |
| Barbados | 267 | 1.4% |
| Canada | 4 | 0.0% |
| Caribbean | 2,589 | 13.5% |
| Central America | 3,183 | 16.6% |
| Colombia | 238 | 1.2% |
| Cuba | 9 | 0.1% |
| Dominican Republic | 376 | 1.9% |
| Eastern Asia | 33 | 0.2% |
| Ecuador | 321 | 1.7% |
| El Salvador | 2,557 | 13.3% |
| Europe | 44 | 0.2% |
| Ghana | 32 | 0.2% |
| Grenada | 39 | 0.2% |
| Guatemala | 241 | 1.3% |
| Guyana | 231 | 1.2% |
| Haiti | 482 | 2.5% |
| Honduras | 303 | 1.6% |
| India | 59 | 0.3% |
| Jamaica | 919 | 4.8% |
| Korea | 33 | 0.2% |
| Latin America | 6,619 | 34.4% |
| Mexico | 23 | 0.1% |
| Nigeria | 84 | 0.4% |
| Northern Europe | 44 | 0.2% |
| Panama | 59 | 0.3% |
| Peru | 44 | 0.2% |
| South America | 847 | 4.4% |
| South Central Asia | 59 | 0.3% |
| St. Vincent and the Grenadines | 19 | 0.1% |
| Trinidad and Tobago | 338 | 1.8% |
| Venezuela | 13 | 0.1% |
| West Indies | 79 | 0.4% |
| Western Africa | 116 | 0.6% | View All 35 Rows |
Sex and Age in Roosevelt
Sex and Age in Roosevelt
The most populous age groups in Roosevelt are 25 to 29 Years (993 | 10.5%) for men and 20 to 24 Years (1,005 | 10.2%) for women.
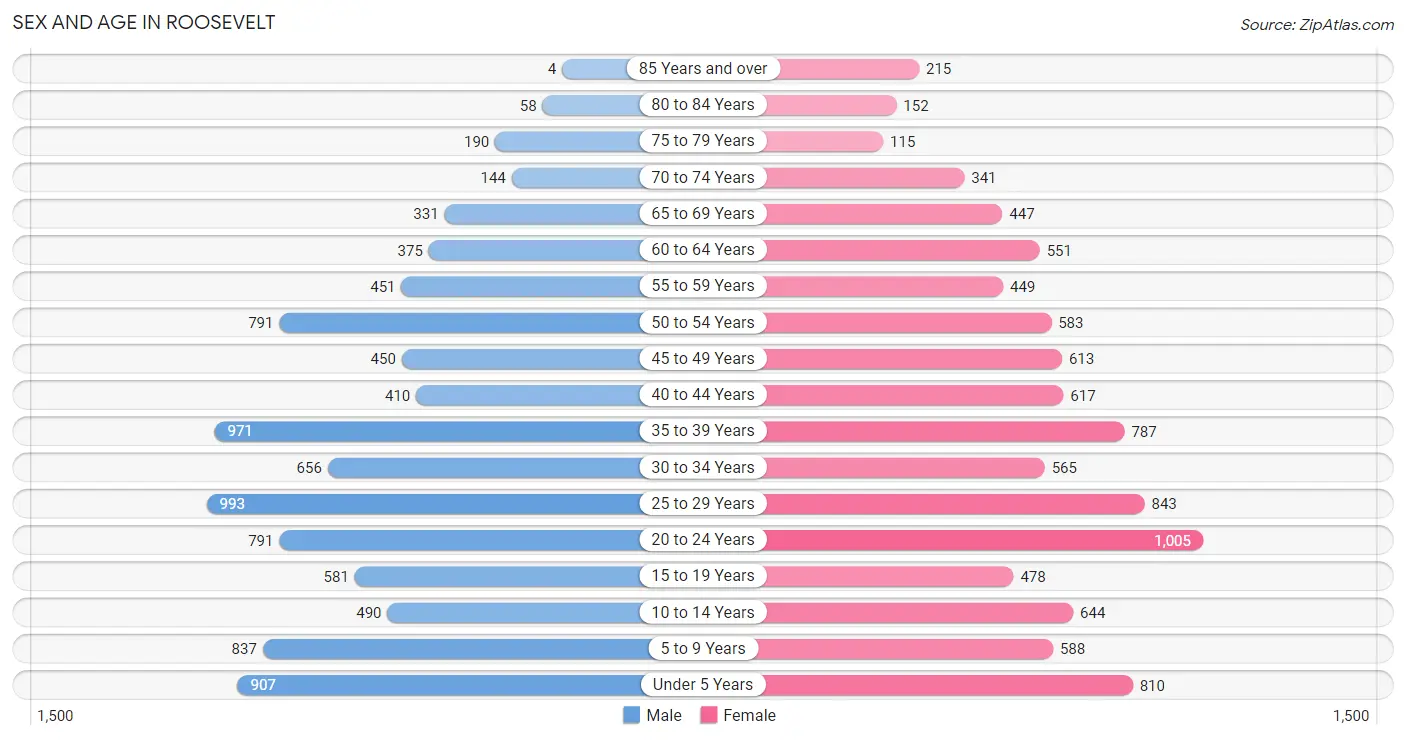
| Age Bracket | Male | Female |
| Under 5 Years | 907 (9.6%) | 810 (8.3%) |
| 5 to 9 Years | 837 (8.9%) | 588 (6.0%) |
| 10 to 14 Years | 490 (5.2%) | 644 (6.6%) |
| 15 to 19 Years | 581 (6.2%) | 478 (4.9%) |
| 20 to 24 Years | 791 (8.4%) | 1,005 (10.2%) |
| 25 to 29 Years | 993 (10.5%) | 843 (8.6%) |
| 30 to 34 Years | 656 (7.0%) | 565 (5.8%) |
| 35 to 39 Years | 971 (10.3%) | 787 (8.0%) |
| 40 to 44 Years | 410 (4.3%) | 617 (6.3%) |
| 45 to 49 Years | 450 (4.8%) | 613 (6.2%) |
| 50 to 54 Years | 791 (8.4%) | 583 (5.9%) |
| 55 to 59 Years | 451 (4.8%) | 449 (4.6%) |
| 60 to 64 Years | 375 (4.0%) | 551 (5.6%) |
| 65 to 69 Years | 331 (3.5%) | 447 (4.6%) |
| 70 to 74 Years | 144 (1.5%) | 341 (3.5%) |
| 75 to 79 Years | 190 (2.0%) | 115 (1.2%) |
| 80 to 84 Years | 58 (0.6%) | 152 (1.5%) |
| 85 Years and over | 4 (0.0%) | 215 (2.2%) |
| Total | 9,430 (100.0%) | 9,803 (100.0%) |
Families and Households in Roosevelt
Median Family Size in Roosevelt
The median family size in Roosevelt is 4.28 persons per family, with single male/father families (455 | 11.5%) accounting for the largest median family size of 4.52 persons per family. On the other hand, single female/mother families (1,404 | 35.5%) represent the smallest median family size with 3.87 persons per family.
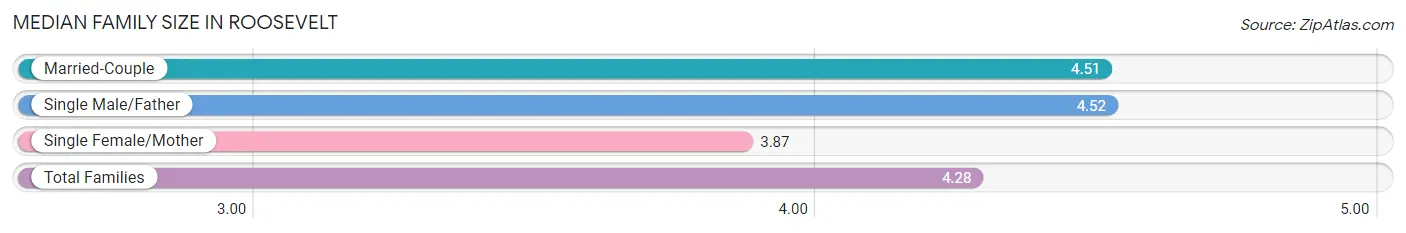
| Family Type | # Families | Family Size |
| Married-Couple | 2,096 (53.0%) | 4.51 |
| Single Male/Father | 455 (11.5%) | 4.52 |
| Single Female/Mother | 1,404 (35.5%) | 3.87 |
| Total Families | 3,955 (100.0%) | 4.28 |
Median Household Size in Roosevelt
The median household size in Roosevelt is 4.22 persons per household, with single male/father households (455 | 10.1%) accounting for the largest median household size of 5.65 persons per household. non-family households (570 | 12.6%) represent the smallest median household size with 1.84 persons per household.
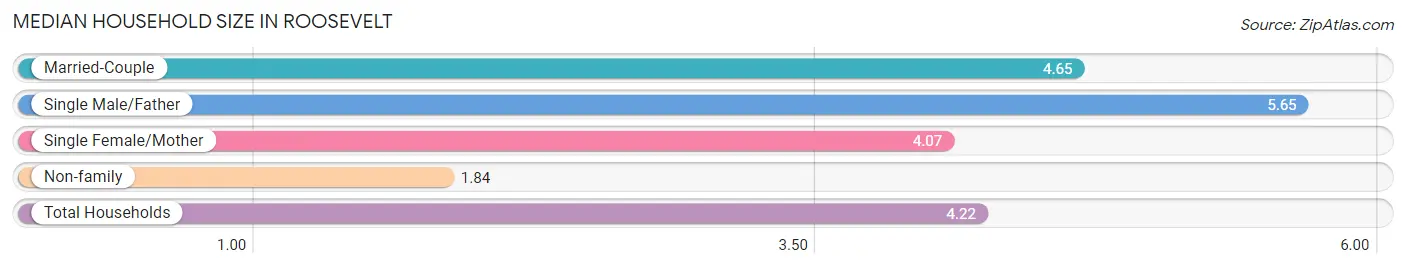
| Household Type | # Households | Household Size |
| Married-Couple | 2,096 (46.3%) | 4.65 |
| Single Male/Father | 455 (10.1%) | 5.65 |
| Single Female/Mother | 1,404 (31.0%) | 4.07 |
| Non-family | 570 (12.6%) | 1.84 |
| Total Households | 4,525 (100.0%) | 4.22 |
Household Size by Marriage Status in Roosevelt
Out of a total of 4,525 households in Roosevelt, 3,955 (87.4%) are family households, while 570 (12.6%) are nonfamily households. The most numerous type of family households are 4-person households, comprising 1,201, and the most common type of nonfamily households are 1-person households, comprising 406.
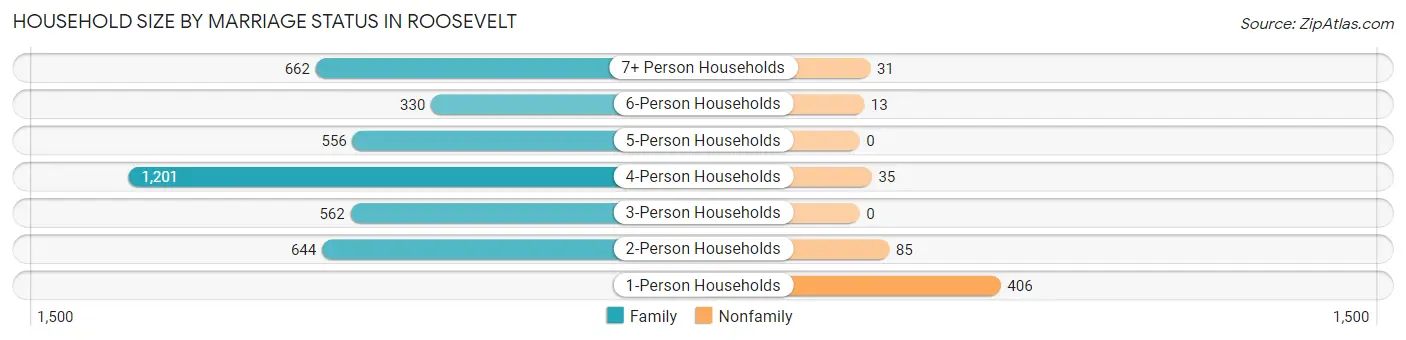
| Household Size | Family Households | Nonfamily Households |
| 1-Person Households | - | 406 (9.0%) |
| 2-Person Households | 644 (14.2%) | 85 (1.9%) |
| 3-Person Households | 562 (12.4%) | 0 (0.0%) |
| 4-Person Households | 1,201 (26.5%) | 35 (0.8%) |
| 5-Person Households | 556 (12.3%) | 0 (0.0%) |
| 6-Person Households | 330 (7.3%) | 13 (0.3%) |
| 7+ Person Households | 662 (14.6%) | 31 (0.7%) |
| Total | 3,955 (87.4%) | 570 (12.6%) |
Female Fertility in Roosevelt
Fertility by Age in Roosevelt
Average fertility rate in Roosevelt is 77.0 births per 1,000 women. Women in the age bracket of 20 to 34 years have the highest fertility rate with 95.0 births per 1,000 women. Women in the age bracket of 20 to 34 years acount for 59.3% of all women with births.
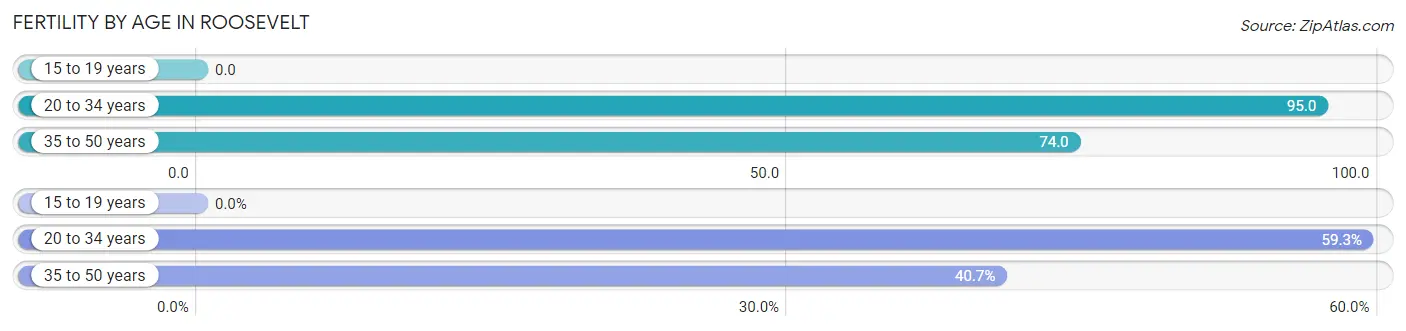
| Age Bracket | Women with Births | Births / 1,000 Women |
| 15 to 19 years | 0 (0.0%) | 0.0 |
| 20 to 34 years | 229 (59.3%) | 95.0 |
| 35 to 50 years | 157 (40.7%) | 74.0 |
| Total | 386 (100.0%) | 77.0 |
Fertility by Age by Marriage Status in Roosevelt
56.0% of women with births (386) in Roosevelt are married. The highest percentage of unmarried women with births falls into 35 to 50 years age bracket with 61.8% of them unmarried at the time of birth, while the lowest percentage of unmarried women with births belong to 20 to 34 years age bracket with 31.9% of them unmarried.
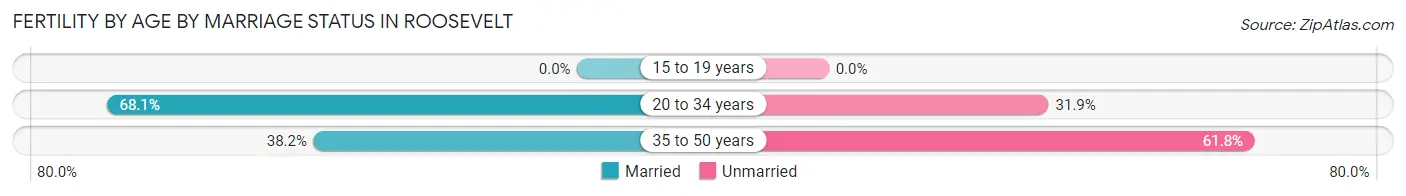
| Age Bracket | Married | Unmarried |
| 15 to 19 years | 0 (0.0%) | 0 (0.0%) |
| 20 to 34 years | 156 (68.1%) | 73 (31.9%) |
| 35 to 50 years | 60 (38.2%) | 97 (61.8%) |
| Total | 216 (56.0%) | 170 (44.0%) |
Fertility by Education in Roosevelt
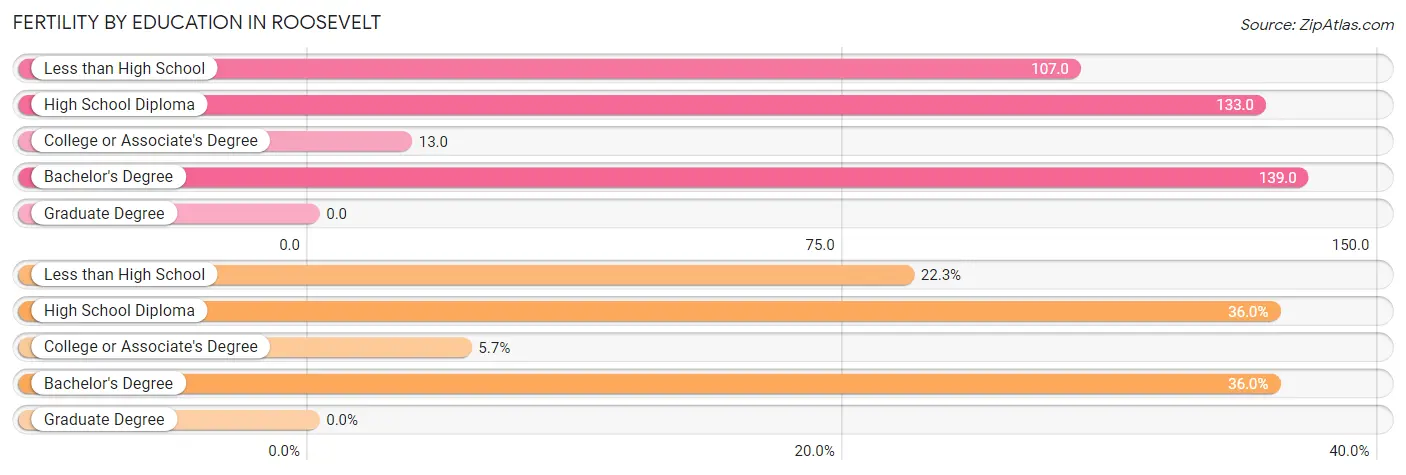
| Educational Attainment | Women with Births | Births / 1,000 Women |
| Less than High School | 86 (22.3%) | 107.0 |
| High School Diploma | 139 (36.0%) | 133.0 |
| College or Associate's Degree | 22 (5.7%) | 13.0 |
| Bachelor's Degree | 139 (36.0%) | 139.0 |
| Graduate Degree | 0 (0.0%) | 0.0 |
| Total | 386 (100.0%) | 77.0 |
Fertility by Education by Marriage Status in Roosevelt
44.0% of women with births in Roosevelt are unmarried. Women with the educational attainment of less than high school are most likely to be married with 79.1% of them married at childbirth, while women with the educational attainment of college or associate's degree are least likely to be married with 100.0% of them unmarried at childbirth.
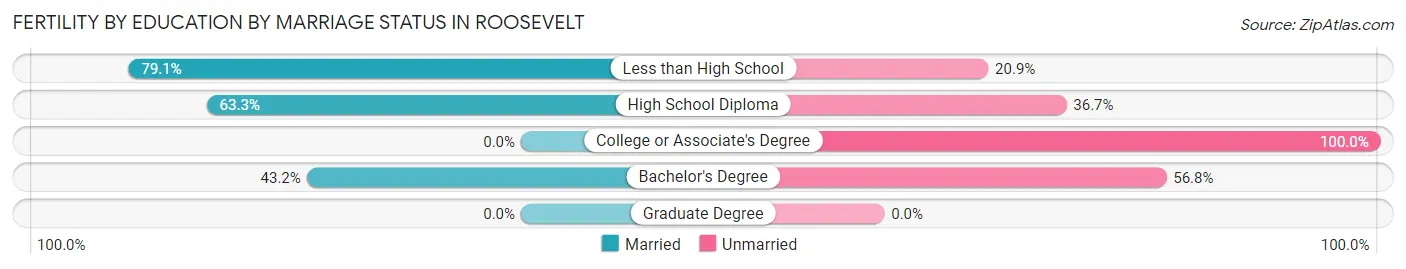
| Educational Attainment | Married | Unmarried |
| Less than High School | 68 (79.1%) | 18 (20.9%) |
| High School Diploma | 88 (63.3%) | 51 (36.7%) |
| College or Associate's Degree | 0 (0.0%) | 22 (100.0%) |
| Bachelor's Degree | 60 (43.2%) | 79 (56.8%) |
| Graduate Degree | 0 (0.0%) | 0 (0.0%) |
| Total | 216 (56.0%) | 170 (44.0%) |
Income in Roosevelt
Income Overview in Roosevelt
Per Capita Income in Roosevelt is $35,132, while median incomes of families and households are $118,162 and $128,058 respectively.
| Characteristic | Number | Measure |
| Per Capita Income | 19,233 | $35,132 |
| Median Family Income | 3,955 | $118,162 |
| Mean Family Income | 3,955 | $134,799 |
| Median Household Income | 4,525 | $128,058 |
| Mean Household Income | 4,525 | $140,743 |
| Income Deficit | 3,955 | $8,112 |
| Wage / Income Gap (%) | 19,233 | 6.49% |
| Wage / Income Gap ($) | 19,233 | 93.51¢ per $1 |
| Gini / Inequality Index | 19,233 | 0.38 |
Earnings by Sex in Roosevelt
Average Earnings in Roosevelt are $39,841, $41,096 for men and $38,427 for women, a difference of 6.5%.
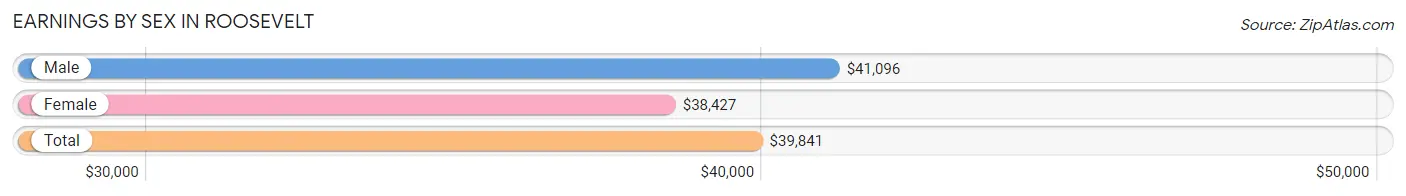
| Sex | Number | Average Earnings |
| Male | 5,491 (50.5%) | $41,096 |
| Female | 5,388 (49.5%) | $38,427 |
| Total | 10,879 (100.0%) | $39,841 |
Earnings by Sex by Income Bracket in Roosevelt
The most common earnings brackets in Roosevelt are $100,000+ for men (781 | 14.2%) and $45,000 to $49,999 for women (611 | 11.3%).
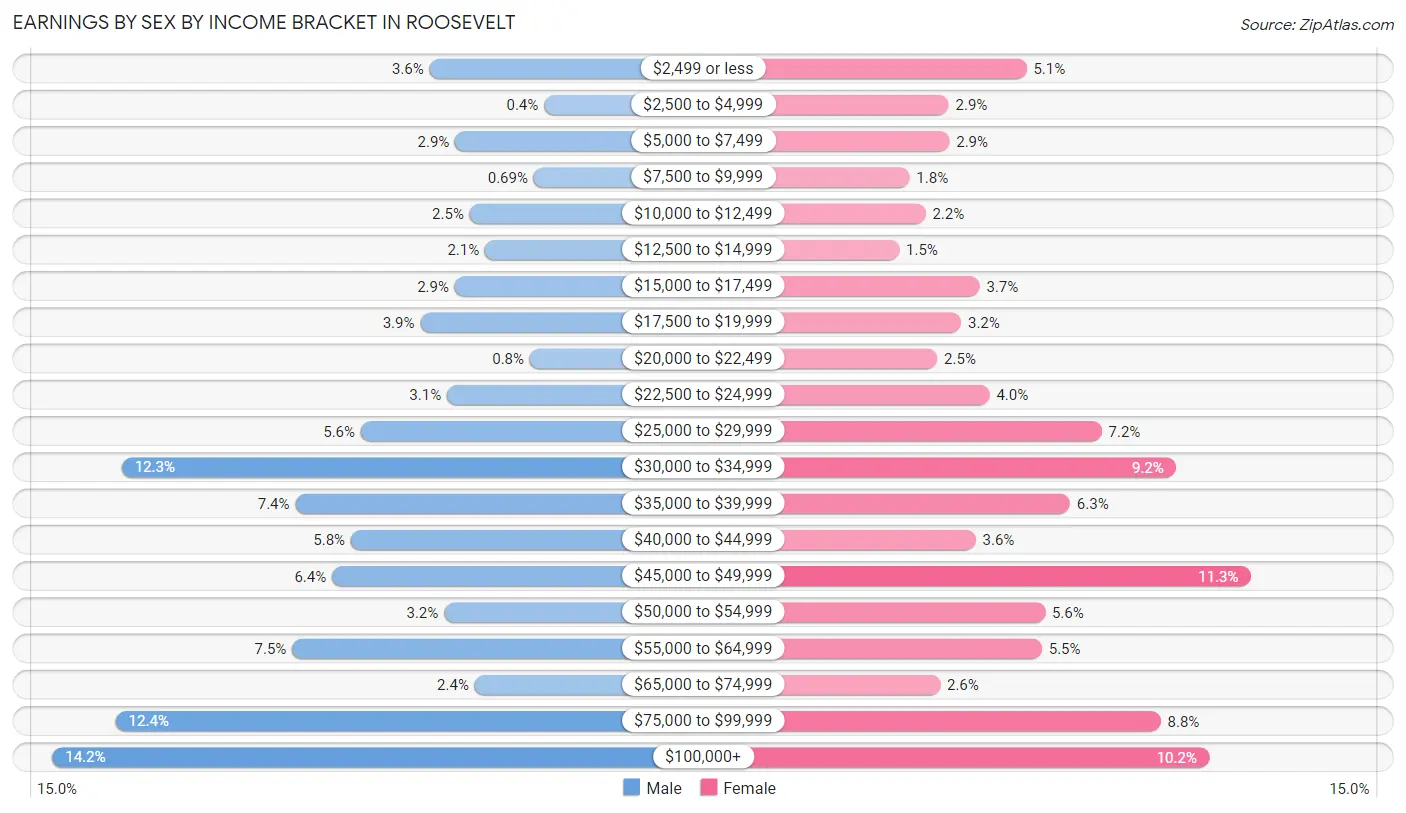
| Income | Male | Female |
| $2,499 or less | 199 (3.6%) | 272 (5.1%) |
| $2,500 to $4,999 | 22 (0.4%) | 154 (2.9%) |
| $5,000 to $7,499 | 159 (2.9%) | 155 (2.9%) |
| $7,500 to $9,999 | 38 (0.7%) | 95 (1.8%) |
| $10,000 to $12,499 | 137 (2.5%) | 119 (2.2%) |
| $12,500 to $14,999 | 113 (2.1%) | 79 (1.5%) |
| $15,000 to $17,499 | 160 (2.9%) | 201 (3.7%) |
| $17,500 to $19,999 | 213 (3.9%) | 173 (3.2%) |
| $20,000 to $22,499 | 44 (0.8%) | 137 (2.5%) |
| $22,500 to $24,999 | 172 (3.1%) | 216 (4.0%) |
| $25,000 to $29,999 | 305 (5.6%) | 386 (7.2%) |
| $30,000 to $34,999 | 674 (12.3%) | 498 (9.2%) |
| $35,000 to $39,999 | 406 (7.4%) | 338 (6.3%) |
| $40,000 to $44,999 | 320 (5.8%) | 195 (3.6%) |
| $45,000 to $49,999 | 349 (6.4%) | 611 (11.3%) |
| $50,000 to $54,999 | 176 (3.2%) | 300 (5.6%) |
| $55,000 to $64,999 | 411 (7.5%) | 295 (5.5%) |
| $65,000 to $74,999 | 129 (2.4%) | 141 (2.6%) |
| $75,000 to $99,999 | 683 (12.4%) | 475 (8.8%) |
| $100,000+ | 781 (14.2%) | 548 (10.2%) |
| Total | 5,491 (100.0%) | 5,388 (100.0%) |
Earnings by Sex by Educational Attainment in Roosevelt
Average earnings in Roosevelt are $45,598 for men and $44,841 for women, a difference of 1.7%. Men with an educational attainment of graduate degree enjoy the highest average annual earnings of $121,111, while those with less than high school education earn the least with $33,679. Women with an educational attainment of graduate degree earn the most with the average annual earnings of $76,942, while those with less than high school education have the smallest earnings of $18,654.
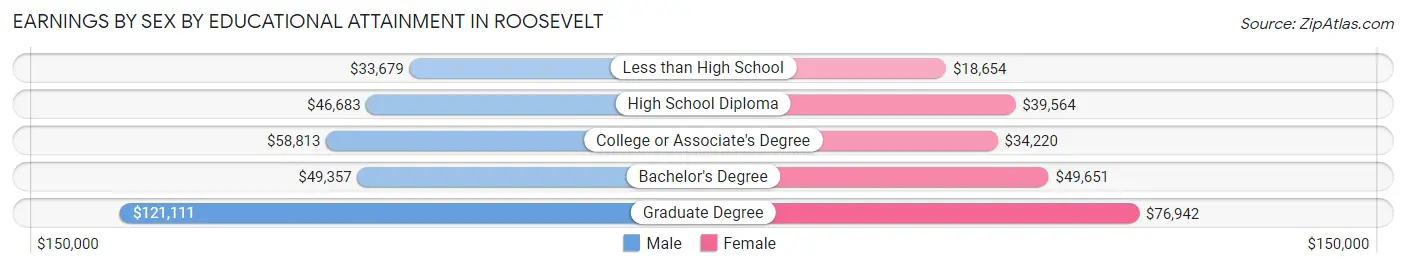
| Educational Attainment | Male Income | Female Income |
| Less than High School | $33,679 | $18,654 |
| High School Diploma | $46,683 | $39,564 |
| College or Associate's Degree | $58,813 | $34,220 |
| Bachelor's Degree | $49,357 | $49,651 |
| Graduate Degree | $121,111 | $76,942 |
| Total | $45,598 | $44,841 |
Family Income in Roosevelt
Family Income Brackets in Roosevelt
According to the Roosevelt family income data, there are 1,143 families falling into the $100,000 to $149,999 income range, which is the most common income bracket and makes up 28.9% of all families. Conversely, the less than $10,000 income bracket is the least frequent group with only 24 families (0.6%) belonging to this category.
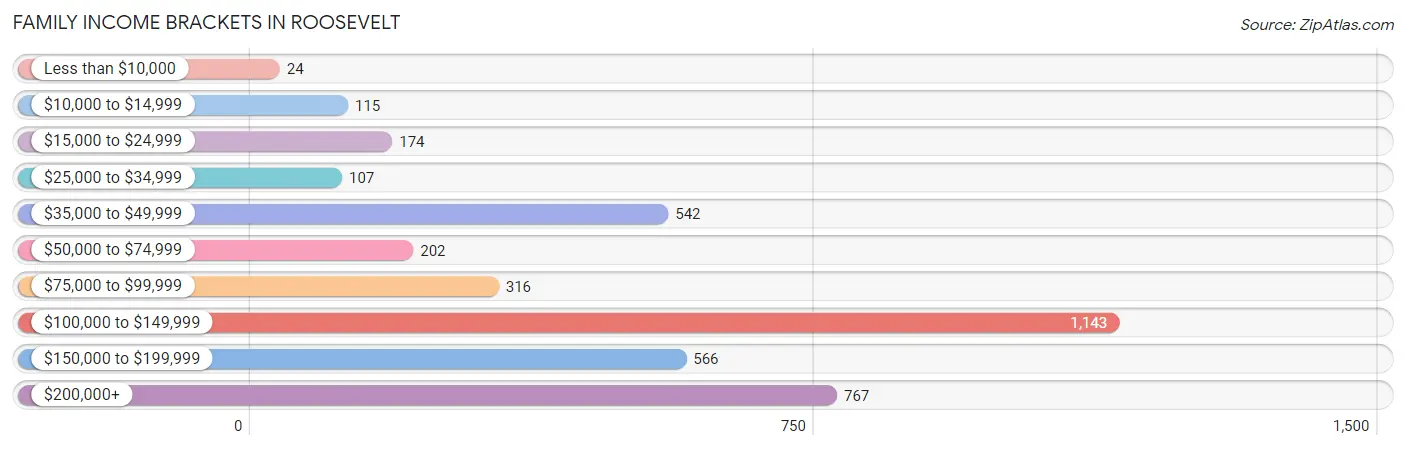
| Income Bracket | # Families | % Families |
| Less than $10,000 | 24 | 0.6% |
| $10,000 to $14,999 | 115 | 2.9% |
| $15,000 to $24,999 | 174 | 4.4% |
| $25,000 to $34,999 | 107 | 2.7% |
| $35,000 to $49,999 | 542 | 13.7% |
| $50,000 to $74,999 | 202 | 5.1% |
| $75,000 to $99,999 | 316 | 8.0% |
| $100,000 to $149,999 | 1,143 | 28.9% |
| $150,000 to $199,999 | 566 | 14.3% |
| $200,000+ | 767 | 19.4% |
Family Income by Famaliy Size in Roosevelt
7+ person families (548 | 13.9%) account for the highest median family income in Roosevelt with $182,713 per family, while 3-person families (631 | 16.0%) have the highest median income of $40,845 per family member.
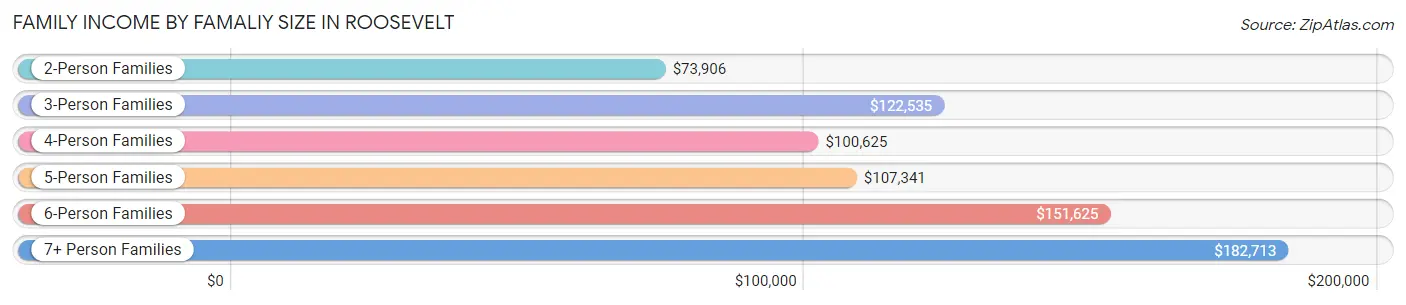
| Income Bracket | # Families | Median Income |
| 2-Person Families | 834 (21.1%) | $73,906 |
| 3-Person Families | 631 (16.0%) | $122,535 |
| 4-Person Families | 1,149 (29.0%) | $100,625 |
| 5-Person Families | 448 (11.3%) | $107,341 |
| 6-Person Families | 345 (8.7%) | $151,625 |
| 7+ Person Families | 548 (13.9%) | $182,713 |
| Total | 3,955 (100.0%) | $118,162 |
Family Income by Number of Earners in Roosevelt
The median family income in Roosevelt is $118,162, with families comprising 3+ earners (1,666) having the highest median family income of $172,121, while families with no earners (278) have the lowest median family income of $26,641, accounting for 42.1% and 7.0% of families, respectively.
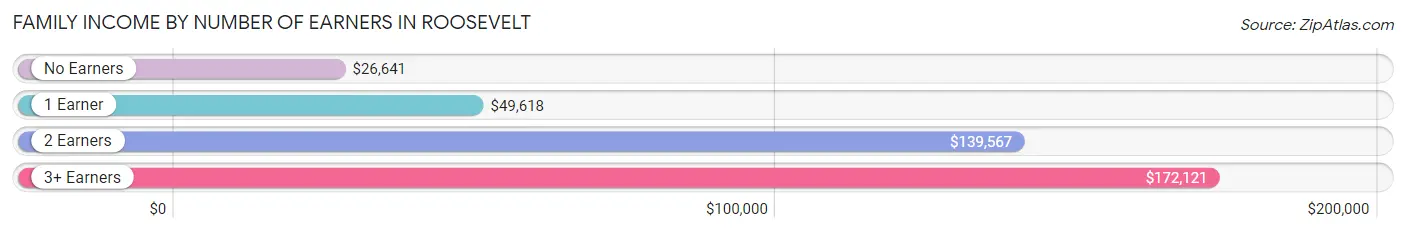
| Number of Earners | # Families | Median Income |
| No Earners | 278 (7.0%) | $26,641 |
| 1 Earner | 1,003 (25.4%) | $49,618 |
| 2 Earners | 1,008 (25.5%) | $139,567 |
| 3+ Earners | 1,666 (42.1%) | $172,121 |
| Total | 3,955 (100.0%) | $118,162 |
Household Income in Roosevelt
Household Income Brackets in Roosevelt
With 1,253 households falling in the category, the $100,000 to $149,999 income range is the most frequent in Roosevelt, accounting for 27.7% of all households. In contrast, only 36 households (0.8%) fall into the $25,000 to $34,999 income bracket, making it the least populous group.
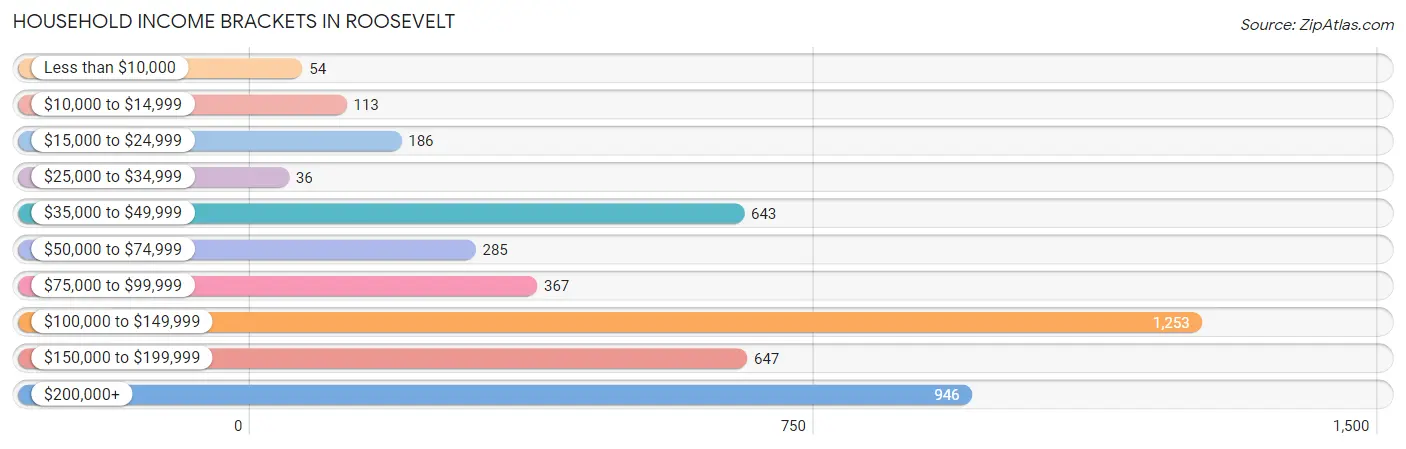
| Income Bracket | # Households | % Households |
| Less than $10,000 | 54 | 1.2% |
| $10,000 to $14,999 | 113 | 2.5% |
| $15,000 to $24,999 | 186 | 4.1% |
| $25,000 to $34,999 | 36 | 0.8% |
| $35,000 to $49,999 | 643 | 14.2% |
| $50,000 to $74,999 | 285 | 6.3% |
| $75,000 to $99,999 | 367 | 8.1% |
| $100,000 to $149,999 | 1,253 | 27.7% |
| $150,000 to $199,999 | 647 | 14.3% |
| $200,000+ | 946 | 20.9% |
Household Income by Householder Age in Roosevelt
The median household income in Roosevelt is $128,058, with the highest median household income of $144,890 found in the 45 to 64 years age bracket for the primary householder. A total of 1,921 households (42.4%) fall into this category. Meanwhile, the 15 to 24 years age bracket for the primary householder has the lowest median household income of $0, with 41 households (0.9%) in this group.
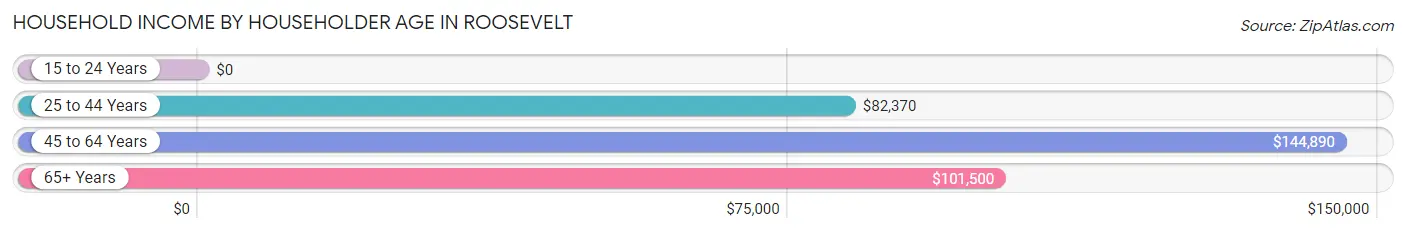
| Income Bracket | # Households | Median Income |
| 15 to 24 Years | 41 (0.9%) | $0 |
| 25 to 44 Years | 1,357 (30.0%) | $82,370 |
| 45 to 64 Years | 1,921 (42.4%) | $144,890 |
| 65+ Years | 1,206 (26.7%) | $101,500 |
| Total | 4,525 (100.0%) | $128,058 |
Poverty in Roosevelt
Income Below Poverty by Sex and Age in Roosevelt
With 6.1% poverty level for males and 9.4% for females among the residents of Roosevelt, 75 year old and over males and under 5 year old females are the most vulnerable to poverty, with 55 males (21.8%) and 243 females (34.9%) in their respective age groups living below the poverty level.
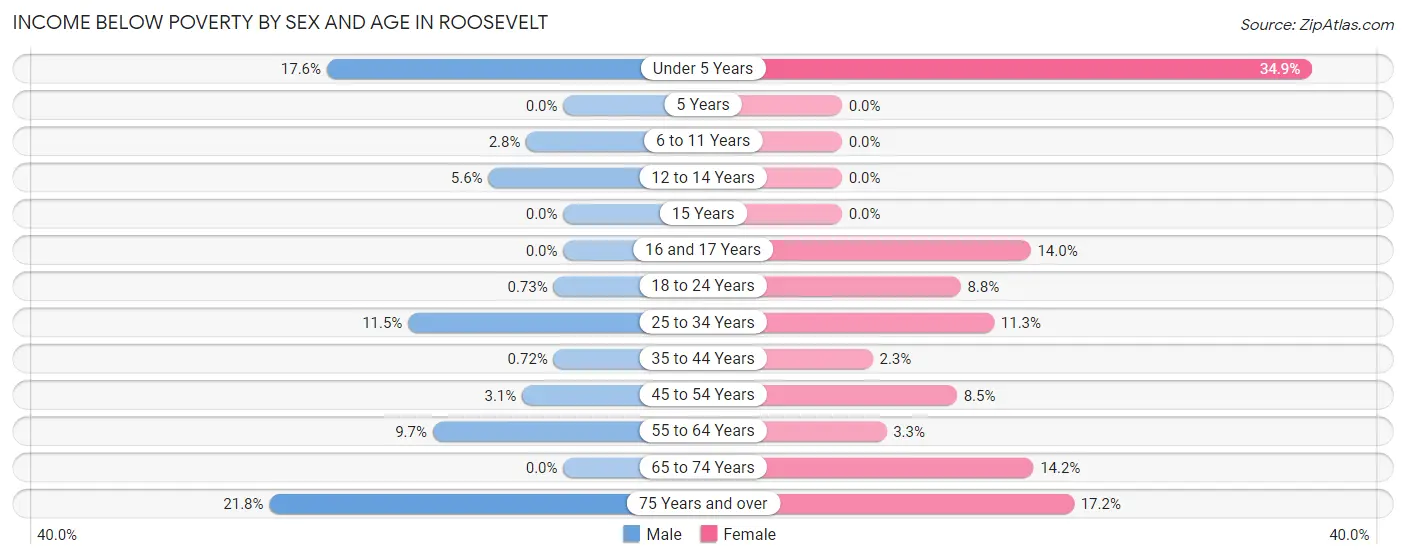
| Age Bracket | Male | Female |
| Under 5 Years | 147 (17.6%) | 243 (34.9%) |
| 5 Years | 0 (0.0%) | 0 (0.0%) |
| 6 to 11 Years | 19 (2.8%) | 0 (0.0%) |
| 12 to 14 Years | 19 (5.6%) | 0 (0.0%) |
| 15 Years | 0 (0.0%) | 0 (0.0%) |
| 16 and 17 Years | 0 (0.0%) | 36 (14.0%) |
| 18 to 24 Years | 8 (0.7%) | 108 (8.8%) |
| 25 to 34 Years | 190 (11.5%) | 159 (11.3%) |
| 35 to 44 Years | 10 (0.7%) | 32 (2.3%) |
| 45 to 54 Years | 38 (3.1%) | 102 (8.5%) |
| 55 to 64 Years | 80 (9.7%) | 33 (3.3%) |
| 65 to 74 Years | 0 (0.0%) | 112 (14.2%) |
| 75 Years and over | 55 (21.8%) | 83 (17.2%) |
| Total | 566 (6.1%) | 908 (9.4%) |
Income Above Poverty by Sex and Age in Roosevelt
According to the poverty statistics in Roosevelt, males aged 5 years and females aged 5 years are the age groups that are most secure financially, with 100.0% of males and 100.0% of females in these age groups living above the poverty line.
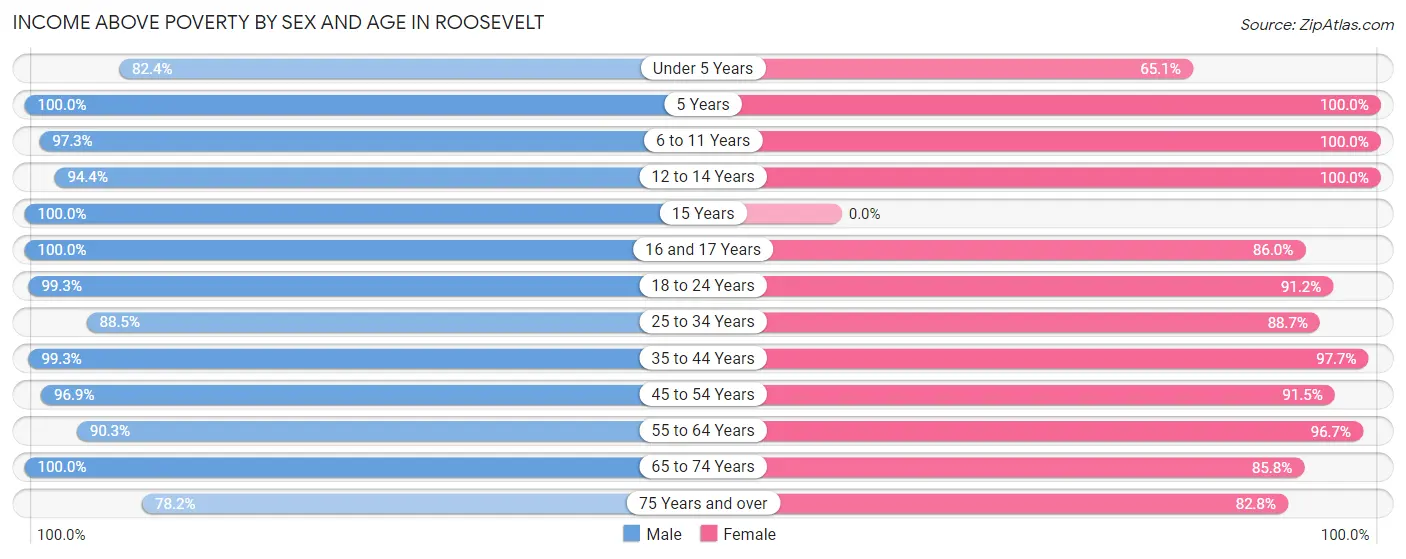
| Age Bracket | Male | Female |
| Under 5 Years | 690 (82.4%) | 453 (65.1%) |
| 5 Years | 155 (100.0%) | 88 (100.0%) |
| 6 to 11 Years | 671 (97.3%) | 738 (100.0%) |
| 12 to 14 Years | 323 (94.4%) | 361 (100.0%) |
| 15 Years | 115 (100.0%) | 0 (0.0%) |
| 16 and 17 Years | 162 (100.0%) | 221 (86.0%) |
| 18 to 24 Years | 1,087 (99.3%) | 1,118 (91.2%) |
| 25 to 34 Years | 1,459 (88.5%) | 1,249 (88.7%) |
| 35 to 44 Years | 1,371 (99.3%) | 1,372 (97.7%) |
| 45 to 54 Years | 1,203 (96.9%) | 1,094 (91.5%) |
| 55 to 64 Years | 746 (90.3%) | 967 (96.7%) |
| 65 to 74 Years | 475 (100.0%) | 676 (85.8%) |
| 75 Years and over | 197 (78.2%) | 399 (82.8%) |
| Total | 8,654 (93.9%) | 8,736 (90.6%) |
Income Below Poverty Among Married-Couple Families in Roosevelt
The poverty statistics for married-couple families in Roosevelt show that 9.2% or 193 of the total 2,096 families live below the poverty line. Families with 1 or 2 children have the highest poverty rate of 11.0%, comprising of 121 families. On the other hand, families with no children have the lowest poverty rate of 6.8%, which includes 51 families.
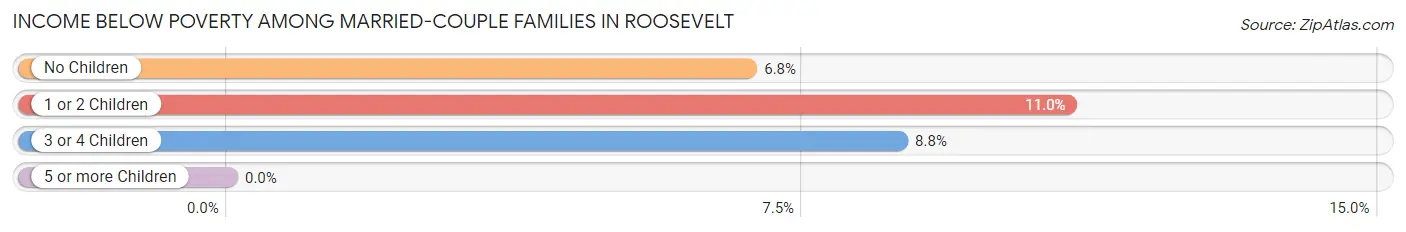
| Children | Above Poverty | Below Poverty |
| No Children | 701 (93.2%) | 51 (6.8%) |
| 1 or 2 Children | 983 (89.0%) | 121 (11.0%) |
| 3 or 4 Children | 219 (91.2%) | 21 (8.7%) |
| 5 or more Children | 0 (0.0%) | 0 (0.0%) |
| Total | 1,903 (90.8%) | 193 (9.2%) |
Income Below Poverty Among Single-Parent Households in Roosevelt
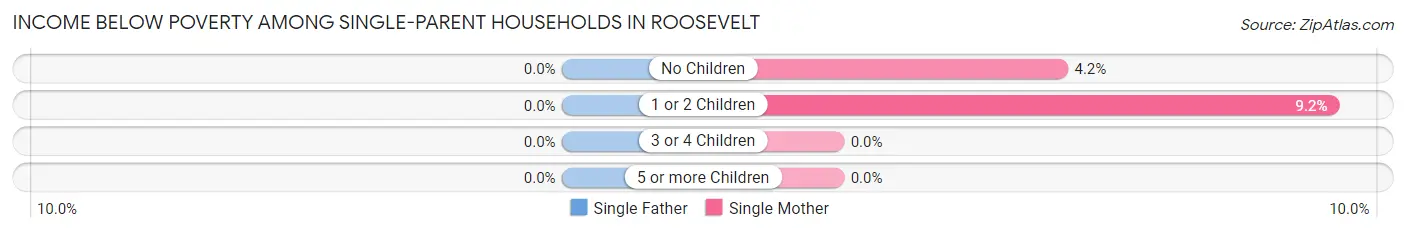
| Children | Single Father | Single Mother |
| No Children | 0 (0.0%) | 24 (4.2%) |
| 1 or 2 Children | 0 (0.0%) | 62 (9.2%) |
| 3 or 4 Children | 0 (0.0%) | 0 (0.0%) |
| 5 or more Children | 0 (0.0%) | 0 (0.0%) |
| Total | 0 (0.0%) | 86 (6.1%) |
Income Below Poverty Among Married-Couple vs Single-Parent Households in Roosevelt
The poverty data for Roosevelt shows that 193 of the married-couple family households (9.2%) and 86 of the single-parent households (4.6%) are living below the poverty level. Within the married-couple family households, those with 1 or 2 children have the highest poverty rate, with 121 households (11.0%) falling below the poverty line. Among the single-parent households, those with 1 or 2 children have the highest poverty rate, with 62 household (7.2%) living below poverty.
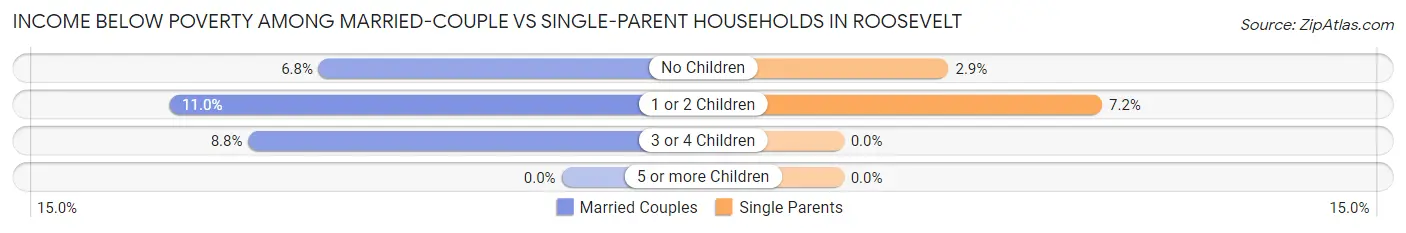
| Children | Married-Couple Families | Single-Parent Households |
| No Children | 51 (6.8%) | 24 (2.9%) |
| 1 or 2 Children | 121 (11.0%) | 62 (7.2%) |
| 3 or 4 Children | 21 (8.7%) | 0 (0.0%) |
| 5 or more Children | 0 (0.0%) | 0 (0.0%) |
| Total | 193 (9.2%) | 86 (4.6%) |
Employment Characteristics in Roosevelt
Employment by Class of Employer in Roosevelt
Among the 9,982 employed individuals in Roosevelt, private company employees (6,720 | 67.3%), not-for-profit organizations (940 | 9.4%), and local government employees (837 | 8.4%) make up the most common classes of employment.
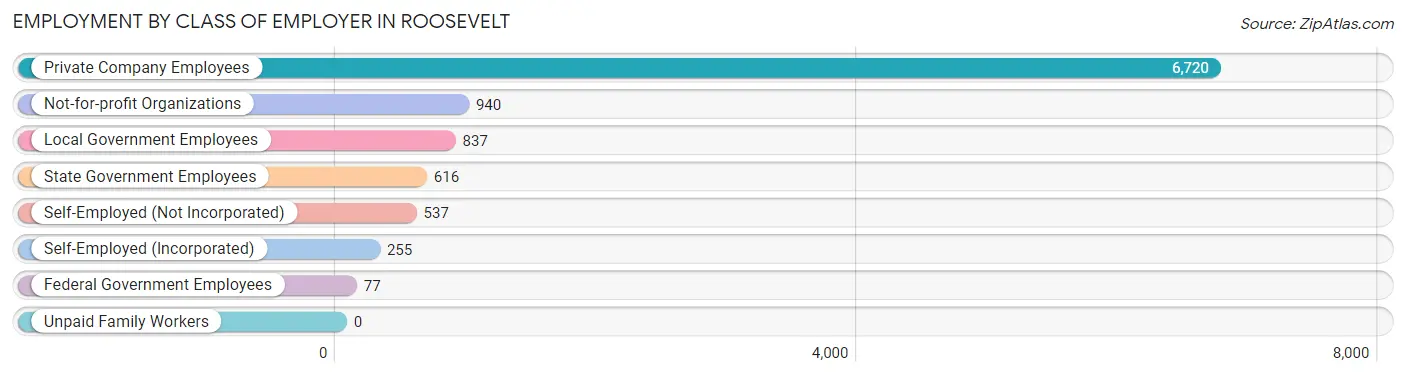
| Employer Class | # Employees | % Employees |
| Private Company Employees | 6,720 | 67.3% |
| Self-Employed (Incorporated) | 255 | 2.5% |
| Self-Employed (Not Incorporated) | 537 | 5.4% |
| Not-for-profit Organizations | 940 | 9.4% |
| Local Government Employees | 837 | 8.4% |
| State Government Employees | 616 | 6.2% |
| Federal Government Employees | 77 | 0.8% |
| Unpaid Family Workers | 0 | 0.0% |
| Total | 9,982 | 100.0% |
Employment Status by Age in Roosevelt
According to the labor force statistics for Roosevelt, out of the total population over 16 years of age (14,842), 72.6% or 10,775 individuals are in the labor force, with 4.6% or 496 of them unemployed. The age group with the highest labor force participation rate is 55 to 59 years, with 93.3% or 840 individuals in the labor force. Within the labor force, the 20 to 24 years age range has the highest percentage of unemployed individuals, with 16.0% or 194 of them being unemployed.
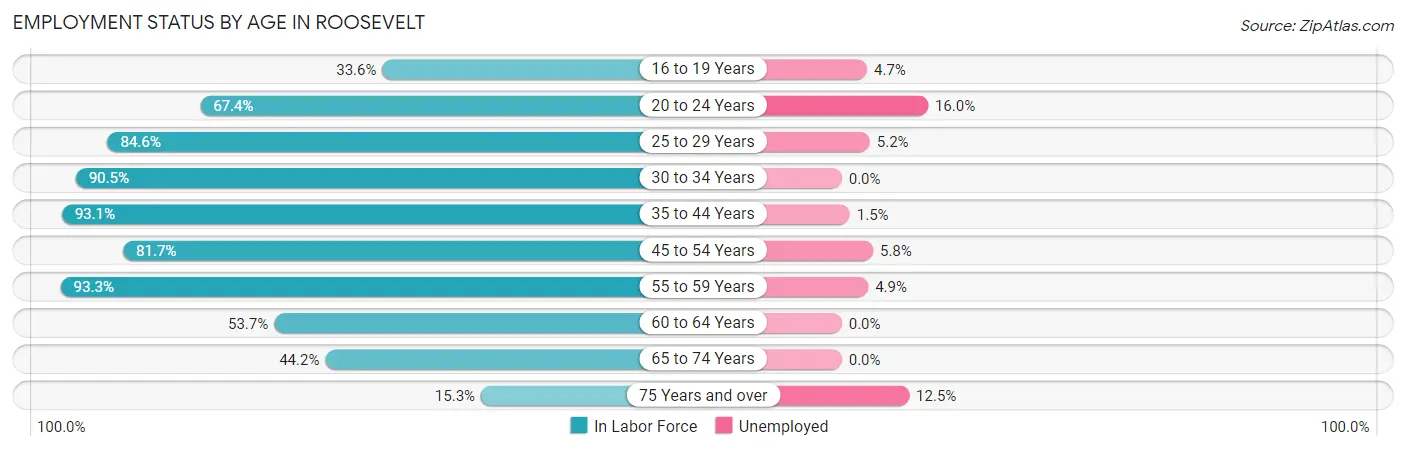
| Age Bracket | In Labor Force | Unemployed |
| 16 to 19 Years | 317 (33.6%) | 15 (4.7%) |
| 20 to 24 Years | 1,211 (67.4%) | 194 (16.0%) |
| 25 to 29 Years | 1,553 (84.6%) | 81 (5.2%) |
| 30 to 34 Years | 1,105 (90.5%) | 0 (0.0%) |
| 35 to 44 Years | 2,593 (93.1%) | 39 (1.5%) |
| 45 to 54 Years | 1,991 (81.7%) | 115 (5.8%) |
| 55 to 59 Years | 840 (93.3%) | 41 (4.9%) |
| 60 to 64 Years | 497 (53.7%) | 0 (0.0%) |
| 65 to 74 Years | 558 (44.2%) | 0 (0.0%) |
| 75 Years and over | 112 (15.3%) | 14 (12.5%) |
| Total | 10,775 (72.6%) | 496 (4.6%) |
Employment Status by Educational Attainment in Roosevelt
According to labor force statistics for Roosevelt, 84.9% of individuals (8,579) out of the total population between 25 and 64 years of age (10,105) are in the labor force, with 3.2% or 275 of them being unemployed. The group with the highest labor force participation rate are those with the educational attainment of bachelor's degree or higher, with 94.8% or 2,401 individuals in the labor force. Within the labor force, individuals with bachelor's degree or higher education have the highest percentage of unemployment, with 5.6% or 134 of them being unemployed.
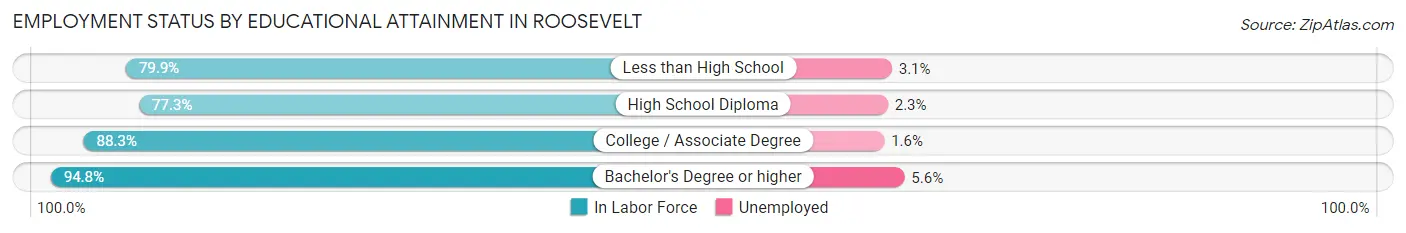
| Educational Attainment | In Labor Force | Unemployed |
| Less than High School | 1,642 (79.9%) | 64 (3.1%) |
| High School Diploma | 2,348 (77.3%) | 70 (2.3%) |
| College / Associate Degree | 2,190 (88.3%) | 40 (1.6%) |
| Bachelor's Degree or higher | 2,401 (94.8%) | 142 (5.6%) |
| Total | 8,579 (84.9%) | 323 (3.2%) |
Employment Occupations by Sex in Roosevelt
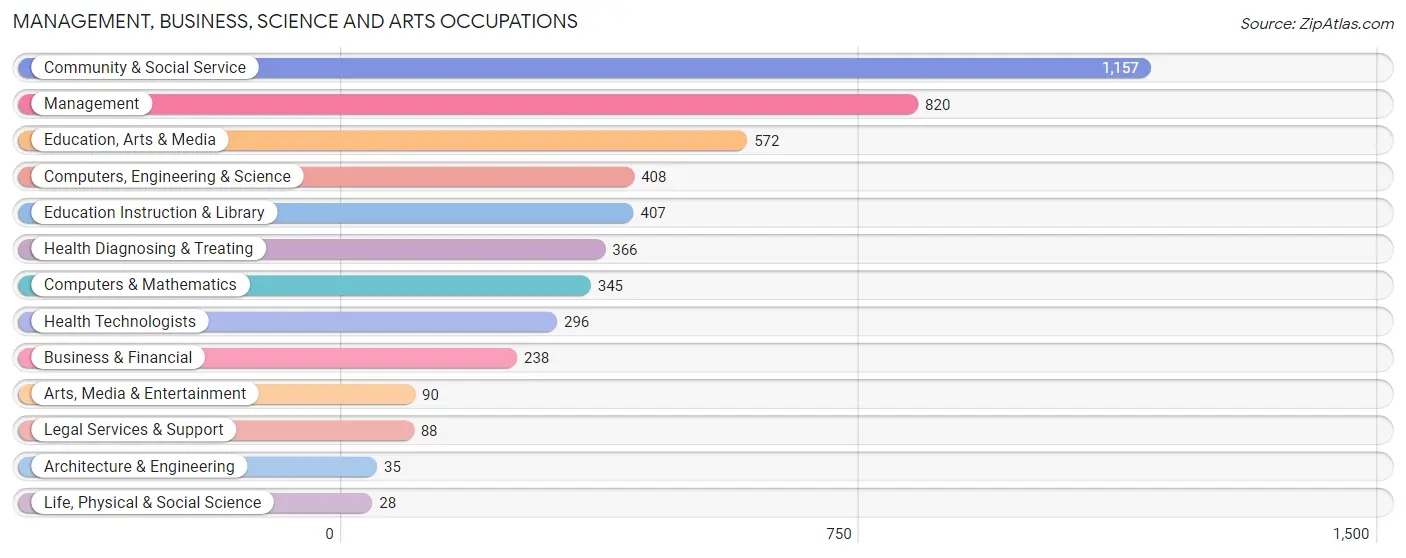
Management, Business, Science and Arts Occupations
The most common Management, Business, Science and Arts occupations in Roosevelt are Community & Social Service (1,157 | 11.3%), Management (820 | 8.0%), Education, Arts & Media (572 | 5.6%), Computers, Engineering & Science (408 | 4.0%), and Education Instruction & Library (407 | 4.0%).
Management, Business, Science and Arts Occupations by Sex
Within the Management, Business, Science and Arts occupations in Roosevelt, the most male-oriented occupations are Computers & Mathematics (63.8%), Management (62.3%), and Computers, Engineering & Science (53.9%), while the most female-oriented occupations are Architecture & Engineering (100.0%), Life, Physical & Social Science (100.0%), and Legal Services & Support (100.0%).
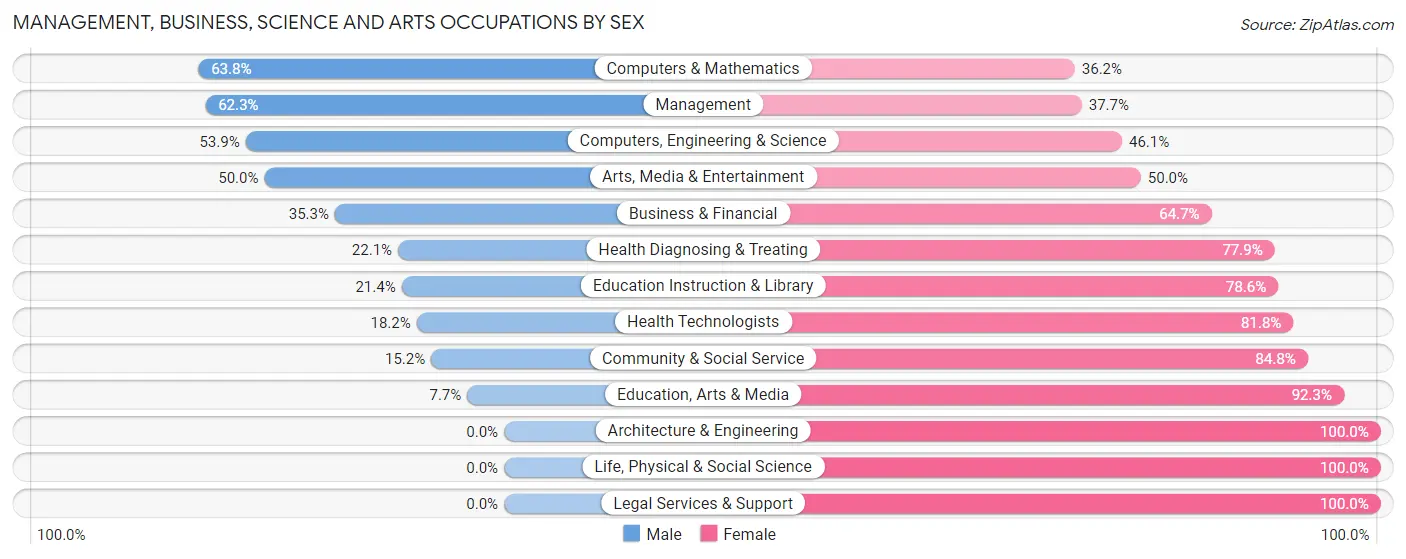
| Occupation | Male | Female |
| Management | 511 (62.3%) | 309 (37.7%) |
| Business & Financial | 84 (35.3%) | 154 (64.7%) |
| Computers, Engineering & Science | 220 (53.9%) | 188 (46.1%) |
| Computers & Mathematics | 220 (63.8%) | 125 (36.2%) |
| Architecture & Engineering | 0 (0.0%) | 35 (100.0%) |
| Life, Physical & Social Science | 0 (0.0%) | 28 (100.0%) |
| Community & Social Service | 176 (15.2%) | 981 (84.8%) |
| Education, Arts & Media | 44 (7.7%) | 528 (92.3%) |
| Legal Services & Support | 0 (0.0%) | 88 (100.0%) |
| Education Instruction & Library | 87 (21.4%) | 320 (78.6%) |
| Arts, Media & Entertainment | 45 (50.0%) | 45 (50.0%) |
| Health Diagnosing & Treating | 81 (22.1%) | 285 (77.9%) |
| Health Technologists | 54 (18.2%) | 242 (81.8%) |
| Total (Category) | 1,072 (35.9%) | 1,917 (64.1%) |
| Total (Overall) | 5,157 (50.2%) | 5,123 (49.8%) |
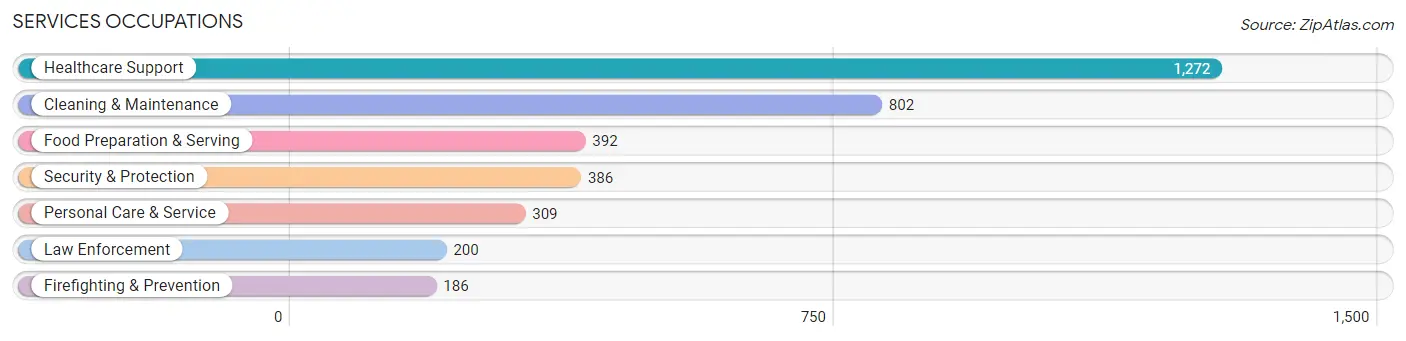
Services Occupations
The most common Services occupations in Roosevelt are Healthcare Support (1,272 | 12.4%), Cleaning & Maintenance (802 | 7.8%), Food Preparation & Serving (392 | 3.8%), Security & Protection (386 | 3.7%), and Personal Care & Service (309 | 3.0%).
Services Occupations by Sex
Within the Services occupations in Roosevelt, the most male-oriented occupations are Food Preparation & Serving (88.5%), Firefighting & Prevention (85.5%), and Security & Protection (76.9%), while the most female-oriented occupations are Healthcare Support (84.8%), Personal Care & Service (65.7%), and Cleaning & Maintenance (44.0%).
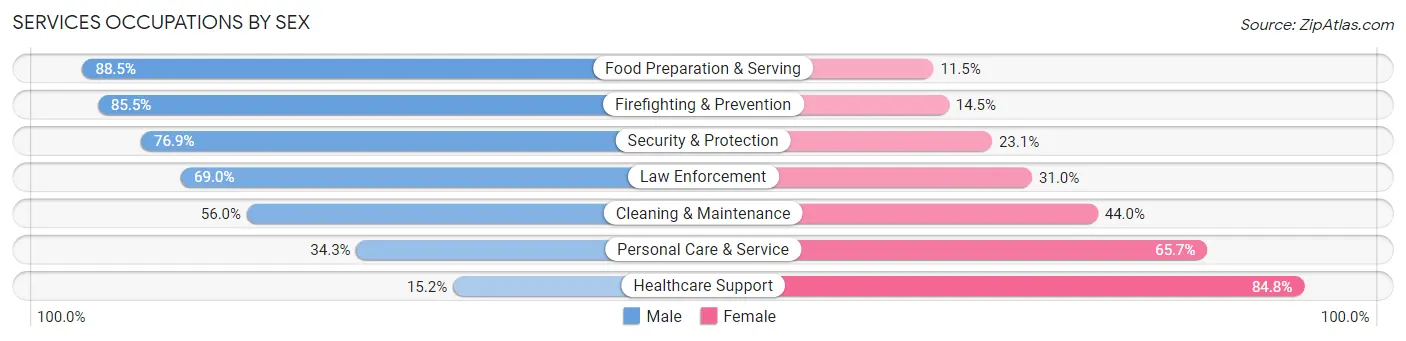
| Occupation | Male | Female |
| Healthcare Support | 193 (15.2%) | 1,079 (84.8%) |
| Security & Protection | 297 (76.9%) | 89 (23.1%) |
| Firefighting & Prevention | 159 (85.5%) | 27 (14.5%) |
| Law Enforcement | 138 (69.0%) | 62 (31.0%) |
| Food Preparation & Serving | 347 (88.5%) | 45 (11.5%) |
| Cleaning & Maintenance | 449 (56.0%) | 353 (44.0%) |
| Personal Care & Service | 106 (34.3%) | 203 (65.7%) |
| Total (Category) | 1,392 (44.0%) | 1,769 (56.0%) |
| Total (Overall) | 5,157 (50.2%) | 5,123 (49.8%) |
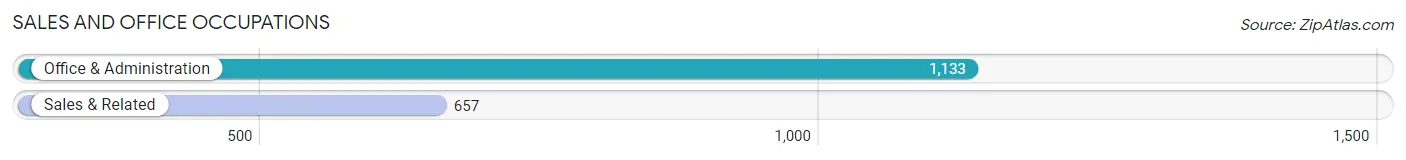
Sales and Office Occupations
The most common Sales and Office occupations in Roosevelt are Office & Administration (1,133 | 11.0%), and Sales & Related (657 | 6.4%).
Sales and Office Occupations by Sex
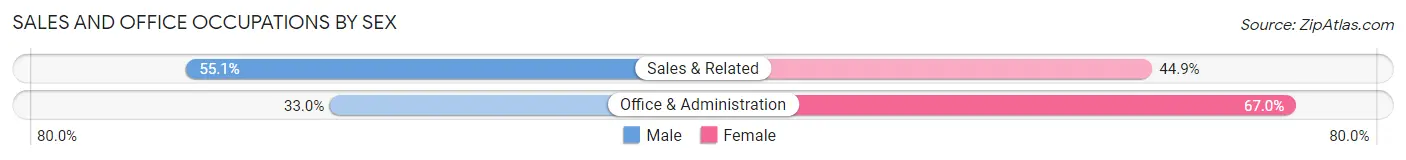
| Occupation | Male | Female |
| Sales & Related | 362 (55.1%) | 295 (44.9%) |
| Office & Administration | 374 (33.0%) | 759 (67.0%) |
| Total (Category) | 736 (41.1%) | 1,054 (58.9%) |
| Total (Overall) | 5,157 (50.2%) | 5,123 (49.8%) |
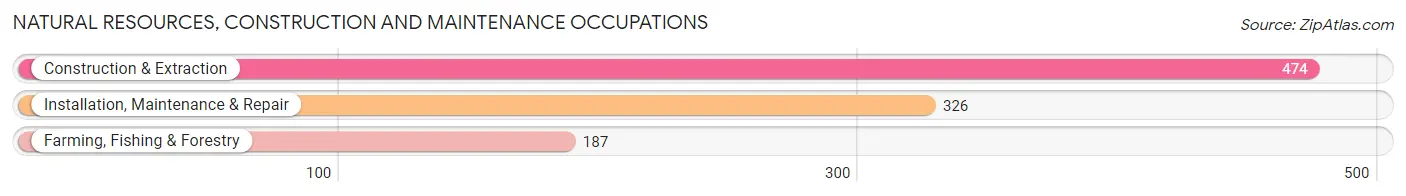
Natural Resources, Construction and Maintenance Occupations
The most common Natural Resources, Construction and Maintenance occupations in Roosevelt are Construction & Extraction (474 | 4.6%), Installation, Maintenance & Repair (326 | 3.2%), and Farming, Fishing & Forestry (187 | 1.8%).
Natural Resources, Construction and Maintenance Occupations by Sex
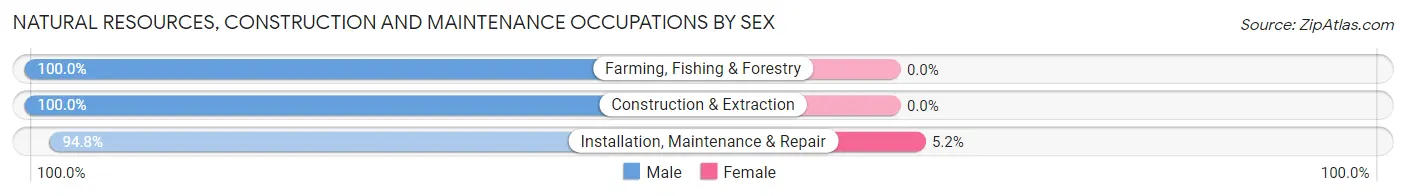
| Occupation | Male | Female |
| Farming, Fishing & Forestry | 187 (100.0%) | 0 (0.0%) |
| Construction & Extraction | 474 (100.0%) | 0 (0.0%) |
| Installation, Maintenance & Repair | 309 (94.8%) | 17 (5.2%) |
| Total (Category) | 970 (98.3%) | 17 (1.7%) |
| Total (Overall) | 5,157 (50.2%) | 5,123 (49.8%) |
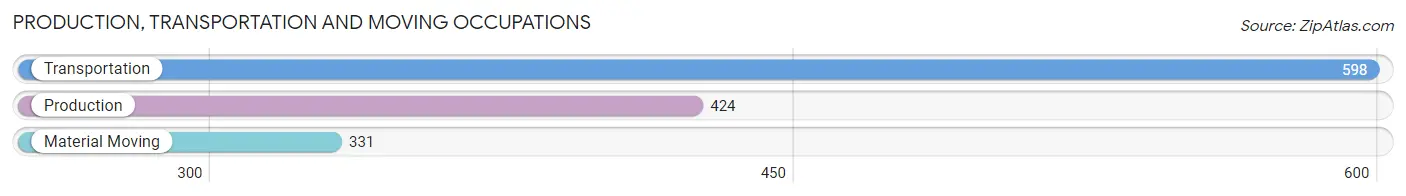
Production, Transportation and Moving Occupations
The most common Production, Transportation and Moving occupations in Roosevelt are Transportation (598 | 5.8%), Production (424 | 4.1%), and Material Moving (331 | 3.2%).
Production, Transportation and Moving Occupations by Sex
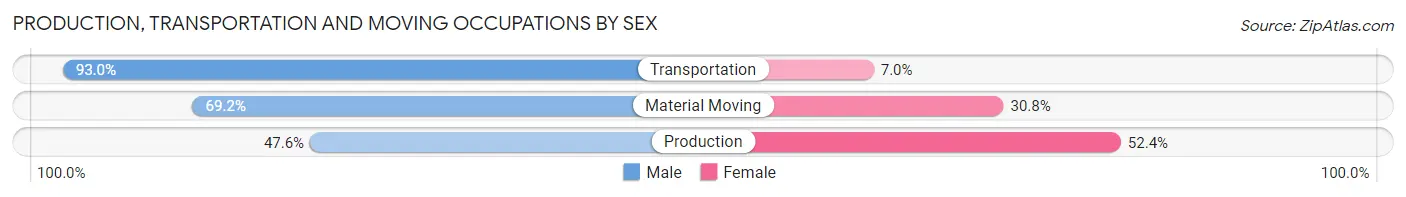
| Occupation | Male | Female |
| Production | 202 (47.6%) | 222 (52.4%) |
| Transportation | 556 (93.0%) | 42 (7.0%) |
| Material Moving | 229 (69.2%) | 102 (30.8%) |
| Total (Category) | 987 (73.0%) | 366 (27.1%) |
| Total (Overall) | 5,157 (50.2%) | 5,123 (49.8%) |
Employment Industries by Sex in Roosevelt
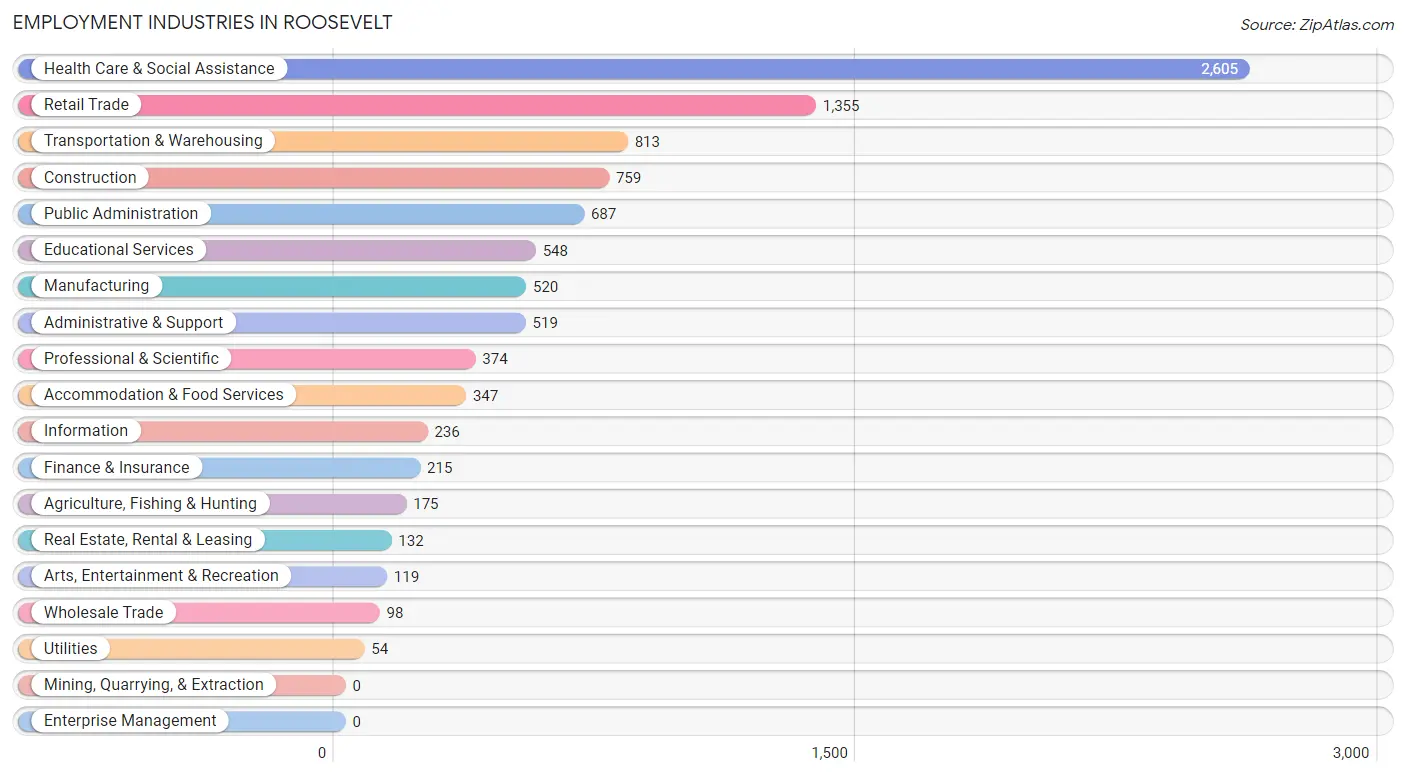
Employment Industries in Roosevelt
The major employment industries in Roosevelt include Health Care & Social Assistance (2,605 | 25.3%), Retail Trade (1,355 | 13.2%), Transportation & Warehousing (813 | 7.9%), Construction (759 | 7.4%), and Public Administration (687 | 6.7%).
Employment Industries by Sex in Roosevelt
The Roosevelt industries that see more men than women are Construction (97.4%), Information (88.6%), and Arts, Entertainment & Recreation (80.7%), whereas the industries that tend to have a higher number of women are Educational Services (80.1%), Health Care & Social Assistance (76.3%), and Public Administration (72.5%).
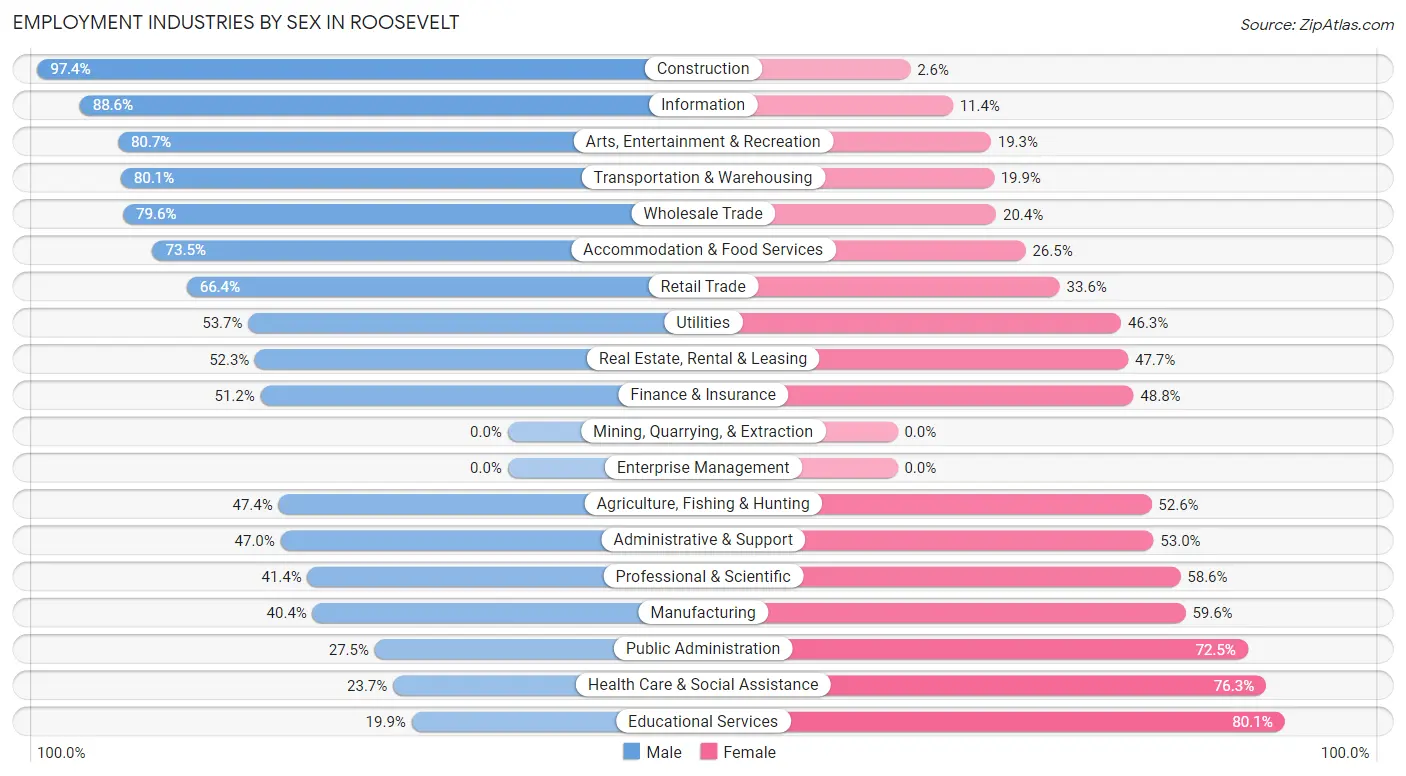
| Industry | Male | Female |
| Agriculture, Fishing & Hunting | 83 (47.4%) | 92 (52.6%) |
| Mining, Quarrying, & Extraction | 0 (0.0%) | 0 (0.0%) |
| Construction | 739 (97.4%) | 20 (2.6%) |
| Manufacturing | 210 (40.4%) | 310 (59.6%) |
| Wholesale Trade | 78 (79.6%) | 20 (20.4%) |
| Retail Trade | 900 (66.4%) | 455 (33.6%) |
| Transportation & Warehousing | 651 (80.1%) | 162 (19.9%) |
| Utilities | 29 (53.7%) | 25 (46.3%) |
| Information | 209 (88.6%) | 27 (11.4%) |
| Finance & Insurance | 110 (51.2%) | 105 (48.8%) |
| Real Estate, Rental & Leasing | 69 (52.3%) | 63 (47.7%) |
| Professional & Scientific | 155 (41.4%) | 219 (58.6%) |
| Enterprise Management | 0 (0.0%) | 0 (0.0%) |
| Administrative & Support | 244 (47.0%) | 275 (53.0%) |
| Educational Services | 109 (19.9%) | 439 (80.1%) |
| Health Care & Social Assistance | 618 (23.7%) | 1,987 (76.3%) |
| Arts, Entertainment & Recreation | 96 (80.7%) | 23 (19.3%) |
| Accommodation & Food Services | 255 (73.5%) | 92 (26.5%) |
| Public Administration | 189 (27.5%) | 498 (72.5%) |
| Total | 5,157 (50.2%) | 5,123 (49.8%) |
Education in Roosevelt
School Enrollment in Roosevelt
The most common levels of schooling among the 4,963 students in Roosevelt are college / undergraduate (1,268 | 25.6%), elementary school (971 | 19.6%), and middle school (954 | 19.2%).
| School Level | # Students | % Students |
| Nursery / Preschool | 351 | 7.1% |
| Kindergarten | 334 | 6.7% |
| Elementary School | 971 | 19.6% |
| Middle School | 954 | 19.2% |
| High School | 787 | 15.9% |
| College / Undergraduate | 1,268 | 25.6% |
| Graduate / Professional | 298 | 6.0% |
| Total | 4,963 | 100.0% |
School Enrollment by Age by Funding Source in Roosevelt
Out of a total of 4,963 students who are enrolled in schools in Roosevelt, 670 (13.5%) attend a private institution, while the remaining 4,293 (86.5%) are enrolled in public schools. The age group of 35 years and over has the highest likelihood of being enrolled in private schools, with 120 (33.4% in the age bracket) enrolled. Conversely, the age group of 10 to 14 year olds has the lowest likelihood of being enrolled in a private school, with 1,069 (95.7% in the age bracket) attending a public institution.
| Age Bracket | Public School | Private School |
| 3 to 4 Year Olds | 181 (72.7%) | 68 (27.3%) |
| 5 to 9 Year Old | 1,314 (95.6%) | 61 (4.4%) |
| 10 to 14 Year Olds | 1,069 (95.7%) | 48 (4.3%) |
| 15 to 17 Year Olds | 488 (91.4%) | 46 (8.6%) |
| 18 to 19 Year Olds | 339 (84.8%) | 61 (15.2%) |
| 20 to 24 Year Olds | 453 (69.5%) | 199 (30.5%) |
| 25 to 34 Year Olds | 209 (75.4%) | 68 (24.5%) |
| 35 Years and over | 239 (66.6%) | 120 (33.4%) |
| Total | 4,293 (86.5%) | 670 (13.5%) |
Educational Attainment by Field of Study in Roosevelt
Business (785 | 22.9%), social sciences (601 | 17.5%), science & technology (391 | 11.4%), literature & languages (386 | 11.3%), and arts & humanities (270 | 7.9%) are the most common fields of study among 3,430 individuals in Roosevelt who have obtained a bachelor's degree or higher.
| Field of Study | # Graduates | % Graduates |
| Computers & Mathematics | 164 | 4.8% |
| Bio, Nature & Agricultural | 85 | 2.5% |
| Physical & Health Sciences | 63 | 1.8% |
| Psychology | 96 | 2.8% |
| Social Sciences | 601 | 17.5% |
| Engineering | 160 | 4.7% |
| Multidisciplinary Studies | 0 | 0.0% |
| Science & Technology | 391 | 11.4% |
| Business | 785 | 22.9% |
| Education | 248 | 7.2% |
| Literature & Languages | 386 | 11.3% |
| Liberal Arts & History | 74 | 2.2% |
| Visual & Performing Arts | 31 | 0.9% |
| Communications | 76 | 2.2% |
| Arts & Humanities | 270 | 7.9% |
| Total | 3,430 | 100.0% |
Transportation & Commute in Roosevelt
Vehicle Availability by Sex in Roosevelt
The most prevalent vehicle ownership categories in Roosevelt are males with 2 vehicles (1,579, accounting for 31.4%) and females with 2 vehicles (1,242, making up 31.9%).

| Vehicles Available | Male | Female |
| No Vehicle | 210 (4.2%) | 288 (5.8%) |
| 1 Vehicle | 857 (17.0%) | 1,223 (24.7%) |
| 2 Vehicles | 1,579 (31.4%) | 1,242 (25.1%) |
| 3 Vehicles | 794 (15.8%) | 650 (13.1%) |
| 4 Vehicles | 1,094 (21.7%) | 949 (19.2%) |
| 5 or more Vehicles | 502 (10.0%) | 594 (12.0%) |
| Total | 5,036 (100.0%) | 4,946 (100.0%) |
Commute Time in Roosevelt
The most frequently occuring commute durations in Roosevelt are 30 to 34 minutes (1,817 commuters, 19.5%), 60 to 89 minutes (1,431 commuters, 15.4%), and 20 to 24 minutes (1,331 commuters, 14.3%).
| Commute Time | # Commuters | % Commuters |
| Less than 5 Minutes | 257 | 2.8% |
| 5 to 9 Minutes | 528 | 5.7% |
| 10 to 14 Minutes | 252 | 2.7% |
| 15 to 19 Minutes | 1,179 | 12.7% |
| 20 to 24 Minutes | 1,331 | 14.3% |
| 25 to 29 Minutes | 865 | 9.3% |
| 30 to 34 Minutes | 1,817 | 19.5% |
| 35 to 39 Minutes | 188 | 2.0% |
| 40 to 44 Minutes | 333 | 3.6% |
| 45 to 59 Minutes | 558 | 6.0% |
| 60 to 89 Minutes | 1,431 | 15.4% |
| 90 or more Minutes | 575 | 6.2% |
Commute Time by Sex in Roosevelt
The most common commute times in Roosevelt are 30 to 34 minutes (1,047 commuters, 22.2%) for males and 15 to 19 minutes (824 commuters, 17.9%) for females.
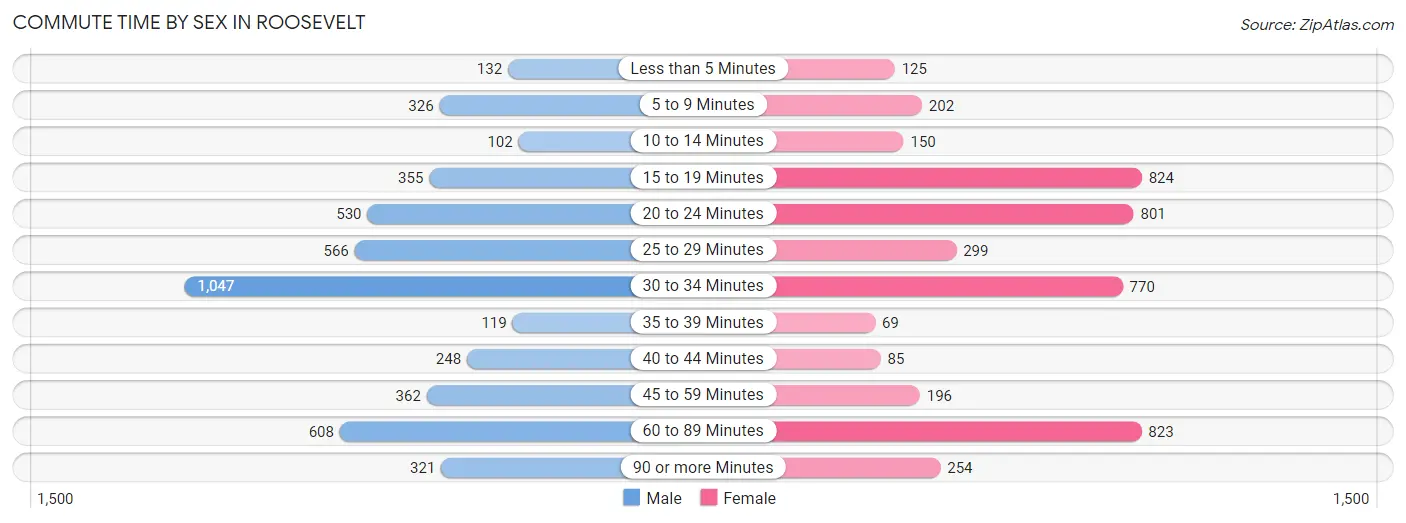
| Commute Time | Male | Female |
| Less than 5 Minutes | 132 (2.8%) | 125 (2.7%) |
| 5 to 9 Minutes | 326 (6.9%) | 202 (4.4%) |
| 10 to 14 Minutes | 102 (2.2%) | 150 (3.3%) |
| 15 to 19 Minutes | 355 (7.5%) | 824 (17.9%) |
| 20 to 24 Minutes | 530 (11.2%) | 801 (17.4%) |
| 25 to 29 Minutes | 566 (12.0%) | 299 (6.5%) |
| 30 to 34 Minutes | 1,047 (22.2%) | 770 (16.8%) |
| 35 to 39 Minutes | 119 (2.5%) | 69 (1.5%) |
| 40 to 44 Minutes | 248 (5.3%) | 85 (1.8%) |
| 45 to 59 Minutes | 362 (7.7%) | 196 (4.3%) |
| 60 to 89 Minutes | 608 (12.9%) | 823 (17.9%) |
| 90 or more Minutes | 321 (6.8%) | 254 (5.5%) |
Time of Departure to Work by Sex in Roosevelt
The most frequent times of departure to work in Roosevelt are 6:30 AM to 6:59 AM (744, 15.8%) for males and 8:00 AM to 8:29 AM (1,081, 23.5%) for females.
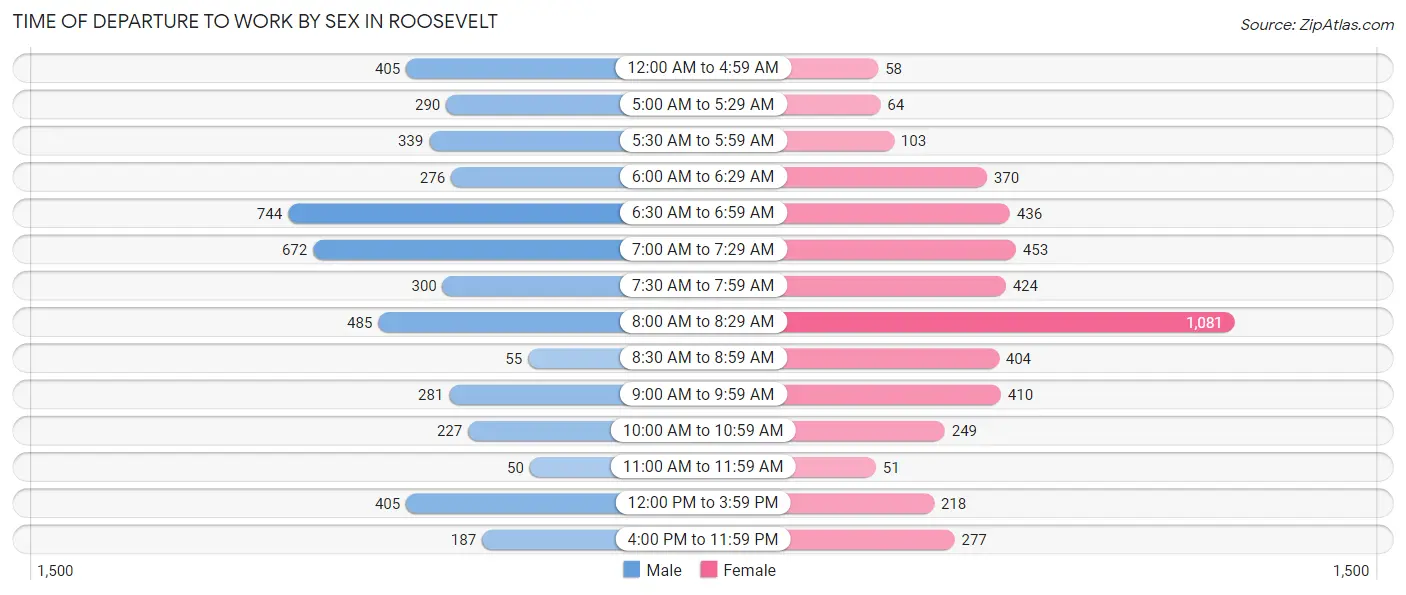
| Time of Departure | Male | Female |
| 12:00 AM to 4:59 AM | 405 (8.6%) | 58 (1.3%) |
| 5:00 AM to 5:29 AM | 290 (6.1%) | 64 (1.4%) |
| 5:30 AM to 5:59 AM | 339 (7.2%) | 103 (2.2%) |
| 6:00 AM to 6:29 AM | 276 (5.9%) | 370 (8.1%) |
| 6:30 AM to 6:59 AM | 744 (15.8%) | 436 (9.5%) |
| 7:00 AM to 7:29 AM | 672 (14.2%) | 453 (9.9%) |
| 7:30 AM to 7:59 AM | 300 (6.4%) | 424 (9.2%) |
| 8:00 AM to 8:29 AM | 485 (10.3%) | 1,081 (23.5%) |
| 8:30 AM to 8:59 AM | 55 (1.2%) | 404 (8.8%) |
| 9:00 AM to 9:59 AM | 281 (6.0%) | 410 (8.9%) |
| 10:00 AM to 10:59 AM | 227 (4.8%) | 249 (5.4%) |
| 11:00 AM to 11:59 AM | 50 (1.1%) | 51 (1.1%) |
| 12:00 PM to 3:59 PM | 405 (8.6%) | 218 (4.7%) |
| 4:00 PM to 11:59 PM | 187 (4.0%) | 277 (6.0%) |
| Total | 4,716 (100.0%) | 4,598 (100.0%) |
Housing Occupancy in Roosevelt
Occupancy by Ownership in Roosevelt
Of the total 4,525 dwellings in Roosevelt, owner-occupied units account for 3,450 (76.2%), while renter-occupied units make up 1,075 (23.8%).
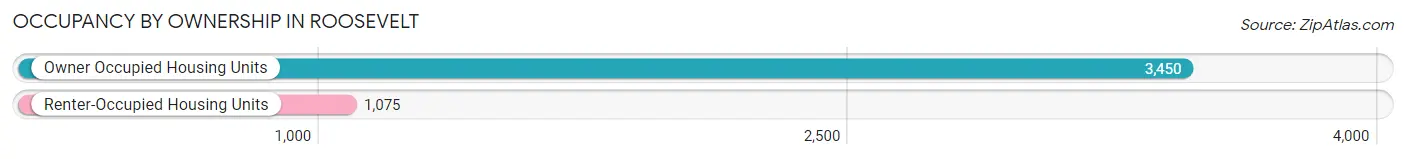
| Occupancy | # Housing Units | % Housing Units |
| Owner Occupied Housing Units | 3,450 | 76.2% |
| Renter-Occupied Housing Units | 1,075 | 23.8% |
| Total Occupied Housing Units | 4,525 | 100.0% |
Occupancy by Household Size in Roosevelt
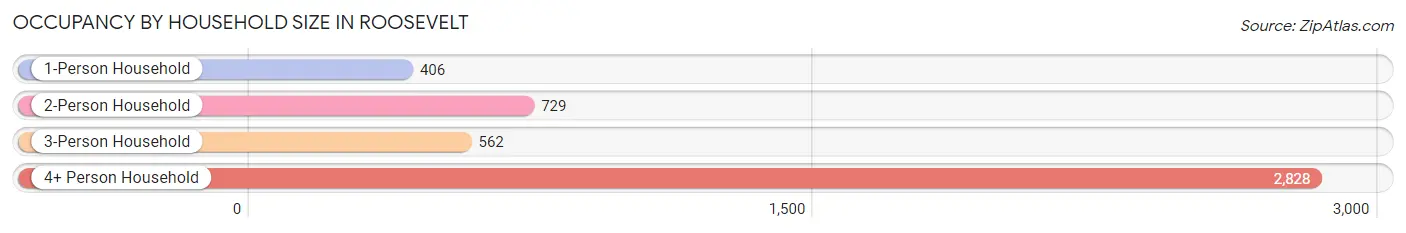
| Household Size | # Housing Units | % Housing Units |
| 1-Person Household | 406 | 9.0% |
| 2-Person Household | 729 | 16.1% |
| 3-Person Household | 562 | 12.4% |
| 4+ Person Household | 2,828 | 62.5% |
| Total Housing Units | 4,525 | 100.0% |
Occupancy by Ownership by Household Size in Roosevelt
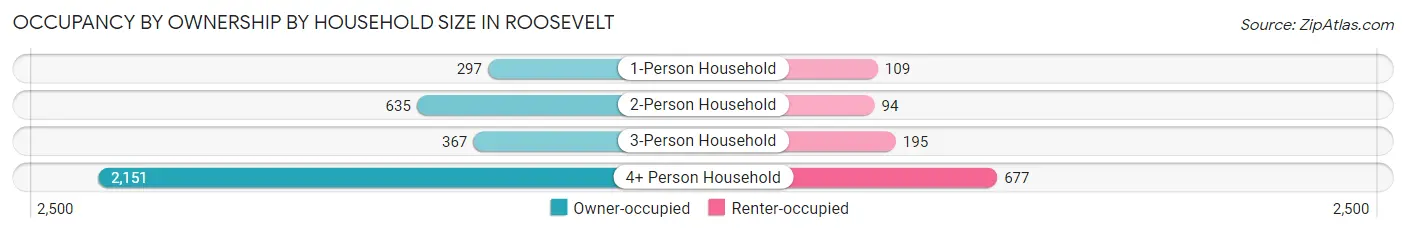
| Household Size | Owner-occupied | Renter-occupied |
| 1-Person Household | 297 (73.2%) | 109 (26.9%) |
| 2-Person Household | 635 (87.1%) | 94 (12.9%) |
| 3-Person Household | 367 (65.3%) | 195 (34.7%) |
| 4+ Person Household | 2,151 (76.1%) | 677 (23.9%) |
| Total Housing Units | 3,450 (76.2%) | 1,075 (23.8%) |
Occupancy by Educational Attainment in Roosevelt
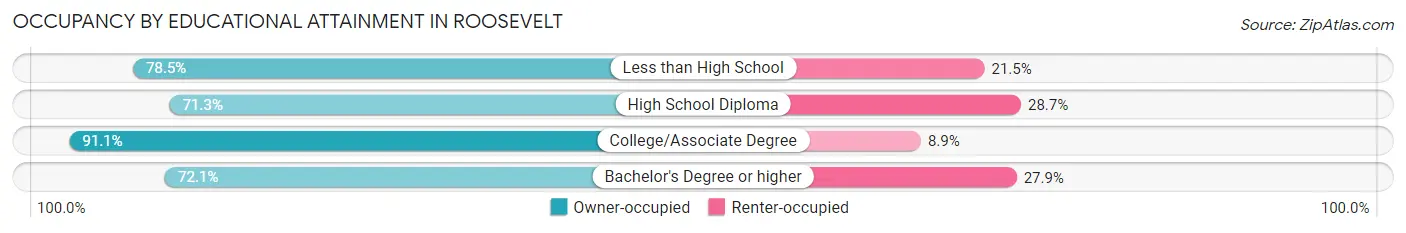
| Household Size | Owner-occupied | Renter-occupied |
| Less than High School | 654 (78.5%) | 179 (21.5%) |
| High School Diploma | 1,213 (71.3%) | 489 (28.7%) |
| College/Associate Degree | 708 (91.1%) | 69 (8.9%) |
| Bachelor's Degree or higher | 875 (72.1%) | 338 (27.9%) |
Occupancy by Age of Householder in Roosevelt
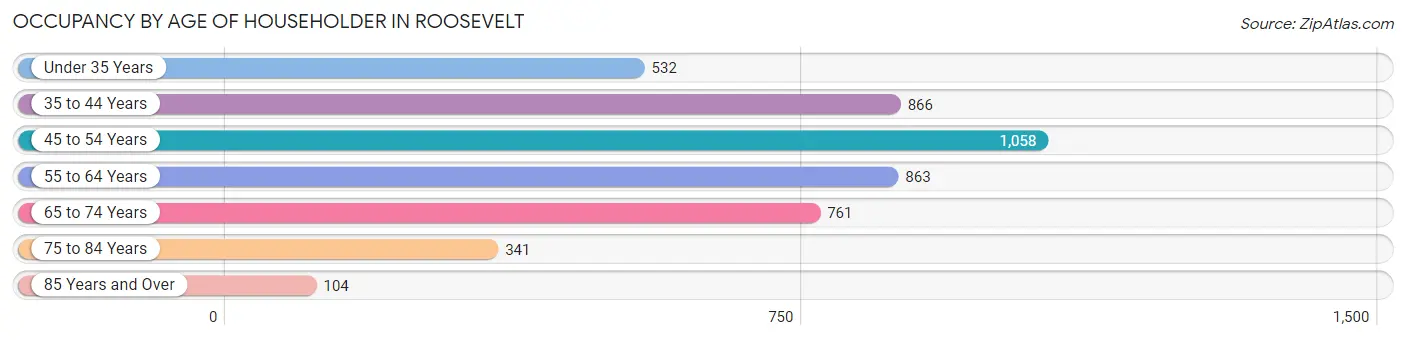
| Age Bracket | # Households | % Households |
| Under 35 Years | 532 | 11.8% |
| 35 to 44 Years | 866 | 19.1% |
| 45 to 54 Years | 1,058 | 23.4% |
| 55 to 64 Years | 863 | 19.1% |
| 65 to 74 Years | 761 | 16.8% |
| 75 to 84 Years | 341 | 7.5% |
| 85 Years and Over | 104 | 2.3% |
| Total | 4,525 | 100.0% |
Housing Finances in Roosevelt
Median Income by Occupancy in Roosevelt
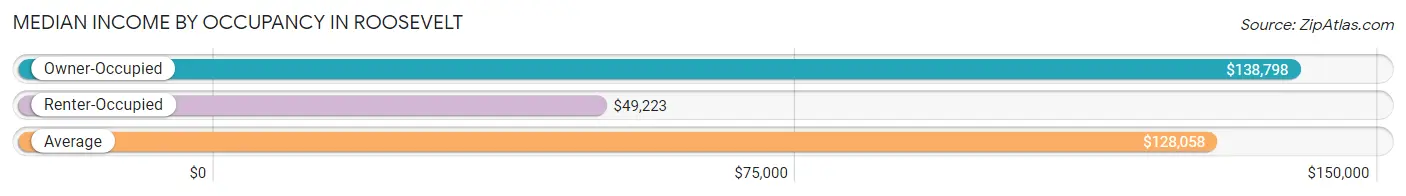
| Occupancy Type | # Households | Median Income |
| Owner-Occupied | 3,450 (76.2%) | $138,798 |
| Renter-Occupied | 1,075 (23.8%) | $49,223 |
| Average | 4,525 (100.0%) | $128,058 |
Occupancy by Householder Income Bracket in Roosevelt
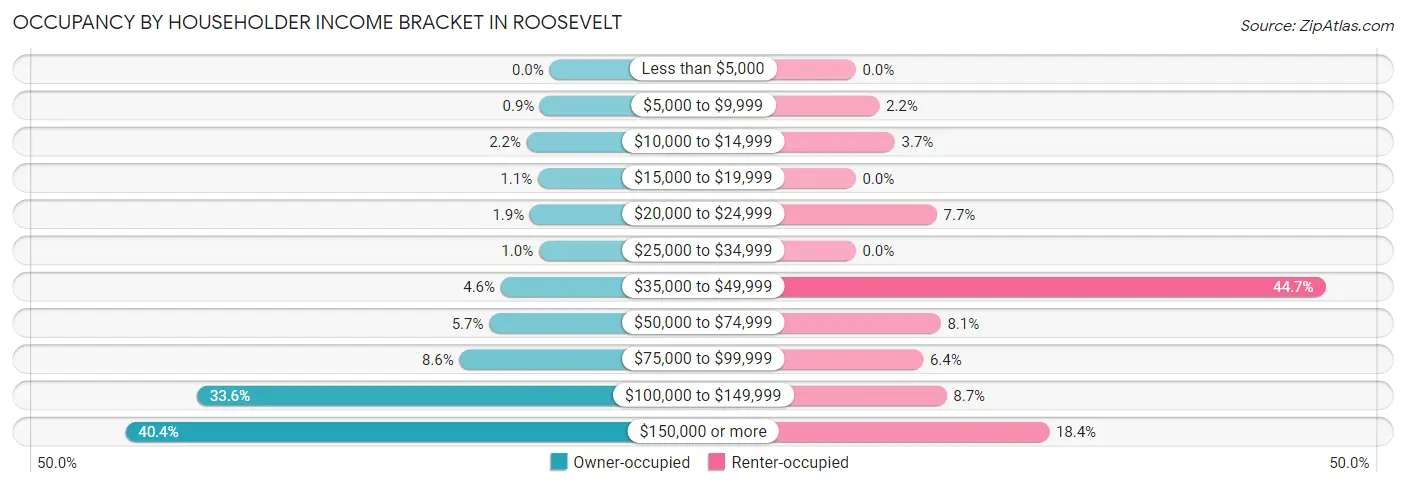
| Income Bracket | Owner-occupied | Renter-occupied |
| Less than $5,000 | 0 (0.0%) | 0 (0.0%) |
| $5,000 to $9,999 | 31 (0.9%) | 24 (2.2%) |
| $10,000 to $14,999 | 75 (2.2%) | 40 (3.7%) |
| $15,000 to $19,999 | 38 (1.1%) | 0 (0.0%) |
| $20,000 to $24,999 | 64 (1.9%) | 83 (7.7%) |
| $25,000 to $34,999 | 35 (1.0%) | 0 (0.0%) |
| $35,000 to $49,999 | 160 (4.6%) | 481 (44.7%) |
| $50,000 to $74,999 | 198 (5.7%) | 87 (8.1%) |
| $75,000 to $99,999 | 296 (8.6%) | 69 (6.4%) |
| $100,000 to $149,999 | 1,159 (33.6%) | 93 (8.6%) |
| $150,000 or more | 1,394 (40.4%) | 198 (18.4%) |
| Total | 3,450 (100.0%) | 1,075 (100.0%) |
Monthly Housing Cost Tiers in Roosevelt
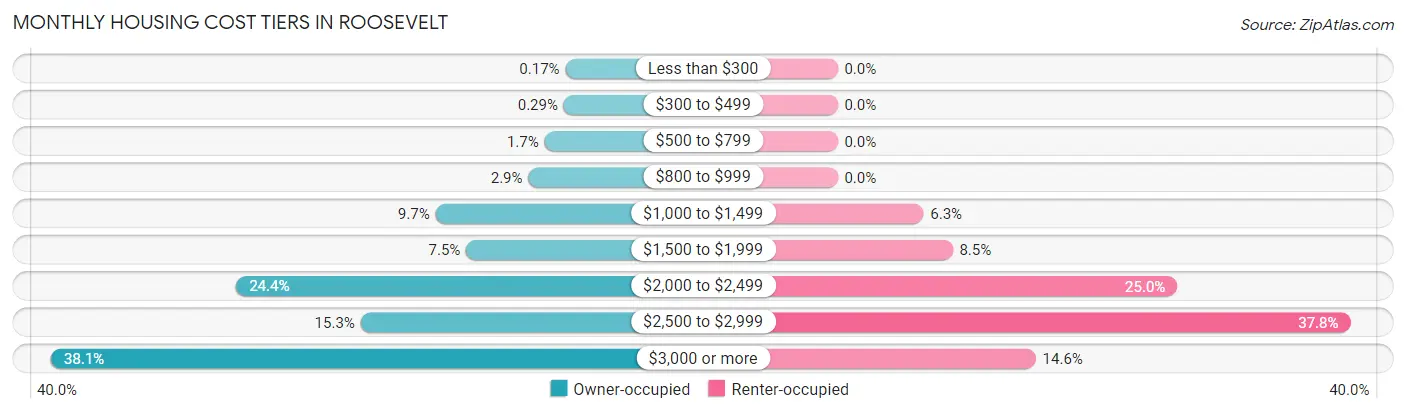
| Monthly Cost | Owner-occupied | Renter-occupied |
| Less than $300 | 6 (0.2%) | 0 (0.0%) |
| $300 to $499 | 10 (0.3%) | 0 (0.0%) |
| $500 to $799 | 59 (1.7%) | 0 (0.0%) |
| $800 to $999 | 100 (2.9%) | 0 (0.0%) |
| $1,000 to $1,499 | 336 (9.7%) | 68 (6.3%) |
| $1,500 to $1,999 | 258 (7.5%) | 91 (8.5%) |
| $2,000 to $2,499 | 842 (24.4%) | 269 (25.0%) |
| $2,500 to $2,999 | 526 (15.2%) | 406 (37.8%) |
| $3,000 or more | 1,313 (38.1%) | 157 (14.6%) |
| Total | 3,450 (100.0%) | 1,075 (100.0%) |
Physical Housing Characteristics in Roosevelt
Housing Structures in Roosevelt
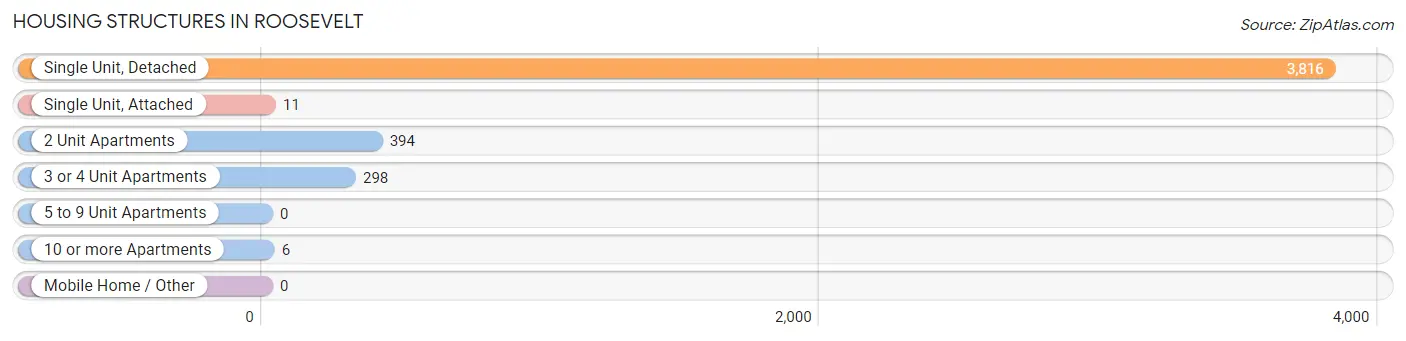
| Structure Type | # Housing Units | % Housing Units |
| Single Unit, Detached | 3,816 | 84.3% |
| Single Unit, Attached | 11 | 0.2% |
| 2 Unit Apartments | 394 | 8.7% |
| 3 or 4 Unit Apartments | 298 | 6.6% |
| 5 to 9 Unit Apartments | 0 | 0.0% |
| 10 or more Apartments | 6 | 0.1% |
| Mobile Home / Other | 0 | 0.0% |
| Total | 4,525 | 100.0% |
Housing Structures by Occupancy in Roosevelt
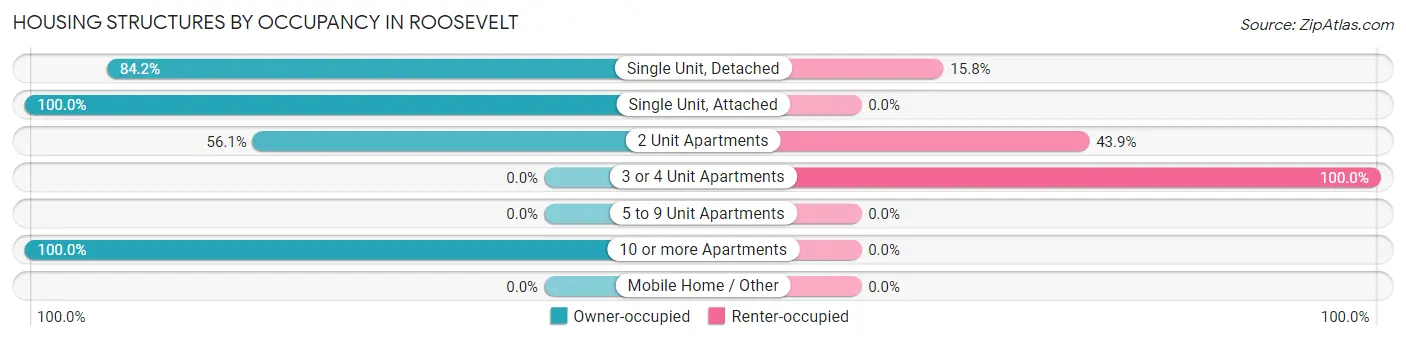
| Structure Type | Owner-occupied | Renter-occupied |
| Single Unit, Detached | 3,212 (84.2%) | 604 (15.8%) |
| Single Unit, Attached | 11 (100.0%) | 0 (0.0%) |
| 2 Unit Apartments | 221 (56.1%) | 173 (43.9%) |
| 3 or 4 Unit Apartments | 0 (0.0%) | 298 (100.0%) |
| 5 to 9 Unit Apartments | 0 (0.0%) | 0 (0.0%) |
| 10 or more Apartments | 6 (100.0%) | 0 (0.0%) |
| Mobile Home / Other | 0 (0.0%) | 0 (0.0%) |
| Total | 3,450 (76.2%) | 1,075 (23.8%) |
Housing Structures by Number of Rooms in Roosevelt
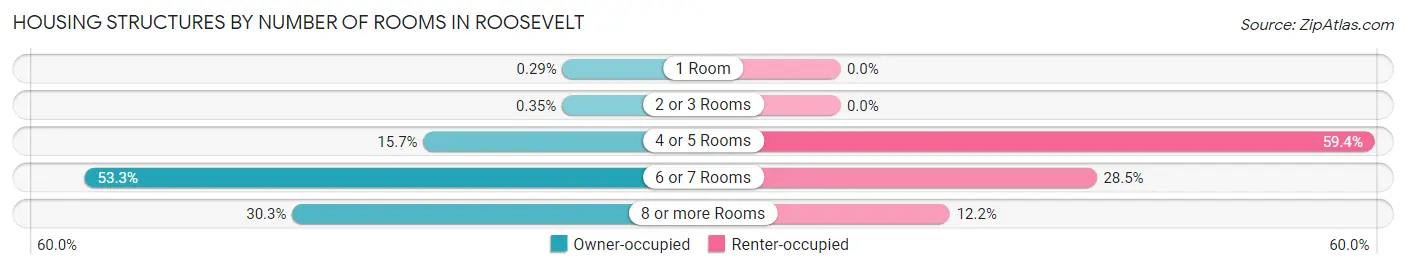
| Number of Rooms | Owner-occupied | Renter-occupied |
| 1 Room | 10 (0.3%) | 0 (0.0%) |
| 2 or 3 Rooms | 12 (0.4%) | 0 (0.0%) |
| 4 or 5 Rooms | 543 (15.7%) | 638 (59.4%) |
| 6 or 7 Rooms | 1,840 (53.3%) | 306 (28.5%) |
| 8 or more Rooms | 1,045 (30.3%) | 131 (12.2%) |
| Total | 3,450 (100.0%) | 1,075 (100.0%) |
Housing Structure by Heating Type in Roosevelt
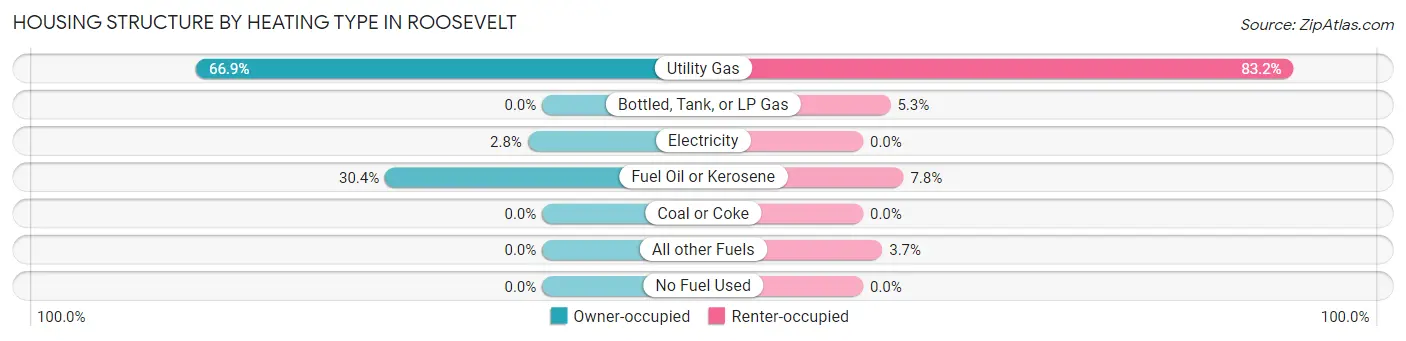
| Heating Type | Owner-occupied | Renter-occupied |
| Utility Gas | 2,307 (66.9%) | 894 (83.2%) |
| Bottled, Tank, or LP Gas | 0 (0.0%) | 57 (5.3%) |
| Electricity | 96 (2.8%) | 0 (0.0%) |
| Fuel Oil or Kerosene | 1,047 (30.3%) | 84 (7.8%) |
| Coal or Coke | 0 (0.0%) | 0 (0.0%) |
| All other Fuels | 0 (0.0%) | 40 (3.7%) |
| No Fuel Used | 0 (0.0%) | 0 (0.0%) |
| Total | 3,450 (100.0%) | 1,075 (100.0%) |
Household Vehicle Usage in Roosevelt
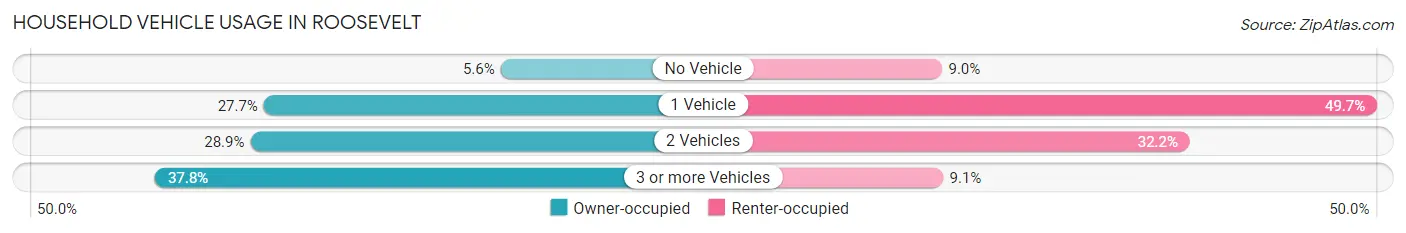
| Vehicles per Household | Owner-occupied | Renter-occupied |
| No Vehicle | 192 (5.6%) | 97 (9.0%) |
| 1 Vehicle | 955 (27.7%) | 534 (49.7%) |
| 2 Vehicles | 998 (28.9%) | 346 (32.2%) |
| 3 or more Vehicles | 1,305 (37.8%) | 98 (9.1%) |
| Total | 3,450 (100.0%) | 1,075 (100.0%) |
Real Estate & Mortgages in Roosevelt
Real Estate and Mortgage Overview in Roosevelt
| Characteristic | Without Mortgage | With Mortgage |
| Housing Units | 699 | 2,751 |
| Median Property Value | $391,700 | $422,000 |
| Median Household Income | $131,547 | $1,117 |
| Monthly Housing Costs | $1,360 | $1,265 |
| Real Estate Taxes | $7,935 | $98 |
Property Value by Mortgage Status in Roosevelt
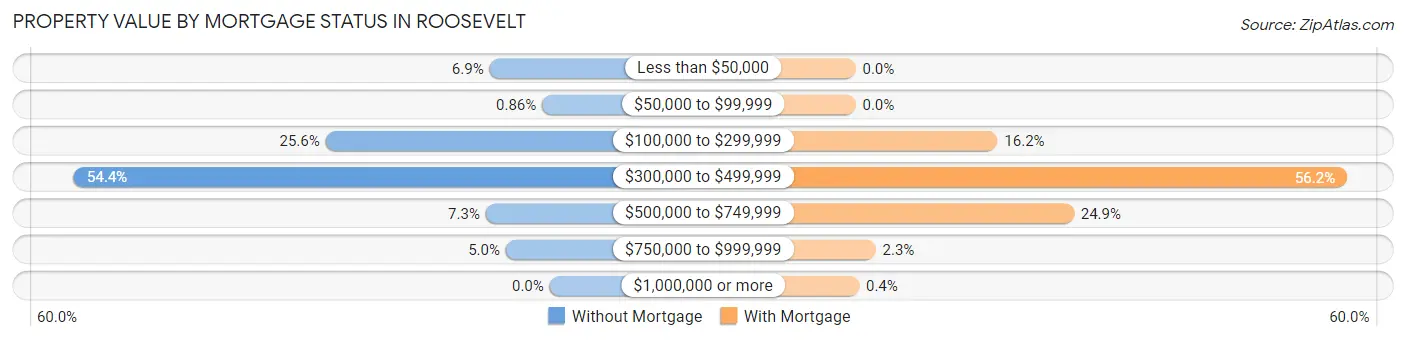
| Property Value | Without Mortgage | With Mortgage |
| Less than $50,000 | 48 (6.9%) | 0 (0.0%) |
| $50,000 to $99,999 | 6 (0.9%) | 0 (0.0%) |
| $100,000 to $299,999 | 179 (25.6%) | 446 (16.2%) |
| $300,000 to $499,999 | 380 (54.4%) | 1,545 (56.2%) |
| $500,000 to $749,999 | 51 (7.3%) | 686 (24.9%) |
| $750,000 to $999,999 | 35 (5.0%) | 63 (2.3%) |
| $1,000,000 or more | 0 (0.0%) | 11 (0.4%) |
| Total | 699 (100.0%) | 2,751 (100.0%) |
Household Income by Mortgage Status in Roosevelt
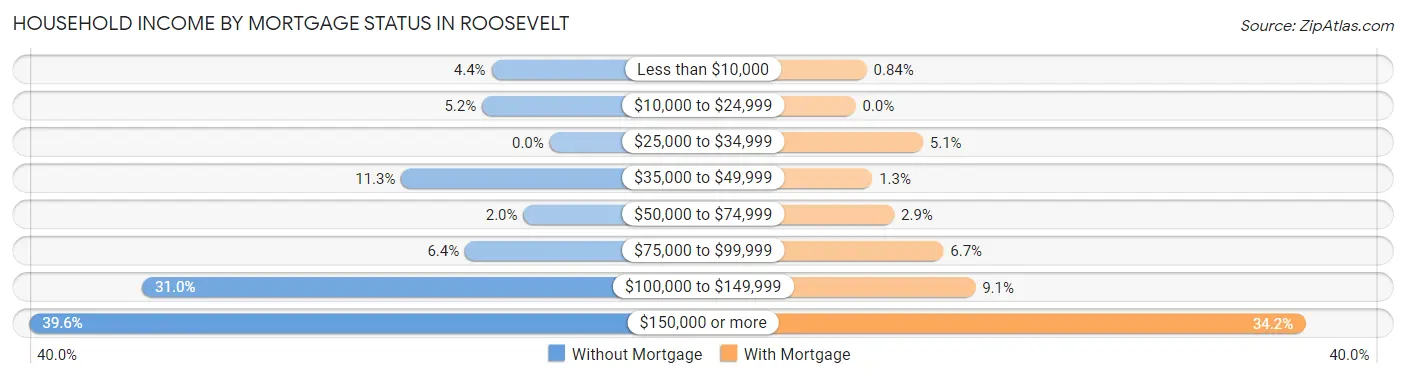
| Household Income | Without Mortgage | With Mortgage |
| Less than $10,000 | 31 (4.4%) | 23 (0.8%) |
| $10,000 to $24,999 | 36 (5.1%) | 0 (0.0%) |
| $25,000 to $34,999 | 0 (0.0%) | 141 (5.1%) |
| $35,000 to $49,999 | 79 (11.3%) | 35 (1.3%) |
| $50,000 to $74,999 | 14 (2.0%) | 81 (2.9%) |
| $75,000 to $99,999 | 45 (6.4%) | 184 (6.7%) |
| $100,000 to $149,999 | 217 (31.0%) | 251 (9.1%) |
| $150,000 or more | 277 (39.6%) | 942 (34.2%) |
| Total | 699 (100.0%) | 2,751 (100.0%) |
Property Value to Household Income Ratio in Roosevelt
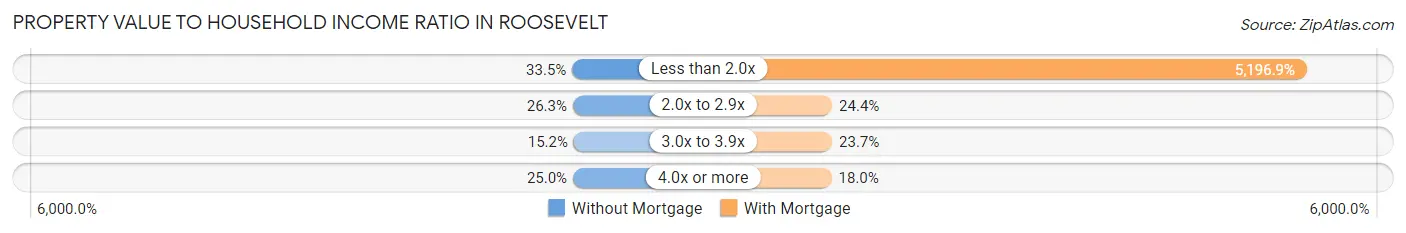
| Value-to-Income Ratio | Without Mortgage | With Mortgage |
| Less than 2.0x | 234 (33.5%) | 142,967 (5,196.9%) |
| 2.0x to 2.9x | 184 (26.3%) | 670 (24.3%) |
| 3.0x to 3.9x | 106 (15.2%) | 652 (23.7%) |
| 4.0x or more | 175 (25.0%) | 494 (18.0%) |
| Total | 699 (100.0%) | 2,751 (100.0%) |
Real Estate Taxes by Mortgage Status in Roosevelt
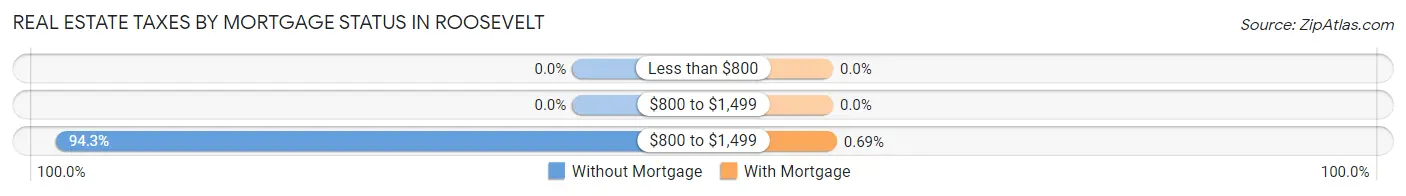
| Property Taxes | Without Mortgage | With Mortgage |
| Less than $800 | 0 (0.0%) | 0 (0.0%) |
| $800 to $1,499 | 0 (0.0%) | 0 (0.0%) |
| $800 to $1,499 | 659 (94.3%) | 19 (0.7%) |
| Total | 699 (100.0%) | 2,751 (100.0%) |
Health & Disability in Roosevelt
Health Insurance Coverage by Age in Roosevelt
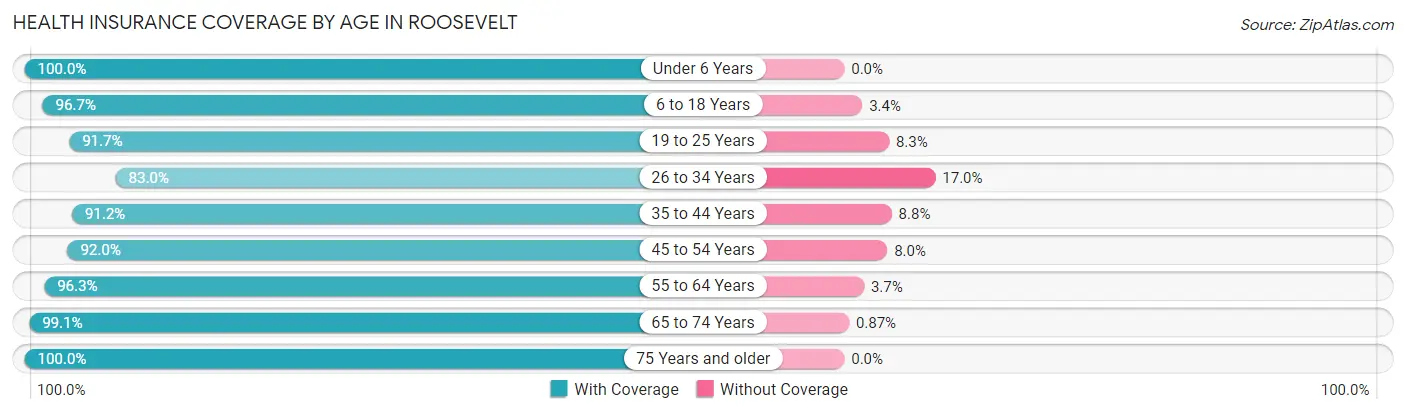
| Age Bracket | With Coverage | Without Coverage |
| Under 6 Years | 1,960 (100.0%) | 0 (0.0%) |
| 6 to 18 Years | 3,058 (96.7%) | 106 (3.4%) |
| 19 to 25 Years | 2,002 (91.7%) | 182 (8.3%) |
| 26 to 34 Years | 2,391 (83.0%) | 489 (17.0%) |
| 35 to 44 Years | 2,539 (91.2%) | 246 (8.8%) |
| 45 to 54 Years | 2,242 (92.0%) | 195 (8.0%) |
| 55 to 64 Years | 1,759 (96.3%) | 67 (3.7%) |
| 65 to 74 Years | 1,252 (99.1%) | 11 (0.9%) |
| 75 Years and older | 734 (100.0%) | 0 (0.0%) |
| Total | 17,937 (93.3%) | 1,296 (6.7%) |
Health Insurance Coverage by Citizenship Status in Roosevelt
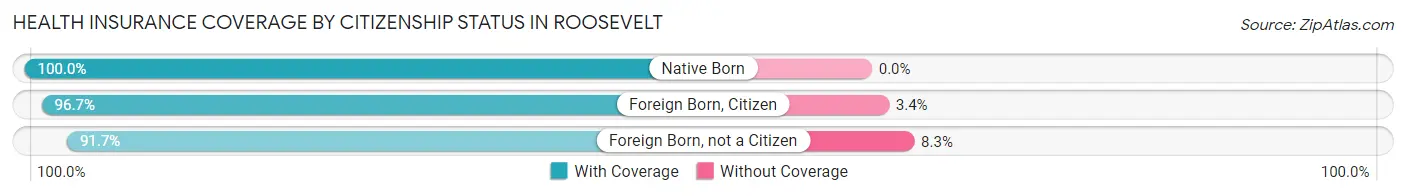
| Citizenship Status | With Coverage | Without Coverage |
| Native Born | 1,960 (100.0%) | 0 (0.0%) |
| Foreign Born, Citizen | 3,058 (96.7%) | 106 (3.4%) |
| Foreign Born, not a Citizen | 2,002 (91.7%) | 182 (8.3%) |
Health Insurance Coverage by Household Income in Roosevelt
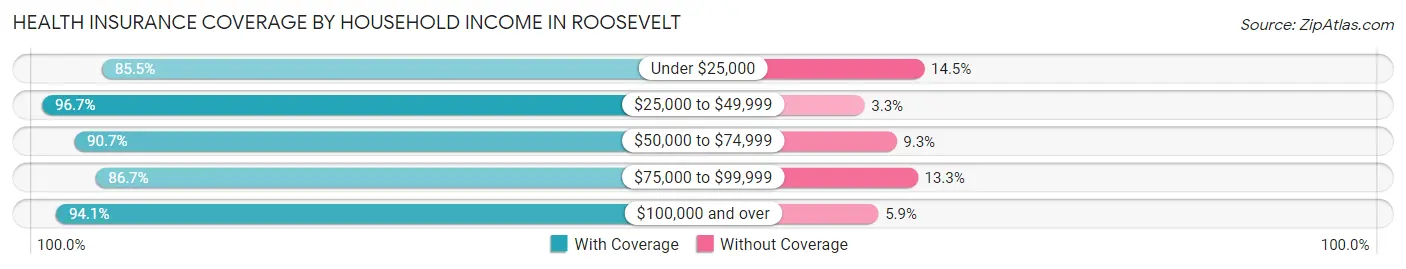
| Household Income | With Coverage | Without Coverage |
| Under $25,000 | 797 (85.5%) | 135 (14.5%) |
| $25,000 to $49,999 | 1,908 (96.7%) | 65 (3.3%) |
| $50,000 to $74,999 | 830 (90.7%) | 85 (9.3%) |
| $75,000 to $99,999 | 1,262 (86.7%) | 193 (13.3%) |
| $100,000 and over | 12,995 (94.1%) | 814 (5.9%) |
Public vs Private Health Insurance Coverage by Age in Roosevelt
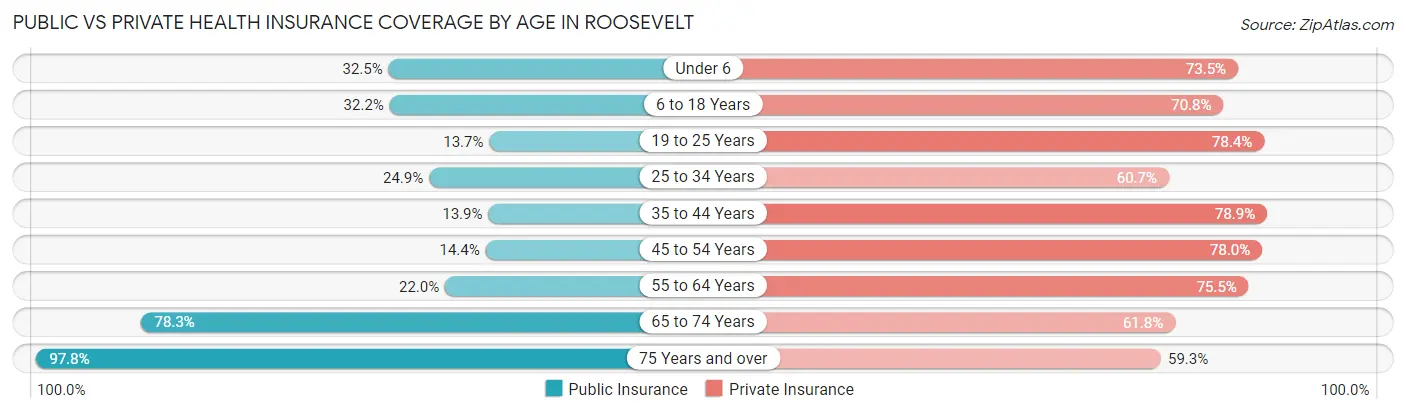
| Age Bracket | Public Insurance | Private Insurance |
| Under 6 | 636 (32.5%) | 1,441 (73.5%) |
| 6 to 18 Years | 1,020 (32.2%) | 2,240 (70.8%) |
| 19 to 25 Years | 300 (13.7%) | 1,712 (78.4%) |
| 25 to 34 Years | 718 (24.9%) | 1,748 (60.7%) |
| 35 to 44 Years | 388 (13.9%) | 2,198 (78.9%) |
| 45 to 54 Years | 352 (14.4%) | 1,901 (78.0%) |
| 55 to 64 Years | 401 (22.0%) | 1,379 (75.5%) |
| 65 to 74 Years | 989 (78.3%) | 781 (61.8%) |
| 75 Years and over | 718 (97.8%) | 435 (59.3%) |
| Total | 5,522 (28.7%) | 13,835 (71.9%) |
Disability Status by Sex by Age in Roosevelt
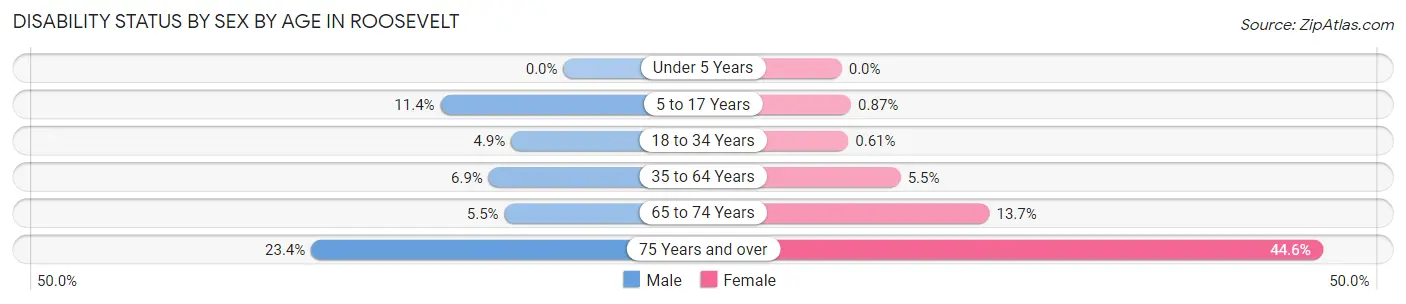
| Age Bracket | Male | Female |
| Under 5 Years | 0 (0.0%) | 0 (0.0%) |
| 5 to 17 Years | 183 (11.4%) | 13 (0.9%) |
| 18 to 34 Years | 133 (4.9%) | 16 (0.6%) |
| 35 to 64 Years | 239 (6.9%) | 197 (5.5%) |
| 65 to 74 Years | 26 (5.5%) | 108 (13.7%) |
| 75 Years and over | 59 (23.4%) | 215 (44.6%) |
Disability Class by Sex by Age in Roosevelt
Disability Class: Hearing Difficulty
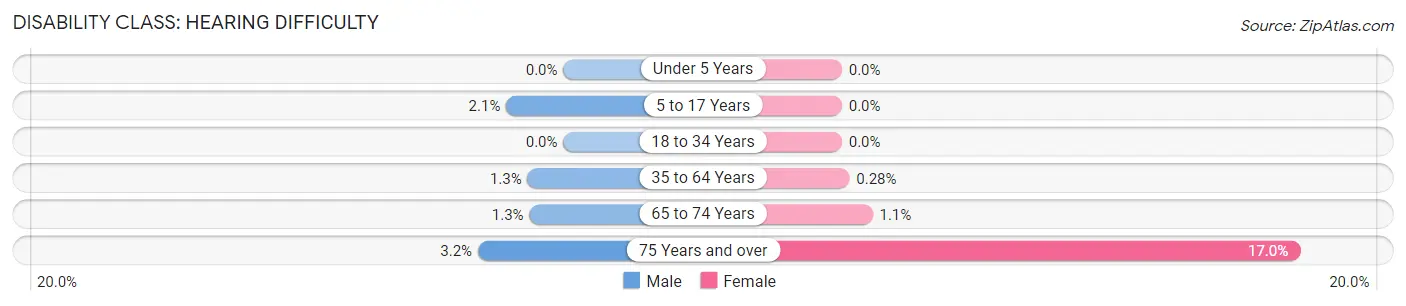
| Age Bracket | Male | Female |
| Under 5 Years | 0 (0.0%) | 0 (0.0%) |
| 5 to 17 Years | 34 (2.1%) | 0 (0.0%) |
| 18 to 34 Years | 0 (0.0%) | 0 (0.0%) |
| 35 to 64 Years | 46 (1.3%) | 10 (0.3%) |
| 65 to 74 Years | 6 (1.3%) | 9 (1.1%) |
| 75 Years and over | 8 (3.2%) | 82 (17.0%) |
Disability Class: Vision Difficulty
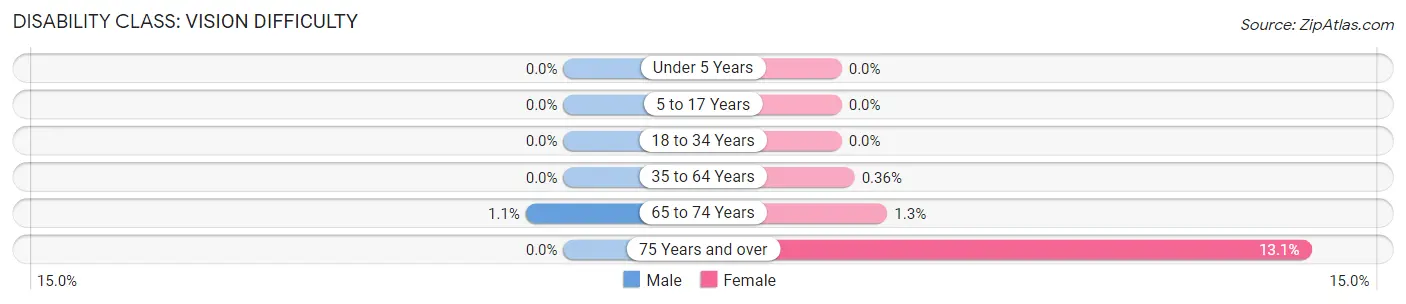
| Age Bracket | Male | Female |
| Under 5 Years | 0 (0.0%) | 0 (0.0%) |
| 5 to 17 Years | 0 (0.0%) | 0 (0.0%) |
| 18 to 34 Years | 0 (0.0%) | 0 (0.0%) |
| 35 to 64 Years | 0 (0.0%) | 13 (0.4%) |
| 65 to 74 Years | 5 (1.1%) | 10 (1.3%) |
| 75 Years and over | 0 (0.0%) | 63 (13.1%) |
Disability Class: Cognitive Difficulty
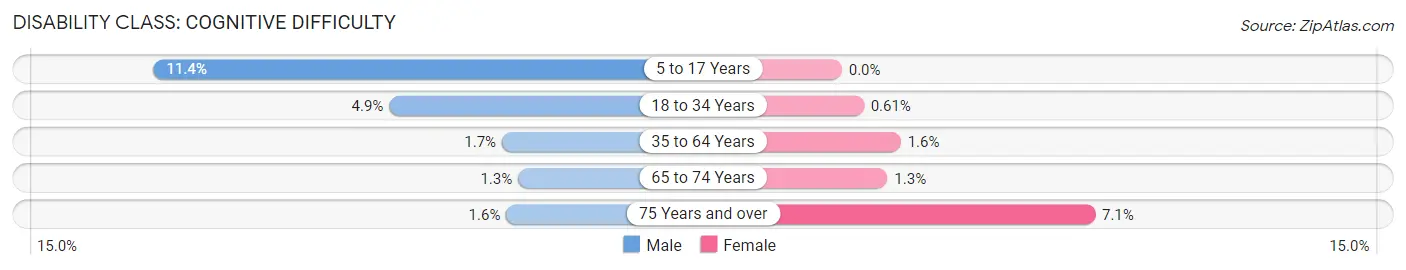
| Age Bracket | Male | Female |
| 5 to 17 Years | 183 (11.4%) | 0 (0.0%) |
| 18 to 34 Years | 133 (4.9%) | 16 (0.6%) |
| 35 to 64 Years | 59 (1.7%) | 59 (1.6%) |
| 65 to 74 Years | 6 (1.3%) | 10 (1.3%) |
| 75 Years and over | 4 (1.6%) | 34 (7.0%) |
Disability Class: Ambulatory Difficulty
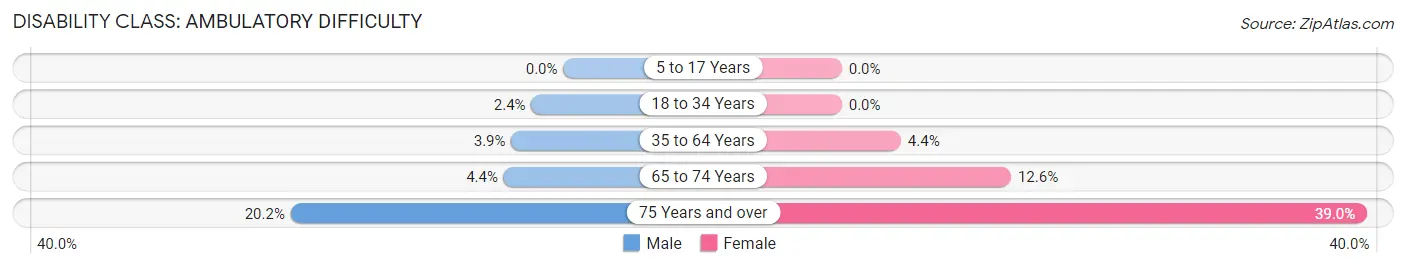
| Age Bracket | Male | Female |
| 5 to 17 Years | 0 (0.0%) | 0 (0.0%) |
| 18 to 34 Years | 65 (2.4%) | 0 (0.0%) |
| 35 to 64 Years | 133 (3.9%) | 158 (4.4%) |
| 65 to 74 Years | 21 (4.4%) | 99 (12.6%) |
| 75 Years and over | 51 (20.2%) | 188 (39.0%) |
Disability Class: Self-Care Difficulty
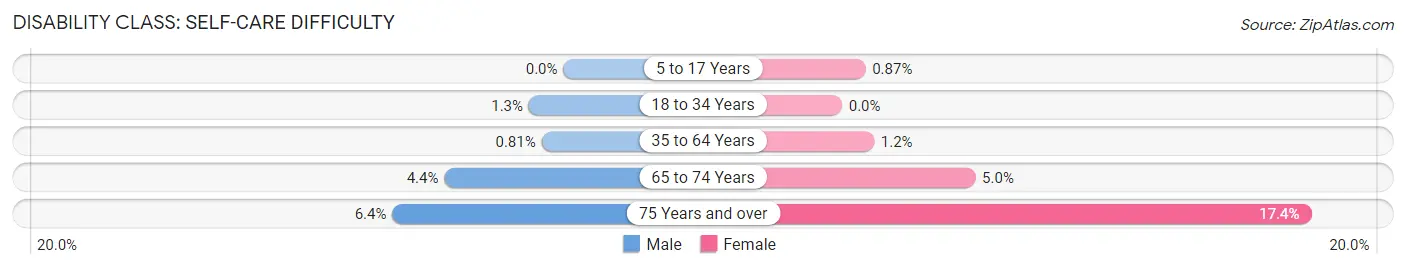
| Age Bracket | Male | Female |
| 5 to 17 Years | 0 (0.0%) | 13 (0.9%) |
| 18 to 34 Years | 35 (1.3%) | 0 (0.0%) |
| 35 to 64 Years | 28 (0.8%) | 43 (1.2%) |
| 65 to 74 Years | 21 (4.4%) | 39 (5.0%) |
| 75 Years and over | 16 (6.4%) | 84 (17.4%) |
Technology Access in Roosevelt
Computing Device Access in Roosevelt
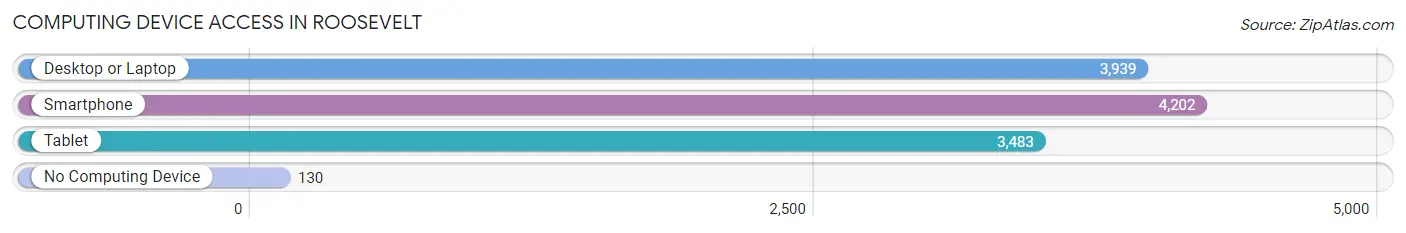
| Device Type | # Households | % Households |
| Desktop or Laptop | 3,939 | 87.1% |
| Smartphone | 4,202 | 92.9% |
| Tablet | 3,483 | 77.0% |
| No Computing Device | 130 | 2.9% |
| Total | 4,525 | 100.0% |
Internet Access in Roosevelt
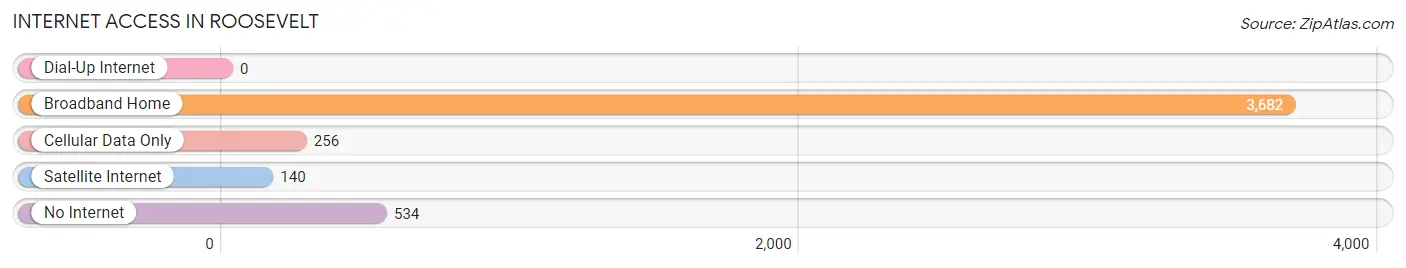
| Internet Type | # Households | % Households |
| Dial-Up Internet | 0 | 0.0% |
| Broadband Home | 3,682 | 81.4% |
| Cellular Data Only | 256 | 5.7% |
| Satellite Internet | 140 | 3.1% |
| No Internet | 534 | 11.8% |
| Total | 4,525 | 100.0% |
Roosevelt Summary
Roosevelt, NY is a hamlet located in the Town of Hempstead in Nassau County, New York. It is located on the south shore of Long Island, approximately 25 miles east of Manhattan. The hamlet is named after former President Theodore Roosevelt, who was born in nearby Oyster Bay.
History
The area that is now Roosevelt was originally inhabited by the Meroke Indians, who were part of the Algonquin tribe. The first European settlers arrived in the area in the 1650s, and the hamlet was officially established in 1875. The hamlet was originally known as “Rooseveltville”, and was named after President Theodore Roosevelt, who was born in nearby Oyster Bay.
In the early 1900s, the hamlet began to grow rapidly, and by the 1920s it had become a popular summer resort destination. The hamlet was home to several large hotels, including the Roosevelt Hotel, which was built in 1921 and was the largest hotel on Long Island at the time.
In the 1950s, the hamlet began to experience a decline in population as many of its residents moved to nearby suburbs. However, the hamlet has experienced a resurgence in recent years, and is now home to a diverse population of residents.
Geography
Roosevelt is located on the south shore of Long Island, approximately 25 miles east of Manhattan. The hamlet is bordered by the hamlets of Freeport to the west, Merrick to the east, and Bellmore to the south. The hamlet is located on the Hempstead Plains, which is a flat, low-lying area of land that is part of the Atlantic Coastal Plain.
The hamlet is home to several parks, including the Roosevelt Nature Preserve, which is a protected area of wetlands and woodlands. The hamlet is also home to several beaches, including the Roosevelt Beach, which is a popular spot for swimming and sunbathing.
Economy
The economy of Roosevelt is largely based on retail and services. The hamlet is home to several shopping centers, including the Roosevelt Mall, which is home to a variety of stores and restaurants. The hamlet is also home to several industrial parks, which are home to a variety of businesses, including manufacturing and distribution companies.
The hamlet is also home to several educational institutions, including the Roosevelt School District, which serves the hamlet and the surrounding area. The district is home to several elementary, middle, and high schools, as well as a number of private schools.
Demographics
As of the 2010 census, the population of Roosevelt was 16,258. The population is largely African American, with a significant Hispanic population. The median household income is $60,945, and the median home value is $346,000. The hamlet is home to a variety of religious institutions, including churches, synagogues, and mosques.
Conclusion
Roosevelt, NY is a hamlet located in the Town of Hempstead in Nassau County, New York. It is located on the south shore of Long Island, approximately 25 miles east of Manhattan. The hamlet is named after former President Theodore Roosevelt, who was born in nearby Oyster Bay. The hamlet has a diverse population and a largely service-based economy. It is home to several parks, beaches, and educational institutions, as well as a variety of retail and industrial businesses.
Common Questions
What is the Total Population of Roosevelt?
Total Population of Roosevelt is 19,233.
What is the Total Male Population of Roosevelt?
Total Male Population of Roosevelt is 9,430.
What is the Total Female Population of Roosevelt?
Total Female Population of Roosevelt is 9,803.
What is the Ratio of Males per 100 Females in Roosevelt?
There are 96.20 Males per 100 Females in Roosevelt.
What is the Ratio of Females per 100 Males in Roosevelt?
There are 103.96 Females per 100 Males in Roosevelt.
What is the Median Population Age in Roosevelt?
Median Population Age in Roosevelt is 32.7 Years.
What is the Average Family Size in Roosevelt
Average Family Size in Roosevelt is 4.3 People.
What is the Average Household Size in Roosevelt
Average Household Size in Roosevelt is 4.2 People.
What is Per Capita Income in Roosevelt?
Per Capita income in Roosevelt is $35,132.
What is the Median Family Income in Roosevelt?
Median Family Income in Roosevelt is $118,162.
What is the Median Household income in Roosevelt?
Median Household Income in Roosevelt is $128,058.
What is Income or Wage Gap in Roosevelt?
Income or Wage Gap in Roosevelt is 6.5%.
Women in Roosevelt earn 93.5 cents for every dollar earned by a man.
What is Family Income Deficit in Roosevelt?
Family Income Deficit in Roosevelt is $8,112.
Families that are below poverty line in Roosevelt earn $8,112 less on average than the poverty threshold level.
What is Inequality or Gini Index in Roosevelt?
Inequality or Gini Index in Roosevelt is 0.38.
How Large is the Labor Force in Roosevelt?
There are 10,775 People in the Labor Forcein in Roosevelt.
What is the Percentage of People in the Labor Force in Roosevelt?
72.6% of People are in the Labor Force in Roosevelt.
What is the Unemployment Rate in Roosevelt?
Unemployment Rate in Roosevelt is 4.6%.