Cities with the Highest Percentage of Immigrants from Malaysia in New York
RELATED REPORTS & OPTIONS
Malaysia
New York
Compare Cities
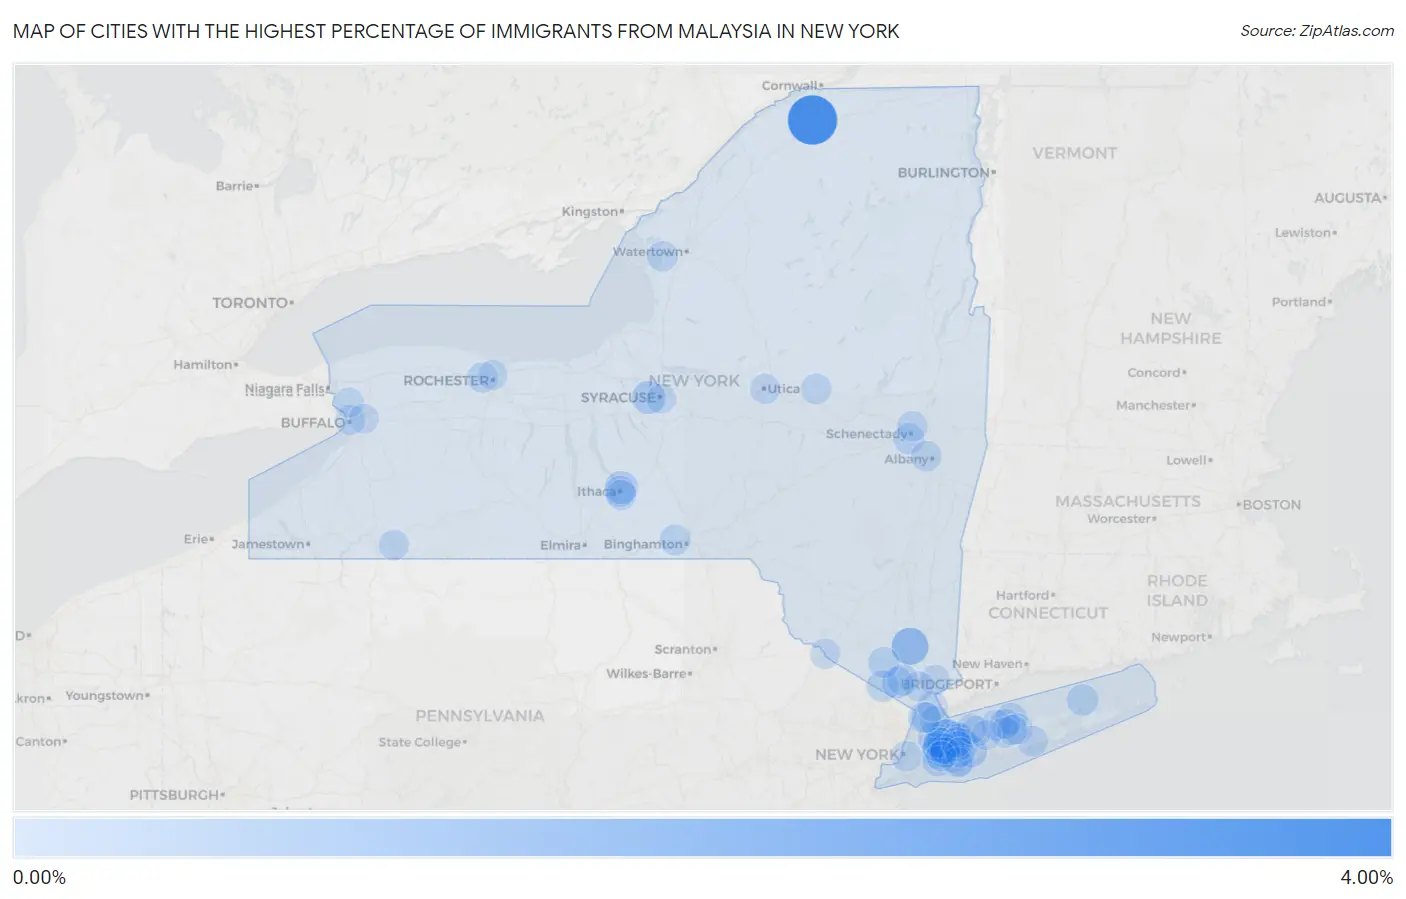
Map of Cities with the Highest Percentage of Immigrants from Malaysia in New York
0.00%
4.00%
Cities with the Highest Percentage of Immigrants from Malaysia in New York
| City | Malaysia | vs State | vs National | |
| 1. | Winthrop | 3.40% | 0.060%(+3.34)#-1 | 0.025%(+3.38)#0 |
| 2. | Greenvale | 1.46% | 0.060%(+1.40)#0 | 0.025%(+1.44)#1 |
| 3. | Nelsonville | 1.19% | 0.060%(+1.13)#1 | 0.025%(+1.16)#2 |
| 4. | Albertson | 0.73% | 0.060%(+0.666)#2 | 0.025%(+0.701)#3 |
| 5. | Clifton Gardens | 0.72% | 0.060%(+0.663)#3 | 0.025%(+0.698)#4 |
| 6. | North New Hyde Park | 0.68% | 0.060%(+0.623)#4 | 0.025%(+0.658)#5 |
| 7. | Fairmount | 0.58% | 0.060%(+0.521)#5 | 0.025%(+0.556)#6 |
| 8. | Cayuga Heights | 0.47% | 0.060%(+0.410)#6 | 0.025%(+0.445)#7 |
| 9. | Floral Park | 0.42% | 0.060%(+0.355)#7 | 0.025%(+0.390)#8 |
| 10. | East Farmingdale | 0.35% | 0.060%(+0.288)#8 | 0.025%(+0.323)#9 |
| 11. | Port Jefferson | 0.29% | 0.060%(+0.228)#9 | 0.025%(+0.263)#10 |
| 12. | Sloatsburg | 0.26% | 0.060%(+0.203)#10 | 0.025%(+0.238)#11 |
| 13. | Southold | 0.25% | 0.060%(+0.191)#11 | 0.025%(+0.226)#12 |
| 14. | Kings Point | 0.25% | 0.060%(+0.190)#12 | 0.025%(+0.225)#13 |
| 15. | Pomona | 0.23% | 0.060%(+0.175)#13 | 0.025%(+0.210)#14 |
| 16. | Tuckahoe | 0.23% | 0.060%(+0.169)#14 | 0.025%(+0.204)#15 |
| 17. | Muttontown | 0.23% | 0.060%(+0.169)#15 | 0.025%(+0.204)#16 |
| 18. | Thiells | 0.22% | 0.060%(+0.163)#16 | 0.025%(+0.198)#17 |
| 19. | Rotterdam | 0.21% | 0.060%(+0.152)#17 | 0.025%(+0.187)#18 |
| 20. | Monroe | 0.20% | 0.060%(+0.142)#18 | 0.025%(+0.177)#19 |
| 21. | Latham | 0.17% | 0.060%(+0.109)#19 | 0.025%(+0.143)#20 |
| 22. | Garden City Park | 0.17% | 0.060%(+0.107)#20 | 0.025%(+0.142)#21 |
| 23. | Herricks | 0.17% | 0.060%(+0.106)#21 | 0.025%(+0.141)#22 |
| 24. | North Gates | 0.16% | 0.060%(+0.098)#22 | 0.025%(+0.133)#23 |
| 25. | Endwell | 0.15% | 0.060%(+0.092)#23 | 0.025%(+0.127)#716 |
| 26. | Syosset | 0.14% | 0.060%(+0.084)#24 | 0.025%(+0.119)#717 |
| 27. | Dolgeville | 0.14% | 0.060%(+0.078)#25 | 0.025%(+0.113)#718 |
| 28. | Coram | 0.14% | 0.060%(+0.075)#26 | 0.025%(+0.110)#719 |
| 29. | Nissequogue | 0.13% | 0.060%(+0.071)#27 | 0.025%(+0.106)#720 |
| 30. | Ithaca | 0.13% | 0.060%(+0.071)#28 | 0.025%(+0.106)#721 |
| 31. | Sackets Harbor | 0.13% | 0.060%(+0.071)#29 | 0.025%(+0.106)#722 |
| 32. | Mamaroneck | 0.13% | 0.060%(+0.071)#30 | 0.025%(+0.106)#723 |
| 33. | Shirley | 0.13% | 0.060%(+0.068)#31 | 0.025%(+0.103)#724 |
| 34. | New York | 0.11% | 0.060%(+0.055)#39 | 0.025%(+0.090)#1,541 |
| 35. | Albany | 0.11% | 0.060%(+0.047)#40 | 0.025%(+0.082)#1,542 |
| 36. | Allegany | 0.11% | 0.060%(+0.047)#41 | 0.025%(+0.082)#1,543 |
| 37. | Lake Success | 0.11% | 0.060%(+0.046)#42 | 0.025%(+0.081)#1,544 |
| 38. | Greenville Cdp Westchester County | 0.094% | 0.060%(+0.034)#43 | 0.025%(+0.069)#1,545 |
| 39. | South Hill | 0.091% | 0.060%(+0.031)#44 | 0.025%(+0.066)#1,546 |
| 40. | Valley Stream | 0.089% | 0.060%(+0.030)#45 | 0.025%(+0.064)#1,547 |
| 41. | East Glenville | 0.087% | 0.060%(+0.027)#46 | 0.025%(+0.062)#1,548 |
| 42. | Rochester Institute Of Technology | 0.085% | 0.060%(+0.025)#47 | 0.025%(+0.060)#1,549 |
| 43. | North Merrick | 0.074% | 0.060%(+0.014)#48 | 0.025%(+0.049)#1,550 |
| 44. | Wantagh | 0.072% | 0.060%(+0.012)#49 | 0.025%(+0.047)#1,551 |
| 45. | Mineola | 0.067% | 0.060%(+0.007)#50 | 0.025%(+0.042)#1,552 |
| 46. | Greenlawn | 0.066% | 0.060%(+0.006)#51 | 0.025%(+0.041)#1,553 |
| 47. | Manhasset | 0.065% | 0.060%(+0.005)#52 | 0.025%(+0.040)#1,554 |
| 48. | Lake Grove | 0.063% | 0.060%(+0.003)#53 | 0.025%(+0.038)#1,555 |
| 49. | Utica | 0.059% | 0.060%(-0.001)#54 | 0.025%(+0.034)#1,556 |
| 50. | Stony Brook University | 0.057% | 0.060%(-0.003)#55 | 0.025%(+0.032)#1,557 |
| 51. | Mount Kisco | 0.055% | 0.060%(-0.004)#56 | 0.025%(+0.030)#1,558 |
| 52. | Selden | 0.055% | 0.060%(-0.005)#57 | 0.025%(+0.030)#1,559 |
| 53. | Buffalo | 0.053% | 0.060%(-0.007)#58 | 0.025%(+0.028)#1,560 |
| 54. | Plainview | 0.049% | 0.060%(-0.011)#59 | 0.025%(+0.024)#1,561 |
| 55. | Port Jervis | 0.046% | 0.060%(-0.014)#60 | 0.025%(+0.021)#1,562 |
| 56. | White Plains | 0.044% | 0.060%(-0.016)#61 | 0.025%(+0.019)#1,563 |
| 57. | Hicksville | 0.043% | 0.060%(-0.017)#62 | 0.025%(+0.018)#1,564 |
| 58. | Loudonville | 0.041% | 0.060%(-0.019)#63 | 0.025%(+0.016)#1,565 |
| 59. | Ossining | 0.041% | 0.060%(-0.019)#64 | 0.025%(+0.016)#1,566 |
| 60. | Jericho | 0.035% | 0.060%(-0.025)#65 | 0.025%(+0.010)#1,567 |
| 61. | Tonawanda | 0.028% | 0.060%(-0.032)#66 | 0.025%(+0.003)#1,568 |
| 62. | Rochester | 0.027% | 0.060%(-0.032)#67 | 0.025%(+0.003)#1,569 |
| 63. | Bellmore | 0.025% | 0.060%(-0.035)#68 | 0.025%(+0.000)#1,570 |
| 64. | Eastchester | 0.024% | 0.060%(-0.036)#69 | 0.025%(-0.001)#1,571 |
| 65. | Garden City | 0.022% | 0.060%(-0.038)#70 | 0.025%(-0.003)#1,572 |
| 66. | Huntington | 0.020% | 0.060%(-0.039)#71 | 0.025%(-0.005)#1,573 |
| 67. | Cheektowaga | 0.020% | 0.060%(-0.040)#72 | 0.025%(-0.005)#1,574 |
| 68. | Commack | 0.014% | 0.060%(-0.046)#73 | 0.025%(-0.011)#1,575 |
| 69. | Syracuse | 0.013% | 0.060%(-0.047)#74 | 0.025%(-0.012)#1,576 |
| 70. | Levittown | 0.012% | 0.060%(-0.048)#75 | 0.025%(-0.013)#1,577 |
| 71. | Franklin Square | 0.0063% | 0.060%(-0.054)#76 | 0.025%(-0.019)#1,578 |
Common Questions
What are the Top 10 Cities with the Highest Percentage of Immigrants from Malaysia in New York?
Top 10 Cities with the Highest Percentage of Immigrants from Malaysia in New York are:
#1
3.40%
#2
1.46%
#3
1.19%
#4
0.73%
#5
0.68%
#6
0.58%
#7
0.47%
#8
0.42%
#9
0.35%
#10
0.29%
What city has the Highest Percentage of Immigrants from Malaysia in New York?
Winthrop has the Highest Percentage of Immigrants from Malaysia in New York with 3.40%.
What is the Percentage of Immigrants from Malaysia in the State of New York?
Percentage of Immigrants from Malaysia in New York is 0.060%.
What is the Percentage of Immigrants from Malaysia in the United States?
Percentage of Immigrants from Malaysia in the United States is 0.025%.