Mount Vernon, NY
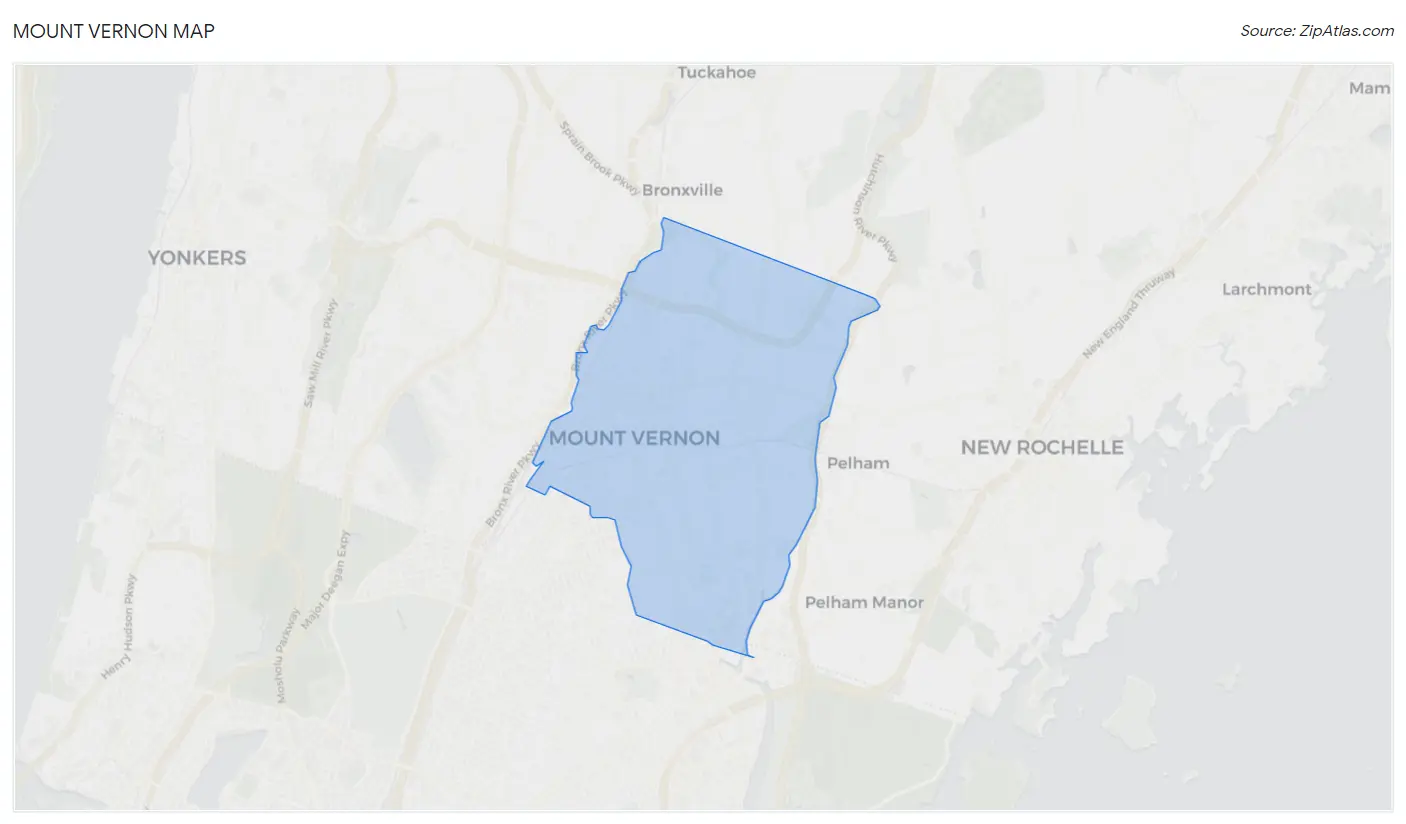
Mount Vernon Map
Mount Vernon Overview
72,817
TOTAL POPULATION
32,451
MALE POPULATION
40,366
FEMALE POPULATION
80.39
MALES / 100 FEMALES
124.39
FEMALES / 100 MALES
41.4
MEDIAN AGE
3.3
AVG FAMILY SIZE
2.5
AVG HOUSEHOLD SIZE
$40,288
PER CAPITA INCOME
$99,636
AVG FAMILY INCOME
$75,511
AVG HOUSEHOLD INCOME
12.3%
WAGE / INCOME GAP [ % ]
87.7¢/ $1
WAGE / INCOME GAP [ $ ]
$11,378
FAMILY INCOME DEFICIT
0.48
INEQUALITY / GINI INDEX
39,738
LABOR FORCE [ PEOPLE ]
65.9%
PERCENT IN LABOR FORCE
8.0%
UNEMPLOYMENT RATE
Mount Vernon Area Codes
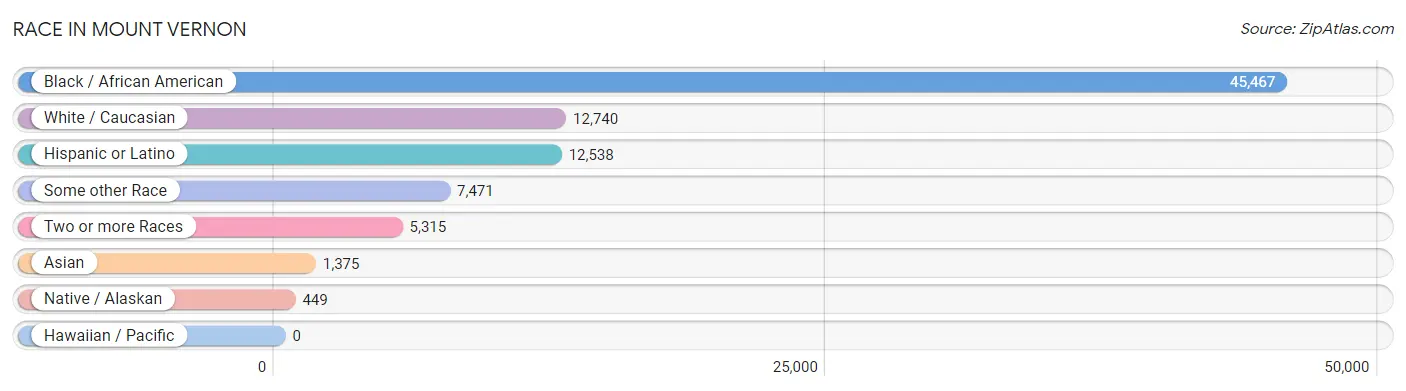
Race in Mount Vernon
The most populous races in Mount Vernon are Black / African American (45,467 | 62.4%), White / Caucasian (12,740 | 17.5%), and Hispanic or Latino (12,538 | 17.2%).
| Race | # Population | % Population |
| Asian | 1,375 | 1.9% |
| Black / African American | 45,467 | 62.4% |
| Hawaiian / Pacific | 0 | 0.0% |
| Hispanic or Latino | 12,538 | 17.2% |
| Native / Alaskan | 449 | 0.6% |
| White / Caucasian | 12,740 | 17.5% |
| Two or more Races | 5,315 | 7.3% |
| Some other Race | 7,471 | 10.3% |
| Total | 72,817 | 100.0% |
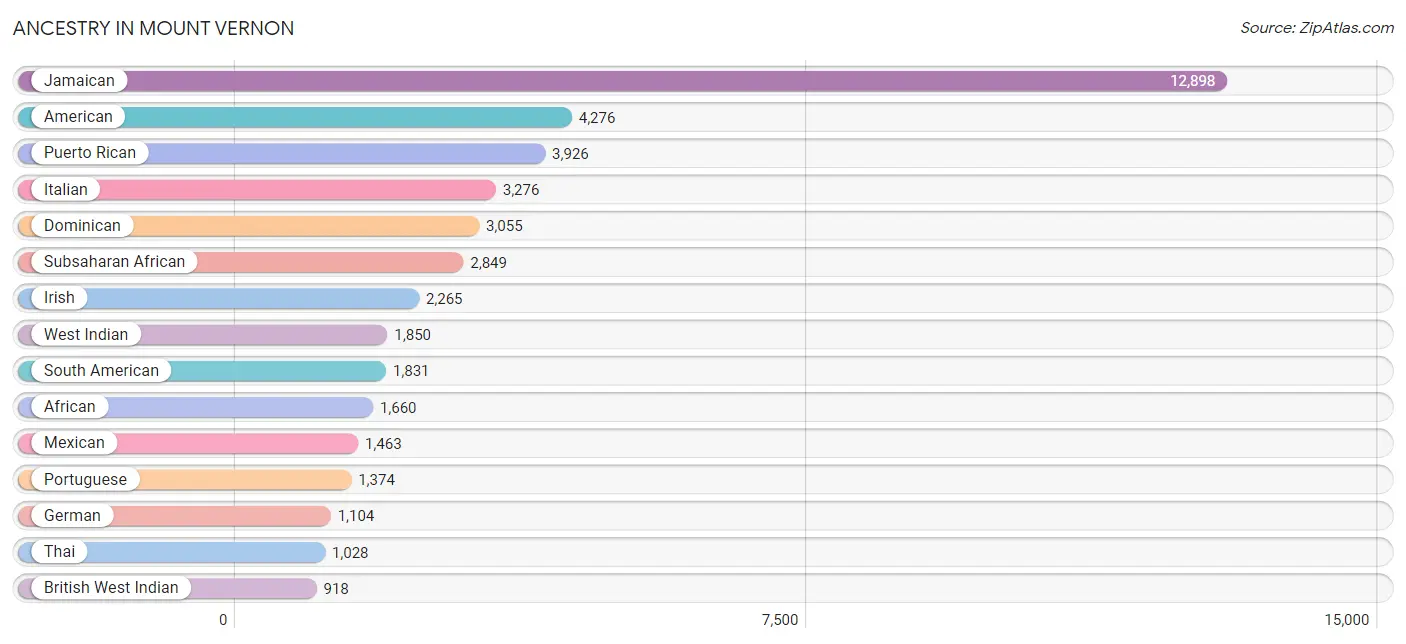
Ancestry in Mount Vernon
The most populous ancestries reported in Mount Vernon are Jamaican (12,898 | 17.7%), American (4,276 | 5.9%), Puerto Rican (3,926 | 5.4%), Italian (3,276 | 4.5%), and Dominican (3,055 | 4.2%), together accounting for 37.7% of all Mount Vernon residents.
| Ancestry | # Population | % Population |
| Afghan | 16 | 0.0% |
| African | 1,660 | 2.3% |
| Albanian | 104 | 0.1% |
| American | 4,276 | 5.9% |
| Arab | 464 | 0.6% |
| Argentinean | 7 | 0.0% |
| Armenian | 8 | 0.0% |
| Austrian | 50 | 0.1% |
| Bahamian | 17 | 0.0% |
| Barbadian | 296 | 0.4% |
| Belizean | 29 | 0.0% |
| Bhutanese | 1 | 0.0% |
| Blackfeet | 44 | 0.1% |
| Bolivian | 31 | 0.0% |
| Brazilian | 755 | 1.0% |
| British | 212 | 0.3% |
| British West Indian | 918 | 1.3% |
| Burmese | 79 | 0.1% |
| Canadian | 11 | 0.0% |
| Cape Verdean | 45 | 0.1% |
| Central American | 852 | 1.2% |
| Central American Indian | 327 | 0.4% |
| Cherokee | 62 | 0.1% |
| Chippewa | 14 | 0.0% |
| Colombian | 722 | 1.0% |
| Costa Rican | 28 | 0.0% |
| Cuban | 155 | 0.2% |
| Czech | 57 | 0.1% |
| Danish | 15 | 0.0% |
| Dominican | 3,055 | 4.2% |
| Dutch | 81 | 0.1% |
| Eastern European | 54 | 0.1% |
| Ecuadorian | 830 | 1.1% |
| English | 492 | 0.7% |
| Estonian | 6 | 0.0% |
| Ethiopian | 58 | 0.1% |
| European | 184 | 0.3% |
| Filipino | 30 | 0.0% |
| Finnish | 25 | 0.0% |
| French | 317 | 0.4% |
| French Canadian | 65 | 0.1% |
| German | 1,104 | 1.5% |
| Ghanaian | 534 | 0.7% |
| Greek | 160 | 0.2% |
| Guatemalan | 91 | 0.1% |
| Guyanese | 585 | 0.8% |
| Haitian | 741 | 1.0% |
| Honduran | 290 | 0.4% |
| Hungarian | 65 | 0.1% |
| Indian (Asian) | 227 | 0.3% |
| Inupiat | 78 | 0.1% |
| Iranian | 69 | 0.1% |
| Irish | 2,265 | 3.1% |
| Iroquois | 135 | 0.2% |
| Israeli | 43 | 0.1% |
| Italian | 3,276 | 4.5% |
| Jamaican | 12,898 | 17.7% |
| Korean | 325 | 0.4% |
| Laotian | 13 | 0.0% |
| Lebanese | 7 | 0.0% |
| Lithuanian | 21 | 0.0% |
| Maltese | 21 | 0.0% |
| Mexican | 1,463 | 2.0% |
| Mexican American Indian | 18 | 0.0% |
| Moroccan | 12 | 0.0% |
| Native Hawaiian | 24 | 0.0% |
| Nicaraguan | 42 | 0.1% |
| Nigerian | 215 | 0.3% |
| Northern European | 37 | 0.1% |
| Norwegian | 78 | 0.1% |
| Pakistani | 172 | 0.2% |
| Panamanian | 334 | 0.5% |
| Peruvian | 176 | 0.2% |
| Polish | 297 | 0.4% |
| Portuguese | 1,374 | 1.9% |
| Puerto Rican | 3,926 | 5.4% |
| Romanian | 17 | 0.0% |
| Russian | 198 | 0.3% |
| Salvadoran | 67 | 0.1% |
| Scotch-Irish | 50 | 0.1% |
| Scottish | 171 | 0.2% |
| Seminole | 12 | 0.0% |
| Sierra Leonean | 163 | 0.2% |
| Slovak | 58 | 0.1% |
| Slovene | 24 | 0.0% |
| South American | 1,831 | 2.5% |
| Spaniard | 110 | 0.2% |
| Spanish | 89 | 0.1% |
| Sri Lankan | 74 | 0.1% |
| Subsaharan African | 2,849 | 3.9% |
| Swedish | 24 | 0.0% |
| Swiss | 50 | 0.1% |
| Thai | 1,028 | 1.4% |
| Trinidadian and Tobagonian | 607 | 0.8% |
| Turkish | 35 | 0.1% |
| U.S. Virgin Islander | 41 | 0.1% |
| Ukrainian | 102 | 0.1% |
| Venezuelan | 65 | 0.1% |
| Welsh | 52 | 0.1% |
| West Indian | 1,850 | 2.5% | View All 100 Rows |
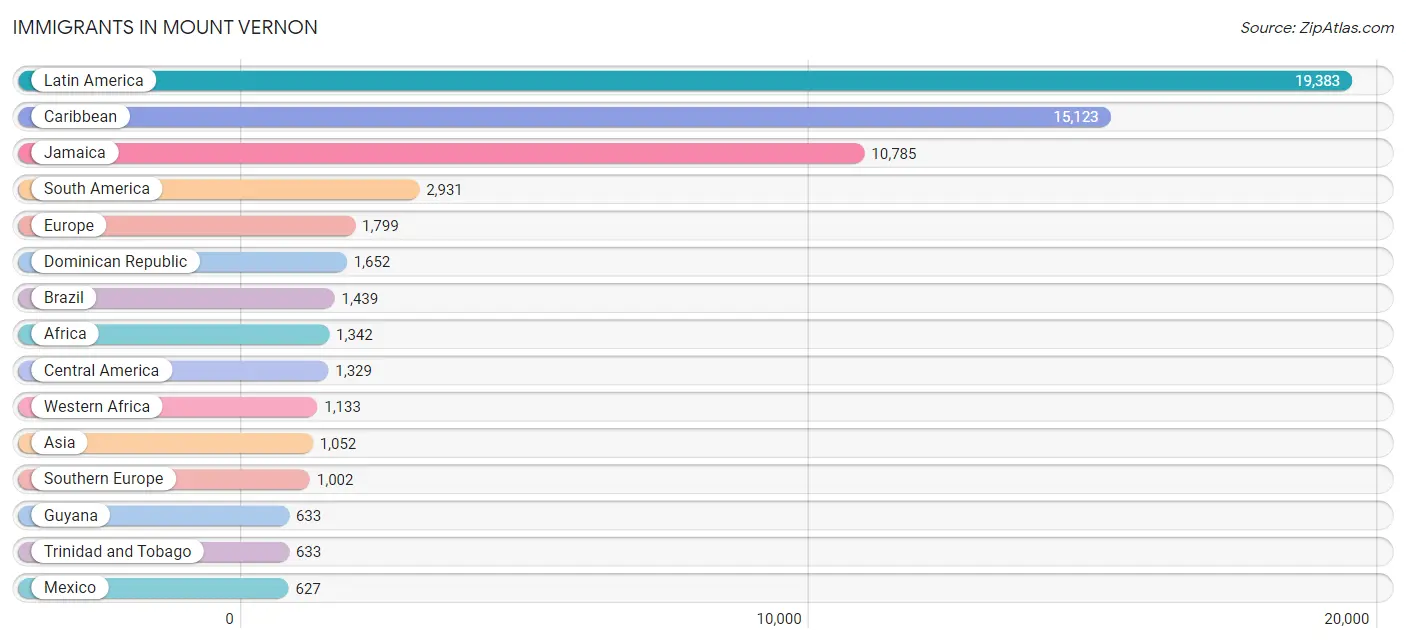
Immigrants in Mount Vernon
The most numerous immigrant groups reported in Mount Vernon came from Latin America (19,383 | 26.6%), Caribbean (15,123 | 20.8%), Jamaica (10,785 | 14.8%), South America (2,931 | 4.0%), and Europe (1,799 | 2.5%), together accounting for 68.7% of all Mount Vernon residents.
| Immigration Origin | # Population | % Population |
| Afghanistan | 16 | 0.0% |
| Africa | 1,342 | 1.8% |
| Albania | 104 | 0.1% |
| Argentina | 7 | 0.0% |
| Asia | 1,052 | 1.4% |
| Austria | 11 | 0.0% |
| Barbados | 233 | 0.3% |
| Belize | 34 | 0.1% |
| Bolivia | 31 | 0.0% |
| Brazil | 1,439 | 2.0% |
| Canada | 79 | 0.1% |
| Caribbean | 15,123 | 20.8% |
| Central America | 1,329 | 1.8% |
| China | 140 | 0.2% |
| Colombia | 144 | 0.2% |
| Cuba | 35 | 0.1% |
| Czechoslovakia | 57 | 0.1% |
| Denmark | 24 | 0.0% |
| Dominica | 78 | 0.1% |
| Dominican Republic | 1,652 | 2.3% |
| Eastern Africa | 50 | 0.1% |
| Eastern Asia | 221 | 0.3% |
| Eastern Europe | 346 | 0.5% |
| Ecuador | 491 | 0.7% |
| El Salvador | 37 | 0.1% |
| England | 67 | 0.1% |
| Europe | 1,799 | 2.5% |
| France | 19 | 0.0% |
| Germany | 110 | 0.2% |
| Ghana | 605 | 0.8% |
| Greece | 81 | 0.1% |
| Grenada | 79 | 0.1% |
| Guatemala | 65 | 0.1% |
| Guyana | 633 | 0.9% |
| Haiti | 560 | 0.8% |
| Honduras | 268 | 0.4% |
| Hungary | 10 | 0.0% |
| India | 320 | 0.4% |
| Indonesia | 13 | 0.0% |
| Ireland | 112 | 0.2% |
| Israel | 32 | 0.0% |
| Italy | 331 | 0.4% |
| Jamaica | 10,785 | 14.8% |
| Jordan | 106 | 0.2% |
| Kenya | 42 | 0.1% |
| Korea | 81 | 0.1% |
| Laos | 23 | 0.0% |
| Latin America | 19,383 | 26.6% |
| Mexico | 627 | 0.9% |
| Middle Africa | 25 | 0.0% |
| Morocco | 25 | 0.0% |
| Nicaragua | 42 | 0.1% |
| Nigeria | 231 | 0.3% |
| Northern Africa | 25 | 0.0% |
| Northern Europe | 311 | 0.4% |
| Pakistan | 5 | 0.0% |
| Panama | 256 | 0.4% |
| Peru | 139 | 0.2% |
| Philippines | 176 | 0.2% |
| Poland | 82 | 0.1% |
| Portugal | 590 | 0.8% |
| Russia | 56 | 0.1% |
| Scotland | 16 | 0.0% |
| Sierra Leone | 46 | 0.1% |
| South America | 2,931 | 4.0% |
| South Central Asia | 341 | 0.5% |
| South Eastern Asia | 335 | 0.5% |
| Southern Europe | 1,002 | 1.4% |
| St. Vincent and the Grenadines | 155 | 0.2% |
| Sweden | 5 | 0.0% |
| Taiwan | 29 | 0.0% |
| Thailand | 85 | 0.1% |
| Trinidad and Tobago | 633 | 0.9% |
| Ukraine | 31 | 0.0% |
| Uruguay | 4 | 0.0% |
| Venezuela | 36 | 0.1% |
| Vietnam | 38 | 0.1% |
| West Indies | 128 | 0.2% |
| Western Africa | 1,133 | 1.6% |
| Western Asia | 155 | 0.2% |
| Western Europe | 140 | 0.2% | View All 81 Rows |
Sex and Age in Mount Vernon
Sex and Age in Mount Vernon
The most populous age groups in Mount Vernon are 35 to 39 Years (2,603 | 8.0%) for men and 25 to 29 Years (3,089 | 7.6%) for women.
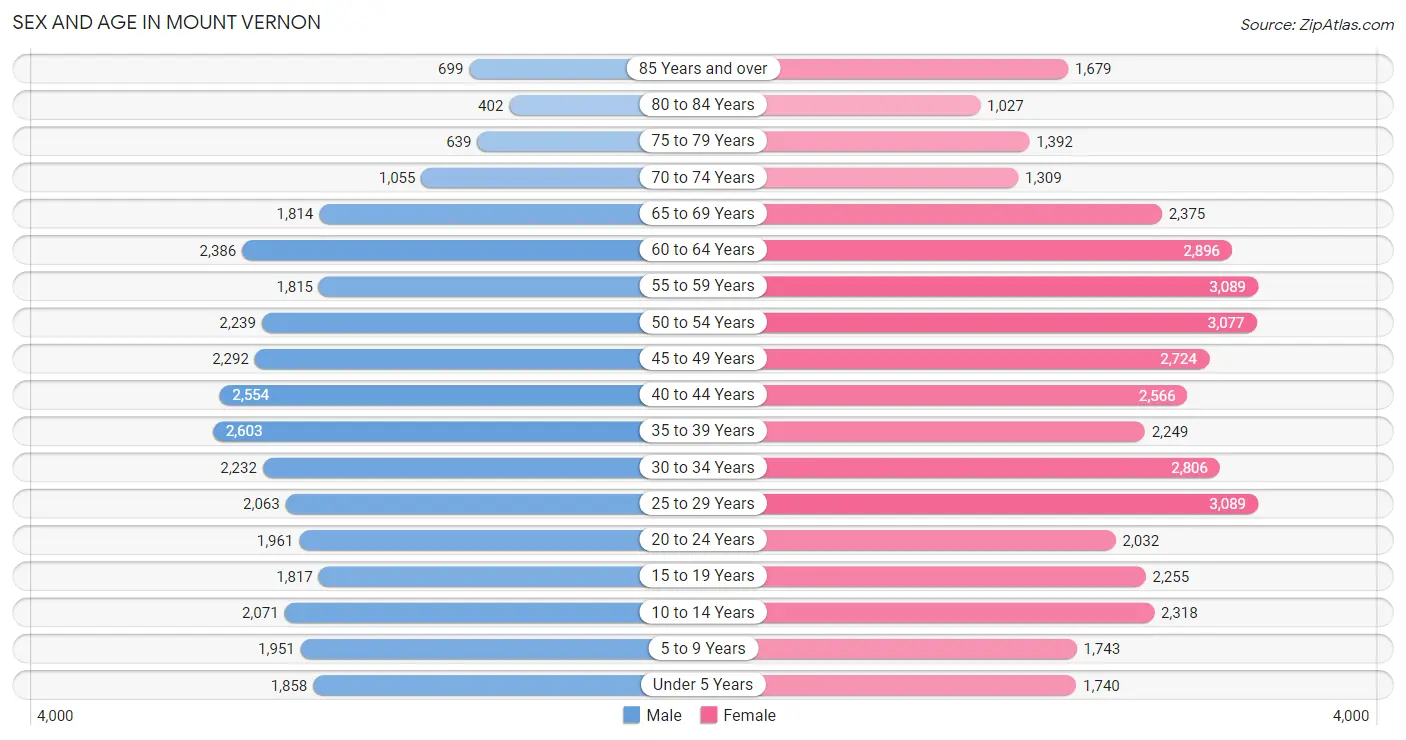
| Age Bracket | Male | Female |
| Under 5 Years | 1,858 (5.7%) | 1,740 (4.3%) |
| 5 to 9 Years | 1,951 (6.0%) | 1,743 (4.3%) |
| 10 to 14 Years | 2,071 (6.4%) | 2,318 (5.7%) |
| 15 to 19 Years | 1,817 (5.6%) | 2,255 (5.6%) |
| 20 to 24 Years | 1,961 (6.0%) | 2,032 (5.0%) |
| 25 to 29 Years | 2,063 (6.4%) | 3,089 (7.6%) |
| 30 to 34 Years | 2,232 (6.9%) | 2,806 (7.0%) |
| 35 to 39 Years | 2,603 (8.0%) | 2,249 (5.6%) |
| 40 to 44 Years | 2,554 (7.9%) | 2,566 (6.4%) |
| 45 to 49 Years | 2,292 (7.1%) | 2,724 (6.8%) |
| 50 to 54 Years | 2,239 (6.9%) | 3,077 (7.6%) |
| 55 to 59 Years | 1,815 (5.6%) | 3,089 (7.6%) |
| 60 to 64 Years | 2,386 (7.3%) | 2,896 (7.2%) |
| 65 to 69 Years | 1,814 (5.6%) | 2,375 (5.9%) |
| 70 to 74 Years | 1,055 (3.3%) | 1,309 (3.2%) |
| 75 to 79 Years | 639 (2.0%) | 1,392 (3.5%) |
| 80 to 84 Years | 402 (1.2%) | 1,027 (2.5%) |
| 85 Years and over | 699 (2.1%) | 1,679 (4.2%) |
| Total | 32,451 (100.0%) | 40,366 (100.0%) |
Families and Households in Mount Vernon
Median Family Size in Mount Vernon
The median family size in Mount Vernon is 3.31 persons per family, with married-couple families (8,894 | 52.2%) accounting for the largest median family size of 3.36 persons per family. On the other hand, single male/father families (1,370 | 8.0%) represent the smallest median family size with 2.88 persons per family.
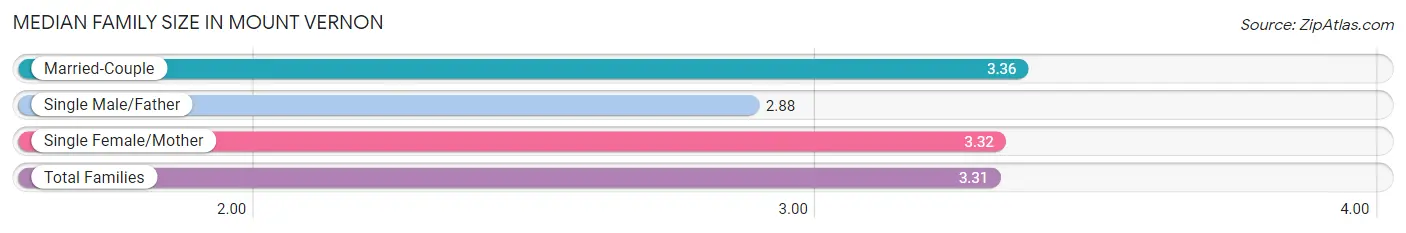
| Family Type | # Families | Family Size |
| Married-Couple | 8,894 (52.2%) | 3.36 |
| Single Male/Father | 1,370 (8.0%) | 2.88 |
| Single Female/Mother | 6,773 (39.8%) | 3.32 |
| Total Families | 17,037 (100.0%) | 3.31 |
Median Household Size in Mount Vernon
The median household size in Mount Vernon is 2.50 persons per household, with single female/mother households (6,773 | 23.5%) accounting for the largest median household size of 3.48 persons per household. non-family households (11,741 | 40.8%) represent the smallest median household size with 1.16 persons per household.
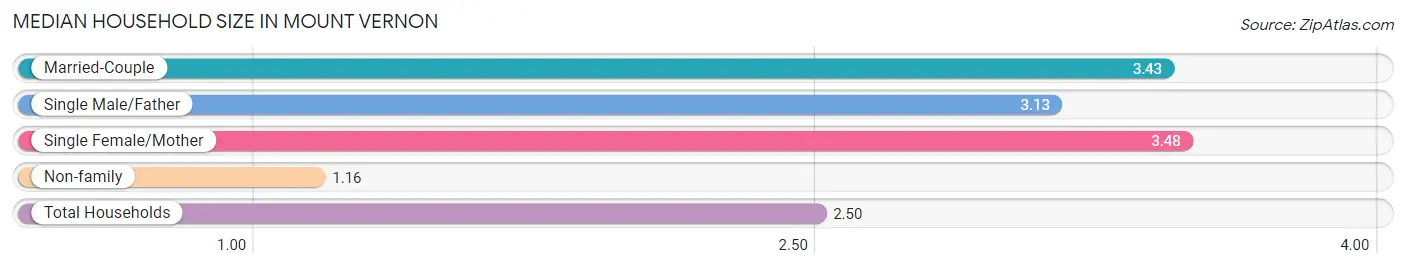
| Household Type | # Households | Household Size |
| Married-Couple | 8,894 (30.9%) | 3.43 |
| Single Male/Father | 1,370 (4.8%) | 3.13 |
| Single Female/Mother | 6,773 (23.5%) | 3.48 |
| Non-family | 11,741 (40.8%) | 1.16 |
| Total Households | 28,778 (100.0%) | 2.50 |
Household Size by Marriage Status in Mount Vernon
Out of a total of 28,778 households in Mount Vernon, 17,037 (59.2%) are family households, while 11,741 (40.8%) are nonfamily households. The most numerous type of family households are 2-person households, comprising 6,739, and the most common type of nonfamily households are 1-person households, comprising 10,234.
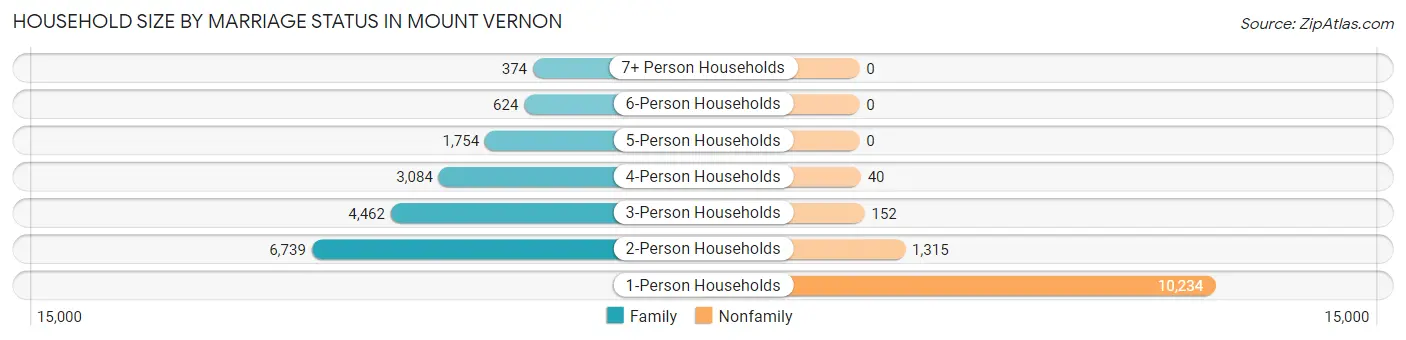
| Household Size | Family Households | Nonfamily Households |
| 1-Person Households | - | 10,234 (35.6%) |
| 2-Person Households | 6,739 (23.4%) | 1,315 (4.6%) |
| 3-Person Households | 4,462 (15.5%) | 152 (0.5%) |
| 4-Person Households | 3,084 (10.7%) | 40 (0.1%) |
| 5-Person Households | 1,754 (6.1%) | 0 (0.0%) |
| 6-Person Households | 624 (2.2%) | 0 (0.0%) |
| 7+ Person Households | 374 (1.3%) | 0 (0.0%) |
| Total | 17,037 (59.2%) | 11,741 (40.8%) |
Female Fertility in Mount Vernon
Fertility by Age in Mount Vernon
Average fertility rate in Mount Vernon is 37.0 births per 1,000 women. Women in the age bracket of 20 to 34 years have the highest fertility rate with 64.0 births per 1,000 women. Women in the age bracket of 20 to 34 years acount for 74.9% of all women with births.
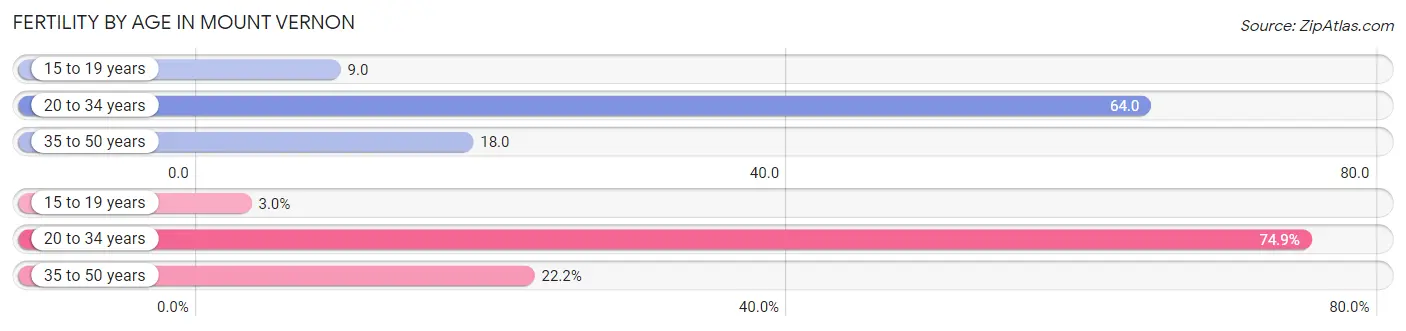
| Age Bracket | Women with Births | Births / 1,000 Women |
| 15 to 19 years | 20 (2.9%) | 9.0 |
| 20 to 34 years | 507 (74.9%) | 64.0 |
| 35 to 50 years | 150 (22.2%) | 18.0 |
| Total | 677 (100.0%) | 37.0 |
Fertility by Age by Marriage Status in Mount Vernon
51.7% of women with births (677) in Mount Vernon are married. The highest percentage of unmarried women with births falls into 15 to 19 years age bracket with 100.0% of them unmarried at the time of birth, while the lowest percentage of unmarried women with births belong to 35 to 50 years age bracket with 16.7% of them unmarried.
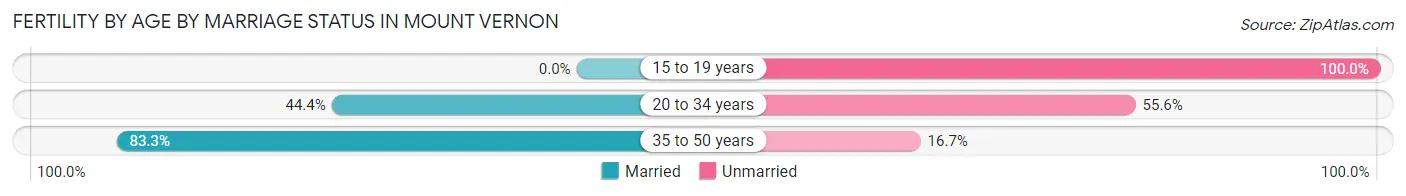
| Age Bracket | Married | Unmarried |
| 15 to 19 years | 0 (0.0%) | 20 (100.0%) |
| 20 to 34 years | 225 (44.4%) | 282 (55.6%) |
| 35 to 50 years | 125 (83.3%) | 25 (16.7%) |
| Total | 350 (51.7%) | 327 (48.3%) |
Fertility by Education in Mount Vernon
Average fertility rate in Mount Vernon is 37.0 births per 1,000 women. Women with the education attainment of graduate degree have the highest fertility rate of 91.0 births per 1,000 women, while women with the education attainment of bachelor's degree have the lowest fertility at 18.0 births per 1,000 women. Women with the education attainment of graduate degree represent 37.2% of all women with births.
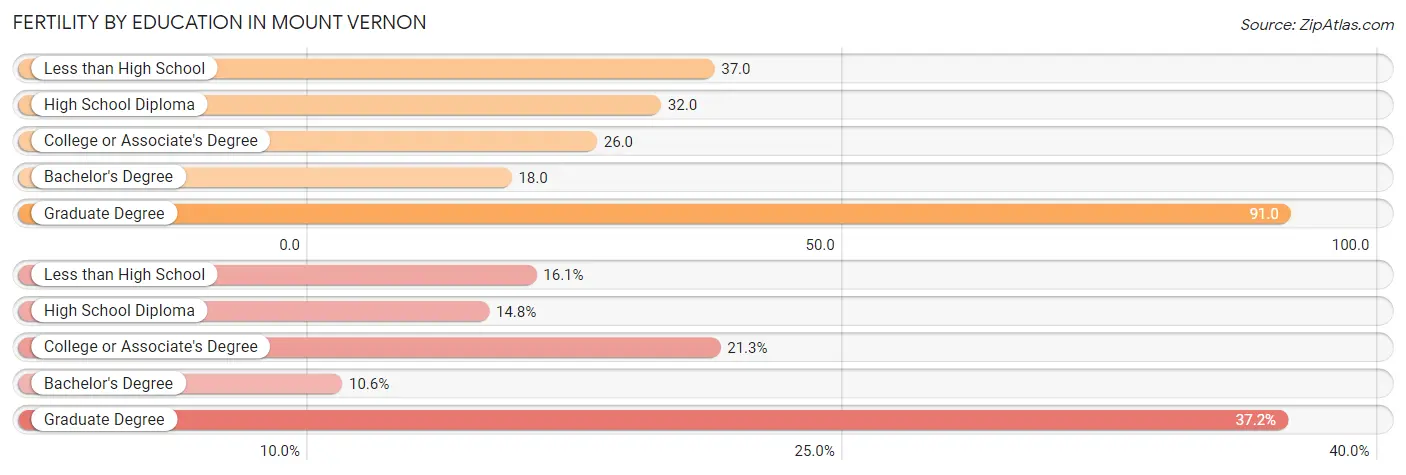
| Educational Attainment | Women with Births | Births / 1,000 Women |
| Less than High School | 109 (16.1%) | 37.0 |
| High School Diploma | 100 (14.8%) | 32.0 |
| College or Associate's Degree | 144 (21.3%) | 26.0 |
| Bachelor's Degree | 72 (10.6%) | 18.0 |
| Graduate Degree | 252 (37.2%) | 91.0 |
| Total | 677 (100.0%) | 37.0 |
Fertility by Education by Marriage Status in Mount Vernon
48.3% of women with births in Mount Vernon are unmarried. Women with the educational attainment of bachelor's degree are most likely to be married with 100.0% of them married at childbirth, while women with the educational attainment of high school diploma are least likely to be married with 76.0% of them unmarried at childbirth.
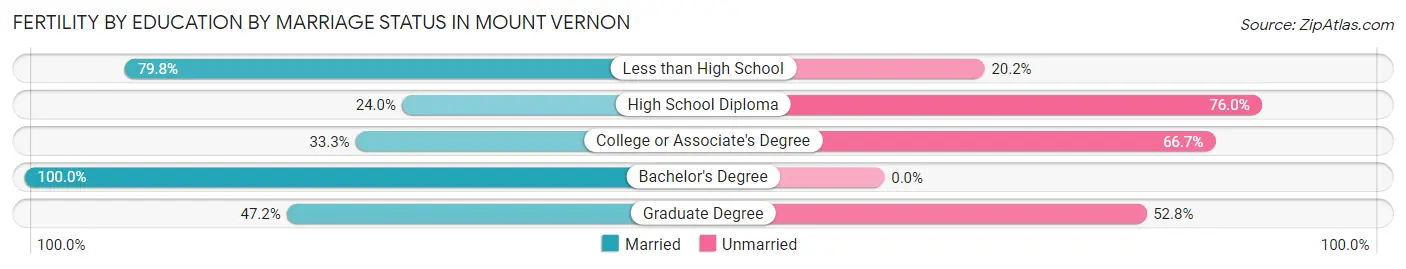
| Educational Attainment | Married | Unmarried |
| Less than High School | 87 (79.8%) | 22 (20.2%) |
| High School Diploma | 24 (24.0%) | 76 (76.0%) |
| College or Associate's Degree | 48 (33.3%) | 96 (66.7%) |
| Bachelor's Degree | 72 (100.0%) | 0 (0.0%) |
| Graduate Degree | 119 (47.2%) | 133 (52.8%) |
| Total | 350 (51.7%) | 327 (48.3%) |
Income in Mount Vernon
Income Overview in Mount Vernon
Per Capita Income in Mount Vernon is $40,288, while median incomes of families and households are $99,636 and $75,511 respectively.
| Characteristic | Number | Measure |
| Per Capita Income | 72,817 | $40,288 |
| Median Family Income | 17,037 | $99,636 |
| Mean Family Income | 17,037 | $123,650 |
| Median Household Income | 28,778 | $75,511 |
| Mean Household Income | 28,778 | $98,323 |
| Income Deficit | 17,037 | $11,378 |
| Wage / Income Gap (%) | 72,817 | 12.28% |
| Wage / Income Gap ($) | 72,817 | 87.72¢ per $1 |
| Gini / Inequality Index | 72,817 | 0.48 |
Earnings by Sex in Mount Vernon
Average Earnings in Mount Vernon are $48,758, $52,104 for men and $45,707 for women, a difference of 12.3%.
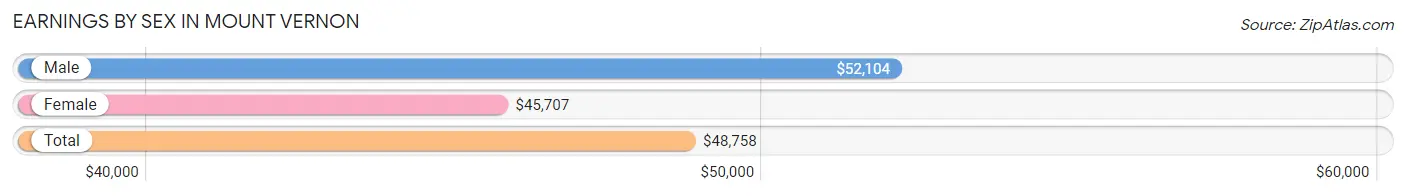
| Sex | Number | Average Earnings |
| Male | 17,761 (45.0%) | $52,104 |
| Female | 21,724 (55.0%) | $45,707 |
| Total | 39,485 (100.0%) | $48,758 |
Earnings by Sex by Income Bracket in Mount Vernon
The most common earnings brackets in Mount Vernon are $100,000+ for men (3,214 | 18.1%) and $100,000+ for women (3,205 | 14.7%).
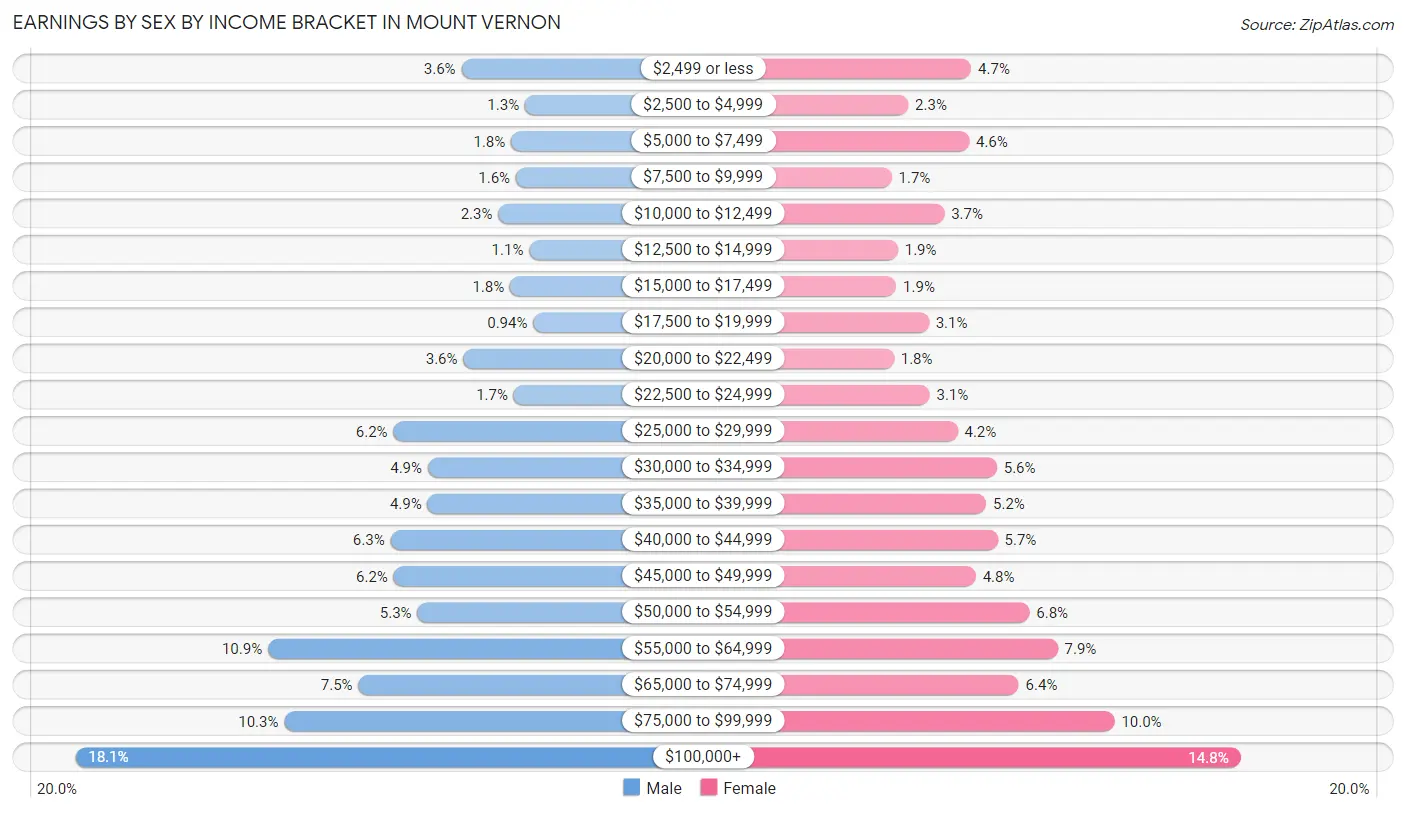
| Income | Male | Female |
| $2,499 or less | 644 (3.6%) | 1,013 (4.7%) |
| $2,500 to $4,999 | 222 (1.3%) | 499 (2.3%) |
| $5,000 to $7,499 | 314 (1.8%) | 996 (4.6%) |
| $7,500 to $9,999 | 283 (1.6%) | 365 (1.7%) |
| $10,000 to $12,499 | 400 (2.2%) | 793 (3.6%) |
| $12,500 to $14,999 | 193 (1.1%) | 414 (1.9%) |
| $15,000 to $17,499 | 322 (1.8%) | 401 (1.8%) |
| $17,500 to $19,999 | 167 (0.9%) | 667 (3.1%) |
| $20,000 to $22,499 | 632 (3.6%) | 383 (1.8%) |
| $22,500 to $24,999 | 296 (1.7%) | 674 (3.1%) |
| $25,000 to $29,999 | 1,098 (6.2%) | 901 (4.2%) |
| $30,000 to $34,999 | 868 (4.9%) | 1,220 (5.6%) |
| $35,000 to $39,999 | 871 (4.9%) | 1,133 (5.2%) |
| $40,000 to $44,999 | 1,117 (6.3%) | 1,228 (5.7%) |
| $45,000 to $49,999 | 1,095 (6.2%) | 1,050 (4.8%) |
| $50,000 to $54,999 | 938 (5.3%) | 1,487 (6.8%) |
| $55,000 to $64,999 | 1,933 (10.9%) | 1,716 (7.9%) |
| $65,000 to $74,999 | 1,330 (7.5%) | 1,399 (6.4%) |
| $75,000 to $99,999 | 1,824 (10.3%) | 2,180 (10.0%) |
| $100,000+ | 3,214 (18.1%) | 3,205 (14.7%) |
| Total | 17,761 (100.0%) | 21,724 (100.0%) |
Earnings by Sex by Educational Attainment in Mount Vernon
Average earnings in Mount Vernon are $55,330 for men and $49,142 for women, a difference of 11.2%. Men with an educational attainment of graduate degree enjoy the highest average annual earnings of $93,587, while those with less than high school education earn the least with $40,610. Women with an educational attainment of graduate degree earn the most with the average annual earnings of $80,313, while those with less than high school education have the smallest earnings of $27,850.
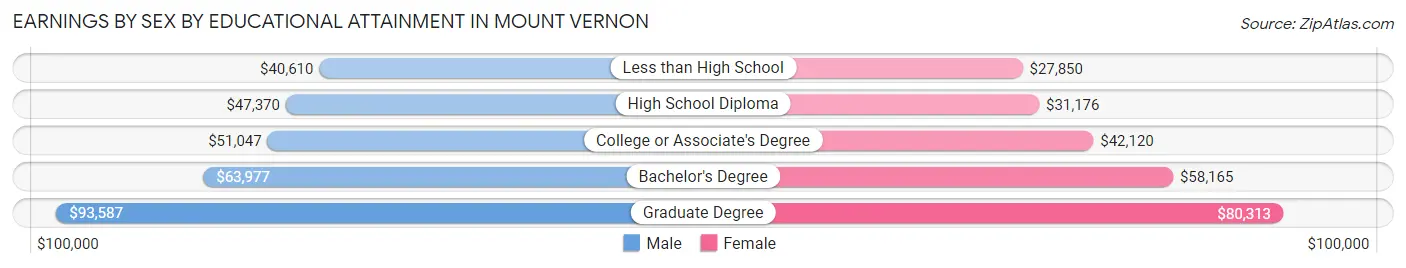
| Educational Attainment | Male Income | Female Income |
| Less than High School | $40,610 | $27,850 |
| High School Diploma | $47,370 | $31,176 |
| College or Associate's Degree | $51,047 | $42,120 |
| Bachelor's Degree | $63,977 | $58,165 |
| Graduate Degree | $93,587 | $80,313 |
| Total | $55,330 | $49,142 |
Family Income in Mount Vernon
Family Income Brackets in Mount Vernon
According to the Mount Vernon family income data, there are 3,373 families falling into the $100,000 to $149,999 income range, which is the most common income bracket and makes up 19.8% of all families. Conversely, the $10,000 to $14,999 income bracket is the least frequent group with only 511 families (3.0%) belonging to this category.
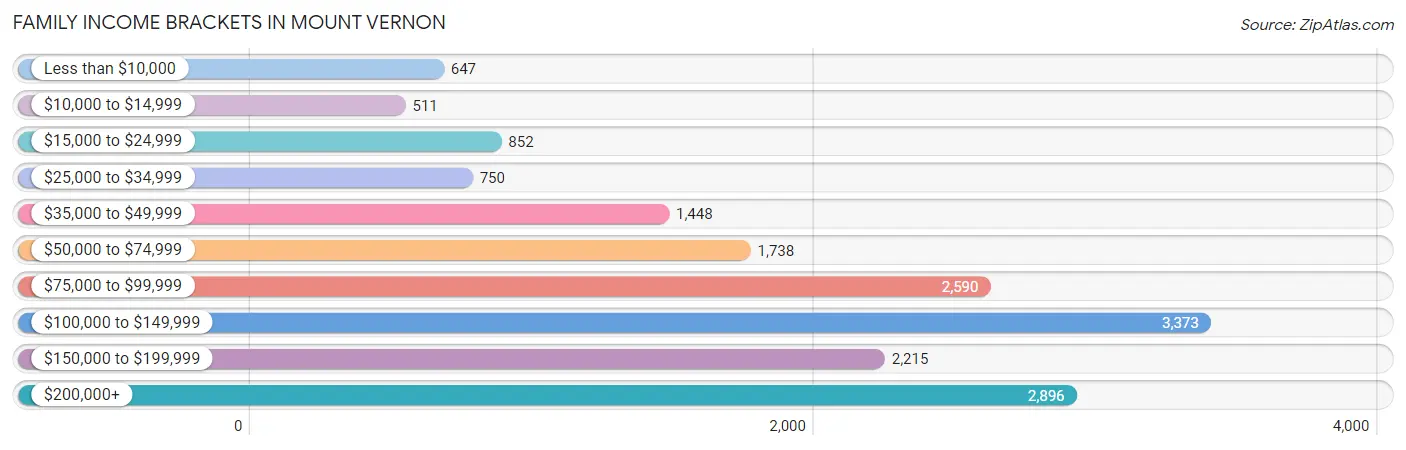
| Income Bracket | # Families | % Families |
| Less than $10,000 | 647 | 3.8% |
| $10,000 to $14,999 | 511 | 3.0% |
| $15,000 to $24,999 | 852 | 5.0% |
| $25,000 to $34,999 | 750 | 4.4% |
| $35,000 to $49,999 | 1,448 | 8.5% |
| $50,000 to $74,999 | 1,738 | 10.2% |
| $75,000 to $99,999 | 2,590 | 15.2% |
| $100,000 to $149,999 | 3,373 | 19.8% |
| $150,000 to $199,999 | 2,215 | 13.0% |
| $200,000+ | 2,896 | 17.0% |
Family Income by Famaliy Size in Mount Vernon
7+ person families (272 | 1.6%) account for the highest median family income in Mount Vernon with $203,400 per family, while 2-person families (7,105 | 41.7%) have the highest median income of $40,818 per family member.
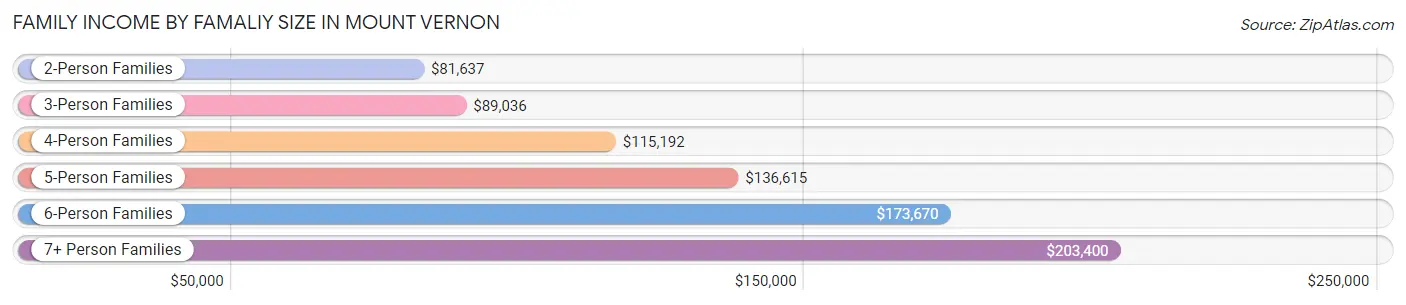
| Income Bracket | # Families | Median Income |
| 2-Person Families | 7,105 (41.7%) | $81,637 |
| 3-Person Families | 4,659 (27.4%) | $89,036 |
| 4-Person Families | 2,810 (16.5%) | $115,192 |
| 5-Person Families | 1,709 (10.0%) | $136,615 |
| 6-Person Families | 482 (2.8%) | $173,670 |
| 7+ Person Families | 272 (1.6%) | $203,400 |
| Total | 17,037 (100.0%) | $99,636 |
Family Income by Number of Earners in Mount Vernon
The median family income in Mount Vernon is $99,636, with families comprising 3+ earners (2,644) having the highest median family income of $165,526, while families with no earners (1,802) have the lowest median family income of $32,128, accounting for 15.5% and 10.6% of families, respectively.
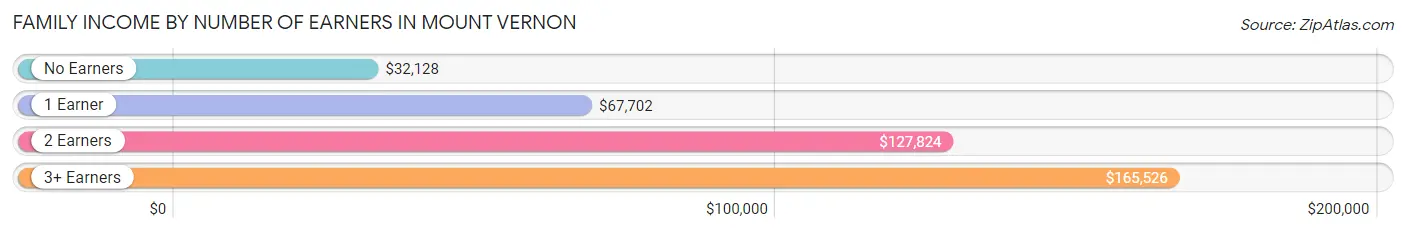
| Number of Earners | # Families | Median Income |
| No Earners | 1,802 (10.6%) | $32,128 |
| 1 Earner | 5,767 (33.9%) | $67,702 |
| 2 Earners | 6,824 (40.1%) | $127,824 |
| 3+ Earners | 2,644 (15.5%) | $165,526 |
| Total | 17,037 (100.0%) | $99,636 |
Household Income in Mount Vernon
Household Income Brackets in Mount Vernon
With 4,633 households falling in the category, the $100,000 to $149,999 income range is the most frequent in Mount Vernon, accounting for 16.1% of all households. In contrast, only 1,727 households (6.0%) fall into the $10,000 to $14,999 income bracket, making it the least populous group.
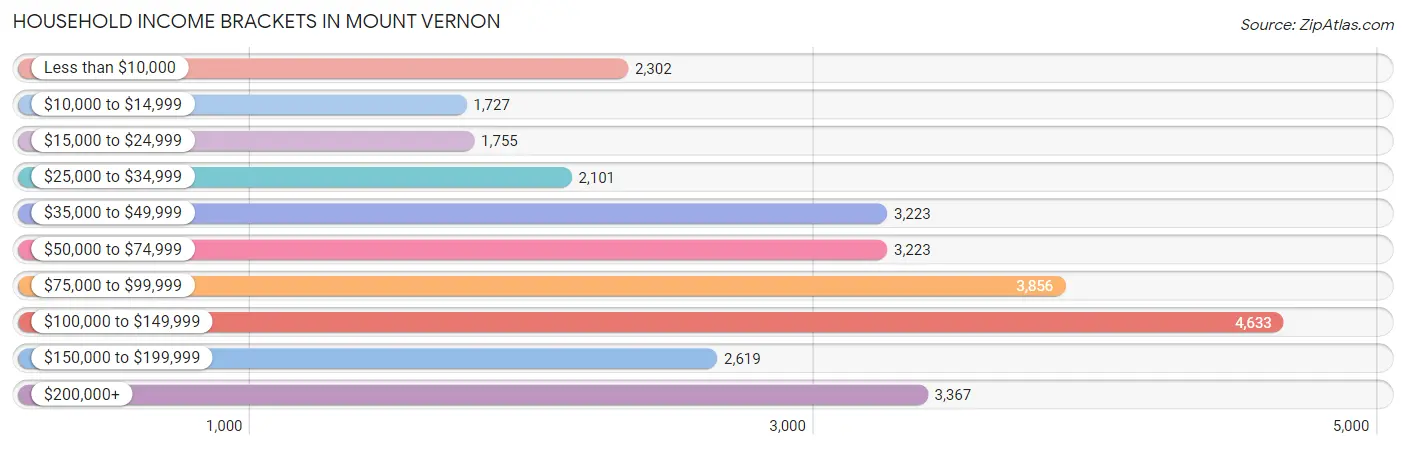
| Income Bracket | # Households | % Households |
| Less than $10,000 | 2,302 | 8.0% |
| $10,000 to $14,999 | 1,727 | 6.0% |
| $15,000 to $24,999 | 1,755 | 6.1% |
| $25,000 to $34,999 | 2,101 | 7.3% |
| $35,000 to $49,999 | 3,223 | 11.2% |
| $50,000 to $74,999 | 3,223 | 11.2% |
| $75,000 to $99,999 | 3,856 | 13.4% |
| $100,000 to $149,999 | 4,633 | 16.1% |
| $150,000 to $199,999 | 2,619 | 9.1% |
| $200,000+ | 3,367 | 11.7% |
Household Income by Householder Age in Mount Vernon
The median household income in Mount Vernon is $75,511, with the highest median household income of $85,346 found in the 25 to 44 years age bracket for the primary householder. A total of 7,752 households (26.9%) fall into this category. Meanwhile, the 15 to 24 years age bracket for the primary householder has the lowest median household income of $45,338, with 226 households (0.8%) in this group.
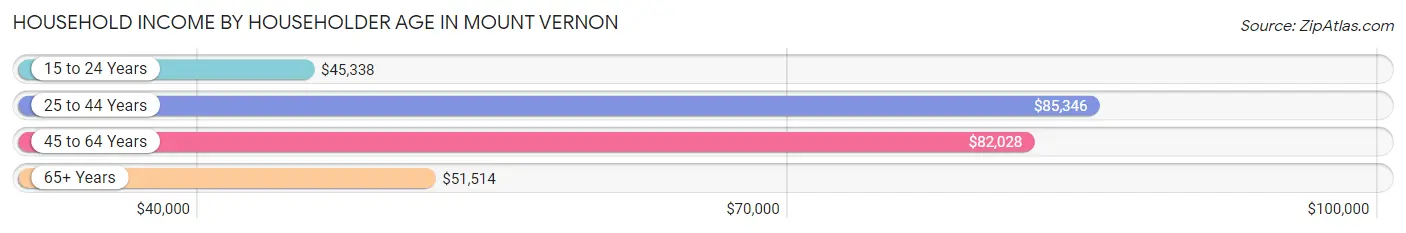
| Income Bracket | # Households | Median Income |
| 15 to 24 Years | 226 (0.8%) | $45,338 |
| 25 to 44 Years | 7,752 (26.9%) | $85,346 |
| 45 to 64 Years | 12,318 (42.8%) | $82,028 |
| 65+ Years | 8,482 (29.5%) | $51,514 |
| Total | 28,778 (100.0%) | $75,511 |
Poverty in Mount Vernon
Income Below Poverty by Sex and Age in Mount Vernon
With 11.2% poverty level for males and 16.1% for females among the residents of Mount Vernon, 6 to 11 year old males and under 5 year old females are the most vulnerable to poverty, with 524 males (26.2%) and 665 females (43.0%) in their respective age groups living below the poverty level.
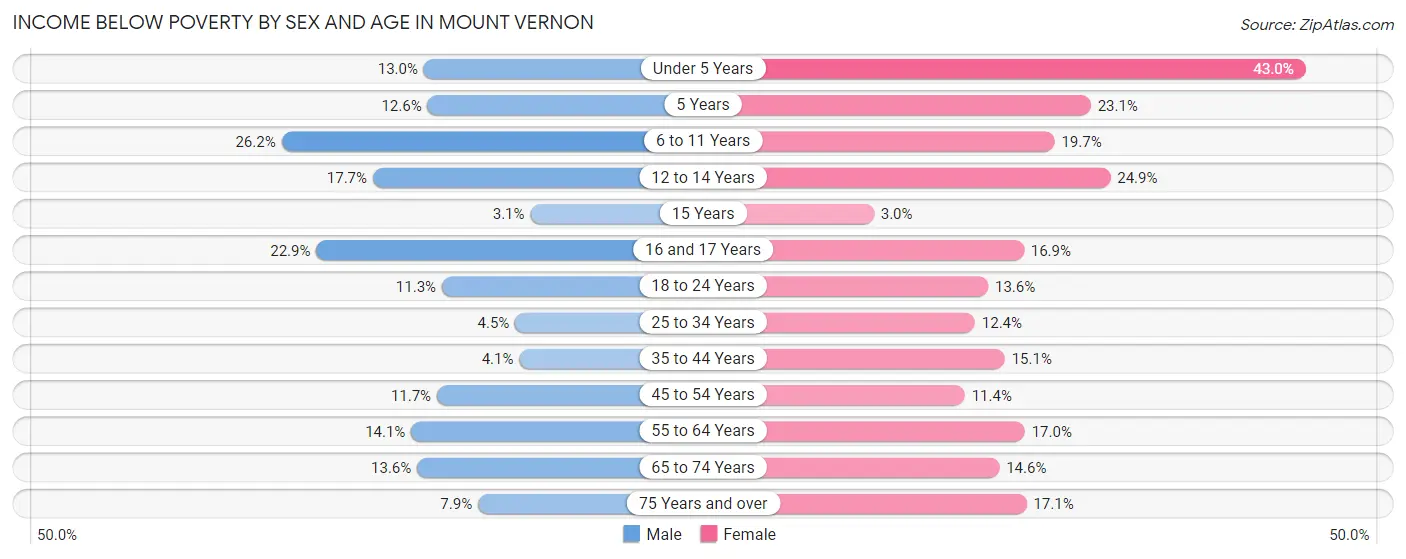
| Age Bracket | Male | Female |
| Under 5 Years | 236 (13.0%) | 665 (43.0%) |
| 5 Years | 59 (12.6%) | 70 (23.1%) |
| 6 to 11 Years | 524 (26.2%) | 491 (19.7%) |
| 12 to 14 Years | 262 (17.7%) | 298 (24.9%) |
| 15 Years | 11 (3.1%) | 14 (3.0%) |
| 16 and 17 Years | 144 (22.9%) | 154 (16.9%) |
| 18 to 24 Years | 314 (11.3%) | 393 (13.6%) |
| 25 to 34 Years | 192 (4.5%) | 728 (12.3%) |
| 35 to 44 Years | 210 (4.1%) | 728 (15.1%) |
| 45 to 54 Years | 530 (11.7%) | 662 (11.4%) |
| 55 to 64 Years | 590 (14.1%) | 1,009 (17.0%) |
| 65 to 74 Years | 381 (13.6%) | 532 (14.6%) |
| 75 Years and over | 130 (7.9%) | 658 (17.1%) |
| Total | 3,583 (11.2%) | 6,402 (16.1%) |
Income Above Poverty by Sex and Age in Mount Vernon
According to the poverty statistics in Mount Vernon, males aged 15 years and females aged 15 years are the age groups that are most secure financially, with 96.9% of males and 97.0% of females in these age groups living above the poverty line.
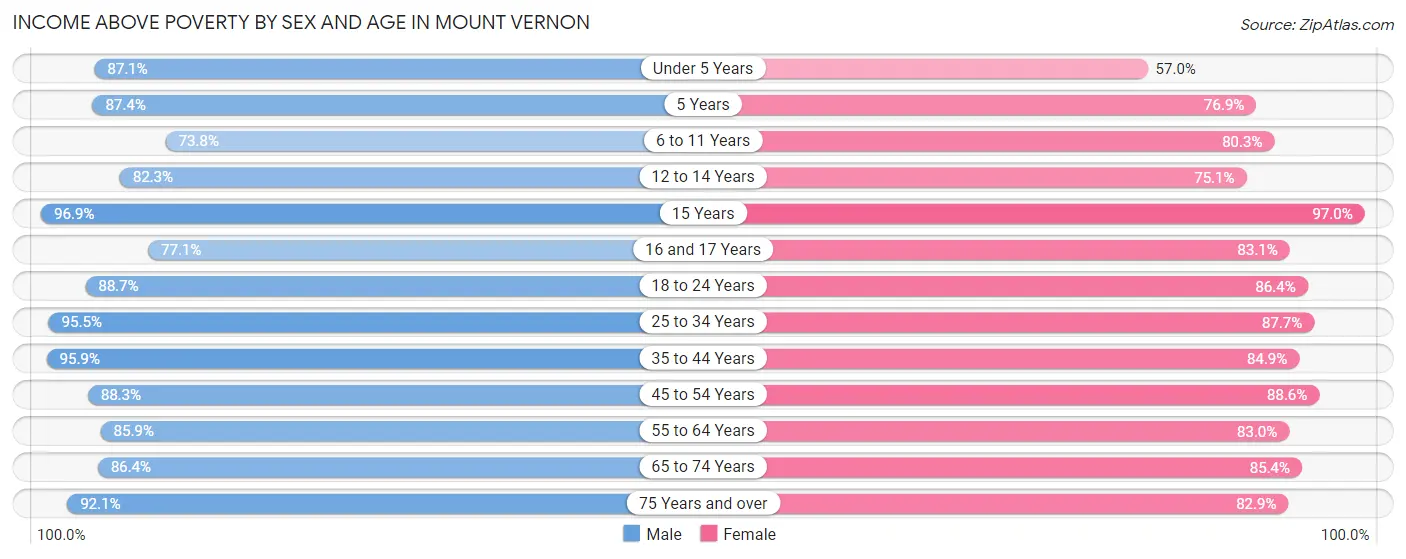
| Age Bracket | Male | Female |
| Under 5 Years | 1,587 (87.1%) | 880 (57.0%) |
| 5 Years | 409 (87.4%) | 233 (76.9%) |
| 6 to 11 Years | 1,479 (73.8%) | 1,996 (80.3%) |
| 12 to 14 Years | 1,220 (82.3%) | 898 (75.1%) |
| 15 Years | 348 (96.9%) | 458 (97.0%) |
| 16 and 17 Years | 484 (77.1%) | 758 (83.1%) |
| 18 to 24 Years | 2,471 (88.7%) | 2,504 (86.4%) |
| 25 to 34 Years | 4,103 (95.5%) | 5,167 (87.6%) |
| 35 to 44 Years | 4,926 (95.9%) | 4,087 (84.9%) |
| 45 to 54 Years | 3,989 (88.3%) | 5,139 (88.6%) |
| 55 to 64 Years | 3,589 (85.9%) | 4,935 (83.0%) |
| 65 to 74 Years | 2,427 (86.4%) | 3,110 (85.4%) |
| 75 Years and over | 1,512 (92.1%) | 3,180 (82.9%) |
| Total | 28,544 (88.8%) | 33,345 (83.9%) |
Income Below Poverty Among Married-Couple Families in Mount Vernon
The poverty statistics for married-couple families in Mount Vernon show that 2.8% or 246 of the total 8,894 families live below the poverty line. Families with 3 or 4 children have the highest poverty rate of 9.3%, comprising of 69 families. On the other hand, families with no children have the lowest poverty rate of 2.0%, which includes 104 families.
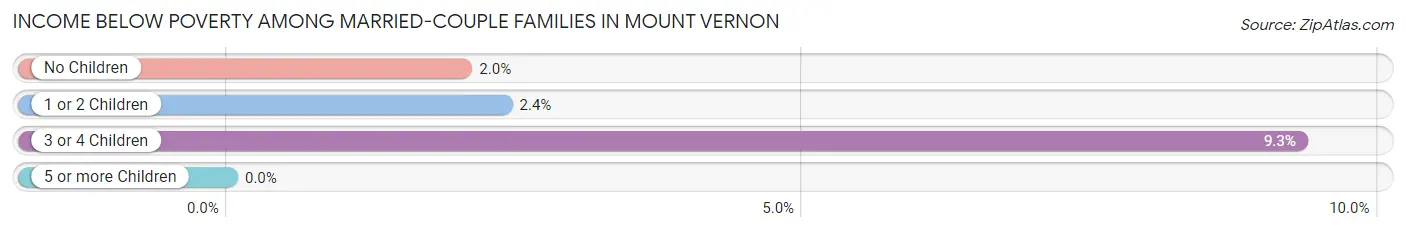
| Children | Above Poverty | Below Poverty |
| No Children | 5,000 (98.0%) | 104 (2.0%) |
| 1 or 2 Children | 2,976 (97.6%) | 73 (2.4%) |
| 3 or 4 Children | 672 (90.7%) | 69 (9.3%) |
| 5 or more Children | 0 (0.0%) | 0 (0.0%) |
| Total | 8,648 (97.2%) | 246 (2.8%) |
Income Below Poverty Among Single-Parent Households in Mount Vernon
According to the poverty data in Mount Vernon, 12.0% or 165 single-father households and 20.1% or 1,361 single-mother households are living below the poverty line. Among single-father households, those with 3 or 4 children have the highest poverty rate, with 26 households (100.0%) experiencing poverty. Likewise, among single-mother households, those with 5 or more children have the highest poverty rate, with 23 households (100.0%) falling below the poverty line.
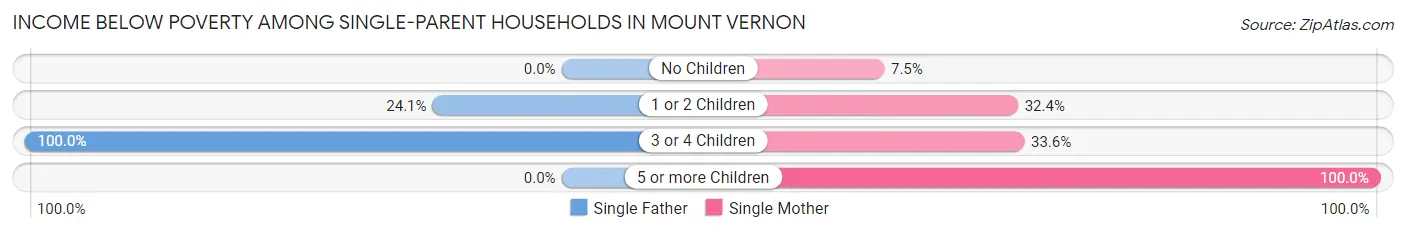
| Children | Single Father | Single Mother |
| No Children | 0 (0.0%) | 258 (7.5%) |
| 1 or 2 Children | 139 (24.0%) | 956 (32.4%) |
| 3 or 4 Children | 26 (100.0%) | 124 (33.6%) |
| 5 or more Children | 0 (0.0%) | 23 (100.0%) |
| Total | 165 (12.0%) | 1,361 (20.1%) |
Income Below Poverty Among Married-Couple vs Single-Parent Households in Mount Vernon
The poverty data for Mount Vernon shows that 246 of the married-couple family households (2.8%) and 1,526 of the single-parent households (18.7%) are living below the poverty level. Within the married-couple family households, those with 3 or 4 children have the highest poverty rate, with 69 households (9.3%) falling below the poverty line. Among the single-parent households, those with 5 or more children have the highest poverty rate, with 23 household (100.0%) living below poverty.
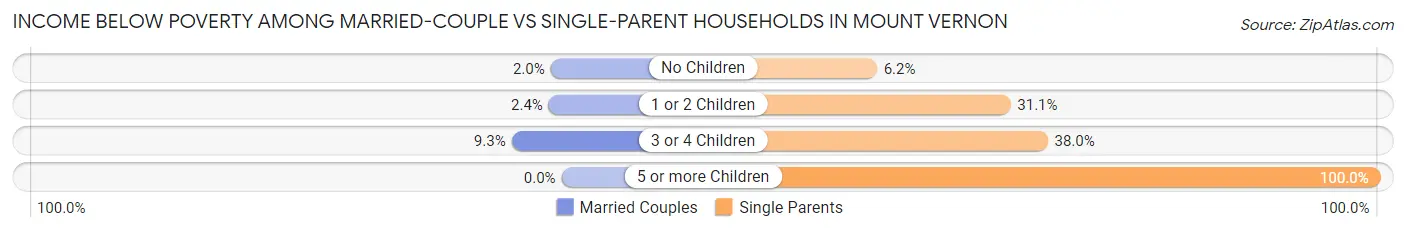
| Children | Married-Couple Families | Single-Parent Households |
| No Children | 104 (2.0%) | 258 (6.1%) |
| 1 or 2 Children | 73 (2.4%) | 1,095 (31.0%) |
| 3 or 4 Children | 69 (9.3%) | 150 (38.0%) |
| 5 or more Children | 0 (0.0%) | 23 (100.0%) |
| Total | 246 (2.8%) | 1,526 (18.7%) |
Employment Characteristics in Mount Vernon
Employment by Class of Employer in Mount Vernon
Among the 35,394 employed individuals in Mount Vernon, private company employees (20,432 | 57.7%), not-for-profit organizations (5,859 | 16.6%), and local government employees (4,570 | 12.9%) make up the most common classes of employment.
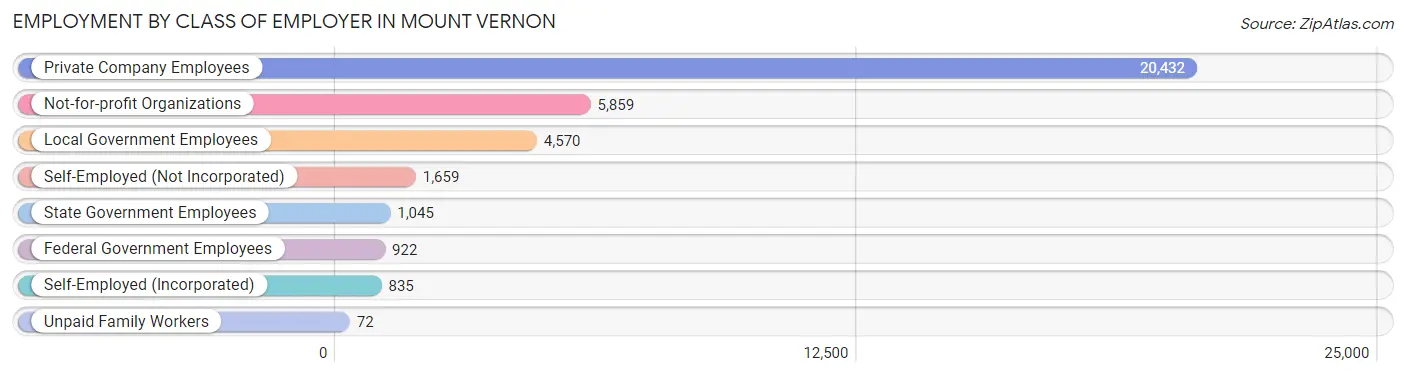
| Employer Class | # Employees | % Employees |
| Private Company Employees | 20,432 | 57.7% |
| Self-Employed (Incorporated) | 835 | 2.4% |
| Self-Employed (Not Incorporated) | 1,659 | 4.7% |
| Not-for-profit Organizations | 5,859 | 16.6% |
| Local Government Employees | 4,570 | 12.9% |
| State Government Employees | 1,045 | 2.9% |
| Federal Government Employees | 922 | 2.6% |
| Unpaid Family Workers | 72 | 0.2% |
| Total | 35,394 | 100.0% |
Employment Status by Age in Mount Vernon
According to the labor force statistics for Mount Vernon, out of the total population over 16 years of age (60,301), 65.9% or 39,738 individuals are in the labor force, with 8.0% or 3,179 of them unemployed. The age group with the highest labor force participation rate is 30 to 34 years, with 88.9% or 4,479 individuals in the labor force. Within the labor force, the 16 to 19 years age range has the highest percentage of unemployed individuals, with 41.8% or 348 of them being unemployed.
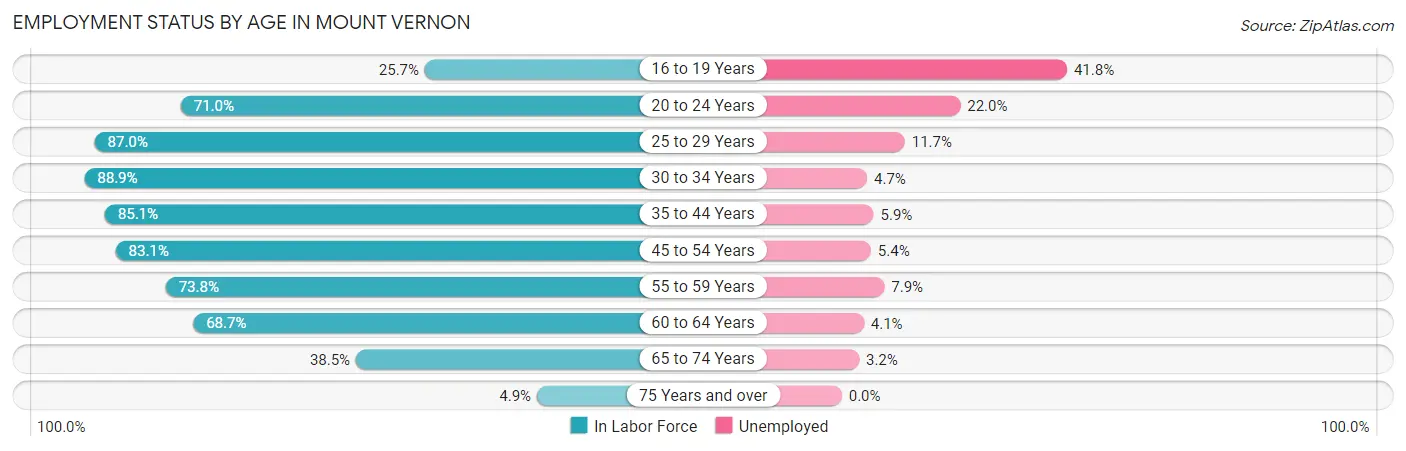
| Age Bracket | In Labor Force | Unemployed |
| 16 to 19 Years | 832 (25.7%) | 348 (41.8%) |
| 20 to 24 Years | 2,835 (71.0%) | 624 (22.0%) |
| 25 to 29 Years | 4,482 (87.0%) | 524 (11.7%) |
| 30 to 34 Years | 4,479 (88.9%) | 211 (4.7%) |
| 35 to 44 Years | 8,486 (85.1%) | 501 (5.9%) |
| 45 to 54 Years | 8,586 (83.1%) | 464 (5.4%) |
| 55 to 59 Years | 3,619 (73.8%) | 286 (7.9%) |
| 60 to 64 Years | 3,629 (68.7%) | 149 (4.1%) |
| 65 to 74 Years | 2,523 (38.5%) | 81 (3.2%) |
| 75 Years and over | 286 (4.9%) | 0 (0.0%) |
| Total | 39,738 (65.9%) | 3,179 (8.0%) |
Employment Status by Educational Attainment in Mount Vernon
According to labor force statistics for Mount Vernon, 81.8% of individuals (33,276) out of the total population between 25 and 64 years of age (40,680) are in the labor force, with 6.4% or 2,130 of them being unemployed. The group with the highest labor force participation rate are those with the educational attainment of bachelor's degree or higher, with 91.1% or 13,650 individuals in the labor force. Within the labor force, individuals with less than high school education have the highest percentage of unemployment, with 10.9% or 385 of them being unemployed.
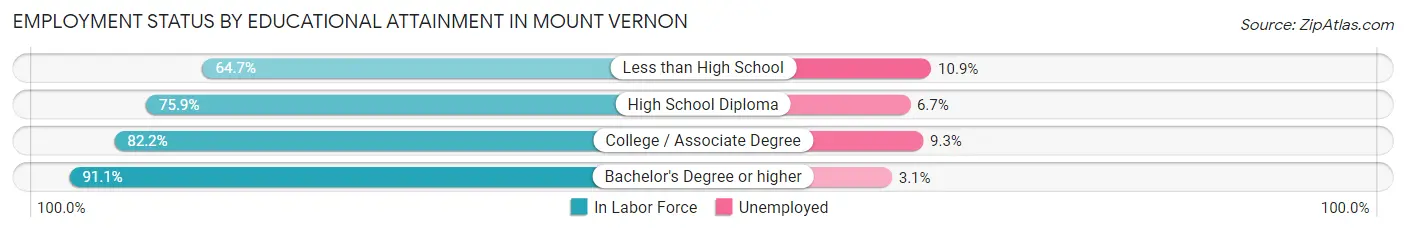
| Educational Attainment | In Labor Force | Unemployed |
| Less than High School | 3,529 (64.7%) | 595 (10.9%) |
| High School Diploma | 6,585 (75.9%) | 581 (6.7%) |
| College / Associate Degree | 9,507 (82.2%) | 1,076 (9.3%) |
| Bachelor's Degree or higher | 13,650 (91.1%) | 464 (3.1%) |
| Total | 33,276 (81.8%) | 2,604 (6.4%) |
Employment Occupations by Sex in Mount Vernon
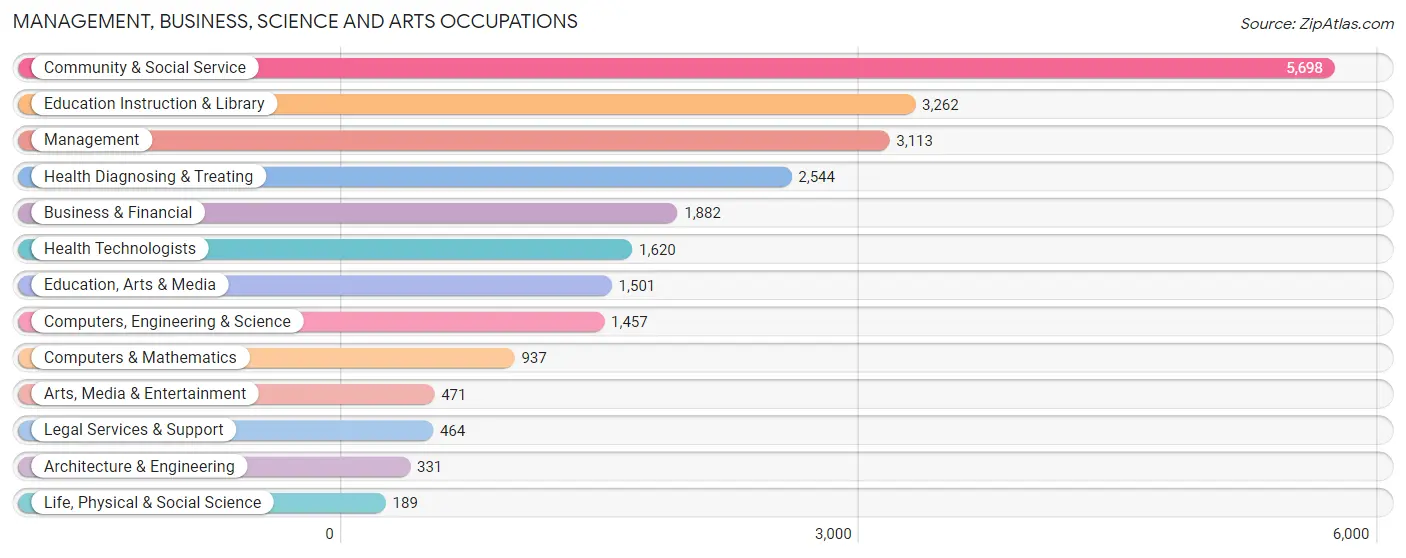
Management, Business, Science and Arts Occupations
The most common Management, Business, Science and Arts occupations in Mount Vernon are Community & Social Service (5,698 | 15.6%), Education Instruction & Library (3,262 | 8.9%), Management (3,113 | 8.5%), Health Diagnosing & Treating (2,544 | 7.0%), and Business & Financial (1,882 | 5.1%).
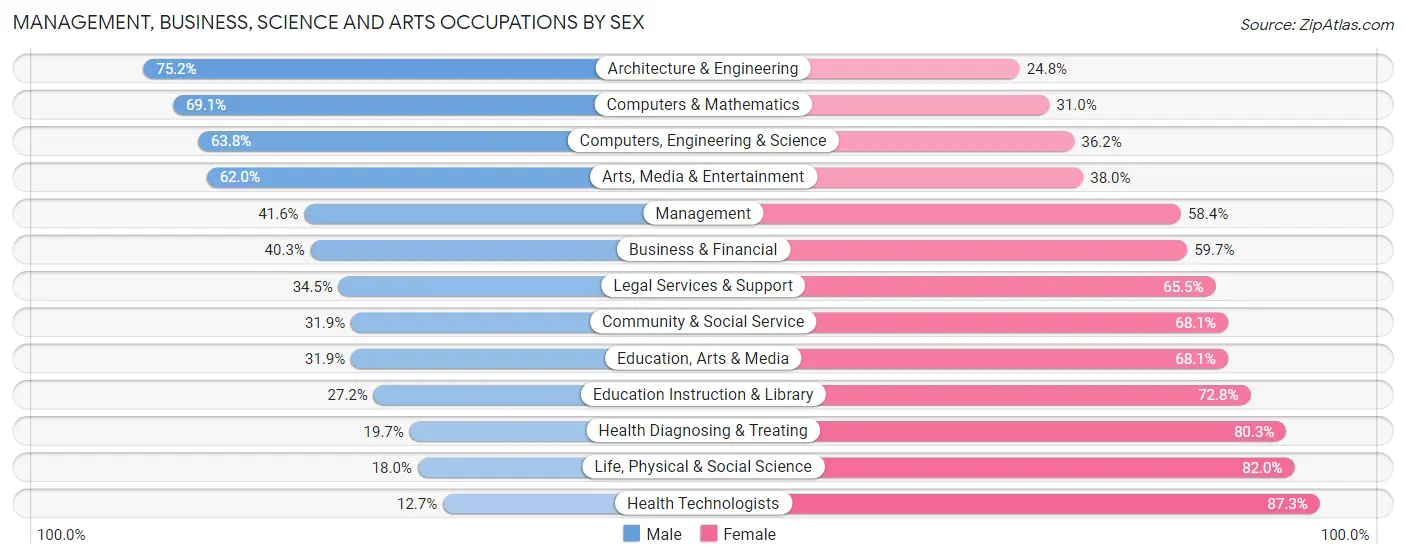
Management, Business, Science and Arts Occupations by Sex
Within the Management, Business, Science and Arts occupations in Mount Vernon, the most male-oriented occupations are Architecture & Engineering (75.2%), Computers & Mathematics (69.1%), and Computers, Engineering & Science (63.8%), while the most female-oriented occupations are Health Technologists (87.3%), Life, Physical & Social Science (82.0%), and Health Diagnosing & Treating (80.3%).
| Occupation | Male | Female |
| Management | 1,296 (41.6%) | 1,817 (58.4%) |
| Business & Financial | 759 (40.3%) | 1,123 (59.7%) |
| Computers, Engineering & Science | 930 (63.8%) | 527 (36.2%) |
| Computers & Mathematics | 647 (69.1%) | 290 (30.9%) |
| Architecture & Engineering | 249 (75.2%) | 82 (24.8%) |
| Life, Physical & Social Science | 34 (18.0%) | 155 (82.0%) |
| Community & Social Service | 1,818 (31.9%) | 3,880 (68.1%) |
| Education, Arts & Media | 479 (31.9%) | 1,022 (68.1%) |
| Legal Services & Support | 160 (34.5%) | 304 (65.5%) |
| Education Instruction & Library | 887 (27.2%) | 2,375 (72.8%) |
| Arts, Media & Entertainment | 292 (62.0%) | 179 (38.0%) |
| Health Diagnosing & Treating | 501 (19.7%) | 2,043 (80.3%) |
| Health Technologists | 206 (12.7%) | 1,414 (87.3%) |
| Total (Category) | 5,304 (36.1%) | 9,390 (63.9%) |
| Total (Overall) | 16,444 (45.0%) | 20,078 (55.0%) |
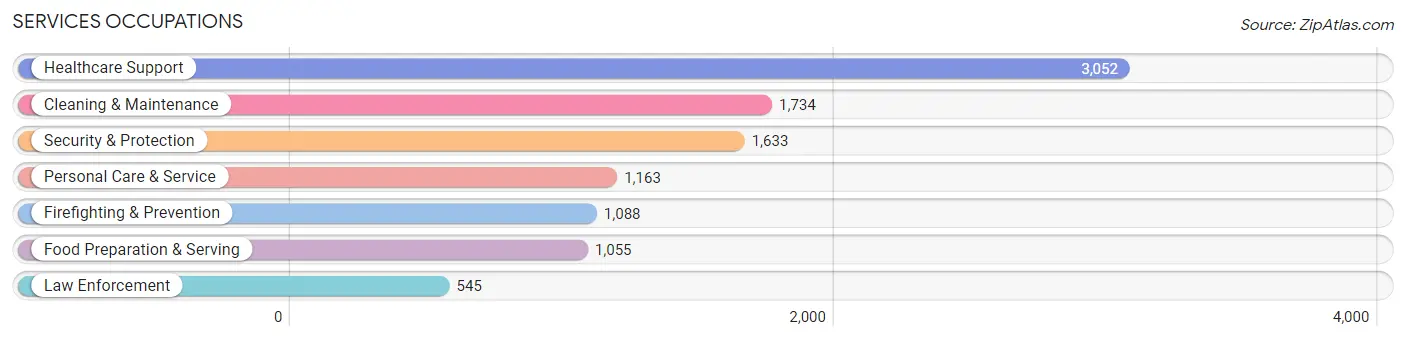
Services Occupations
The most common Services occupations in Mount Vernon are Healthcare Support (3,052 | 8.4%), Cleaning & Maintenance (1,734 | 4.8%), Security & Protection (1,633 | 4.5%), Personal Care & Service (1,163 | 3.2%), and Firefighting & Prevention (1,088 | 3.0%).
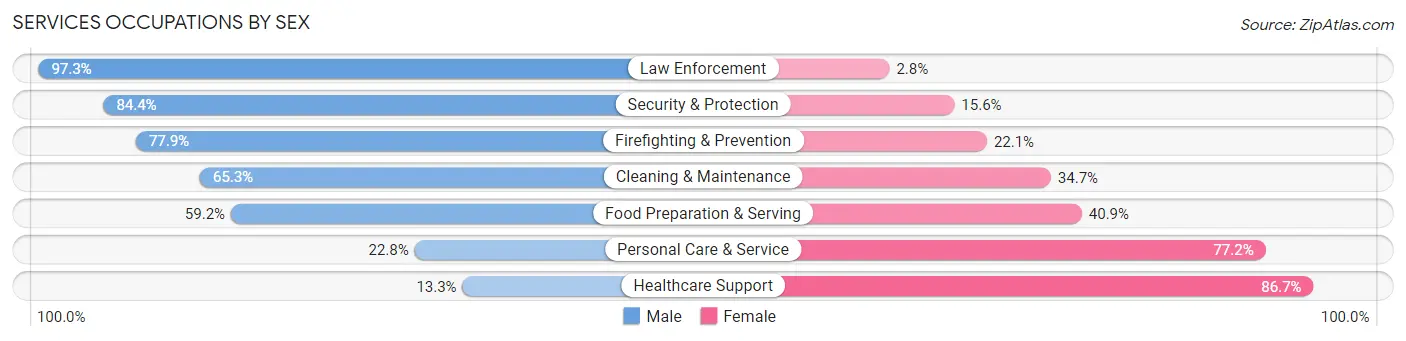
Services Occupations by Sex
Within the Services occupations in Mount Vernon, the most male-oriented occupations are Law Enforcement (97.3%), Security & Protection (84.4%), and Firefighting & Prevention (77.9%), while the most female-oriented occupations are Healthcare Support (86.7%), Personal Care & Service (77.2%), and Food Preparation & Serving (40.8%).
| Occupation | Male | Female |
| Healthcare Support | 406 (13.3%) | 2,646 (86.7%) |
| Security & Protection | 1,378 (84.4%) | 255 (15.6%) |
| Firefighting & Prevention | 848 (77.9%) | 240 (22.1%) |
| Law Enforcement | 530 (97.3%) | 15 (2.8%) |
| Food Preparation & Serving | 624 (59.2%) | 431 (40.8%) |
| Cleaning & Maintenance | 1,132 (65.3%) | 602 (34.7%) |
| Personal Care & Service | 265 (22.8%) | 898 (77.2%) |
| Total (Category) | 3,805 (44.1%) | 4,832 (55.9%) |
| Total (Overall) | 16,444 (45.0%) | 20,078 (55.0%) |
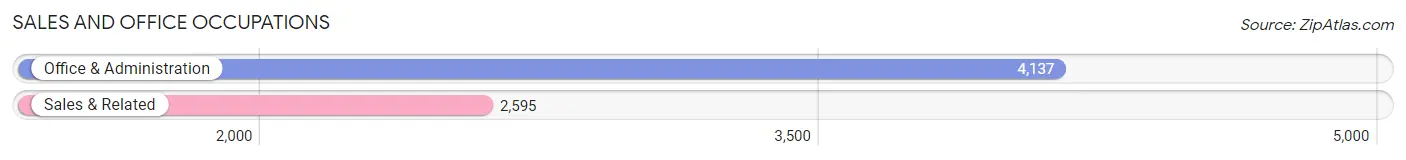
Sales and Office Occupations
The most common Sales and Office occupations in Mount Vernon are Office & Administration (4,137 | 11.3%), and Sales & Related (2,595 | 7.1%).
Sales and Office Occupations by Sex
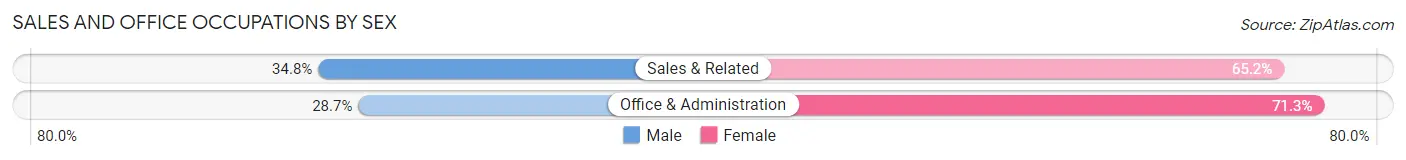
| Occupation | Male | Female |
| Sales & Related | 904 (34.8%) | 1,691 (65.2%) |
| Office & Administration | 1,186 (28.7%) | 2,951 (71.3%) |
| Total (Category) | 2,090 (31.0%) | 4,642 (69.0%) |
| Total (Overall) | 16,444 (45.0%) | 20,078 (55.0%) |
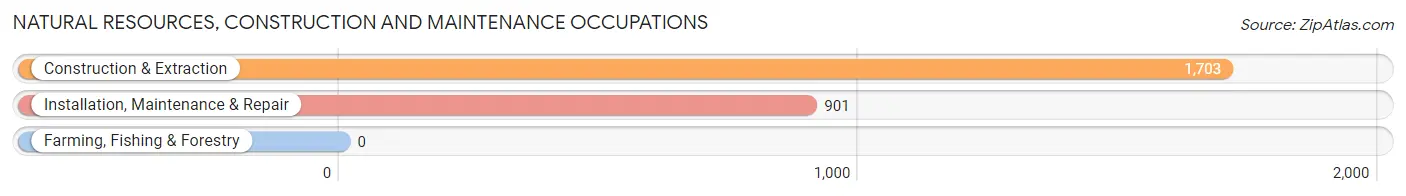
Natural Resources, Construction and Maintenance Occupations
The most common Natural Resources, Construction and Maintenance occupations in Mount Vernon are Construction & Extraction (1,703 | 4.7%), and Installation, Maintenance & Repair (901 | 2.5%).
Natural Resources, Construction and Maintenance Occupations by Sex
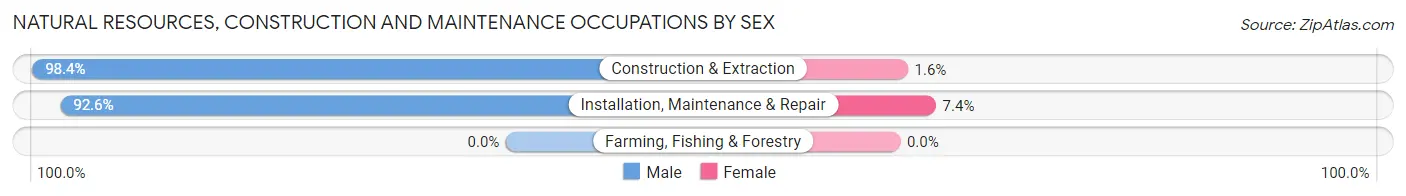
| Occupation | Male | Female |
| Farming, Fishing & Forestry | 0 (0.0%) | 0 (0.0%) |
| Construction & Extraction | 1,676 (98.4%) | 27 (1.6%) |
| Installation, Maintenance & Repair | 834 (92.6%) | 67 (7.4%) |
| Total (Category) | 2,510 (96.4%) | 94 (3.6%) |
| Total (Overall) | 16,444 (45.0%) | 20,078 (55.0%) |
Production, Transportation and Moving Occupations
The most common Production, Transportation and Moving occupations in Mount Vernon are Transportation (1,658 | 4.5%), Material Moving (1,261 | 3.5%), and Production (936 | 2.6%).
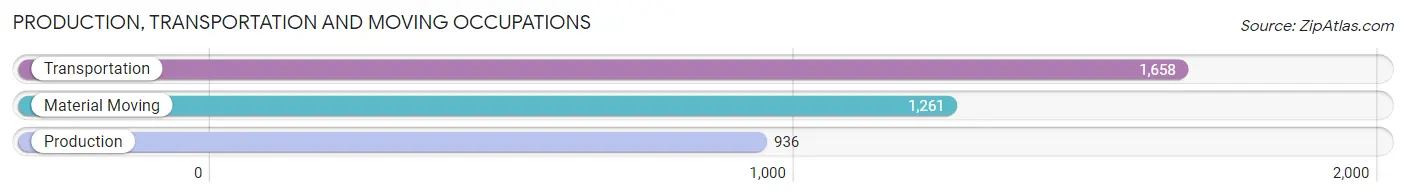
Production, Transportation and Moving Occupations by Sex
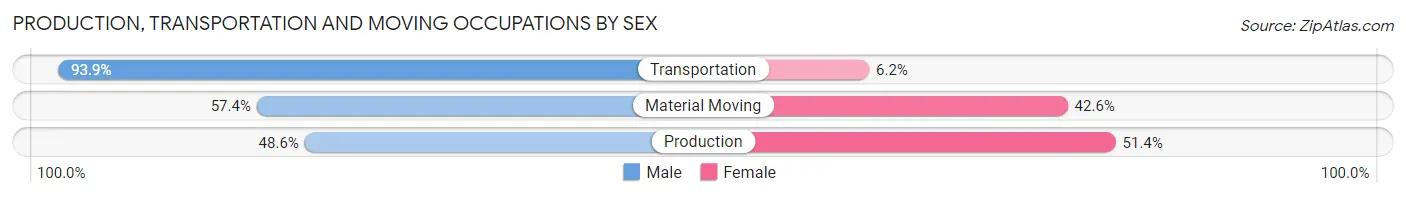
| Occupation | Male | Female |
| Production | 455 (48.6%) | 481 (51.4%) |
| Transportation | 1,556 (93.9%) | 102 (6.1%) |
| Material Moving | 724 (57.4%) | 537 (42.6%) |
| Total (Category) | 2,735 (71.0%) | 1,120 (29.0%) |
| Total (Overall) | 16,444 (45.0%) | 20,078 (55.0%) |
Employment Industries by Sex in Mount Vernon
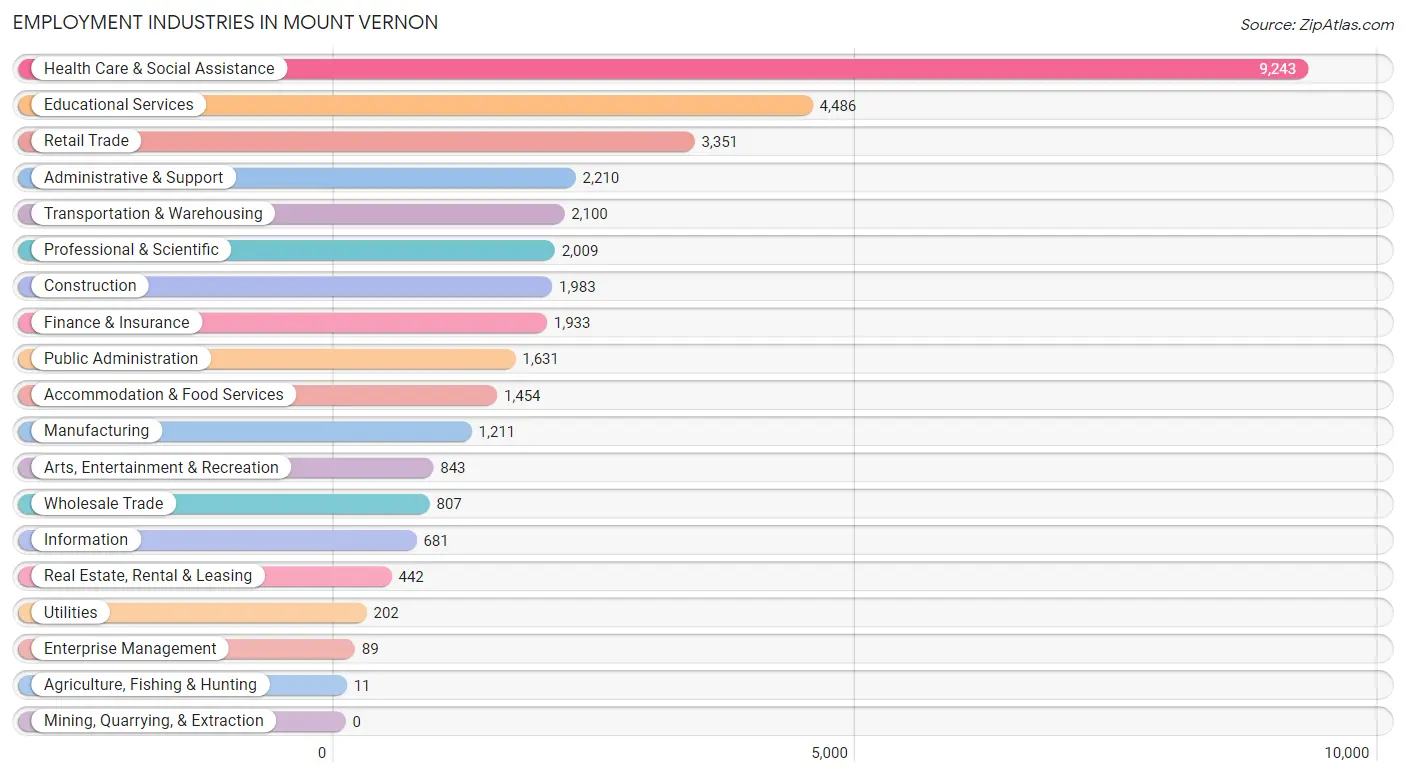
Employment Industries in Mount Vernon
The major employment industries in Mount Vernon include Health Care & Social Assistance (9,243 | 25.3%), Educational Services (4,486 | 12.3%), Retail Trade (3,351 | 9.2%), Administrative & Support (2,210 | 6.0%), and Transportation & Warehousing (2,100 | 5.8%).
Employment Industries by Sex in Mount Vernon
The Mount Vernon industries that see more men than women are Agriculture, Fishing & Hunting (100.0%), Utilities (100.0%), and Construction (96.1%), whereas the industries that tend to have a higher number of women are Enterprise Management (79.8%), Health Care & Social Assistance (79.7%), and Educational Services (65.3%).
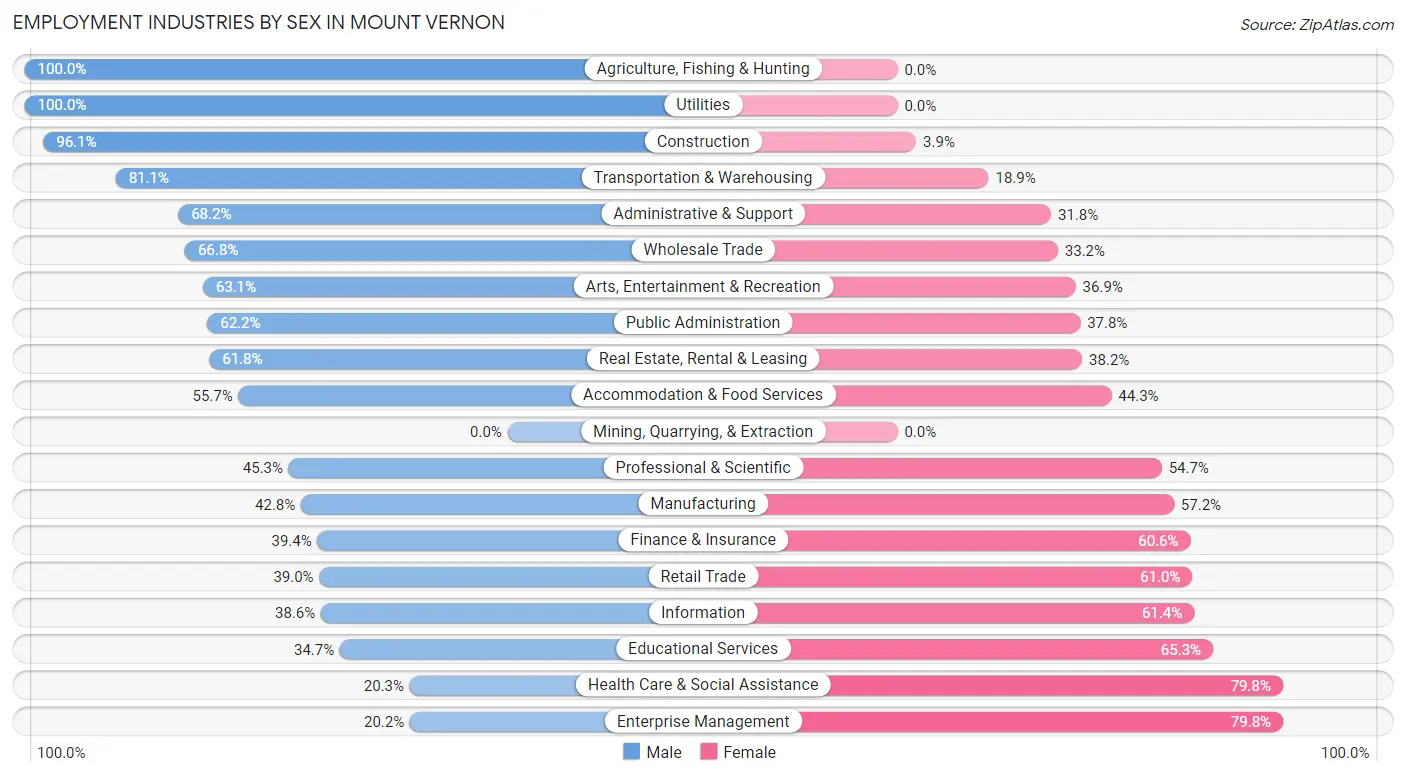
| Industry | Male | Female |
| Agriculture, Fishing & Hunting | 11 (100.0%) | 0 (0.0%) |
| Mining, Quarrying, & Extraction | 0 (0.0%) | 0 (0.0%) |
| Construction | 1,906 (96.1%) | 77 (3.9%) |
| Manufacturing | 518 (42.8%) | 693 (57.2%) |
| Wholesale Trade | 539 (66.8%) | 268 (33.2%) |
| Retail Trade | 1,306 (39.0%) | 2,045 (61.0%) |
| Transportation & Warehousing | 1,704 (81.1%) | 396 (18.9%) |
| Utilities | 202 (100.0%) | 0 (0.0%) |
| Information | 263 (38.6%) | 418 (61.4%) |
| Finance & Insurance | 761 (39.4%) | 1,172 (60.6%) |
| Real Estate, Rental & Leasing | 273 (61.8%) | 169 (38.2%) |
| Professional & Scientific | 910 (45.3%) | 1,099 (54.7%) |
| Enterprise Management | 18 (20.2%) | 71 (79.8%) |
| Administrative & Support | 1,507 (68.2%) | 703 (31.8%) |
| Educational Services | 1,557 (34.7%) | 2,929 (65.3%) |
| Health Care & Social Assistance | 1,872 (20.3%) | 7,371 (79.7%) |
| Arts, Entertainment & Recreation | 532 (63.1%) | 311 (36.9%) |
| Accommodation & Food Services | 810 (55.7%) | 644 (44.3%) |
| Public Administration | 1,014 (62.2%) | 617 (37.8%) |
| Total | 16,444 (45.0%) | 20,078 (55.0%) |
Education in Mount Vernon
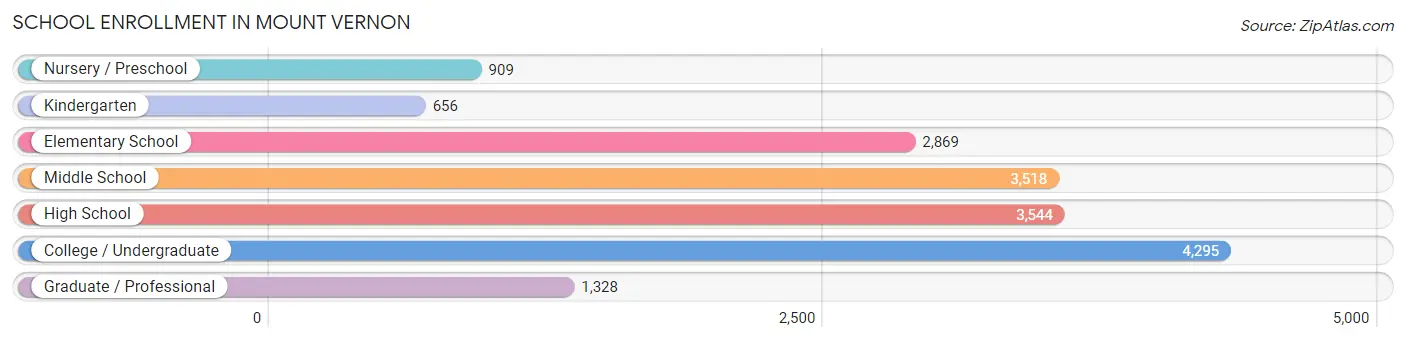
School Enrollment in Mount Vernon
The most common levels of schooling among the 17,119 students in Mount Vernon are college / undergraduate (4,295 | 25.1%), high school (3,544 | 20.7%), and middle school (3,518 | 20.5%).
| School Level | # Students | % Students |
| Nursery / Preschool | 909 | 5.3% |
| Kindergarten | 656 | 3.8% |
| Elementary School | 2,869 | 16.8% |
| Middle School | 3,518 | 20.5% |
| High School | 3,544 | 20.7% |
| College / Undergraduate | 4,295 | 25.1% |
| Graduate / Professional | 1,328 | 7.8% |
| Total | 17,119 | 100.0% |
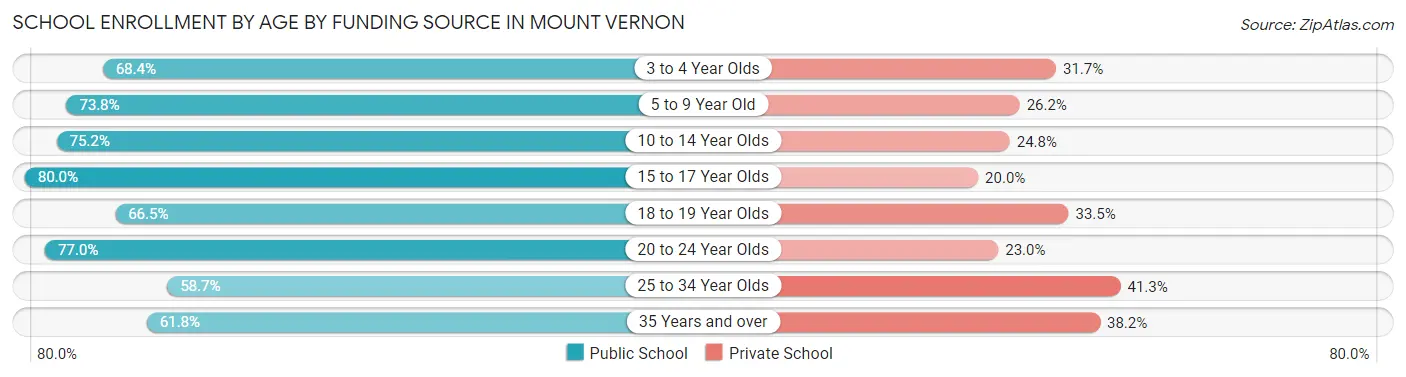
School Enrollment by Age by Funding Source in Mount Vernon
Out of a total of 17,119 students who are enrolled in schools in Mount Vernon, 4,776 (27.9%) attend a private institution, while the remaining 12,343 (72.1%) are enrolled in public schools. The age group of 25 to 34 year olds has the highest likelihood of being enrolled in private schools, with 682 (41.3% in the age bracket) enrolled. Conversely, the age group of 15 to 17 year olds has the lowest likelihood of being enrolled in a private school, with 1,899 (80.0% in the age bracket) attending a public institution.
| Age Bracket | Public School | Private School |
| 3 to 4 Year Olds | 447 (68.3%) | 207 (31.7%) |
| 5 to 9 Year Old | 2,568 (73.8%) | 913 (26.2%) |
| 10 to 14 Year Olds | 3,142 (75.2%) | 1,034 (24.8%) |
| 15 to 17 Year Olds | 1,899 (80.0%) | 476 (20.0%) |
| 18 to 19 Year Olds | 1,024 (66.5%) | 516 (33.5%) |
| 20 to 24 Year Olds | 1,466 (77.0%) | 439 (23.0%) |
| 25 to 34 Year Olds | 971 (58.7%) | 682 (41.3%) |
| 35 Years and over | 825 (61.8%) | 510 (38.2%) |
| Total | 12,343 (72.1%) | 4,776 (27.9%) |
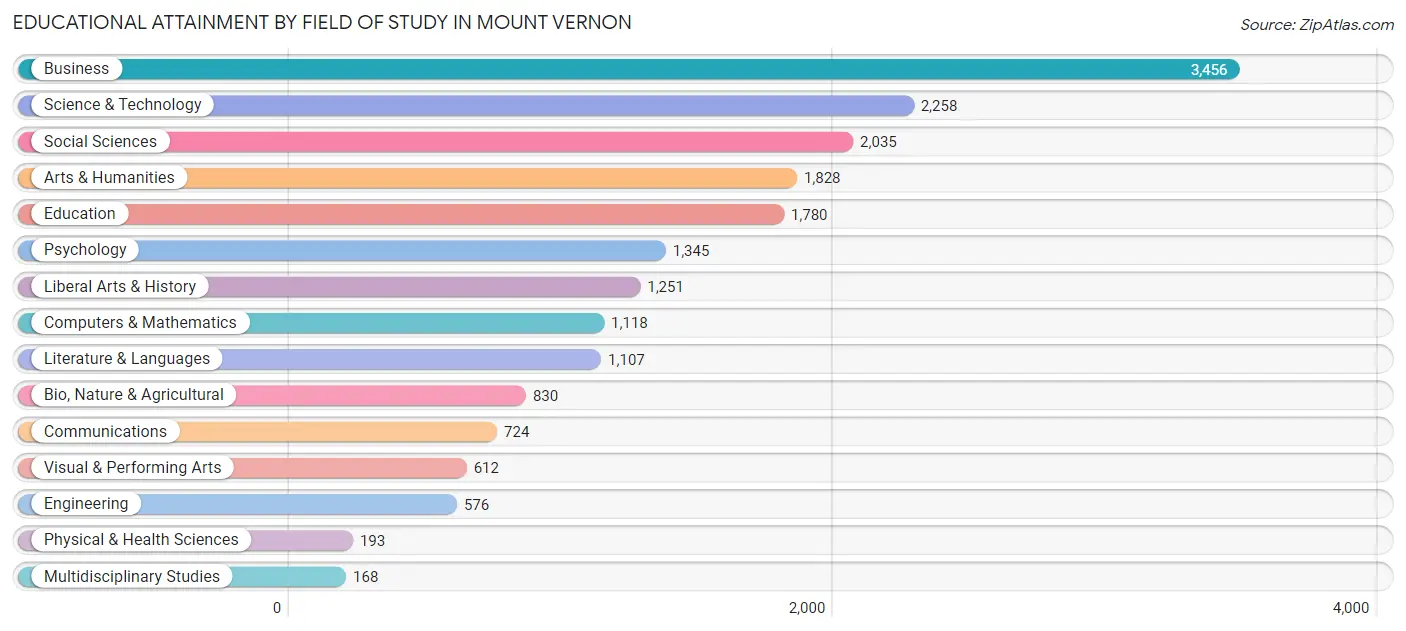
Educational Attainment by Field of Study in Mount Vernon
Business (3,456 | 17.9%), science & technology (2,258 | 11.7%), social sciences (2,035 | 10.5%), arts & humanities (1,828 | 9.5%), and education (1,780 | 9.2%) are the most common fields of study among 19,281 individuals in Mount Vernon who have obtained a bachelor's degree or higher.
| Field of Study | # Graduates | % Graduates |
| Computers & Mathematics | 1,118 | 5.8% |
| Bio, Nature & Agricultural | 830 | 4.3% |
| Physical & Health Sciences | 193 | 1.0% |
| Psychology | 1,345 | 7.0% |
| Social Sciences | 2,035 | 10.5% |
| Engineering | 576 | 3.0% |
| Multidisciplinary Studies | 168 | 0.9% |
| Science & Technology | 2,258 | 11.7% |
| Business | 3,456 | 17.9% |
| Education | 1,780 | 9.2% |
| Literature & Languages | 1,107 | 5.7% |
| Liberal Arts & History | 1,251 | 6.5% |
| Visual & Performing Arts | 612 | 3.2% |
| Communications | 724 | 3.7% |
| Arts & Humanities | 1,828 | 9.5% |
| Total | 19,281 | 100.0% |
Transportation & Commute in Mount Vernon
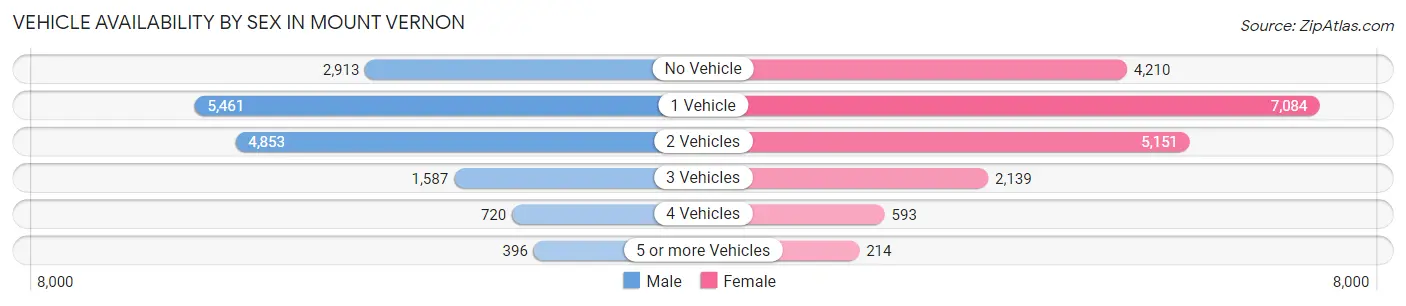
Vehicle Availability by Sex in Mount Vernon
The most prevalent vehicle ownership categories in Mount Vernon are males with 1 vehicle (5,461, accounting for 34.3%) and females with 1 vehicle (7,084, making up 28.2%).
| Vehicles Available | Male | Female |
| No Vehicle | 2,913 (18.3%) | 4,210 (21.7%) |
| 1 Vehicle | 5,461 (34.3%) | 7,084 (36.5%) |
| 2 Vehicles | 4,853 (30.5%) | 5,151 (26.6%) |
| 3 Vehicles | 1,587 (10.0%) | 2,139 (11.0%) |
| 4 Vehicles | 720 (4.5%) | 593 (3.1%) |
| 5 or more Vehicles | 396 (2.5%) | 214 (1.1%) |
| Total | 15,930 (100.0%) | 19,391 (100.0%) |
Commute Time in Mount Vernon
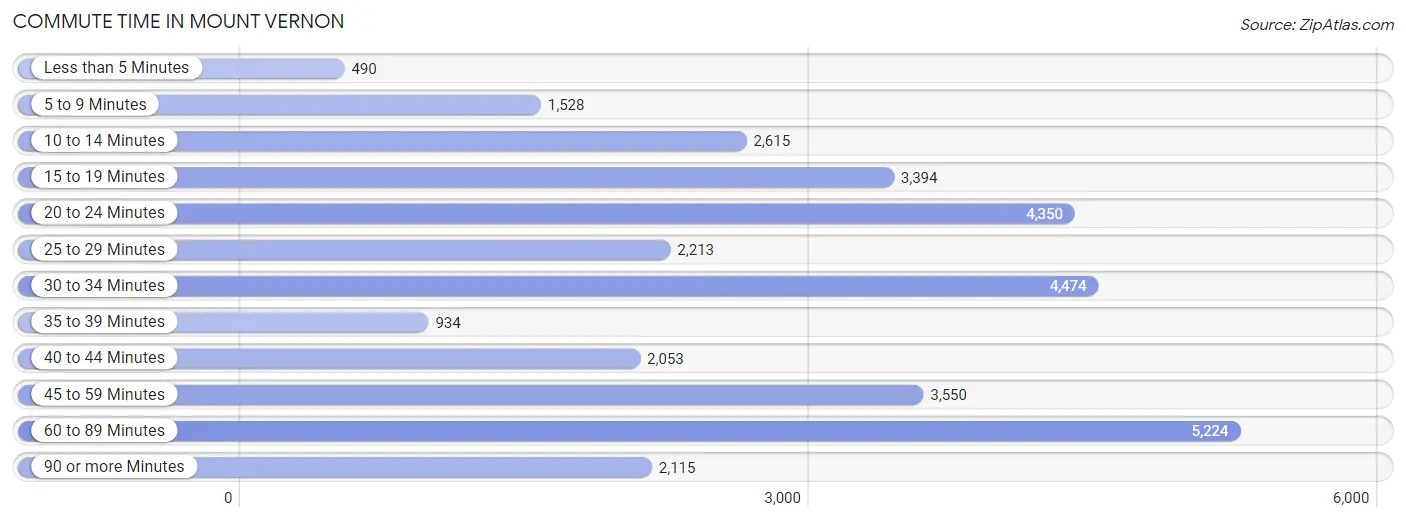
The most frequently occuring commute durations in Mount Vernon are 60 to 89 minutes (5,224 commuters, 15.9%), 30 to 34 minutes (4,474 commuters, 13.6%), and 20 to 24 minutes (4,350 commuters, 13.2%).
| Commute Time | # Commuters | % Commuters |
| Less than 5 Minutes | 490 | 1.5% |
| 5 to 9 Minutes | 1,528 | 4.6% |
| 10 to 14 Minutes | 2,615 | 7.9% |
| 15 to 19 Minutes | 3,394 | 10.3% |
| 20 to 24 Minutes | 4,350 | 13.2% |
| 25 to 29 Minutes | 2,213 | 6.7% |
| 30 to 34 Minutes | 4,474 | 13.6% |
| 35 to 39 Minutes | 934 | 2.8% |
| 40 to 44 Minutes | 2,053 | 6.2% |
| 45 to 59 Minutes | 3,550 | 10.8% |
| 60 to 89 Minutes | 5,224 | 15.9% |
| 90 or more Minutes | 2,115 | 6.4% |
Commute Time by Sex in Mount Vernon
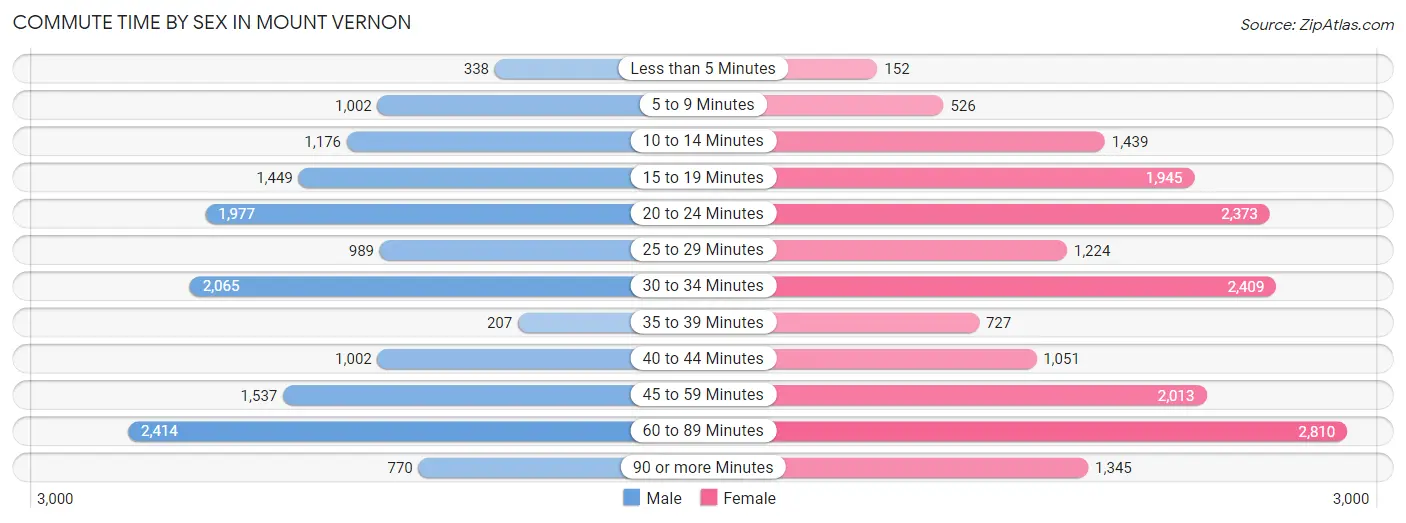
The most common commute times in Mount Vernon are 60 to 89 minutes (2,414 commuters, 16.2%) for males and 60 to 89 minutes (2,810 commuters, 15.6%) for females.
| Commute Time | Male | Female |
| Less than 5 Minutes | 338 (2.3%) | 152 (0.8%) |
| 5 to 9 Minutes | 1,002 (6.7%) | 526 (2.9%) |
| 10 to 14 Minutes | 1,176 (7.9%) | 1,439 (8.0%) |
| 15 to 19 Minutes | 1,449 (9.7%) | 1,945 (10.8%) |
| 20 to 24 Minutes | 1,977 (13.3%) | 2,373 (13.2%) |
| 25 to 29 Minutes | 989 (6.6%) | 1,224 (6.8%) |
| 30 to 34 Minutes | 2,065 (13.8%) | 2,409 (13.4%) |
| 35 to 39 Minutes | 207 (1.4%) | 727 (4.0%) |
| 40 to 44 Minutes | 1,002 (6.7%) | 1,051 (5.8%) |
| 45 to 59 Minutes | 1,537 (10.3%) | 2,013 (11.2%) |
| 60 to 89 Minutes | 2,414 (16.2%) | 2,810 (15.6%) |
| 90 or more Minutes | 770 (5.2%) | 1,345 (7.5%) |
Time of Departure to Work by Sex in Mount Vernon
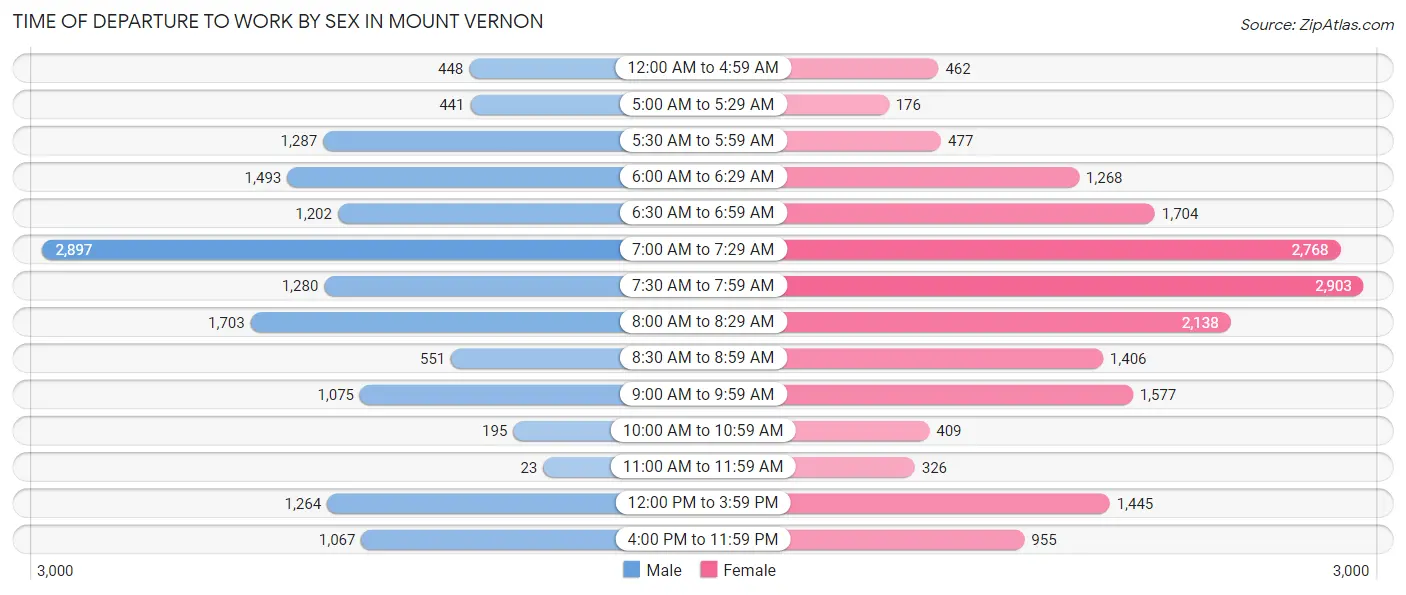
The most frequent times of departure to work in Mount Vernon are 7:00 AM to 7:29 AM (2,897, 19.4%) for males and 7:30 AM to 7:59 AM (2,903, 16.1%) for females.
| Time of Departure | Male | Female |
| 12:00 AM to 4:59 AM | 448 (3.0%) | 462 (2.6%) |
| 5:00 AM to 5:29 AM | 441 (2.9%) | 176 (1.0%) |
| 5:30 AM to 5:59 AM | 1,287 (8.6%) | 477 (2.6%) |
| 6:00 AM to 6:29 AM | 1,493 (10.0%) | 1,268 (7.0%) |
| 6:30 AM to 6:59 AM | 1,202 (8.1%) | 1,704 (9.5%) |
| 7:00 AM to 7:29 AM | 2,897 (19.4%) | 2,768 (15.4%) |
| 7:30 AM to 7:59 AM | 1,280 (8.6%) | 2,903 (16.1%) |
| 8:00 AM to 8:29 AM | 1,703 (11.4%) | 2,138 (11.9%) |
| 8:30 AM to 8:59 AM | 551 (3.7%) | 1,406 (7.8%) |
| 9:00 AM to 9:59 AM | 1,075 (7.2%) | 1,577 (8.7%) |
| 10:00 AM to 10:59 AM | 195 (1.3%) | 409 (2.3%) |
| 11:00 AM to 11:59 AM | 23 (0.2%) | 326 (1.8%) |
| 12:00 PM to 3:59 PM | 1,264 (8.5%) | 1,445 (8.0%) |
| 4:00 PM to 11:59 PM | 1,067 (7.1%) | 955 (5.3%) |
| Total | 14,926 (100.0%) | 18,014 (100.0%) |
Housing Occupancy in Mount Vernon
Occupancy by Ownership in Mount Vernon
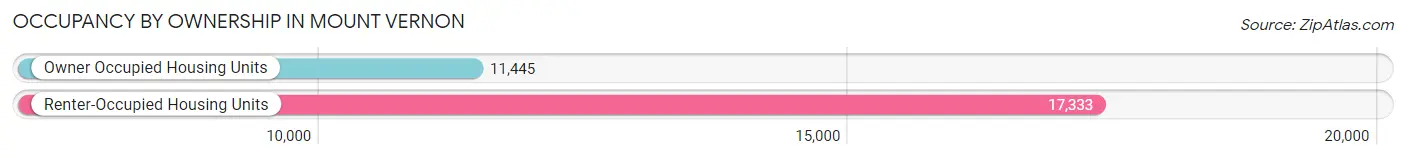
Of the total 28,778 dwellings in Mount Vernon, owner-occupied units account for 11,445 (39.8%), while renter-occupied units make up 17,333 (60.2%).
| Occupancy | # Housing Units | % Housing Units |
| Owner Occupied Housing Units | 11,445 | 39.8% |
| Renter-Occupied Housing Units | 17,333 | 60.2% |
| Total Occupied Housing Units | 28,778 | 100.0% |
Occupancy by Household Size in Mount Vernon
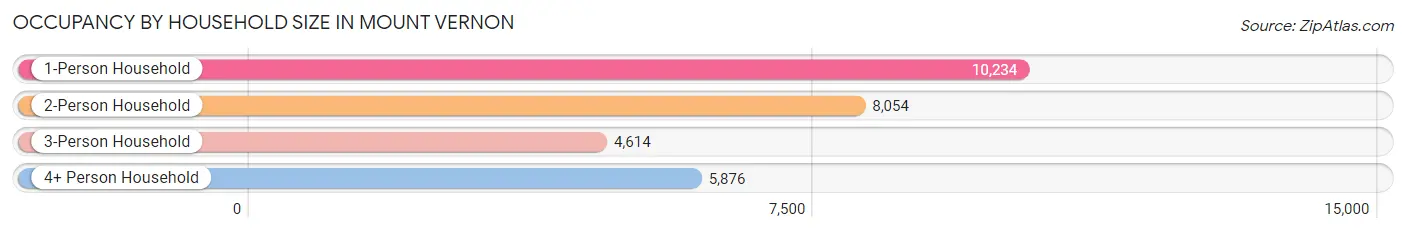
| Household Size | # Housing Units | % Housing Units |
| 1-Person Household | 10,234 | 35.6% |
| 2-Person Household | 8,054 | 28.0% |
| 3-Person Household | 4,614 | 16.0% |
| 4+ Person Household | 5,876 | 20.4% |
| Total Housing Units | 28,778 | 100.0% |
Occupancy by Ownership by Household Size in Mount Vernon
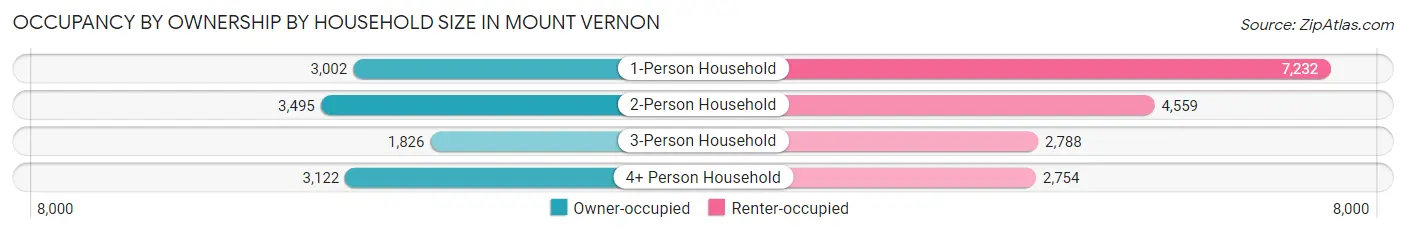
| Household Size | Owner-occupied | Renter-occupied |
| 1-Person Household | 3,002 (29.3%) | 7,232 (70.7%) |
| 2-Person Household | 3,495 (43.4%) | 4,559 (56.6%) |
| 3-Person Household | 1,826 (39.6%) | 2,788 (60.4%) |
| 4+ Person Household | 3,122 (53.1%) | 2,754 (46.9%) |
| Total Housing Units | 11,445 (39.8%) | 17,333 (60.2%) |
Occupancy by Educational Attainment in Mount Vernon
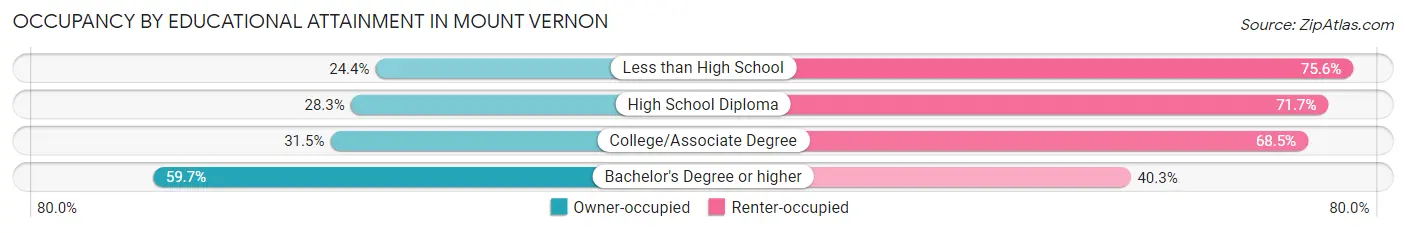
| Household Size | Owner-occupied | Renter-occupied |
| Less than High School | 986 (24.4%) | 3,060 (75.6%) |
| High School Diploma | 1,853 (28.3%) | 4,694 (71.7%) |
| College/Associate Degree | 2,512 (31.5%) | 5,458 (68.5%) |
| Bachelor's Degree or higher | 6,094 (59.7%) | 4,121 (40.3%) |
Occupancy by Age of Householder in Mount Vernon
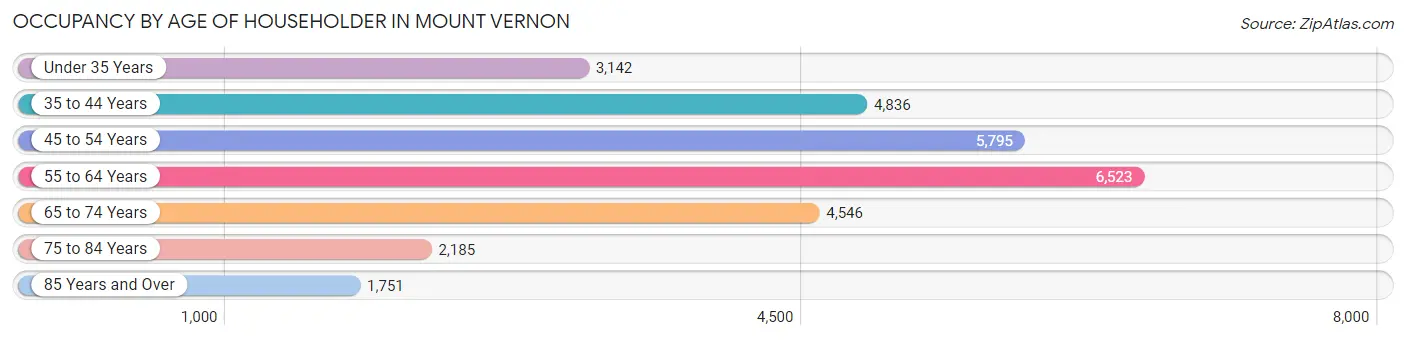
| Age Bracket | # Households | % Households |
| Under 35 Years | 3,142 | 10.9% |
| 35 to 44 Years | 4,836 | 16.8% |
| 45 to 54 Years | 5,795 | 20.1% |
| 55 to 64 Years | 6,523 | 22.7% |
| 65 to 74 Years | 4,546 | 15.8% |
| 75 to 84 Years | 2,185 | 7.6% |
| 85 Years and Over | 1,751 | 6.1% |
| Total | 28,778 | 100.0% |
Housing Finances in Mount Vernon
Median Income by Occupancy in Mount Vernon
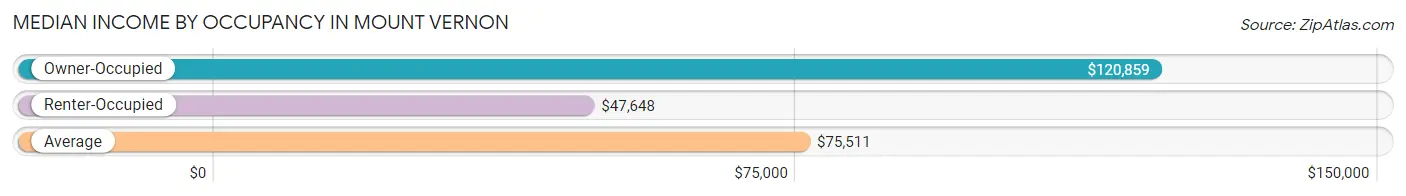
| Occupancy Type | # Households | Median Income |
| Owner-Occupied | 11,445 (39.8%) | $120,859 |
| Renter-Occupied | 17,333 (60.2%) | $47,648 |
| Average | 28,778 (100.0%) | $75,511 |
Occupancy by Householder Income Bracket in Mount Vernon
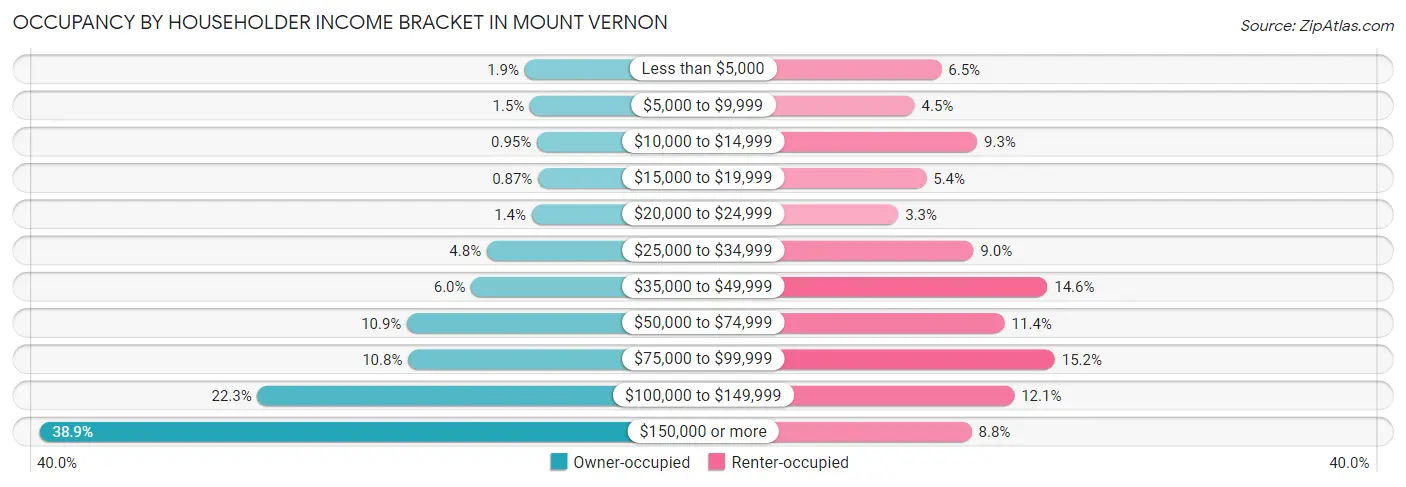
| Income Bracket | Owner-occupied | Renter-occupied |
| Less than $5,000 | 216 (1.9%) | 1,133 (6.5%) |
| $5,000 to $9,999 | 169 (1.5%) | 780 (4.5%) |
| $10,000 to $14,999 | 109 (0.9%) | 1,605 (9.3%) |
| $15,000 to $19,999 | 100 (0.9%) | 934 (5.4%) |
| $20,000 to $24,999 | 154 (1.3%) | 564 (3.3%) |
| $25,000 to $34,999 | 546 (4.8%) | 1,556 (9.0%) |
| $35,000 to $49,999 | 682 (6.0%) | 2,532 (14.6%) |
| $50,000 to $74,999 | 1,242 (10.8%) | 1,969 (11.4%) |
| $75,000 to $99,999 | 1,233 (10.8%) | 2,632 (15.2%) |
| $100,000 to $149,999 | 2,547 (22.3%) | 2,096 (12.1%) |
| $150,000 or more | 4,447 (38.9%) | 1,532 (8.8%) |
| Total | 11,445 (100.0%) | 17,333 (100.0%) |
Monthly Housing Cost Tiers in Mount Vernon
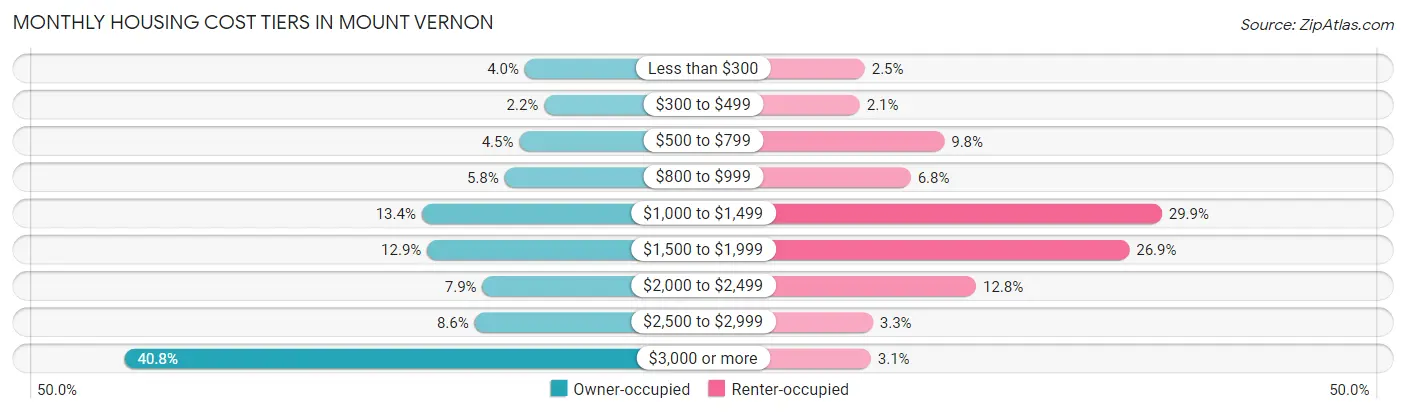
| Monthly Cost | Owner-occupied | Renter-occupied |
| Less than $300 | 452 (4.0%) | 436 (2.5%) |
| $300 to $499 | 248 (2.2%) | 357 (2.1%) |
| $500 to $799 | 511 (4.5%) | 1,705 (9.8%) |
| $800 to $999 | 665 (5.8%) | 1,170 (6.8%) |
| $1,000 to $1,499 | 1,538 (13.4%) | 5,176 (29.9%) |
| $1,500 to $1,999 | 1,481 (12.9%) | 4,657 (26.9%) |
| $2,000 to $2,499 | 899 (7.9%) | 2,211 (12.8%) |
| $2,500 to $2,999 | 982 (8.6%) | 565 (3.3%) |
| $3,000 or more | 4,669 (40.8%) | 534 (3.1%) |
| Total | 11,445 (100.0%) | 17,333 (100.0%) |
Physical Housing Characteristics in Mount Vernon
Housing Structures in Mount Vernon
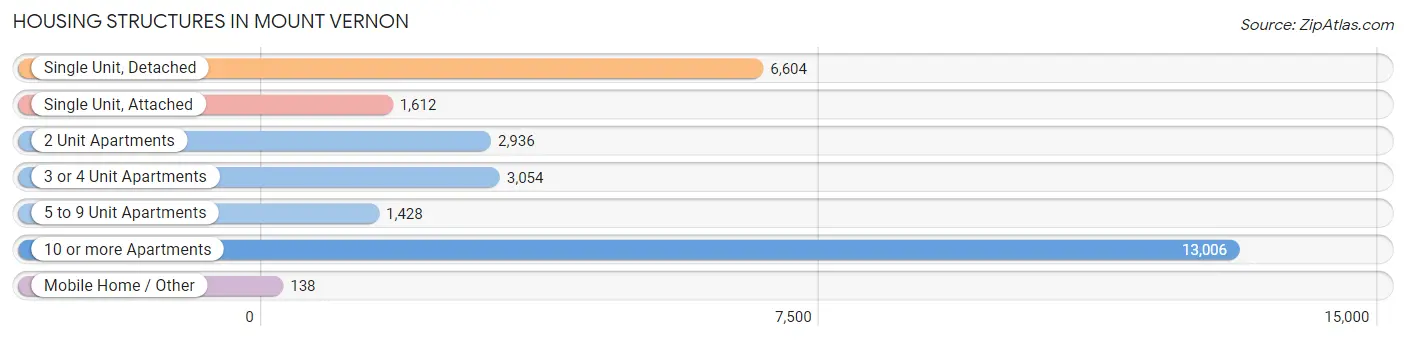
| Structure Type | # Housing Units | % Housing Units |
| Single Unit, Detached | 6,604 | 23.0% |
| Single Unit, Attached | 1,612 | 5.6% |
| 2 Unit Apartments | 2,936 | 10.2% |
| 3 or 4 Unit Apartments | 3,054 | 10.6% |
| 5 to 9 Unit Apartments | 1,428 | 5.0% |
| 10 or more Apartments | 13,006 | 45.2% |
| Mobile Home / Other | 138 | 0.5% |
| Total | 28,778 | 100.0% |
Housing Structures by Occupancy in Mount Vernon
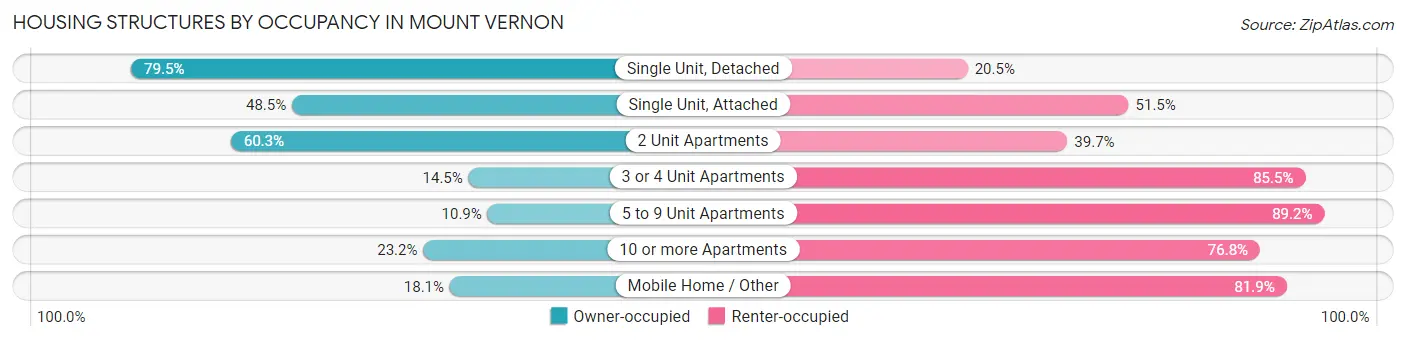
| Structure Type | Owner-occupied | Renter-occupied |
| Single Unit, Detached | 5,249 (79.5%) | 1,355 (20.5%) |
| Single Unit, Attached | 782 (48.5%) | 830 (51.5%) |
| 2 Unit Apartments | 1,770 (60.3%) | 1,166 (39.7%) |
| 3 or 4 Unit Apartments | 443 (14.5%) | 2,611 (85.5%) |
| 5 to 9 Unit Apartments | 155 (10.8%) | 1,273 (89.1%) |
| 10 or more Apartments | 3,021 (23.2%) | 9,985 (76.8%) |
| Mobile Home / Other | 25 (18.1%) | 113 (81.9%) |
| Total | 11,445 (39.8%) | 17,333 (60.2%) |
Housing Structures by Number of Rooms in Mount Vernon
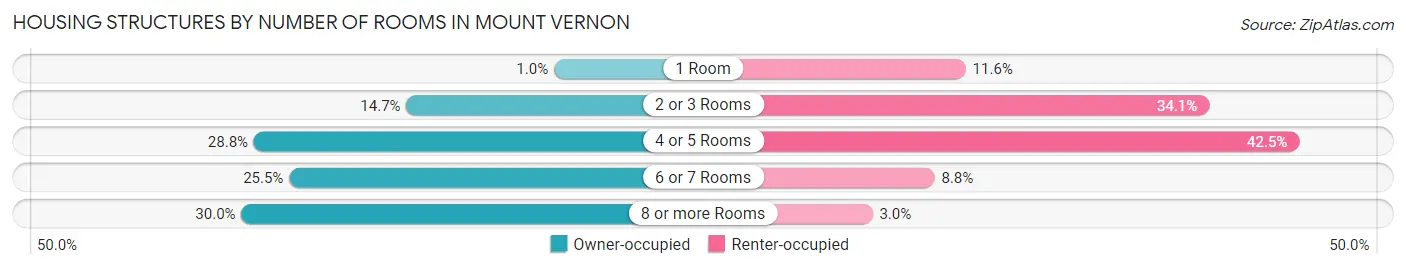
| Number of Rooms | Owner-occupied | Renter-occupied |
| 1 Room | 119 (1.0%) | 2,016 (11.6%) |
| 2 or 3 Rooms | 1,681 (14.7%) | 5,918 (34.1%) |
| 4 or 5 Rooms | 3,295 (28.8%) | 7,361 (42.5%) |
| 6 or 7 Rooms | 2,922 (25.5%) | 1,516 (8.7%) |
| 8 or more Rooms | 3,428 (29.9%) | 522 (3.0%) |
| Total | 11,445 (100.0%) | 17,333 (100.0%) |
Housing Structure by Heating Type in Mount Vernon
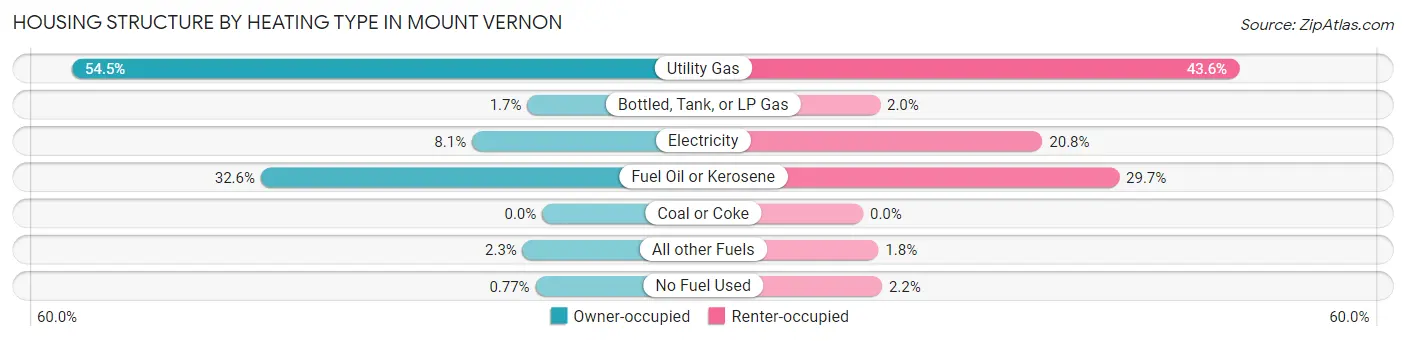
| Heating Type | Owner-occupied | Renter-occupied |
| Utility Gas | 6,239 (54.5%) | 7,553 (43.6%) |
| Bottled, Tank, or LP Gas | 197 (1.7%) | 341 (2.0%) |
| Electricity | 930 (8.1%) | 3,604 (20.8%) |
| Fuel Oil or Kerosene | 3,733 (32.6%) | 5,147 (29.7%) |
| Coal or Coke | 0 (0.0%) | 0 (0.0%) |
| All other Fuels | 258 (2.2%) | 309 (1.8%) |
| No Fuel Used | 88 (0.8%) | 379 (2.2%) |
| Total | 11,445 (100.0%) | 17,333 (100.0%) |
Household Vehicle Usage in Mount Vernon
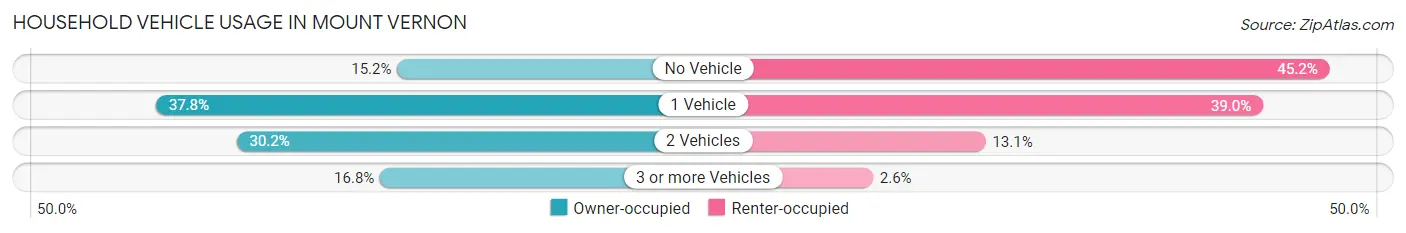
| Vehicles per Household | Owner-occupied | Renter-occupied |
| No Vehicle | 1,741 (15.2%) | 7,841 (45.2%) |
| 1 Vehicle | 4,321 (37.8%) | 6,765 (39.0%) |
| 2 Vehicles | 3,459 (30.2%) | 2,274 (13.1%) |
| 3 or more Vehicles | 1,924 (16.8%) | 453 (2.6%) |
| Total | 11,445 (100.0%) | 17,333 (100.0%) |
Real Estate & Mortgages in Mount Vernon
Real Estate and Mortgage Overview in Mount Vernon
| Characteristic | Without Mortgage | With Mortgage |
| Housing Units | 3,749 | 7,696 |
| Median Property Value | $387,900 | $469,000 |
| Median Household Income | $95,554 | $3,352 |
| Monthly Housing Costs | $1,388 | $4,583 |
| Real Estate Taxes | $10,001 | $620 |
Property Value by Mortgage Status in Mount Vernon
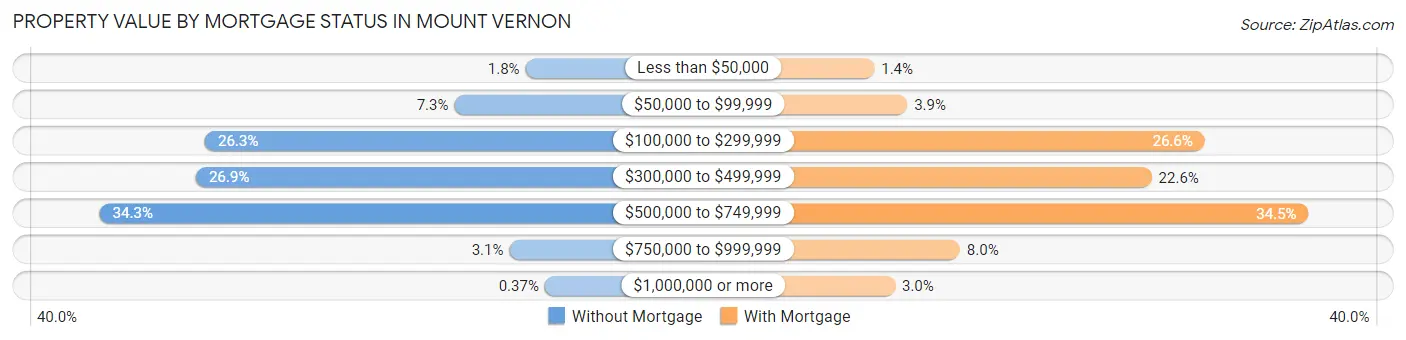
| Property Value | Without Mortgage | With Mortgage |
| Less than $50,000 | 69 (1.8%) | 110 (1.4%) |
| $50,000 to $99,999 | 272 (7.3%) | 303 (3.9%) |
| $100,000 to $299,999 | 984 (26.3%) | 2,048 (26.6%) |
| $300,000 to $499,999 | 1,010 (26.9%) | 1,736 (22.6%) |
| $500,000 to $749,999 | 1,285 (34.3%) | 2,655 (34.5%) |
| $750,000 to $999,999 | 115 (3.1%) | 612 (8.0%) |
| $1,000,000 or more | 14 (0.4%) | 232 (3.0%) |
| Total | 3,749 (100.0%) | 7,696 (100.0%) |
Household Income by Mortgage Status in Mount Vernon
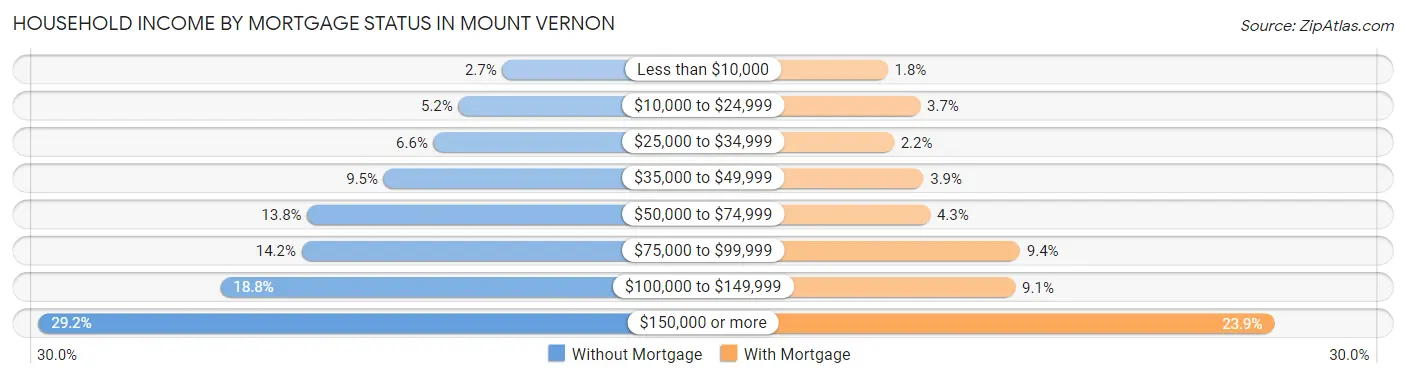
| Household Income | Without Mortgage | With Mortgage |
| Less than $10,000 | 101 (2.7%) | 141 (1.8%) |
| $10,000 to $24,999 | 195 (5.2%) | 284 (3.7%) |
| $25,000 to $34,999 | 248 (6.6%) | 168 (2.2%) |
| $35,000 to $49,999 | 355 (9.5%) | 298 (3.9%) |
| $50,000 to $74,999 | 519 (13.8%) | 327 (4.3%) |
| $75,000 to $99,999 | 531 (14.2%) | 723 (9.4%) |
| $100,000 to $149,999 | 705 (18.8%) | 702 (9.1%) |
| $150,000 or more | 1,095 (29.2%) | 1,842 (23.9%) |
| Total | 3,749 (100.0%) | 7,696 (100.0%) |
Property Value to Household Income Ratio in Mount Vernon
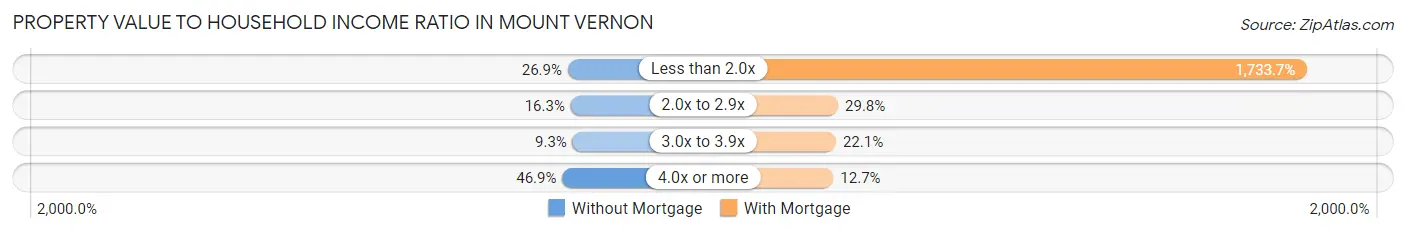
| Value-to-Income Ratio | Without Mortgage | With Mortgage |
| Less than 2.0x | 1,010 (26.9%) | 133,425 (1,733.7%) |
| 2.0x to 2.9x | 610 (16.3%) | 2,290 (29.8%) |
| 3.0x to 3.9x | 348 (9.3%) | 1,699 (22.1%) |
| 4.0x or more | 1,759 (46.9%) | 974 (12.7%) |
| Total | 3,749 (100.0%) | 7,696 (100.0%) |
Real Estate Taxes by Mortgage Status in Mount Vernon
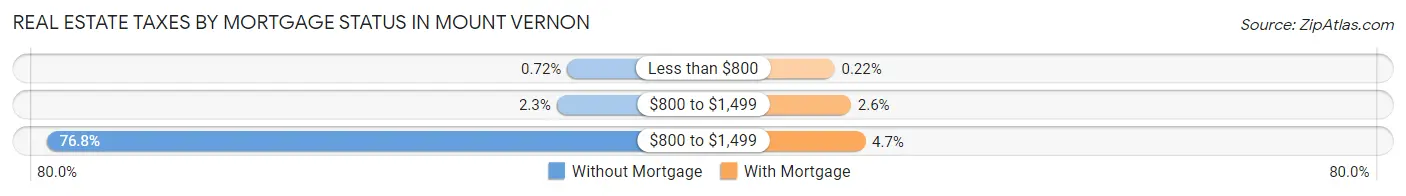
| Property Taxes | Without Mortgage | With Mortgage |
| Less than $800 | 27 (0.7%) | 17 (0.2%) |
| $800 to $1,499 | 85 (2.3%) | 200 (2.6%) |
| $800 to $1,499 | 2,879 (76.8%) | 360 (4.7%) |
| Total | 3,749 (100.0%) | 7,696 (100.0%) |
Health & Disability in Mount Vernon
Health Insurance Coverage by Age in Mount Vernon
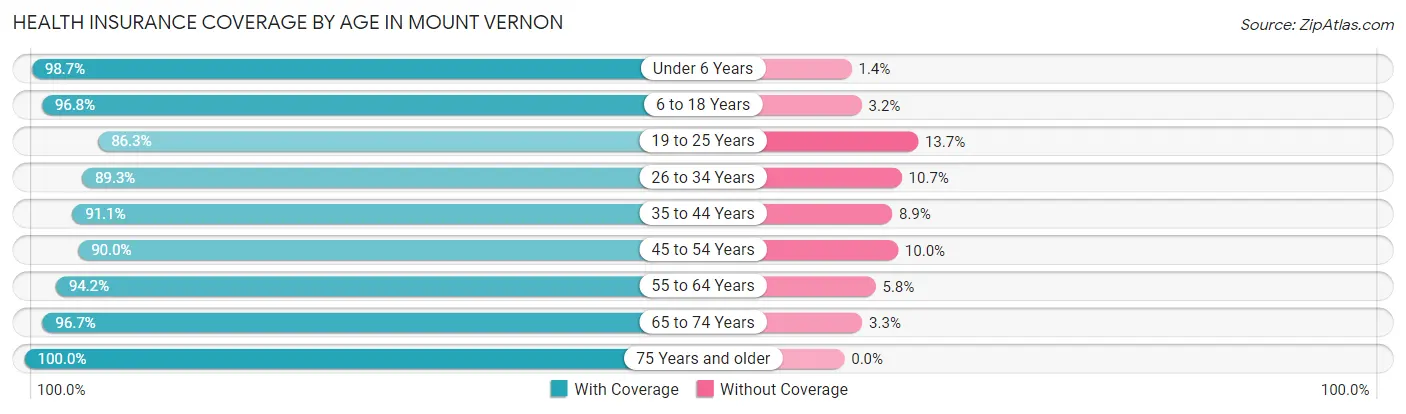
| Age Bracket | With Coverage | Without Coverage |
| Under 6 Years | 4,319 (98.7%) | 59 (1.3%) |
| 6 to 18 Years | 10,368 (96.8%) | 346 (3.2%) |
| 19 to 25 Years | 4,909 (86.3%) | 782 (13.7%) |
| 26 to 34 Years | 8,153 (89.3%) | 977 (10.7%) |
| 35 to 44 Years | 9,029 (91.1%) | 882 (8.9%) |
| 45 to 54 Years | 9,288 (90.0%) | 1,032 (10.0%) |
| 55 to 64 Years | 9,533 (94.2%) | 590 (5.8%) |
| 65 to 74 Years | 6,235 (96.7%) | 215 (3.3%) |
| 75 Years and older | 5,480 (100.0%) | 0 (0.0%) |
| Total | 67,314 (93.2%) | 4,883 (6.8%) |
Health Insurance Coverage by Citizenship Status in Mount Vernon
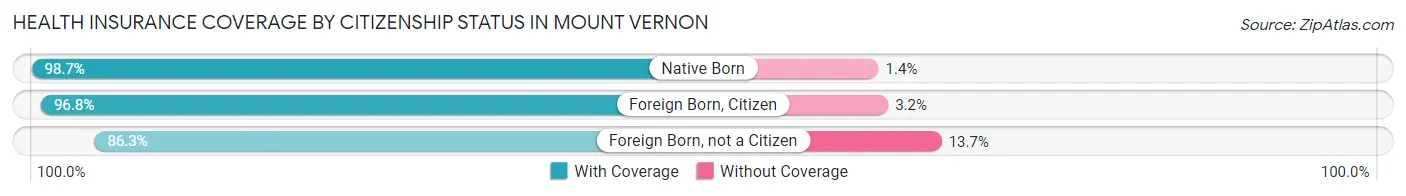
| Citizenship Status | With Coverage | Without Coverage |
| Native Born | 4,319 (98.7%) | 59 (1.3%) |
| Foreign Born, Citizen | 10,368 (96.8%) | 346 (3.2%) |
| Foreign Born, not a Citizen | 4,909 (86.3%) | 782 (13.7%) |
Health Insurance Coverage by Household Income in Mount Vernon
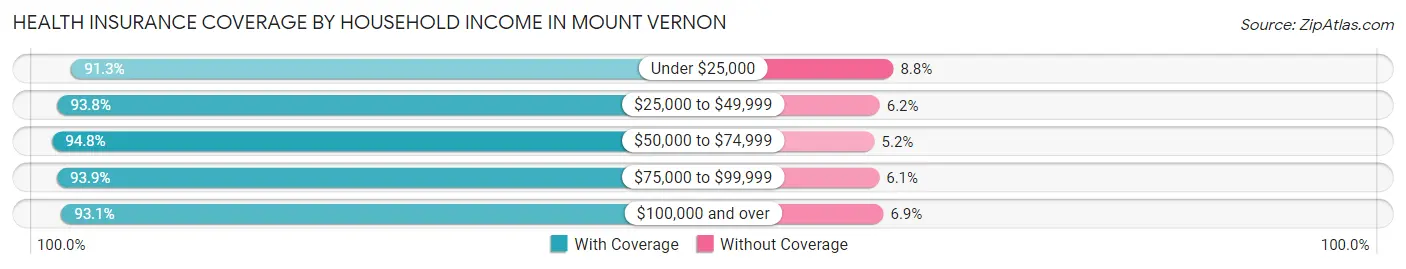
| Household Income | With Coverage | Without Coverage |
| Under $25,000 | 8,879 (91.2%) | 851 (8.7%) |
| $25,000 to $49,999 | 9,314 (93.8%) | 613 (6.2%) |
| $50,000 to $74,999 | 6,800 (94.8%) | 374 (5.2%) |
| $75,000 to $99,999 | 9,031 (93.9%) | 586 (6.1%) |
| $100,000 and over | 33,004 (93.1%) | 2,437 (6.9%) |
Public vs Private Health Insurance Coverage by Age in Mount Vernon
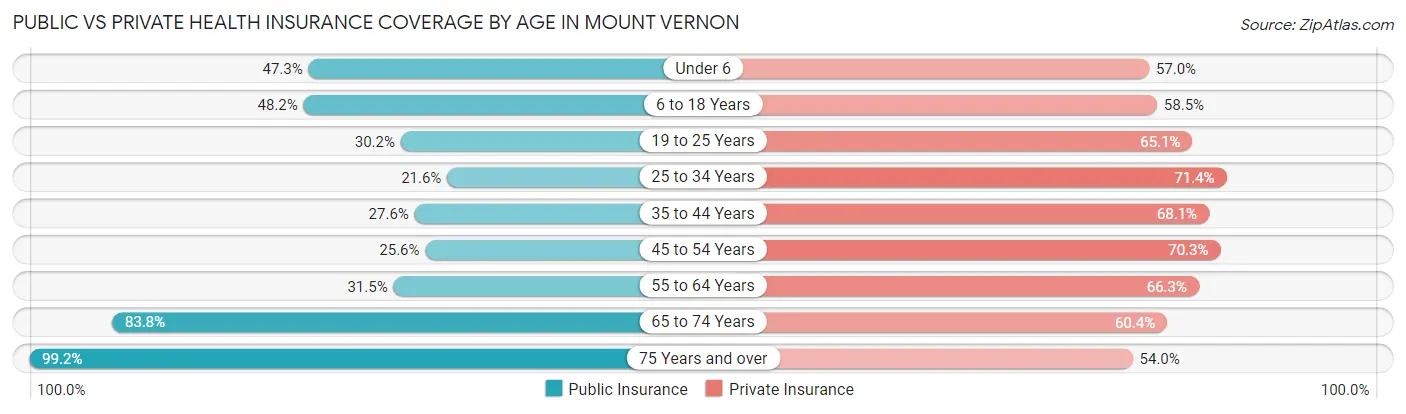
| Age Bracket | Public Insurance | Private Insurance |
| Under 6 | 2,071 (47.3%) | 2,496 (57.0%) |
| 6 to 18 Years | 5,167 (48.2%) | 6,267 (58.5%) |
| 19 to 25 Years | 1,717 (30.2%) | 3,703 (65.1%) |
| 25 to 34 Years | 1,968 (21.6%) | 6,518 (71.4%) |
| 35 to 44 Years | 2,735 (27.6%) | 6,753 (68.1%) |
| 45 to 54 Years | 2,643 (25.6%) | 7,250 (70.3%) |
| 55 to 64 Years | 3,192 (31.5%) | 6,708 (66.3%) |
| 65 to 74 Years | 5,405 (83.8%) | 3,893 (60.4%) |
| 75 Years and over | 5,434 (99.2%) | 2,958 (54.0%) |
| Total | 30,332 (42.0%) | 46,546 (64.5%) |
Disability Status by Sex by Age in Mount Vernon
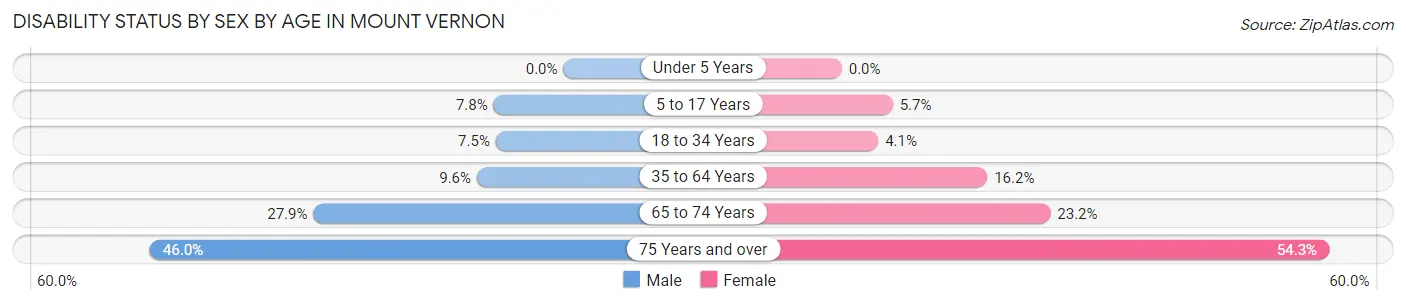
| Age Bracket | Male | Female |
| Under 5 Years | 0 (0.0%) | 0 (0.0%) |
| 5 to 17 Years | 389 (7.8%) | 309 (5.7%) |
| 18 to 34 Years | 533 (7.5%) | 357 (4.1%) |
| 35 to 64 Years | 1,328 (9.6%) | 2,682 (16.2%) |
| 65 to 74 Years | 782 (27.9%) | 846 (23.2%) |
| 75 Years and over | 756 (46.0%) | 2,082 (54.2%) |
Disability Class by Sex by Age in Mount Vernon
Disability Class: Hearing Difficulty
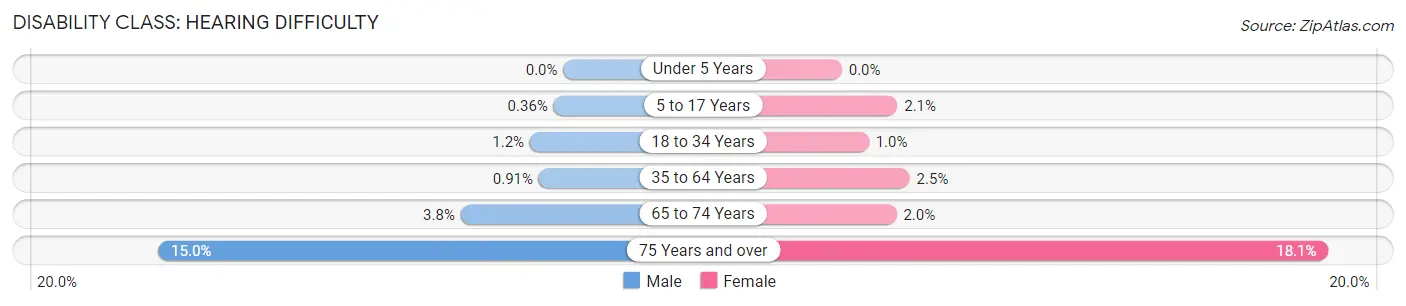
| Age Bracket | Male | Female |
| Under 5 Years | 0 (0.0%) | 0 (0.0%) |
| 5 to 17 Years | 18 (0.4%) | 112 (2.1%) |
| 18 to 34 Years | 88 (1.2%) | 88 (1.0%) |
| 35 to 64 Years | 126 (0.9%) | 418 (2.5%) |
| 65 to 74 Years | 107 (3.8%) | 74 (2.0%) |
| 75 Years and over | 247 (15.0%) | 693 (18.1%) |
Disability Class: Vision Difficulty
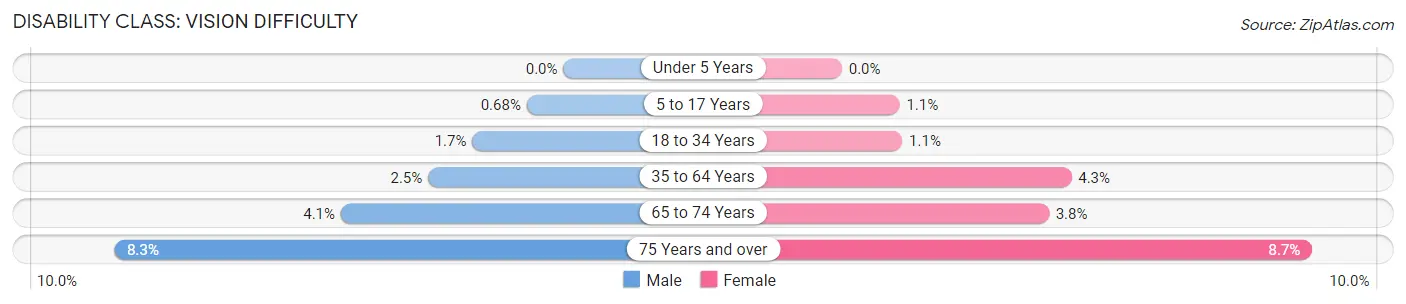
| Age Bracket | Male | Female |
| Under 5 Years | 0 (0.0%) | 0 (0.0%) |
| 5 to 17 Years | 34 (0.7%) | 58 (1.1%) |
| 18 to 34 Years | 120 (1.7%) | 98 (1.1%) |
| 35 to 64 Years | 346 (2.5%) | 706 (4.3%) |
| 65 to 74 Years | 116 (4.1%) | 140 (3.8%) |
| 75 Years and over | 137 (8.3%) | 335 (8.7%) |
Disability Class: Cognitive Difficulty
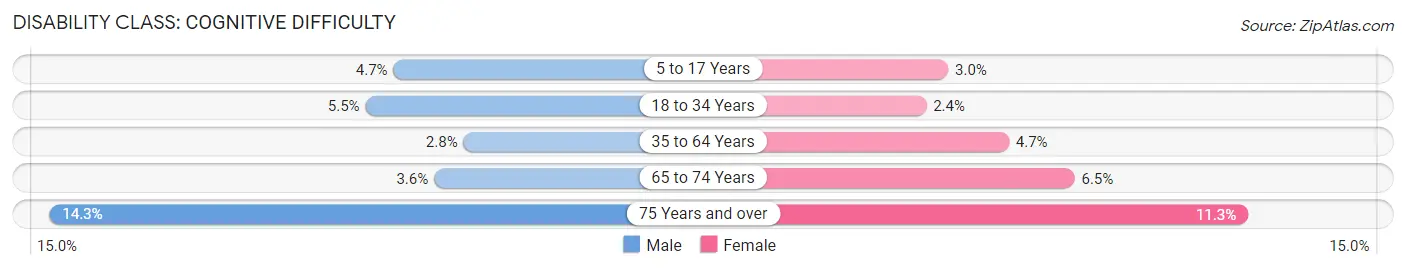
| Age Bracket | Male | Female |
| 5 to 17 Years | 237 (4.7%) | 161 (3.0%) |
| 18 to 34 Years | 390 (5.5%) | 206 (2.4%) |
| 35 to 64 Years | 384 (2.8%) | 770 (4.6%) |
| 65 to 74 Years | 101 (3.6%) | 236 (6.5%) |
| 75 Years and over | 235 (14.3%) | 434 (11.3%) |
Disability Class: Ambulatory Difficulty
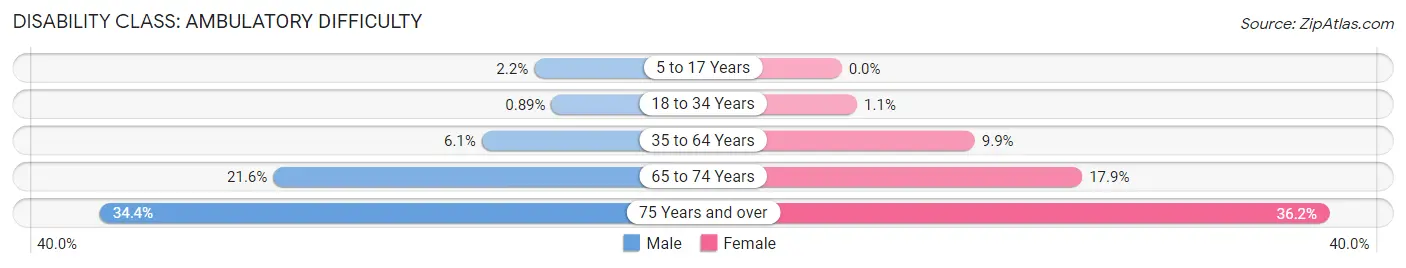
| Age Bracket | Male | Female |
| 5 to 17 Years | 109 (2.2%) | 0 (0.0%) |
| 18 to 34 Years | 63 (0.9%) | 100 (1.1%) |
| 35 to 64 Years | 837 (6.1%) | 1,636 (9.9%) |
| 65 to 74 Years | 605 (21.5%) | 650 (17.8%) |
| 75 Years and over | 565 (34.4%) | 1,388 (36.2%) |
Disability Class: Self-Care Difficulty
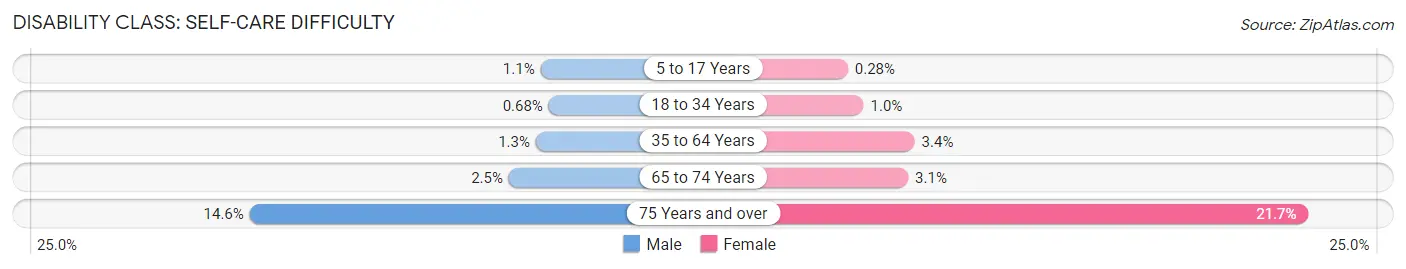
| Age Bracket | Male | Female |
| 5 to 17 Years | 53 (1.1%) | 15 (0.3%) |
| 18 to 34 Years | 48 (0.7%) | 89 (1.0%) |
| 35 to 64 Years | 176 (1.3%) | 559 (3.4%) |
| 65 to 74 Years | 71 (2.5%) | 112 (3.1%) |
| 75 Years and over | 239 (14.6%) | 831 (21.6%) |
Technology Access in Mount Vernon
Computing Device Access in Mount Vernon
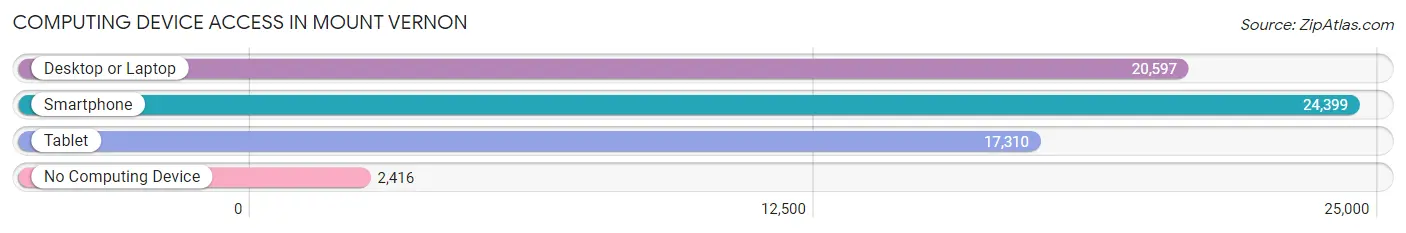
| Device Type | # Households | % Households |
| Desktop or Laptop | 20,597 | 71.6% |
| Smartphone | 24,399 | 84.8% |
| Tablet | 17,310 | 60.2% |
| No Computing Device | 2,416 | 8.4% |
| Total | 28,778 | 100.0% |
Internet Access in Mount Vernon
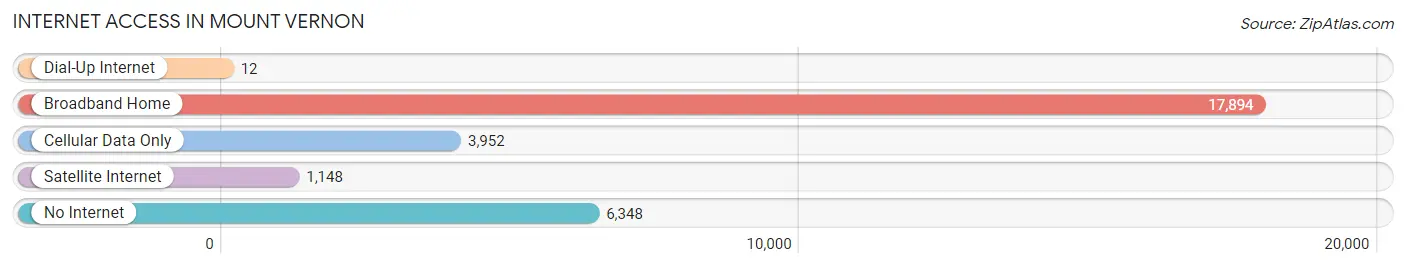
| Internet Type | # Households | % Households |
| Dial-Up Internet | 12 | 0.0% |
| Broadband Home | 17,894 | 62.2% |
| Cellular Data Only | 3,952 | 13.7% |
| Satellite Internet | 1,148 | 4.0% |
| No Internet | 6,348 | 22.1% |
| Total | 28,778 | 100.0% |
Mount Vernon Summary
Introduction
Mount Vernon is a city located in Westchester County, New York, United States. It is situated just north of the Bronx and is part of the New York metropolitan area. The city has a population of approximately 68,000 people and is the seventh-largest city in the state. Mount Vernon is known for its rich history, diverse culture, and vibrant economy.
History
Mount Vernon was first settled in 1664 by John Richbell, an Englishman who purchased the land from the Native Americans. The city was named after George Washington’s Virginia estate, Mount Vernon. In 1776, the city was incorporated as a village and in 1892, it was incorporated as a city.
Throughout the 19th century, Mount Vernon experienced rapid growth and development. The city was a major industrial center, with factories producing textiles, paper, and other goods. The city also became a major transportation hub, with the New York Central Railroad running through it.
In the 20th century, Mount Vernon continued to grow and develop. The city was home to a number of prominent figures, including the first African-American mayor of a major city, Thomas J. Watson. The city also became a major center for the arts, with the opening of the Mount Vernon Music Hall in 1921.
Geography
Mount Vernon is located in Westchester County, New York, approximately 15 miles north of Manhattan. The city is situated on the Hutchinson River and is bordered by the Bronx to the south and Yonkers to the north. The city covers an area of 4.4 square miles and has a population density of 15,000 people per square mile.
The city is divided into five distinct neighborhoods: Fleetwood, Mount Vernon Heights, North Side, South Side, and West Side. Each neighborhood has its own unique character and is home to a variety of businesses, restaurants, and other attractions.
Economy
Mount Vernon has a vibrant economy that is driven by a variety of industries. The city is home to a number of large corporations, including PepsiCo, Unilever, and Nestle. The city is also home to a number of small businesses, including restaurants, retail stores, and professional services.
The city is also home to a number of educational institutions, including the College of Mount Saint Vincent, the Westchester Community College, and the Mount Vernon Public Library.
Demographics
As of the 2010 census, the population of Mount Vernon was 68,381. The city has a diverse population, with a majority of African-American residents (54.3%) and a significant Hispanic population (25.2%). The city also has a significant white population (14.2%) and a small Asian population (3.2%).
The median household income in Mount Vernon is $45,845, which is slightly lower than the national average. The city also has a higher poverty rate than the national average, with 22.3% of the population living below the poverty line.
Conclusion
Mount Vernon is a vibrant city located in Westchester County, New York. The city has a rich history, diverse culture, and vibrant economy. The city is home to a diverse population and is a major center for the arts. Mount Vernon is a great place to live, work, and visit.
Common Questions
What is the Total Population of Mount Vernon?
Total Population of Mount Vernon is 72,817.
What is the Total Male Population of Mount Vernon?
Total Male Population of Mount Vernon is 32,451.
What is the Total Female Population of Mount Vernon?
Total Female Population of Mount Vernon is 40,366.
What is the Ratio of Males per 100 Females in Mount Vernon?
There are 80.39 Males per 100 Females in Mount Vernon.
What is the Ratio of Females per 100 Males in Mount Vernon?
There are 124.39 Females per 100 Males in Mount Vernon.
What is the Median Population Age in Mount Vernon?
Median Population Age in Mount Vernon is 41.4 Years.
What is the Average Family Size in Mount Vernon
Average Family Size in Mount Vernon is 3.3 People.
What is the Average Household Size in Mount Vernon
Average Household Size in Mount Vernon is 2.5 People.
What is Per Capita Income in Mount Vernon?
Per Capita income in Mount Vernon is $40,288.
What is the Median Family Income in Mount Vernon?
Median Family Income in Mount Vernon is $99,636.
What is the Median Household income in Mount Vernon?
Median Household Income in Mount Vernon is $75,511.
What is Income or Wage Gap in Mount Vernon?
Income or Wage Gap in Mount Vernon is 12.3%.
Women in Mount Vernon earn 87.7 cents for every dollar earned by a man.
What is Family Income Deficit in Mount Vernon?
Family Income Deficit in Mount Vernon is $11,378.
Families that are below poverty line in Mount Vernon earn $11,378 less on average than the poverty threshold level.
What is Inequality or Gini Index in Mount Vernon?
Inequality or Gini Index in Mount Vernon is 0.48.
How Large is the Labor Force in Mount Vernon?
There are 39,738 People in the Labor Forcein in Mount Vernon.
What is the Percentage of People in the Labor Force in Mount Vernon?
65.9% of People are in the Labor Force in Mount Vernon.
What is the Unemployment Rate in Mount Vernon?
Unemployment Rate in Mount Vernon is 8.0%.