Cities with the Highest Percentage of Immigrants from Northern Africa in New York
RELATED REPORTS & OPTIONS
Northern Africa
New York
Compare Cities
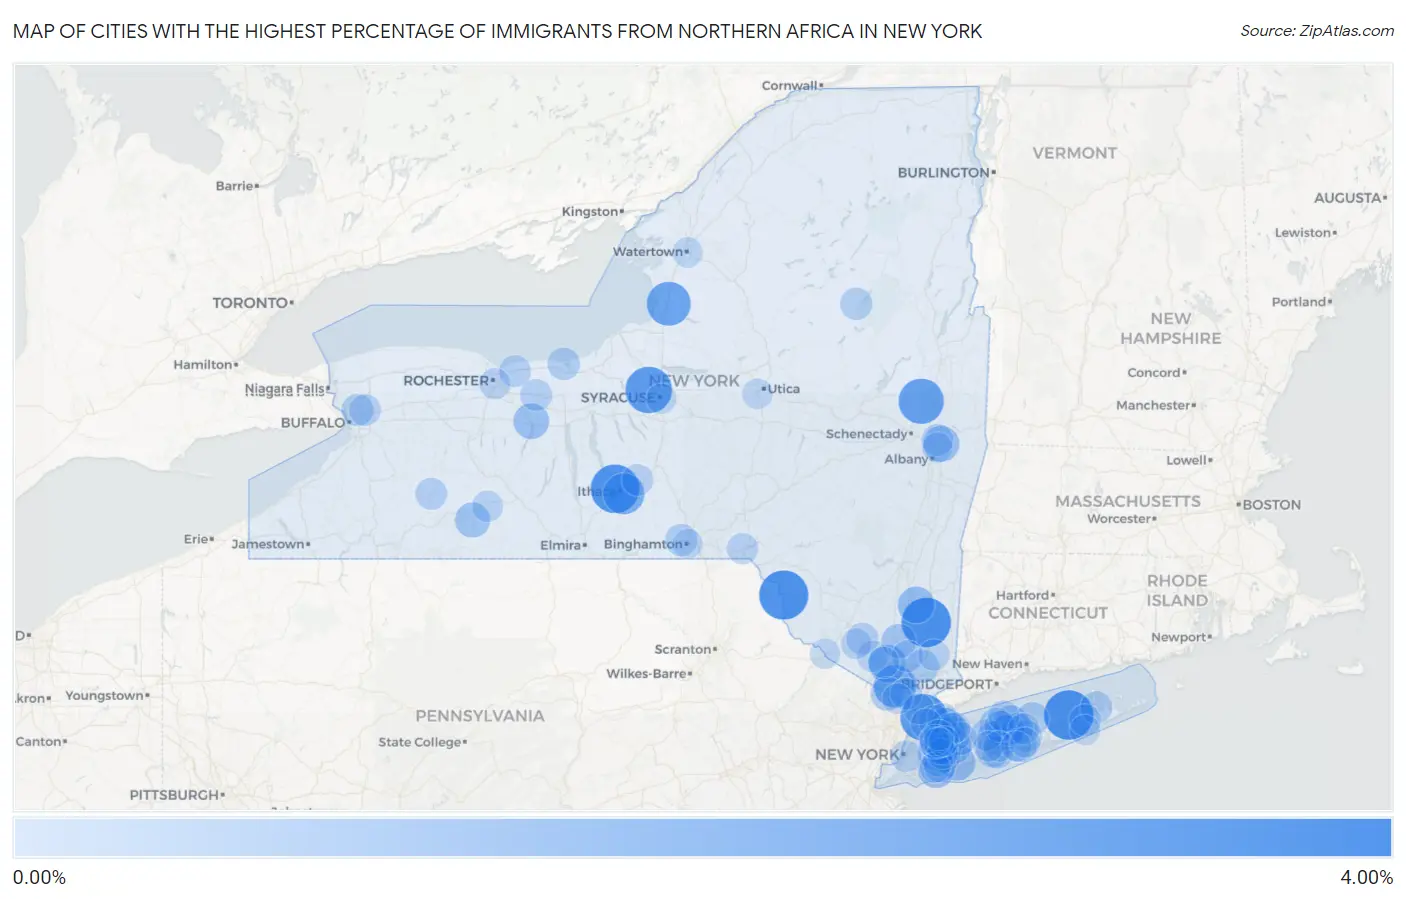
Map of Cities with the Highest Percentage of Immigrants from Northern Africa in New York
0.00%
4.00%
Cities with the Highest Percentage of Immigrants from Northern Africa in New York
| City | Northern Africa | vs State | vs National | |
| 1. | Laurel | 3.16% | 0.24%(+2.93)#-1 | 0.13%(+3.04)#0 |
| 2. | Hopewell Junction | 3.16% | 0.24%(+2.92)#0 | 0.13%(+3.03)#1 |
| 3. | Callicoon | 3.11% | 0.24%(+2.87)#1 | 0.13%(+2.98)#2 |
| 4. | Northwest Ithaca | 3.01% | 0.24%(+2.77)#2 | 0.13%(+2.88)#3 |
| 5. | Tuckahoe | 2.74% | 0.24%(+2.51)#3 | 0.13%(+2.62)#4 |
| 6. | Lakeland | 2.71% | 0.24%(+2.47)#4 | 0.13%(+2.58)#5 |
| 7. | North Ballston Spa | 2.49% | 0.24%(+2.26)#5 | 0.13%(+2.37)#6 |
| 8. | Schuyler Lake | 2.44% | 0.24%(+2.20)#6 | 0.13%(+2.31)#7 |
| 9. | Lacona | 2.30% | 0.24%(+2.06)#7 | 0.13%(+2.17)#8 |
| 10. | Wesley Hills | 2.06% | 0.24%(+1.82)#8 | 0.13%(+1.93)#9 |
| 11. | East Ithaca | 1.87% | 0.24%(+1.64)#9 | 0.13%(+1.75)#10 |
| 12. | Searingtown | 1.87% | 0.24%(+1.64)#10 | 0.13%(+1.74)#11 |
| 13. | Harriman | 1.35% | 0.24%(+1.12)#11 | 0.13%(+1.23)#12 |
| 14. | Arlington | 1.21% | 0.24%(+0.969)#12 | 0.13%(+1.08)#13 |
| 15. | Glen Cove | 1.21% | 0.24%(+0.968)#13 | 0.13%(+1.08)#14 |
| 16. | Bellmore | 1.12% | 0.24%(+0.886)#14 | 0.13%(+0.996)#15 |
| 17. | Lawrence | 1.09% | 0.24%(+0.855)#15 | 0.13%(+0.965)#16 |
| 18. | Troy | 1.09% | 0.24%(+0.855)#55 | 0.13%(+0.965)#1,178 |
| 19. | Canandaigua | 1.06% | 0.24%(+0.823)#56 | 0.13%(+0.933)#1,179 |
| 20. | Sparrow Bush | 1.02% | 0.24%(+0.785)#57 | 0.13%(+0.895)#1,180 |
| 21. | New Cassel | 0.97% | 0.24%(+0.734)#58 | 0.13%(+0.844)#1,181 |
| 22. | Alfred | 0.94% | 0.24%(+0.702)#59 | 0.13%(+0.812)#1,182 |
| 23. | Upper Brookville | 0.90% | 0.24%(+0.667)#60 | 0.13%(+0.777)#1,183 |
| 24. | Bellerose Terrace | 0.89% | 0.24%(+0.653)#61 | 0.13%(+0.763)#1,184 |
| 25. | Vails Gate | 0.87% | 0.24%(+0.630)#62 | 0.13%(+0.740)#1,185 |
| 26. | Port Jefferson Station | 0.85% | 0.24%(+0.615)#63 | 0.13%(+0.725)#1,186 |
| 27. | Lake Grove | 0.84% | 0.24%(+0.603)#64 | 0.13%(+0.713)#1,187 |
| 28. | Nissequogue | 0.79% | 0.24%(+0.551)#65 | 0.13%(+0.661)#1,188 |
| 29. | East Patchogue | 0.76% | 0.24%(+0.527)#66 | 0.13%(+0.637)#1,189 |
| 30. | Suffern | 0.74% | 0.24%(+0.501)#67 | 0.13%(+0.611)#1,190 |
| 31. | Hauppauge | 0.71% | 0.24%(+0.473)#68 | 0.13%(+0.583)#1,191 |
| 32. | Crompond | 0.68% | 0.24%(+0.441)#69 | 0.13%(+0.551)#1,192 |
| 33. | East Shoreham | 0.65% | 0.24%(+0.414)#70 | 0.13%(+0.524)#1,193 |
| 34. | Syosset | 0.63% | 0.24%(+0.395)#71 | 0.13%(+0.505)#1,194 |
| 35. | Sea Cliff | 0.61% | 0.24%(+0.375)#72 | 0.13%(+0.485)#1,195 |
| 36. | Islip | 0.61% | 0.24%(+0.370)#73 | 0.13%(+0.480)#1,312 |
| 37. | West Hempstead | 0.58% | 0.24%(+0.346)#74 | 0.13%(+0.456)#1,313 |
| 38. | Mamaroneck | 0.57% | 0.24%(+0.330)#75 | 0.13%(+0.440)#1,314 |
| 39. | North Haven | 0.55% | 0.24%(+0.310)#76 | 0.13%(+0.420)#1,315 |
| 40. | Sodus Point | 0.55% | 0.24%(+0.310)#77 | 0.13%(+0.420)#1,316 |
| 41. | Johnson City | 0.55% | 0.24%(+0.308)#78 | 0.13%(+0.418)#1,317 |
| 42. | Mineola | 0.54% | 0.24%(+0.302)#79 | 0.13%(+0.412)#1,318 |
| 43. | Locust Valley | 0.53% | 0.24%(+0.289)#80 | 0.13%(+0.399)#1,319 |
| 44. | Speculator | 0.52% | 0.24%(+0.278)#81 | 0.13%(+0.388)#1,320 |
| 45. | Eggertsville | 0.50% | 0.24%(+0.267)#82 | 0.13%(+0.377)#1,321 |
| 46. | Yaphank | 0.50% | 0.24%(+0.260)#83 | 0.13%(+0.370)#1,322 |
| 47. | East Islip | 0.49% | 0.24%(+0.256)#84 | 0.13%(+0.366)#1,323 |
| 48. | Scotchtown | 0.49% | 0.24%(+0.255)#85 | 0.13%(+0.365)#1,324 |
| 49. | Palmyra | 0.48% | 0.24%(+0.244)#86 | 0.13%(+0.354)#1,325 |
| 50. | Cohoes | 0.48% | 0.24%(+0.242)#87 | 0.13%(+0.351)#1,326 |
| 51. | Centereach | 0.47% | 0.24%(+0.236)#88 | 0.13%(+0.346)#1,327 |
| 52. | Hewlett Harbor | 0.47% | 0.24%(+0.232)#89 | 0.13%(+0.342)#1,328 |
| 53. | Highland Falls | 0.46% | 0.24%(+0.220)#90 | 0.13%(+0.330)#1,329 |
| 54. | Bardonia | 0.46% | 0.24%(+0.219)#91 | 0.13%(+0.329)#1,330 |
| 55. | Webster | 0.45% | 0.24%(+0.217)#92 | 0.13%(+0.327)#1,331 |
| 56. | Coram | 0.45% | 0.24%(+0.216)#93 | 0.13%(+0.326)#1,332 |
| 57. | Houghton | 0.45% | 0.24%(+0.214)#94 | 0.13%(+0.324)#1,333 |
| 58. | Williamsville | 0.44% | 0.24%(+0.206)#95 | 0.13%(+0.316)#1,334 |
| 59. | North Sea | 0.43% | 0.24%(+0.192)#96 | 0.13%(+0.302)#1,335 |
| 60. | Freeville | 0.43% | 0.24%(+0.190)#97 | 0.13%(+0.300)#1,336 |
| 61. | New York | 0.41% | 0.24%(+0.175)#98 | 0.13%(+0.285)#1,337 |
| 62. | Commack | 0.40% | 0.24%(+0.162)#99 | 0.13%(+0.272)#1,338 |
| 63. | Head Of The Harbor | 0.40% | 0.24%(+0.162)#100 | 0.13%(+0.272)#1,339 |
| 64. | Garden City Park | 0.40% | 0.24%(+0.161)#101 | 0.13%(+0.271)#1,340 |
| 65. | Chester | 0.39% | 0.24%(+0.156)#102 | 0.13%(+0.266)#1,341 |
| 66. | Old Field | 0.39% | 0.24%(+0.155)#103 | 0.13%(+0.265)#1,342 |
| 67. | Mahopac | 0.39% | 0.24%(+0.150)#104 | 0.13%(+0.260)#1,343 |
| 68. | Brighton | 0.38% | 0.24%(+0.143)#105 | 0.13%(+0.253)#1,344 |
| 69. | Monroe | 0.37% | 0.24%(+0.134)#106 | 0.13%(+0.244)#1,345 |
| 70. | Deposit | 0.36% | 0.24%(+0.119)#107 | 0.13%(+0.229)#1,346 |
| 71. | Middle Island | 0.35% | 0.24%(+0.117)#108 | 0.13%(+0.227)#1,347 |
| 72. | North Hornell | 0.35% | 0.24%(+0.110)#109 | 0.13%(+0.220)#1,348 |
| 73. | North Great River | 0.33% | 0.24%(+0.089)#110 | 0.13%(+0.199)#1,349 |
| 74. | Dobbs Ferry | 0.31% | 0.24%(+0.078)#111 | 0.13%(+0.188)#1,350 |
| 75. | North New Hyde Park | 0.31% | 0.24%(+0.070)#112 | 0.13%(+0.180)#1,351 |
| 76. | Rye | 0.30% | 0.24%(+0.061)#113 | 0.13%(+0.171)#1,352 |
| 77. | Middletown | 0.30% | 0.24%(+0.058)#114 | 0.13%(+0.168)#1,353 |
| 78. | North Bay Shore | 0.29% | 0.24%(+0.056)#115 | 0.13%(+0.166)#1,354 |
| 79. | Pelham | 0.29% | 0.24%(+0.052)#116 | 0.13%(+0.162)#1,355 |
| 80. | Chestnut Ridge | 0.28% | 0.24%(+0.043)#117 | 0.13%(+0.153)#1,356 |
| 81. | Valley Stream | 0.28% | 0.24%(+0.038)#118 | 0.13%(+0.148)#1,357 |
| 82. | Russell Gardens | 0.27% | 0.24%(+0.035)#119 | 0.13%(+0.145)#1,358 |
| 83. | Great Neck Estates | 0.27% | 0.24%(+0.035)#120 | 0.13%(+0.145)#1,359 |
| 84. | Mill Neck | 0.27% | 0.24%(+0.033)#121 | 0.13%(+0.143)#1,360 |
| 85. | Watertown | 0.27% | 0.24%(+0.032)#122 | 0.13%(+0.142)#1,361 |
| 86. | Southampton | 0.27% | 0.24%(+0.030)#123 | 0.13%(+0.140)#1,362 |
| 87. | Garden City South | 0.27% | 0.24%(+0.030)#124 | 0.13%(+0.140)#1,363 |
| 88. | New Hartford | 0.26% | 0.24%(+0.027)#125 | 0.13%(+0.137)#1,364 |
| 89. | Great Neck | 0.26% | 0.24%(+0.025)#126 | 0.13%(+0.135)#1,365 |
| 90. | Watervliet | 0.26% | 0.24%(+0.024)#127 | 0.13%(+0.134)#1,366 |
| 91. | Port Washington North | 0.25% | 0.24%(+0.015)#128 | 0.13%(+0.125)#1,367 |
| 92. | Latham | 0.25% | 0.24%(+0.012)#129 | 0.13%(+0.121)#1,368 |
| 93. | Cedarhurst | 0.25% | 0.24%(+0.009)#130 | 0.13%(+0.119)#1,369 |
| 94. | Patchogue | 0.24% | 0.24%(+0.006)#131 | 0.13%(+0.116)#1,370 |
| 95. | Port Jervis | 0.24% | 0.24%(+0.003)#132 | 0.13%(+0.113)#1,371 |
| 96. | Syracuse | 0.24% | 0.24%(+0.002)#133 | 0.13%(+0.112)#1,372 |
| 97. | Roslyn | 0.24% | 0.24%(+0.002)#134 | 0.13%(+0.112)#1,373 |
| 98. | North Bellport | 0.24% | 0.24%(+0.000)#135 | 0.13%(+0.110)#1,374 |
| 99. | Binghamton | 0.24% | 0.24%(-0.000)#136 | 0.13%(+0.110)#1,375 |
| 100. | Manhasset | 0.22% | 0.24%(-0.017)#137 | 0.13%(+0.093)#1,376 |
Common Questions
What are the Top 10 Cities with the Highest Percentage of Immigrants from Northern Africa in New York?
Top 10 Cities with the Highest Percentage of Immigrants from Northern Africa in New York are:
#1
3.16%
#2
3.16%
#3
3.11%
#4
3.01%
#5
2.74%
#6
2.71%
#7
2.49%
#8
2.30%
#9
2.06%
#10
1.87%
What city has the Highest Percentage of Immigrants from Northern Africa in New York?
Laurel has the Highest Percentage of Immigrants from Northern Africa in New York with 3.16%.
What is the Percentage of Immigrants from Northern Africa in the State of New York?
Percentage of Immigrants from Northern Africa in New York is 0.24%.
What is the Percentage of Immigrants from Northern Africa in the United States?
Percentage of Immigrants from Northern Africa in the United States is 0.13%.