Cities with the Highest Percentage of Immigrants from Trinidad and Tobago in Florida
RELATED REPORTS & OPTIONS
Trinidad and Tobago
Florida
Compare Cities
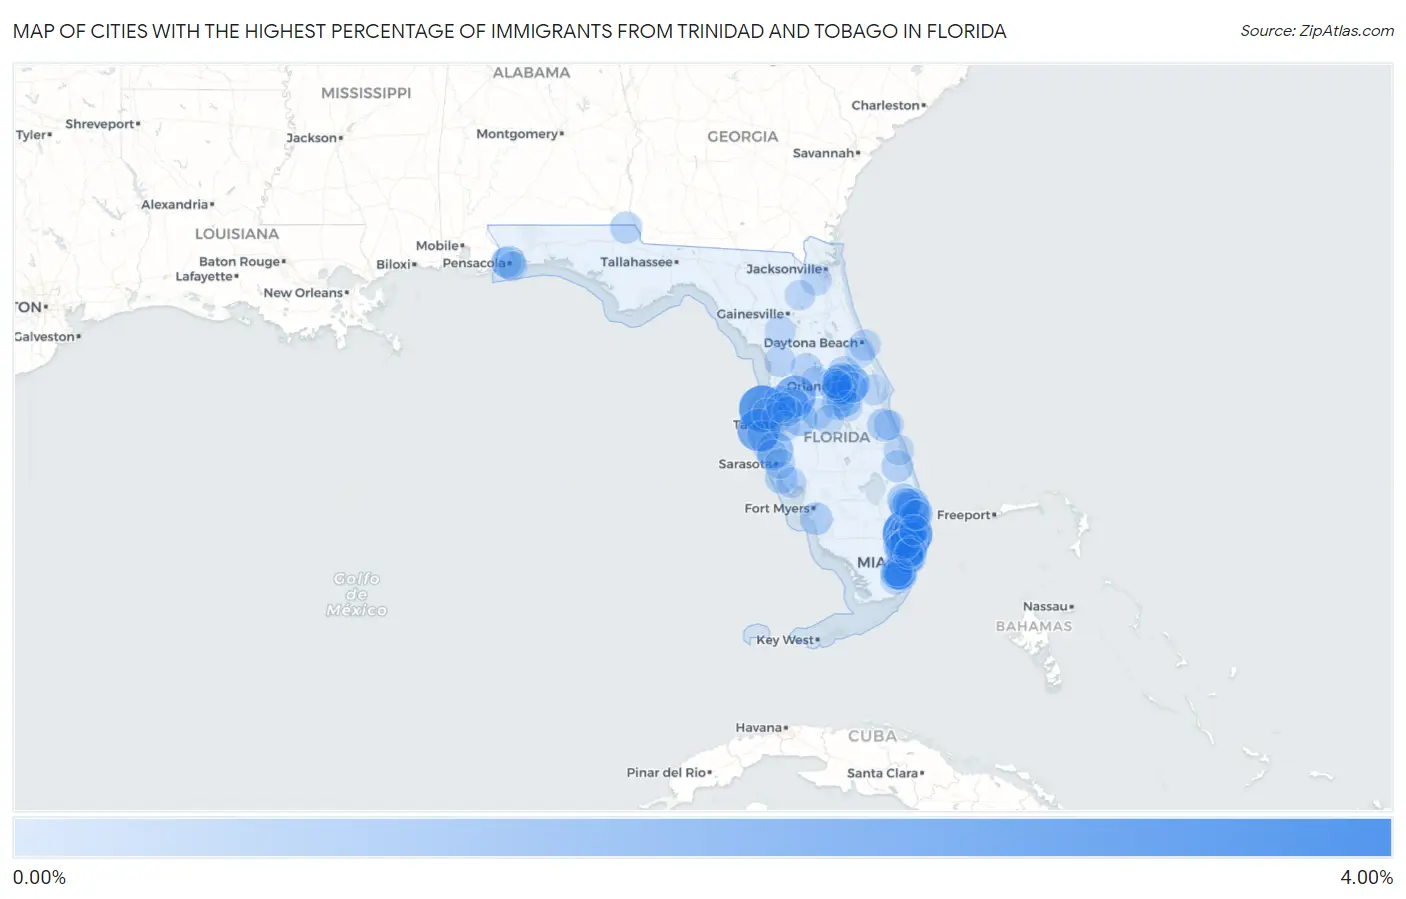
Map of Cities with the Highest Percentage of Immigrants from Trinidad and Tobago in Florida
0.00%
4.00%
Cities with the Highest Percentage of Immigrants from Trinidad and Tobago in Florida
| City | Trinidad and Tobago | vs State | vs National | |
| 1. | Margate | 3.83% | 0.20%(+3.62)#106 | 0.070%(+3.76)#235 |
| 2. | Key Vista | 3.31% | 0.20%(+3.11)#107 | 0.070%(+3.24)#236 |
| 3. | Indian Shores | 2.54% | 0.20%(+2.34)#108 | 0.070%(+2.47)#237 |
| 4. | Dade City North | 2.30% | 0.20%(+2.10)#109 | 0.070%(+2.23)#238 |
| 5. | North Lauderdale | 2.09% | 0.20%(+1.89)#110 | 0.070%(+2.02)#239 |
| 6. | Roosevelt Gardens | 1.94% | 0.20%(+1.74)#111 | 0.070%(+1.87)#240 |
| 7. | Union Park | 1.89% | 0.20%(+1.68)#112 | 0.070%(+1.82)#241 |
| 8. | Lauderdale Lakes | 1.55% | 0.20%(+1.35)#113 | 0.070%(+1.48)#242 |
| 9. | Sunrise | 1.50% | 0.20%(+1.29)#114 | 0.070%(+1.43)#243 |
| 10. | Memphis | 1.46% | 0.20%(+1.26)#115 | 0.070%(+1.39)#244 |
| 11. | West Park | 1.46% | 0.20%(+1.26)#116 | 0.070%(+1.39)#245 |
| 12. | Richmond Heights | 1.45% | 0.20%(+1.25)#117 | 0.070%(+1.38)#246 |
| 13. | Eatonville | 1.37% | 0.20%(+1.17)#118 | 0.070%(+1.30)#247 |
| 14. | University Cdp Hillsborough County | 1.17% | 0.20%(+0.972)#119 | 0.070%(+1.10)#248 |
| 15. | Tamarac | 1.10% | 0.20%(+0.899)#120 | 0.070%(+1.03)#249 |
| 16. | Plant City | 1.07% | 0.20%(+0.867)#121 | 0.070%(+0.999)#250 |
| 17. | Buenaventura Lakes | 1.07% | 0.20%(+0.865)#122 | 0.070%(+0.997)#251 |
| 18. | Greenacres | 1.02% | 0.20%(+0.822)#142 | 0.070%(+0.954)#379 |
| 19. | Lauderhill | 1.02% | 0.20%(+0.819)#143 | 0.070%(+0.951)#380 |
| 20. | Gladeview | 1.01% | 0.20%(+0.812)#144 | 0.070%(+0.944)#381 |
| 21. | Coral Springs | 1.00% | 0.20%(+0.798)#145 | 0.070%(+0.929)#382 |
| 22. | Marion Oaks | 0.98% | 0.20%(+0.774)#146 | 0.070%(+0.906)#383 |
| 23. | Holden Heights | 0.95% | 0.20%(+0.747)#147 | 0.070%(+0.879)#384 |
| 24. | Goulding | 0.89% | 0.20%(+0.690)#148 | 0.070%(+0.822)#385 |
| 25. | Miramar | 0.88% | 0.20%(+0.680)#149 | 0.070%(+0.812)#386 |
| 26. | Coconut Creek | 0.87% | 0.20%(+0.667)#150 | 0.070%(+0.799)#387 |
| 27. | Palm Bay | 0.85% | 0.20%(+0.647)#151 | 0.070%(+0.779)#388 |
| 28. | Miami Gardens | 0.85% | 0.20%(+0.647)#152 | 0.070%(+0.779)#389 |
| 29. | The Acreage | 0.85% | 0.20%(+0.645)#153 | 0.070%(+0.777)#390 |
| 30. | Lake Belvedere Estates | 0.84% | 0.20%(+0.635)#154 | 0.070%(+0.767)#391 |
| 31. | San Carlos Park | 0.77% | 0.20%(+0.566)#155 | 0.070%(+0.698)#392 |
| 32. | Nokomis | 0.72% | 0.20%(+0.521)#156 | 0.070%(+0.653)#393 |
| 33. | San Castle | 0.72% | 0.20%(+0.519)#157 | 0.070%(+0.651)#394 |
| 34. | Miami Shores | 0.70% | 0.20%(+0.503)#158 | 0.070%(+0.635)#395 |
| 35. | Lake Mary | 0.70% | 0.20%(+0.502)#159 | 0.070%(+0.633)#396 |
| 36. | Zephyrhills West | 0.70% | 0.20%(+0.498)#160 | 0.070%(+0.630)#397 |
| 37. | Malone | 0.65% | 0.20%(+0.446)#161 | 0.070%(+0.578)#398 |
| 38. | Loxahatchee Groves | 0.62% | 0.20%(+0.419)#162 | 0.070%(+0.551)#399 |
| 39. | Campbell | 0.62% | 0.20%(+0.417)#163 | 0.070%(+0.549)#400 |
| 40. | Port St Lucie | 0.61% | 0.20%(+0.411)#164 | 0.070%(+0.542)#401 |
| 41. | Hurlburt Field | 0.61% | 0.20%(+0.410)#165 | 0.070%(+0.542)#402 |
| 42. | Naranja | 0.60% | 0.20%(+0.394)#166 | 0.070%(+0.526)#403 |
| 43. | Cutler Bay | 0.59% | 0.20%(+0.393)#167 | 0.070%(+0.525)#404 |
| 44. | Tangelo Park | 0.59% | 0.20%(+0.389)#168 | 0.070%(+0.521)#405 |
| 45. | Connerton | 0.58% | 0.20%(+0.378)#169 | 0.070%(+0.510)#406 |
| 46. | Pasadena Hills | 0.58% | 0.20%(+0.375)#170 | 0.070%(+0.507)#407 |
| 47. | Wildwood | 0.54% | 0.20%(+0.338)#171 | 0.070%(+0.470)#408 |
| 48. | Beverly Hills | 0.53% | 0.20%(+0.330)#172 | 0.070%(+0.461)#409 |
| 49. | Daytona Beach Shores | 0.53% | 0.20%(+0.329)#173 | 0.070%(+0.461)#410 |
| 50. | El Portal | 0.53% | 0.20%(+0.323)#174 | 0.070%(+0.455)#411 |
| 51. | Ocoee | 0.52% | 0.20%(+0.323)#175 | 0.070%(+0.455)#412 |
| 52. | West Perrine | 0.52% | 0.20%(+0.317)#176 | 0.070%(+0.449)#413 |
| 53. | Richmond West | 0.51% | 0.20%(+0.310)#177 | 0.070%(+0.441)#414 |
| 54. | Cooper City | 0.51% | 0.20%(+0.309)#178 | 0.070%(+0.441)#415 |
| 55. | Oakland Park | 0.51% | 0.20%(+0.309)#179 | 0.070%(+0.441)#416 |
| 56. | Southwest Ranches | 0.50% | 0.20%(+0.299)#180 | 0.070%(+0.431)#417 |
| 57. | Liberty Triangle | 0.49% | 0.20%(+0.287)#181 | 0.070%(+0.419)#418 |
| 58. | Treasure Island | 0.49% | 0.20%(+0.284)#182 | 0.070%(+0.416)#419 |
| 59. | Belle Isle | 0.48% | 0.20%(+0.283)#183 | 0.070%(+0.414)#420 |
| 60. | Williston | 0.47% | 0.20%(+0.268)#184 | 0.070%(+0.400)#421 |
| 61. | Auburndale | 0.46% | 0.20%(+0.261)#185 | 0.070%(+0.393)#422 |
| 62. | South Bradenton | 0.46% | 0.20%(+0.258)#186 | 0.070%(+0.390)#423 |
| 63. | Pembroke Pines | 0.45% | 0.20%(+0.250)#187 | 0.070%(+0.382)#436 |
| 64. | Edgewood | 0.45% | 0.20%(+0.245)#188 | 0.070%(+0.376)#437 |
| 65. | Oakleaf Plantation | 0.44% | 0.20%(+0.242)#189 | 0.070%(+0.374)#438 |
| 66. | Port St John | 0.44% | 0.20%(+0.242)#190 | 0.070%(+0.373)#439 |
| 67. | Southchase | 0.44% | 0.20%(+0.235)#191 | 0.070%(+0.367)#440 |
| 68. | East Lake | 0.42% | 0.20%(+0.221)#192 | 0.070%(+0.352)#441 |
| 69. | West Pensacola | 0.42% | 0.20%(+0.217)#193 | 0.070%(+0.349)#442 |
| 70. | Carrollwood | 0.41% | 0.20%(+0.213)#194 | 0.070%(+0.345)#443 |
| 71. | Lakewood Park | 0.41% | 0.20%(+0.209)#195 | 0.070%(+0.341)#444 |
| 72. | Lockhart | 0.41% | 0.20%(+0.204)#196 | 0.070%(+0.336)#445 |
| 73. | Wellington | 0.41% | 0.20%(+0.204)#197 | 0.070%(+0.336)#446 |
| 74. | University Cdp Orange County | 0.40% | 0.20%(+0.194)#198 | 0.070%(+0.326)#447 |
| 75. | St Cloud | 0.39% | 0.20%(+0.193)#199 | 0.070%(+0.324)#448 |
| 76. | Royal Palm Beach | 0.39% | 0.20%(+0.189)#200 | 0.070%(+0.321)#449 |
| 77. | South Miami Heights | 0.39% | 0.20%(+0.185)#201 | 0.070%(+0.317)#450 |
| 78. | Starke | 0.38% | 0.20%(+0.180)#202 | 0.070%(+0.312)#451 |
| 79. | Alafaya | 0.38% | 0.20%(+0.176)#203 | 0.070%(+0.308)#452 |
| 80. | Warm Mineral Springs | 0.37% | 0.20%(+0.173)#204 | 0.070%(+0.305)#453 |
| 81. | Palm River Clair Mel | 0.37% | 0.20%(+0.171)#205 | 0.070%(+0.303)#454 |
| 82. | Davie | 0.37% | 0.20%(+0.171)#206 | 0.070%(+0.302)#455 |
| 83. | Lighthouse Point | 0.37% | 0.20%(+0.170)#207 | 0.070%(+0.302)#456 |
| 84. | Groveland | 0.37% | 0.20%(+0.167)#208 | 0.070%(+0.299)#457 |
| 85. | Three Lakes | 0.37% | 0.20%(+0.166)#209 | 0.070%(+0.298)#458 |
| 86. | Fruitville | 0.37% | 0.20%(+0.164)#210 | 0.070%(+0.295)#459 |
| 87. | Orlovista | 0.36% | 0.20%(+0.159)#211 | 0.070%(+0.290)#460 |
| 88. | Grant Valkaria | 0.35% | 0.20%(+0.152)#212 | 0.070%(+0.284)#461 |
| 89. | Ojus | 0.35% | 0.20%(+0.151)#213 | 0.070%(+0.283)#462 |
| 90. | Ocean Ridge | 0.35% | 0.20%(+0.149)#214 | 0.070%(+0.281)#463 |
| 91. | Dundee | 0.34% | 0.20%(+0.133)#215 | 0.070%(+0.265)#464 |
| 92. | Holden Lakes | 0.33% | 0.20%(+0.132)#216 | 0.070%(+0.264)#465 |
| 93. | Pine Hills | 0.33% | 0.20%(+0.132)#217 | 0.070%(+0.264)#466 |
| 94. | Gulf Breeze | 0.33% | 0.20%(+0.128)#218 | 0.070%(+0.260)#467 |
| 95. | Boynton Beach | 0.32% | 0.20%(+0.121)#219 | 0.070%(+0.252)#468 |
| 96. | Deerfield Beach | 0.32% | 0.20%(+0.118)#220 | 0.070%(+0.249)#469 |
| 97. | Pebble Creek | 0.32% | 0.20%(+0.117)#221 | 0.070%(+0.249)#470 |
| 98. | Golden Glades | 0.31% | 0.20%(+0.112)#222 | 0.070%(+0.244)#471 |
| 99. | Samsula Spruce Creek | 0.31% | 0.20%(+0.110)#223 | 0.070%(+0.242)#472 |
| 100. | Land O Lakes | 0.31% | 0.20%(+0.109)#224 | 0.070%(+0.241)#473 |
Common Questions
What are the Top 10 Cities with the Highest Percentage of Immigrants from Trinidad and Tobago in Florida?
Top 10 Cities with the Highest Percentage of Immigrants from Trinidad and Tobago in Florida are:
#1
3.83%
#2
3.31%
#3
2.54%
#4
2.30%
#5
2.09%
#6
1.94%
#7
1.89%
#8
1.55%
#9
1.50%
#10
1.46%
What city has the Highest Percentage of Immigrants from Trinidad and Tobago in Florida?
Margate has the Highest Percentage of Immigrants from Trinidad and Tobago in Florida with 3.83%.
What is the Percentage of Immigrants from Trinidad and Tobago in the State of Florida?
Percentage of Immigrants from Trinidad and Tobago in Florida is 0.20%.
What is the Percentage of Immigrants from Trinidad and Tobago in the United States?
Percentage of Immigrants from Trinidad and Tobago in the United States is 0.070%.