Newburgh, NY
Newburgh Map
Newburgh Overview
28,751
TOTAL POPULATION
13,568
MALE POPULATION
15,183
FEMALE POPULATION
89.36
MALES / 100 FEMALES
111.90
FEMALES / 100 MALES
32.2
MEDIAN AGE
3.5
AVG FAMILY SIZE
2.6
AVG HOUSEHOLD SIZE
$27,253
PER CAPITA INCOME
$59,183
AVG FAMILY INCOME
$48,555
AVG HOUSEHOLD INCOME
27.2%
WAGE / INCOME GAP [ % ]
72.8¢/ $1
WAGE / INCOME GAP [ $ ]
$13,058
FAMILY INCOME DEFICIT
0.52
INEQUALITY / GINI INDEX
13,846
LABOR FORCE [ PEOPLE ]
61.4%
PERCENT IN LABOR FORCE
7.8%
UNEMPLOYMENT RATE
Newburgh Zip Codes
Race in Newburgh
The most populous races in Newburgh are Hispanic or Latino (13,989 | 48.7%), White / Caucasian (9,516 | 33.1%), and Some other Race (8,282 | 28.8%).
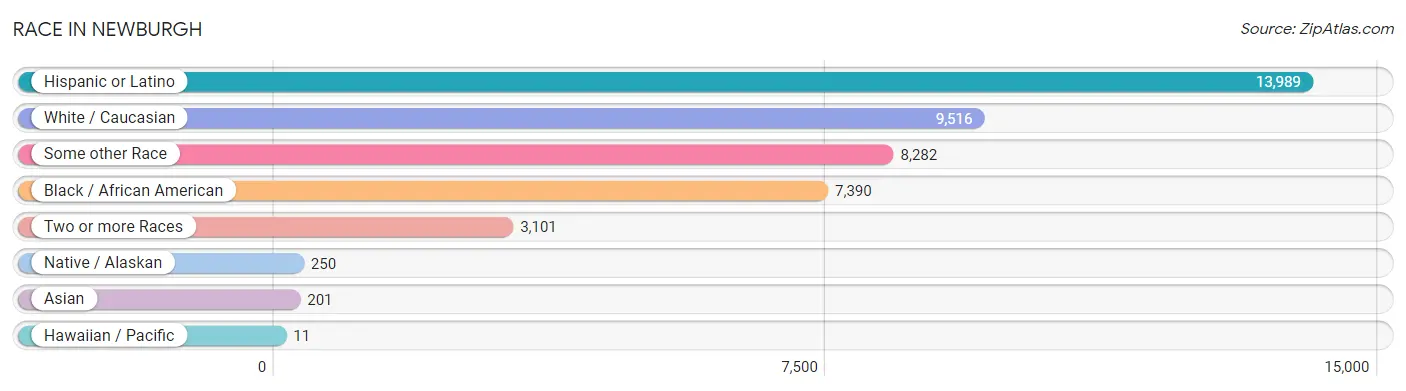
| Race | # Population | % Population |
| Asian | 201 | 0.7% |
| Black / African American | 7,390 | 25.7% |
| Hawaiian / Pacific | 11 | 0.0% |
| Hispanic or Latino | 13,989 | 48.7% |
| Native / Alaskan | 250 | 0.9% |
| White / Caucasian | 9,516 | 33.1% |
| Two or more Races | 3,101 | 10.8% |
| Some other Race | 8,282 | 28.8% |
| Total | 28,751 | 100.0% |
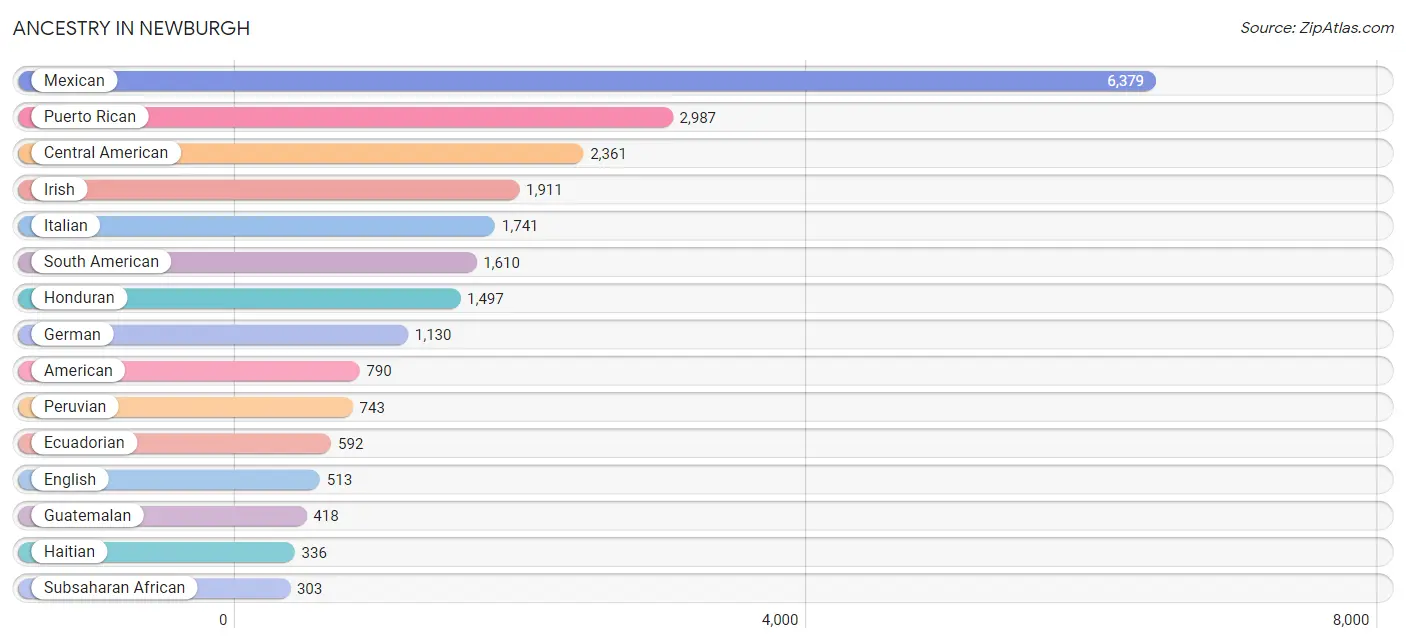
Ancestry in Newburgh
The most populous ancestries reported in Newburgh are Mexican (6,379 | 22.2%), Puerto Rican (2,987 | 10.4%), Central American (2,361 | 8.2%), Irish (1,911 | 6.7%), and Italian (1,741 | 6.1%), together accounting for 53.5% of all Newburgh residents.
| Ancestry | # Population | % Population |
| African | 244 | 0.9% |
| Albanian | 2 | 0.0% |
| American | 790 | 2.8% |
| Arab | 22 | 0.1% |
| Armenian | 13 | 0.1% |
| Australian | 15 | 0.1% |
| Barbadian | 105 | 0.4% |
| Blackfeet | 9 | 0.0% |
| Brazilian | 64 | 0.2% |
| British | 20 | 0.1% |
| Burmese | 127 | 0.4% |
| Canadian | 48 | 0.2% |
| Central American | 2,361 | 8.2% |
| Central American Indian | 5 | 0.0% |
| Cherokee | 131 | 0.5% |
| Chilean | 39 | 0.1% |
| Colombian | 92 | 0.3% |
| Cuban | 21 | 0.1% |
| Czech | 55 | 0.2% |
| Czechoslovakian | 8 | 0.0% |
| Danish | 35 | 0.1% |
| Delaware | 7 | 0.0% |
| Dominican | 62 | 0.2% |
| Dutch | 54 | 0.2% |
| Eastern European | 60 | 0.2% |
| Ecuadorian | 592 | 2.1% |
| English | 513 | 1.8% |
| European | 117 | 0.4% |
| Filipino | 34 | 0.1% |
| Finnish | 11 | 0.0% |
| French | 158 | 0.5% |
| French Canadian | 19 | 0.1% |
| German | 1,130 | 3.9% |
| Ghanaian | 27 | 0.1% |
| Greek | 87 | 0.3% |
| Guamanian / Chamorro | 11 | 0.0% |
| Guatemalan | 418 | 1.5% |
| Guyanese | 108 | 0.4% |
| Haitian | 336 | 1.2% |
| Honduran | 1,497 | 5.2% |
| Hungarian | 68 | 0.2% |
| Indian (Asian) | 226 | 0.8% |
| Irish | 1,911 | 6.7% |
| Iroquois | 58 | 0.2% |
| Italian | 1,741 | 6.1% |
| Jamaican | 62 | 0.2% |
| Korean | 57 | 0.2% |
| Lebanese | 22 | 0.1% |
| Malaysian | 21 | 0.1% |
| Mexican | 6,379 | 22.2% |
| Mexican American Indian | 167 | 0.6% |
| Nicaraguan | 215 | 0.7% |
| Nigerian | 43 | 0.2% |
| Northern European | 37 | 0.1% |
| Norwegian | 22 | 0.1% |
| Okinawan | 21 | 0.1% |
| Panamanian | 78 | 0.3% |
| Peruvian | 743 | 2.6% |
| Polish | 270 | 0.9% |
| Portuguese | 74 | 0.3% |
| Puerto Rican | 2,987 | 10.4% |
| Romanian | 50 | 0.2% |
| Russian | 109 | 0.4% |
| Salvadoran | 153 | 0.5% |
| Scandinavian | 13 | 0.1% |
| Scotch-Irish | 16 | 0.1% |
| Scottish | 168 | 0.6% |
| Slovak | 37 | 0.1% |
| South American | 1,610 | 5.6% |
| Spaniard | 212 | 0.7% |
| Spanish | 114 | 0.4% |
| Subsaharan African | 303 | 1.1% |
| Swedish | 42 | 0.2% |
| Swiss | 12 | 0.0% |
| Thai | 216 | 0.7% |
| Trinidadian and Tobagonian | 166 | 0.6% |
| Ukrainian | 32 | 0.1% |
| Venezuelan | 144 | 0.5% |
| Welsh | 3 | 0.0% | View All 79 Rows |
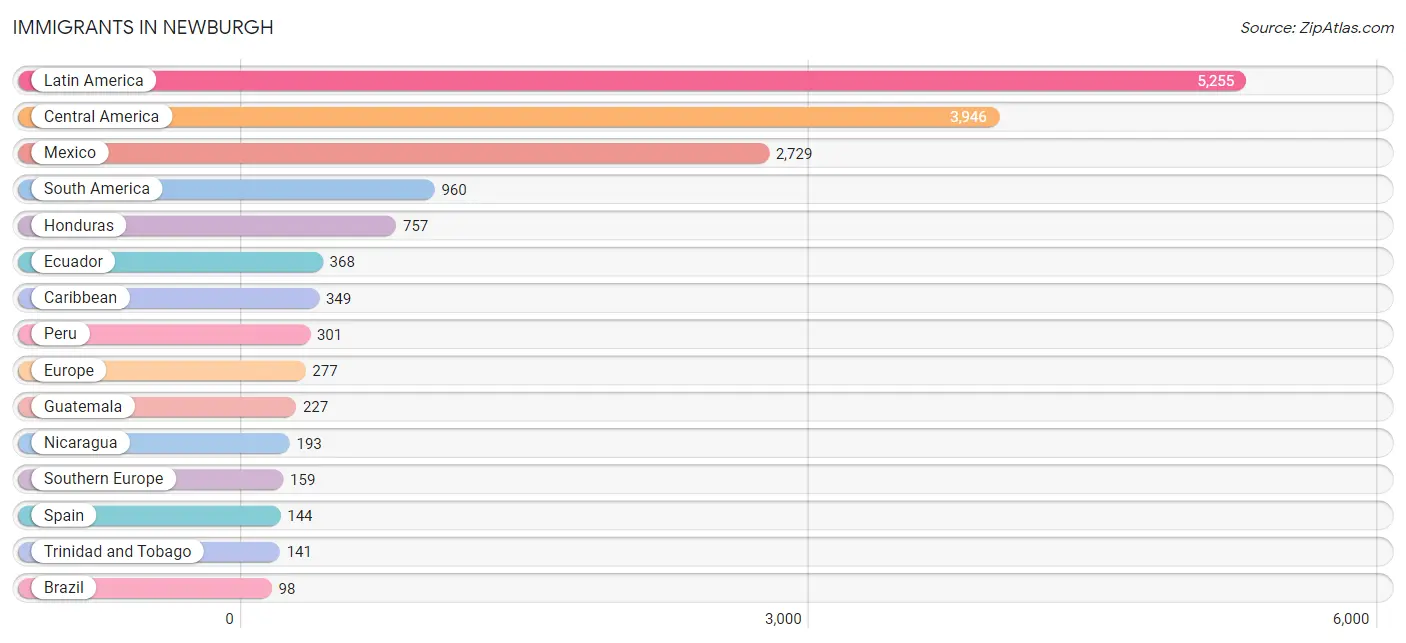
Immigrants in Newburgh
The most numerous immigrant groups reported in Newburgh came from Latin America (5,255 | 18.3%), Central America (3,946 | 13.7%), Mexico (2,729 | 9.5%), South America (960 | 3.3%), and Honduras (757 | 2.6%), together accounting for 47.5% of all Newburgh residents.
| Immigration Origin | # Population | % Population |
| Africa | 8 | 0.0% |
| Asia | 83 | 0.3% |
| Australia | 73 | 0.3% |
| Belize | 15 | 0.1% |
| Brazil | 98 | 0.3% |
| Canada | 25 | 0.1% |
| Caribbean | 349 | 1.2% |
| Central America | 3,946 | 13.7% |
| Chile | 39 | 0.1% |
| China | 34 | 0.1% |
| Colombia | 80 | 0.3% |
| Dominican Republic | 69 | 0.2% |
| Eastern Asia | 34 | 0.1% |
| Eastern Europe | 59 | 0.2% |
| Ecuador | 368 | 1.3% |
| El Salvador | 12 | 0.0% |
| England | 10 | 0.0% |
| Europe | 277 | 1.0% |
| Guatemala | 227 | 0.8% |
| Guyana | 42 | 0.2% |
| Haiti | 67 | 0.2% |
| Honduras | 757 | 2.6% |
| India | 26 | 0.1% |
| Jamaica | 72 | 0.3% |
| Kazakhstan | 2 | 0.0% |
| Latin America | 5,255 | 18.3% |
| Mexico | 2,729 | 9.5% |
| Nicaragua | 193 | 0.7% |
| Nigeria | 3 | 0.0% |
| Northern Europe | 59 | 0.2% |
| Oceania | 93 | 0.3% |
| Panama | 13 | 0.1% |
| Peru | 301 | 1.1% |
| Poland | 59 | 0.2% |
| Portugal | 15 | 0.1% |
| Scotland | 49 | 0.2% |
| Singapore | 21 | 0.1% |
| South Africa | 5 | 0.0% |
| South America | 960 | 3.3% |
| South Central Asia | 28 | 0.1% |
| South Eastern Asia | 21 | 0.1% |
| Southern Europe | 159 | 0.5% |
| Spain | 144 | 0.5% |
| Taiwan | 34 | 0.1% |
| Trinidad and Tobago | 141 | 0.5% |
| Venezuela | 23 | 0.1% |
| Western Africa | 3 | 0.0% | View All 47 Rows |
Sex and Age in Newburgh
Sex and Age in Newburgh
The most populous age groups in Newburgh are 10 to 14 Years (1,643 | 12.1%) for men and 25 to 29 Years (1,357 | 8.9%) for women.
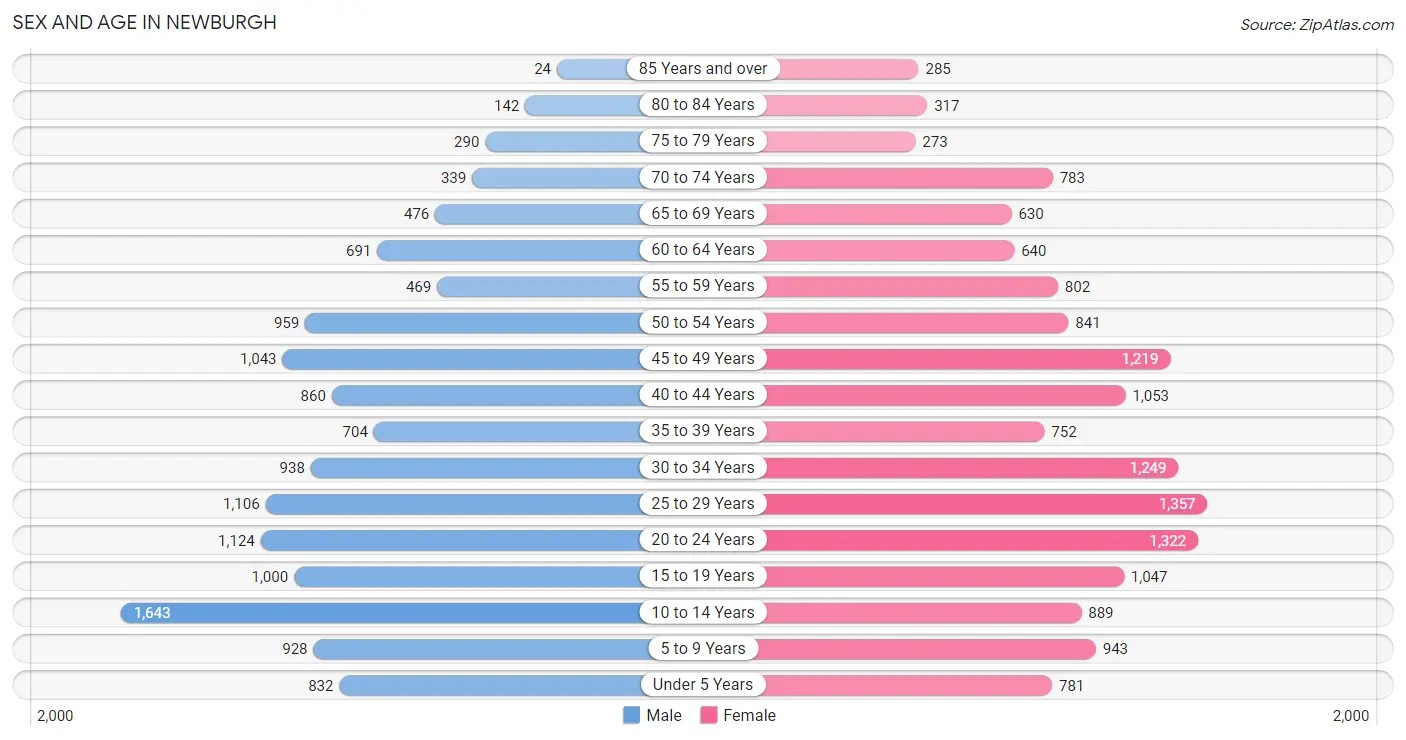
| Age Bracket | Male | Female |
| Under 5 Years | 832 (6.1%) | 781 (5.1%) |
| 5 to 9 Years | 928 (6.8%) | 943 (6.2%) |
| 10 to 14 Years | 1,643 (12.1%) | 889 (5.9%) |
| 15 to 19 Years | 1,000 (7.4%) | 1,047 (6.9%) |
| 20 to 24 Years | 1,124 (8.3%) | 1,322 (8.7%) |
| 25 to 29 Years | 1,106 (8.2%) | 1,357 (8.9%) |
| 30 to 34 Years | 938 (6.9%) | 1,249 (8.2%) |
| 35 to 39 Years | 704 (5.2%) | 752 (5.0%) |
| 40 to 44 Years | 860 (6.3%) | 1,053 (6.9%) |
| 45 to 49 Years | 1,043 (7.7%) | 1,219 (8.0%) |
| 50 to 54 Years | 959 (7.1%) | 841 (5.5%) |
| 55 to 59 Years | 469 (3.5%) | 802 (5.3%) |
| 60 to 64 Years | 691 (5.1%) | 640 (4.2%) |
| 65 to 69 Years | 476 (3.5%) | 630 (4.2%) |
| 70 to 74 Years | 339 (2.5%) | 783 (5.2%) |
| 75 to 79 Years | 290 (2.1%) | 273 (1.8%) |
| 80 to 84 Years | 142 (1.1%) | 317 (2.1%) |
| 85 Years and over | 24 (0.2%) | 285 (1.9%) |
| Total | 13,568 (100.0%) | 15,183 (100.0%) |
Families and Households in Newburgh
Median Family Size in Newburgh
The median family size in Newburgh is 3.47 persons per family, with single male/father families (906 | 14.4%) accounting for the largest median family size of 3.52 persons per family. On the other hand, single female/mother families (2,507 | 40.0%) represent the smallest median family size with 3.46 persons per family.
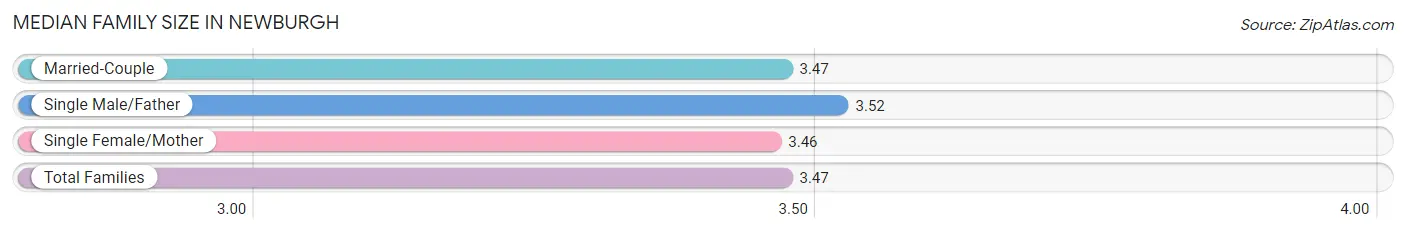
| Family Type | # Families | Family Size |
| Married-Couple | 2,862 (45.6%) | 3.47 |
| Single Male/Father | 906 (14.4%) | 3.52 |
| Single Female/Mother | 2,507 (40.0%) | 3.46 |
| Total Families | 6,275 (100.0%) | 3.47 |
Median Household Size in Newburgh
The median household size in Newburgh is 2.65 persons per household, with single male/father households (906 | 8.6%) accounting for the largest median household size of 3.87 persons per household. non-family households (4,230 | 40.3%) represent the smallest median household size with 1.22 persons per household.
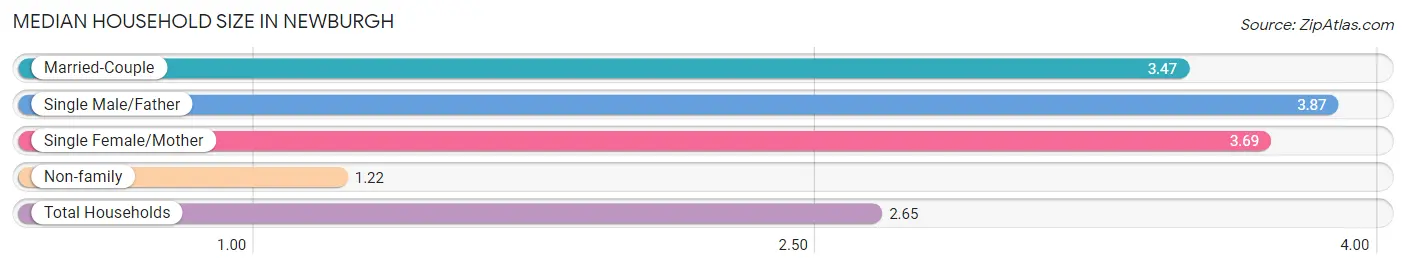
| Household Type | # Households | Household Size |
| Married-Couple | 2,862 (27.2%) | 3.47 |
| Single Male/Father | 906 (8.6%) | 3.87 |
| Single Female/Mother | 2,507 (23.9%) | 3.69 |
| Non-family | 4,230 (40.3%) | 1.22 |
| Total Households | 10,505 (100.0%) | 2.65 |
Household Size by Marriage Status in Newburgh
Out of a total of 10,505 households in Newburgh, 6,275 (59.7%) are family households, while 4,230 (40.3%) are nonfamily households. The most numerous type of family households are 2-person households, comprising 1,885, and the most common type of nonfamily households are 1-person households, comprising 3,406.
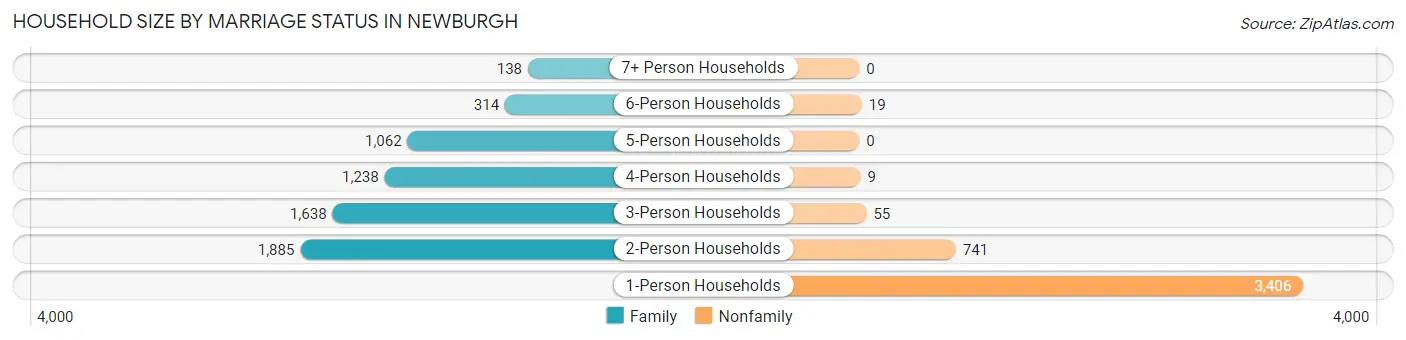
| Household Size | Family Households | Nonfamily Households |
| 1-Person Households | - | 3,406 (32.4%) |
| 2-Person Households | 1,885 (17.9%) | 741 (7.0%) |
| 3-Person Households | 1,638 (15.6%) | 55 (0.5%) |
| 4-Person Households | 1,238 (11.8%) | 9 (0.1%) |
| 5-Person Households | 1,062 (10.1%) | 0 (0.0%) |
| 6-Person Households | 314 (3.0%) | 19 (0.2%) |
| 7+ Person Households | 138 (1.3%) | 0 (0.0%) |
| Total | 6,275 (59.7%) | 4,230 (40.3%) |
Female Fertility in Newburgh
Fertility by Age in Newburgh
Average fertility rate in Newburgh is 64.0 births per 1,000 women. Women in the age bracket of 20 to 34 years have the highest fertility rate with 102.0 births per 1,000 women. Women in the age bracket of 20 to 34 years acount for 75.7% of all women with births.
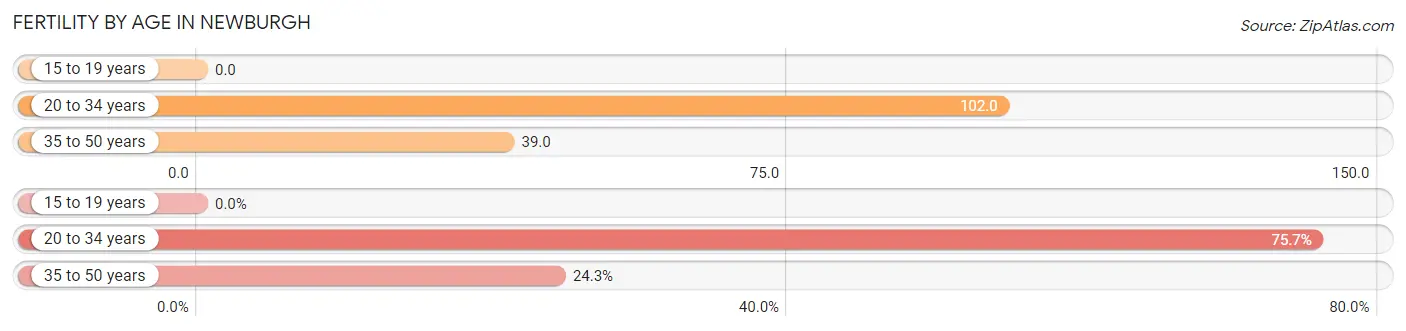
| Age Bracket | Women with Births | Births / 1,000 Women |
| 15 to 19 years | 0 (0.0%) | 0.0 |
| 20 to 34 years | 399 (75.7%) | 102.0 |
| 35 to 50 years | 128 (24.3%) | 39.0 |
| Total | 527 (100.0%) | 64.0 |
Fertility by Age by Marriage Status in Newburgh
34.3% of women with births (527) in Newburgh are married. The highest percentage of unmarried women with births falls into 20 to 34 years age bracket with 74.7% of them unmarried at the time of birth, while the lowest percentage of unmarried women with births belong to 35 to 50 years age bracket with 37.5% of them unmarried.
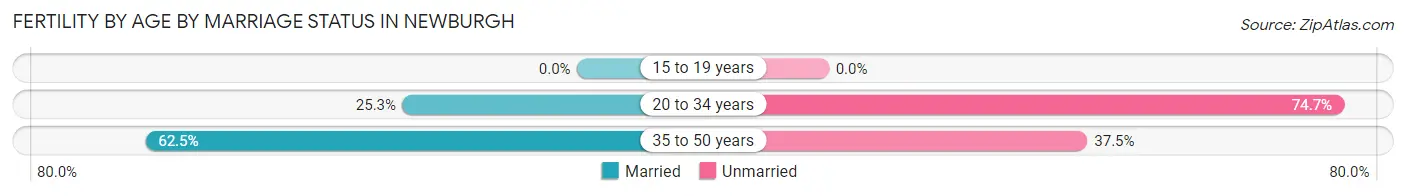
| Age Bracket | Married | Unmarried |
| 15 to 19 years | 0 (0.0%) | 0 (0.0%) |
| 20 to 34 years | 101 (25.3%) | 298 (74.7%) |
| 35 to 50 years | 80 (62.5%) | 48 (37.5%) |
| Total | 181 (34.4%) | 346 (65.6%) |
Fertility by Education in Newburgh
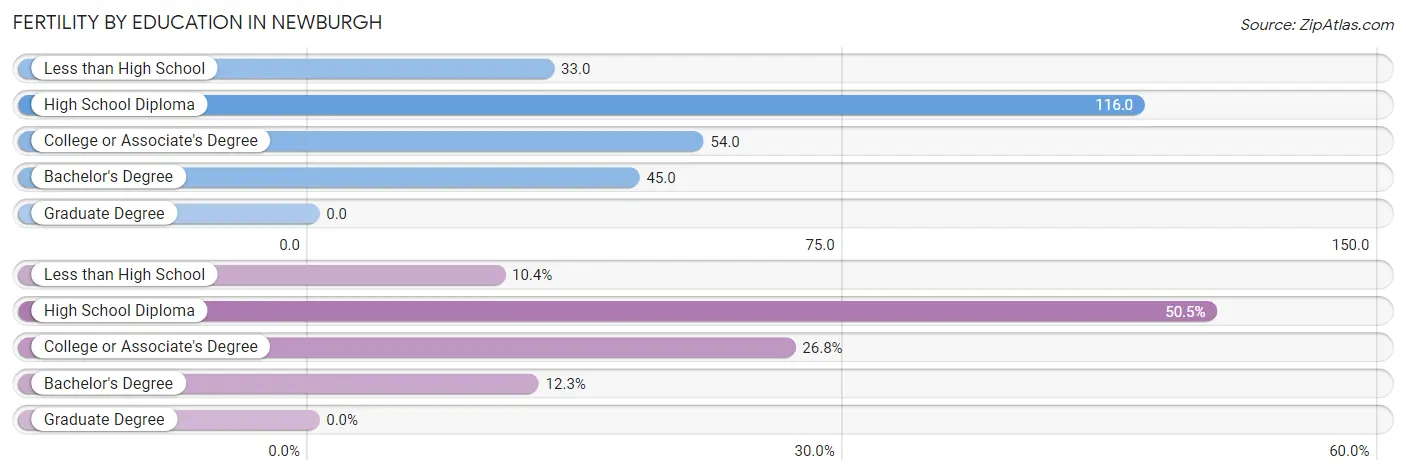
| Educational Attainment | Women with Births | Births / 1,000 Women |
| Less than High School | 55 (10.4%) | 33.0 |
| High School Diploma | 266 (50.5%) | 116.0 |
| College or Associate's Degree | 141 (26.8%) | 54.0 |
| Bachelor's Degree | 65 (12.3%) | 45.0 |
| Graduate Degree | 0 (0.0%) | 0.0 |
| Total | 527 (100.0%) | 64.0 |
Fertility by Education by Marriage Status in Newburgh
65.6% of women with births in Newburgh are unmarried. Women with the educational attainment of high school diploma are most likely to be married with 46.6% of them married at childbirth, while women with the educational attainment of less than high school are least likely to be married with 100.0% of them unmarried at childbirth.
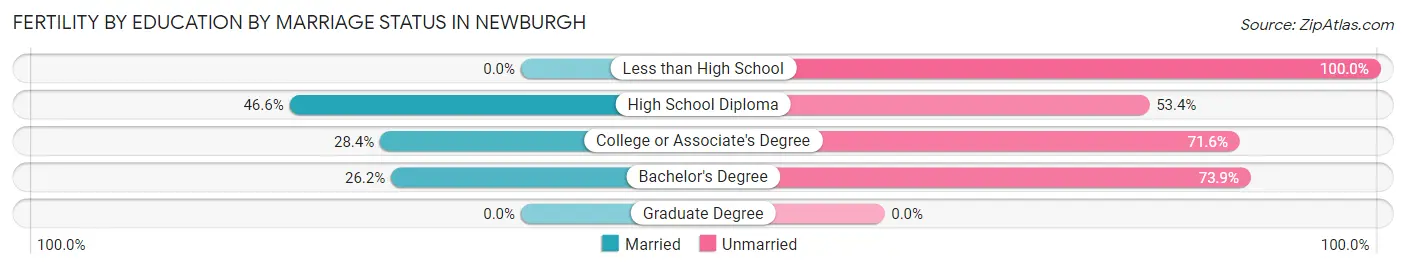
| Educational Attainment | Married | Unmarried |
| Less than High School | 0 (0.0%) | 55 (100.0%) |
| High School Diploma | 124 (46.6%) | 142 (53.4%) |
| College or Associate's Degree | 40 (28.4%) | 101 (71.6%) |
| Bachelor's Degree | 17 (26.2%) | 48 (73.9%) |
| Graduate Degree | 0 (0.0%) | 0 (0.0%) |
| Total | 181 (34.4%) | 346 (65.6%) |
Income in Newburgh
Income Overview in Newburgh
Per Capita Income in Newburgh is $27,253, while median incomes of families and households are $59,183 and $48,555 respectively.
| Characteristic | Number | Measure |
| Per Capita Income | 28,751 | $27,253 |
| Median Family Income | 6,275 | $59,183 |
| Mean Family Income | 6,275 | $80,919 |
| Median Household Income | 10,505 | $48,555 |
| Mean Household Income | 10,505 | $71,851 |
| Income Deficit | 6,275 | $13,058 |
| Wage / Income Gap (%) | 28,751 | 27.18% |
| Wage / Income Gap ($) | 28,751 | 72.82¢ per $1 |
| Gini / Inequality Index | 28,751 | 0.52 |
Earnings by Sex in Newburgh
Average Earnings in Newburgh are $32,801, $38,941 for men and $28,356 for women, a difference of 27.2%.
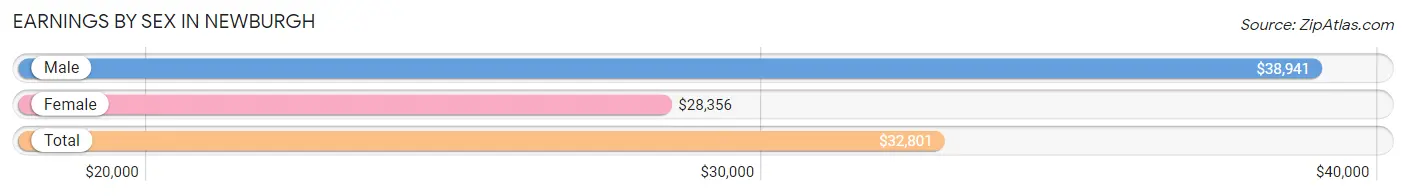
| Sex | Number | Average Earnings |
| Male | 6,793 (46.9%) | $38,941 |
| Female | 7,678 (53.1%) | $28,356 |
| Total | 14,471 (100.0%) | $32,801 |
Earnings by Sex by Income Bracket in Newburgh
The most common earnings brackets in Newburgh are $75,000 to $99,999 for men (840 | 12.4%) and $25,000 to $29,999 for women (826 | 10.8%).
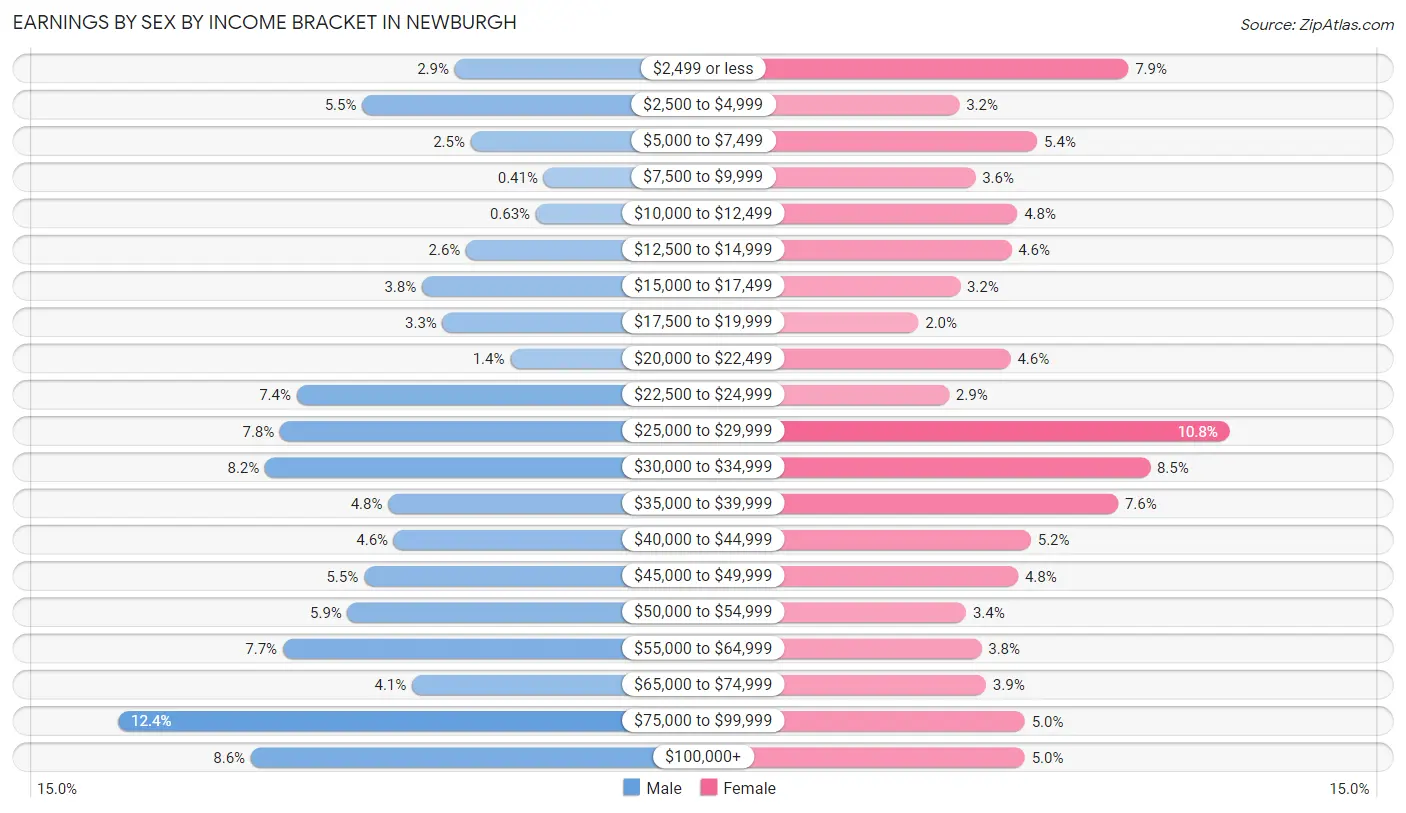
| Income | Male | Female |
| $2,499 or less | 198 (2.9%) | 607 (7.9%) |
| $2,500 to $4,999 | 374 (5.5%) | 243 (3.2%) |
| $5,000 to $7,499 | 167 (2.5%) | 411 (5.3%) |
| $7,500 to $9,999 | 28 (0.4%) | 277 (3.6%) |
| $10,000 to $12,499 | 43 (0.6%) | 368 (4.8%) |
| $12,500 to $14,999 | 176 (2.6%) | 355 (4.6%) |
| $15,000 to $17,499 | 260 (3.8%) | 244 (3.2%) |
| $17,500 to $19,999 | 221 (3.3%) | 154 (2.0%) |
| $20,000 to $22,499 | 92 (1.3%) | 353 (4.6%) |
| $22,500 to $24,999 | 499 (7.3%) | 220 (2.9%) |
| $25,000 to $29,999 | 531 (7.8%) | 826 (10.8%) |
| $30,000 to $34,999 | 560 (8.2%) | 654 (8.5%) |
| $35,000 to $39,999 | 325 (4.8%) | 585 (7.6%) |
| $40,000 to $44,999 | 314 (4.6%) | 397 (5.2%) |
| $45,000 to $49,999 | 371 (5.5%) | 369 (4.8%) |
| $50,000 to $54,999 | 402 (5.9%) | 257 (3.4%) |
| $55,000 to $64,999 | 526 (7.7%) | 290 (3.8%) |
| $65,000 to $74,999 | 279 (4.1%) | 300 (3.9%) |
| $75,000 to $99,999 | 840 (12.4%) | 384 (5.0%) |
| $100,000+ | 587 (8.6%) | 384 (5.0%) |
| Total | 6,793 (100.0%) | 7,678 (100.0%) |
Earnings by Sex by Educational Attainment in Newburgh
Average earnings in Newburgh are $47,255 for men and $32,632 for women, a difference of 30.9%. Men with an educational attainment of bachelor's degree enjoy the highest average annual earnings of $82,231, while those with less than high school education earn the least with $32,151. Women with an educational attainment of graduate degree earn the most with the average annual earnings of $81,250, while those with less than high school education have the smallest earnings of $15,152.
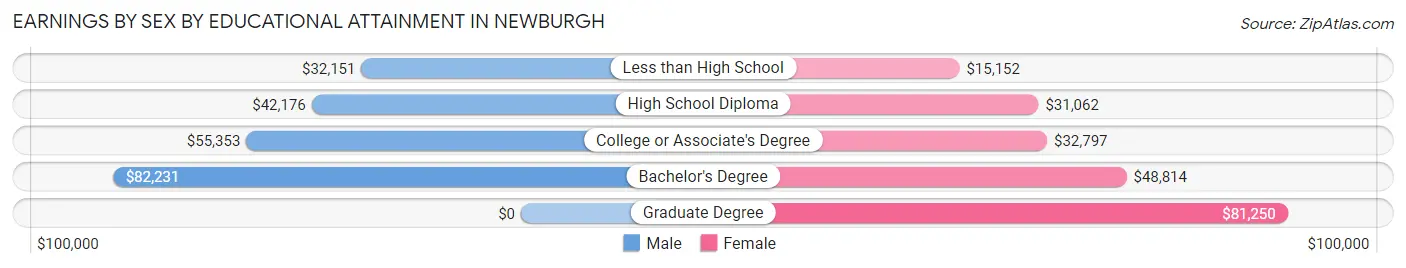
| Educational Attainment | Male Income | Female Income |
| Less than High School | $32,151 | $15,152 |
| High School Diploma | $42,176 | $31,062 |
| College or Associate's Degree | $55,353 | $32,797 |
| Bachelor's Degree | $82,231 | $48,814 |
| Graduate Degree | - | - |
| Total | $47,255 | $32,632 |
Family Income in Newburgh
Family Income Brackets in Newburgh
According to the Newburgh family income data, there are 1,098 families falling into the $50,000 to $74,999 income range, which is the most common income bracket and makes up 17.5% of all families. Conversely, the $10,000 to $14,999 income bracket is the least frequent group with only 257 families (4.1%) belonging to this category.
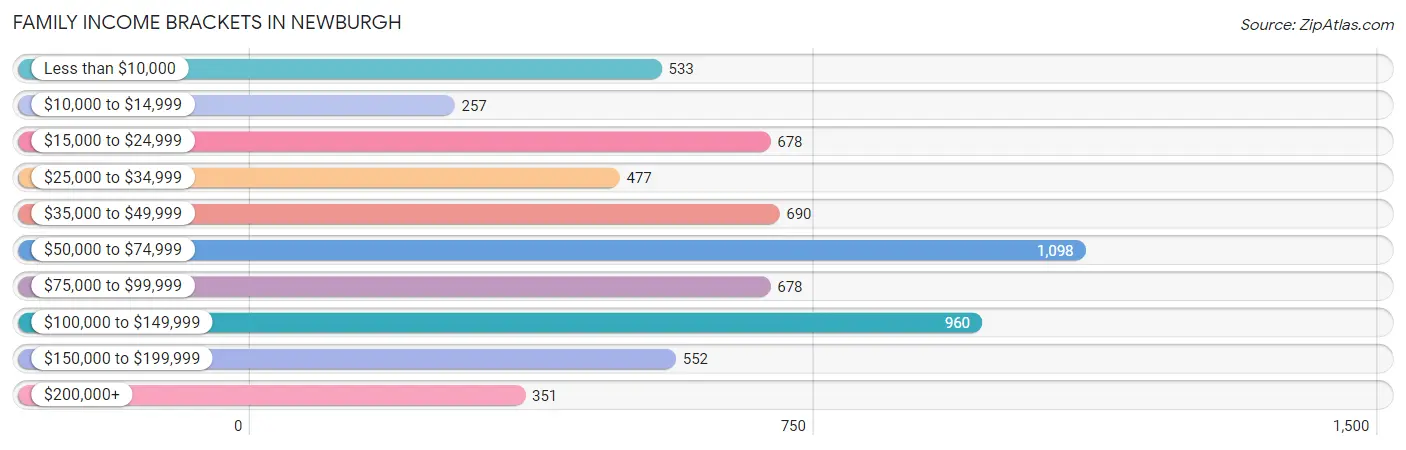
| Income Bracket | # Families | % Families |
| Less than $10,000 | 533 | 8.5% |
| $10,000 to $14,999 | 257 | 4.1% |
| $15,000 to $24,999 | 678 | 10.8% |
| $25,000 to $34,999 | 477 | 7.6% |
| $35,000 to $49,999 | 690 | 11.0% |
| $50,000 to $74,999 | 1,098 | 17.5% |
| $75,000 to $99,999 | 678 | 10.8% |
| $100,000 to $149,999 | 960 | 15.3% |
| $150,000 to $199,999 | 552 | 8.8% |
| $200,000+ | 351 | 5.6% |
Family Income by Famaliy Size in Newburgh
7+ person families (78 | 1.2%) account for the highest median family income in Newburgh with $150,278 per family, while 3-person families (1,424 | 22.7%) have the highest median income of $27,051 per family member.
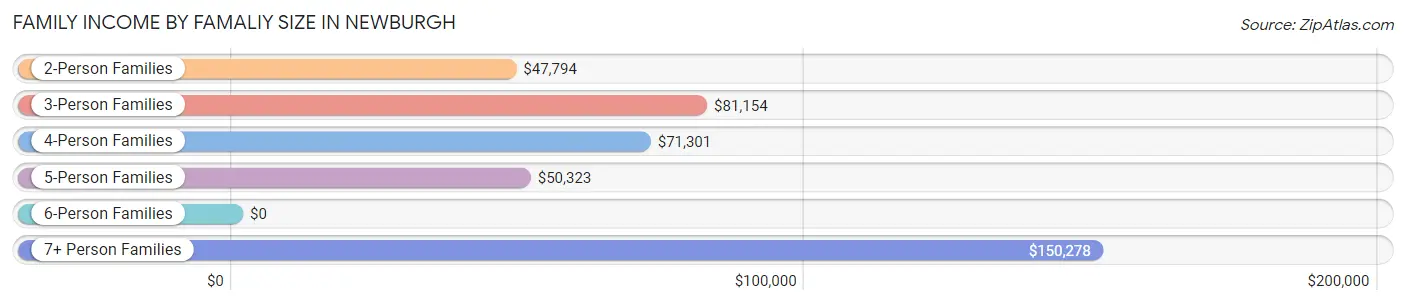
| Income Bracket | # Families | Median Income |
| 2-Person Families | 2,314 (36.9%) | $47,794 |
| 3-Person Families | 1,424 (22.7%) | $81,154 |
| 4-Person Families | 1,182 (18.8%) | $71,301 |
| 5-Person Families | 967 (15.4%) | $50,323 |
| 6-Person Families | 310 (4.9%) | $0 |
| 7+ Person Families | 78 (1.2%) | $150,278 |
| Total | 6,275 (100.0%) | $59,183 |
Family Income by Number of Earners in Newburgh
The median family income in Newburgh is $59,183, with families comprising 3+ earners (938) having the highest median family income of $109,559, while families with no earners (846) have the lowest median family income of $12,022, accounting for 14.9% and 13.5% of families, respectively.
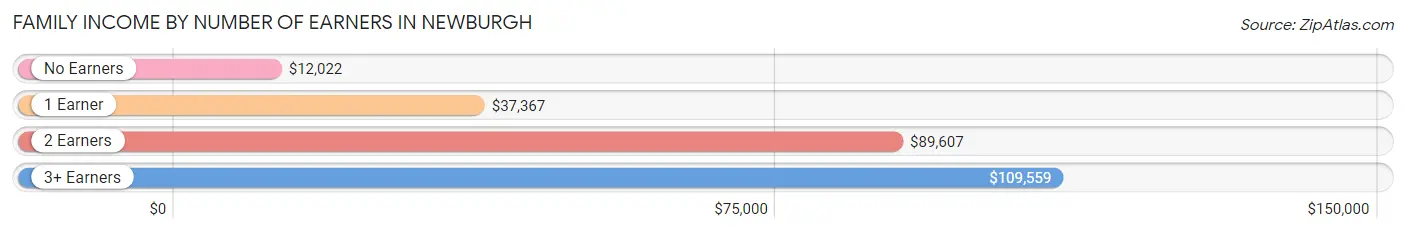
| Number of Earners | # Families | Median Income |
| No Earners | 846 (13.5%) | $12,022 |
| 1 Earner | 2,414 (38.5%) | $37,367 |
| 2 Earners | 2,077 (33.1%) | $89,607 |
| 3+ Earners | 938 (14.9%) | $109,559 |
| Total | 6,275 (100.0%) | $59,183 |
Household Income in Newburgh
Household Income Brackets in Newburgh
With 1,502 households falling in the category, the $50,000 to $74,999 income range is the most frequent in Newburgh, accounting for 14.3% of all households. In contrast, only 452 households (4.3%) fall into the $200,000+ income bracket, making it the least populous group.
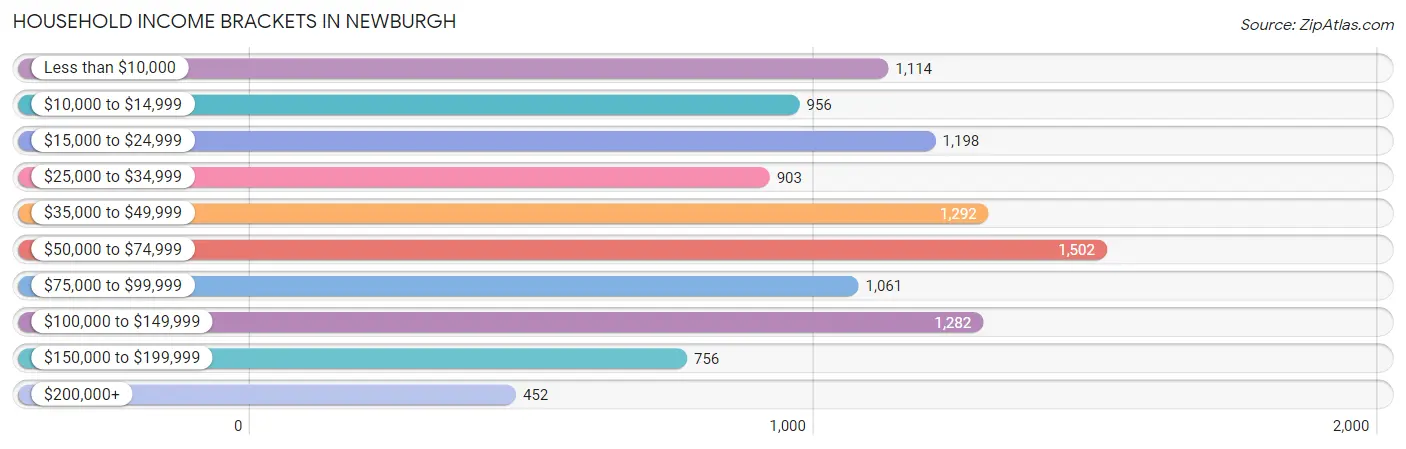
| Income Bracket | # Households | % Households |
| Less than $10,000 | 1,114 | 10.6% |
| $10,000 to $14,999 | 956 | 9.1% |
| $15,000 to $24,999 | 1,198 | 11.4% |
| $25,000 to $34,999 | 903 | 8.6% |
| $35,000 to $49,999 | 1,292 | 12.3% |
| $50,000 to $74,999 | 1,502 | 14.3% |
| $75,000 to $99,999 | 1,061 | 10.1% |
| $100,000 to $149,999 | 1,282 | 12.2% |
| $150,000 to $199,999 | 756 | 7.2% |
| $200,000+ | 452 | 4.3% |
Household Income by Householder Age in Newburgh
The median household income in Newburgh is $48,555, with the highest median household income of $56,168 found in the 45 to 64 years age bracket for the primary householder. A total of 3,979 households (37.9%) fall into this category. Meanwhile, the 15 to 24 years age bracket for the primary householder has the lowest median household income of $0, with 216 households (2.1%) in this group.
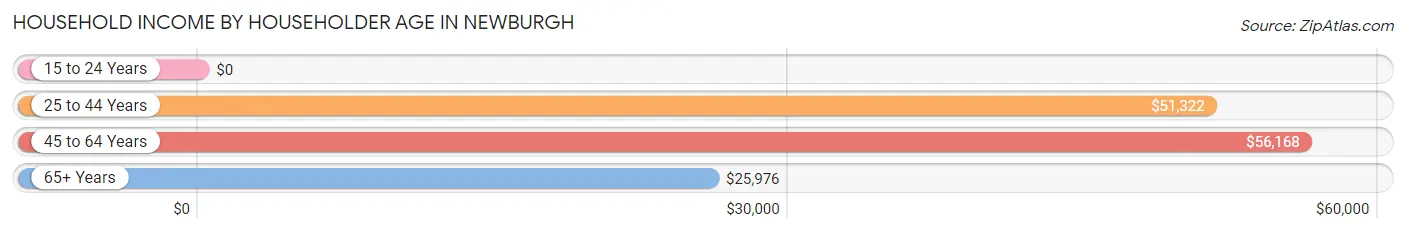
| Income Bracket | # Households | Median Income |
| 15 to 24 Years | 216 (2.1%) | $0 |
| 25 to 44 Years | 4,002 (38.1%) | $51,322 |
| 45 to 64 Years | 3,979 (37.9%) | $56,168 |
| 65+ Years | 2,308 (22.0%) | $25,976 |
| Total | 10,505 (100.0%) | $48,555 |
Poverty in Newburgh
Income Below Poverty by Sex and Age in Newburgh
With 25.1% poverty level for males and 27.7% for females among the residents of Newburgh, under 5 year old males and 6 to 11 year old females are the most vulnerable to poverty, with 454 males (54.8%) and 366 females (35.5%) in their respective age groups living below the poverty level.
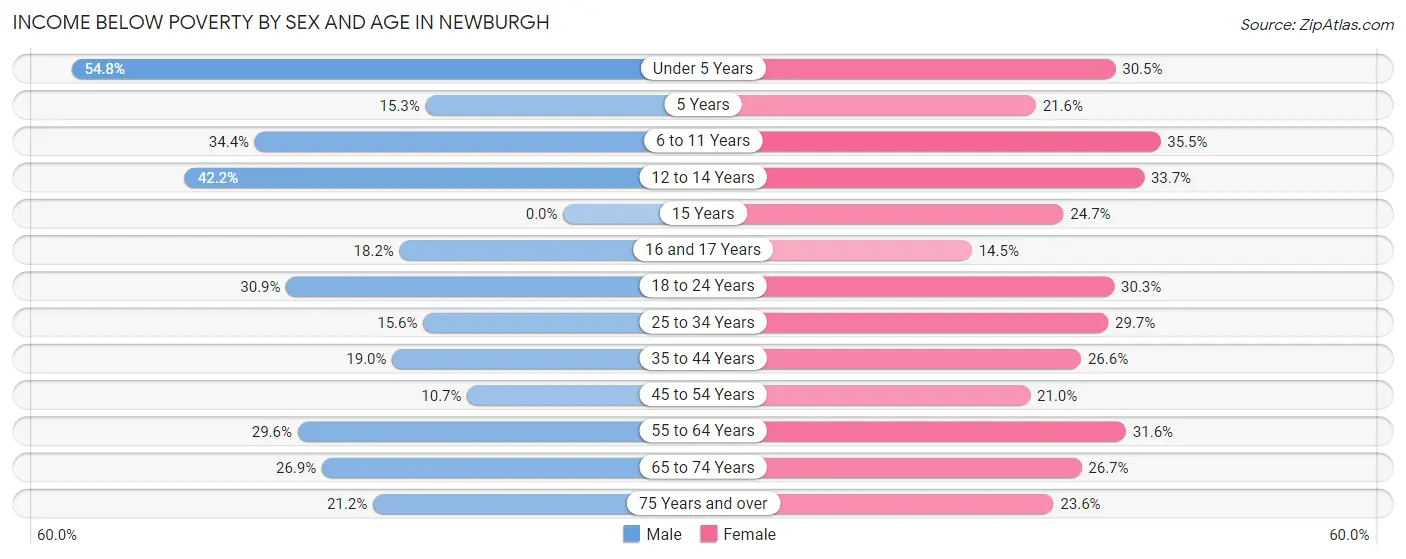
| Age Bracket | Male | Female |
| Under 5 Years | 454 (54.8%) | 233 (30.5%) |
| 5 Years | 27 (15.3%) | 35 (21.6%) |
| 6 to 11 Years | 575 (34.4%) | 366 (35.5%) |
| 12 to 14 Years | 282 (42.1%) | 211 (33.7%) |
| 15 Years | 0 (0.0%) | 19 (24.7%) |
| 16 and 17 Years | 68 (18.2%) | 69 (14.5%) |
| 18 to 24 Years | 467 (30.8%) | 401 (30.3%) |
| 25 to 34 Years | 317 (15.6%) | 773 (29.7%) |
| 35 to 44 Years | 296 (19.0%) | 479 (26.6%) |
| 45 to 54 Years | 214 (10.7%) | 432 (21.0%) |
| 55 to 64 Years | 343 (29.6%) | 456 (31.6%) |
| 65 to 74 Years | 219 (26.9%) | 377 (26.7%) |
| 75 Years and over | 96 (21.2%) | 206 (23.6%) |
| Total | 3,358 (25.1%) | 4,057 (27.7%) |
Income Above Poverty by Sex and Age in Newburgh
According to the poverty statistics in Newburgh, males aged 15 years and females aged 16 and 17 years are the age groups that are most secure financially, with 100.0% of males and 85.5% of females in these age groups living above the poverty line.
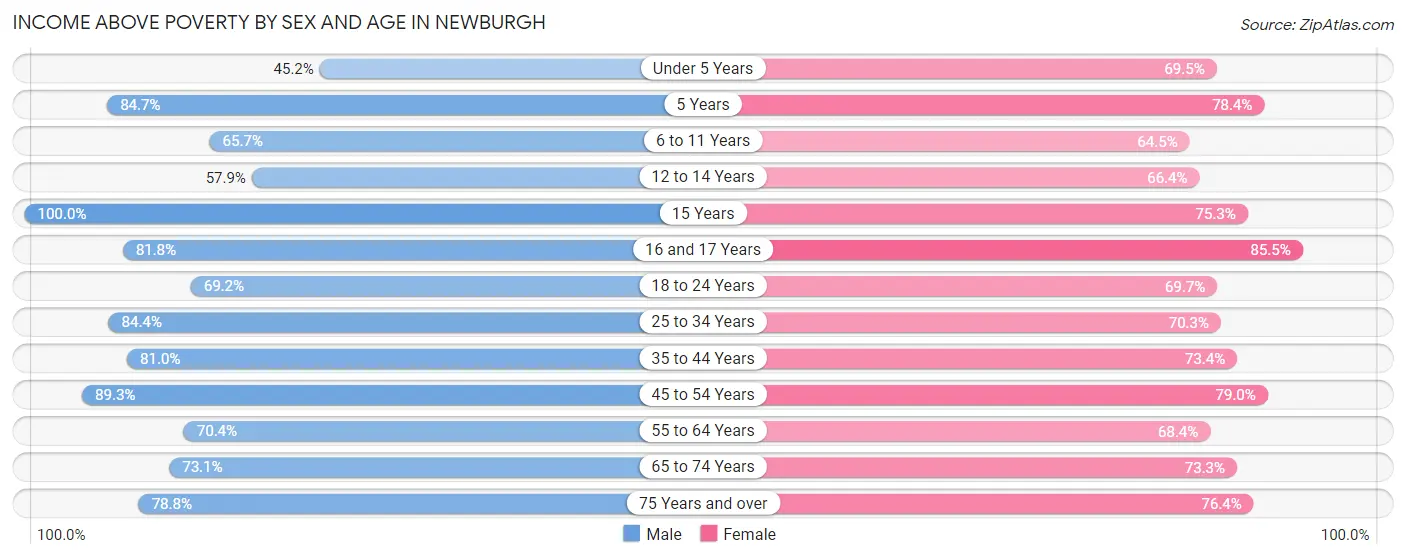
| Age Bracket | Male | Female |
| Under 5 Years | 375 (45.2%) | 532 (69.5%) |
| 5 Years | 149 (84.7%) | 127 (78.4%) |
| 6 to 11 Years | 1,099 (65.6%) | 666 (64.5%) |
| 12 to 14 Years | 387 (57.9%) | 416 (66.3%) |
| 15 Years | 108 (100.0%) | 58 (75.3%) |
| 16 and 17 Years | 305 (81.8%) | 408 (85.5%) |
| 18 to 24 Years | 1,047 (69.2%) | 921 (69.7%) |
| 25 to 34 Years | 1,715 (84.4%) | 1,833 (70.3%) |
| 35 to 44 Years | 1,259 (81.0%) | 1,319 (73.4%) |
| 45 to 54 Years | 1,788 (89.3%) | 1,628 (79.0%) |
| 55 to 64 Years | 817 (70.4%) | 985 (68.4%) |
| 65 to 74 Years | 596 (73.1%) | 1,036 (73.3%) |
| 75 Years and over | 357 (78.8%) | 668 (76.4%) |
| Total | 10,002 (74.9%) | 10,597 (72.3%) |
Income Below Poverty Among Married-Couple Families in Newburgh
The poverty statistics for married-couple families in Newburgh show that 6.4% or 183 of the total 2,862 families live below the poverty line. Families with 3 or 4 children have the highest poverty rate of 25.4%, comprising of 65 families. On the other hand, families with 5 or more children have the lowest poverty rate of 0.0%, which includes 0 families.
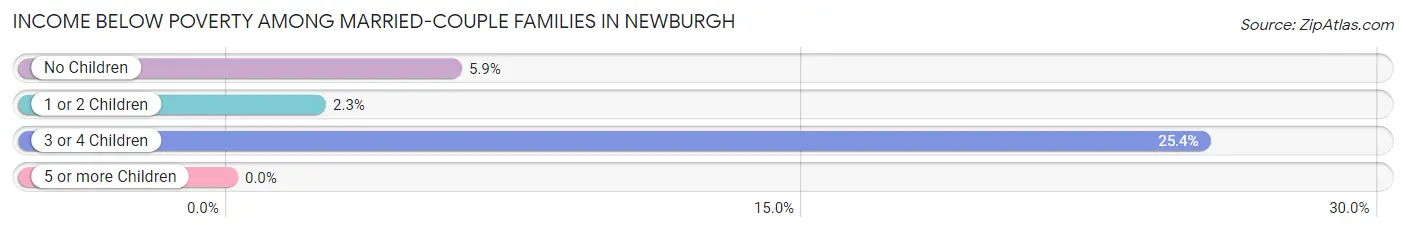
| Children | Above Poverty | Below Poverty |
| No Children | 1,544 (94.2%) | 96 (5.9%) |
| 1 or 2 Children | 934 (97.7%) | 22 (2.3%) |
| 3 or 4 Children | 191 (74.6%) | 65 (25.4%) |
| 5 or more Children | 10 (100.0%) | 0 (0.0%) |
| Total | 2,679 (93.6%) | 183 (6.4%) |
Income Below Poverty Among Single-Parent Households in Newburgh
According to the poverty data in Newburgh, 45.7% or 414 single-father households and 36.7% or 919 single-mother households are living below the poverty line. Among single-father households, those with 3 or 4 children have the highest poverty rate, with 211 households (100.0%) experiencing poverty. Likewise, among single-mother households, those with 3 or 4 children have the highest poverty rate, with 220 households (49.2%) falling below the poverty line.
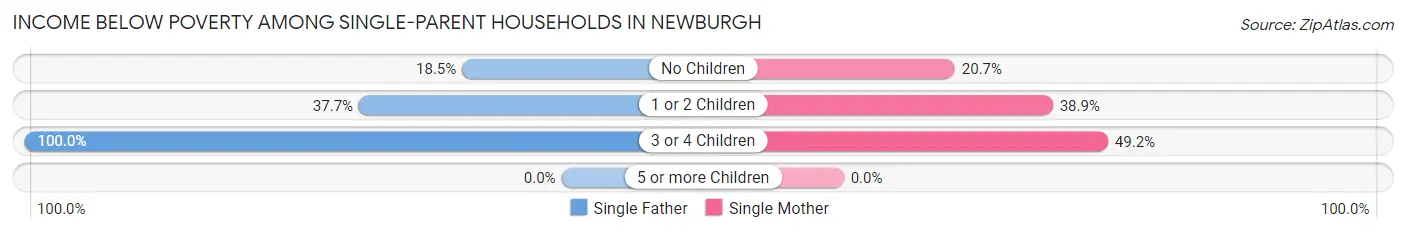
| Children | Single Father | Single Mother |
| No Children | 57 (18.5%) | 117 (20.7%) |
| 1 or 2 Children | 146 (37.7%) | 582 (38.9%) |
| 3 or 4 Children | 211 (100.0%) | 220 (49.2%) |
| 5 or more Children | 0 (0.0%) | 0 (0.0%) |
| Total | 414 (45.7%) | 919 (36.7%) |
Income Below Poverty Among Married-Couple vs Single-Parent Households in Newburgh
The poverty data for Newburgh shows that 183 of the married-couple family households (6.4%) and 1,333 of the single-parent households (39.1%) are living below the poverty level. Within the married-couple family households, those with 3 or 4 children have the highest poverty rate, with 65 households (25.4%) falling below the poverty line. Among the single-parent households, those with 3 or 4 children have the highest poverty rate, with 431 household (65.5%) living below poverty.
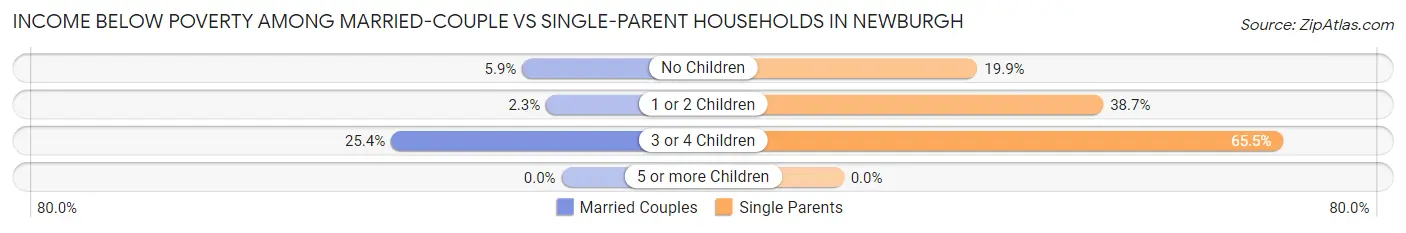
| Children | Married-Couple Families | Single-Parent Households |
| No Children | 96 (5.9%) | 174 (19.9%) |
| 1 or 2 Children | 22 (2.3%) | 728 (38.7%) |
| 3 or 4 Children | 65 (25.4%) | 431 (65.5%) |
| 5 or more Children | 0 (0.0%) | 0 (0.0%) |
| Total | 183 (6.4%) | 1,333 (39.1%) |
Employment Characteristics in Newburgh
Employment by Class of Employer in Newburgh
Among the 12,398 employed individuals in Newburgh, private company employees (9,247 | 74.6%), not-for-profit organizations (1,355 | 10.9%), and local government employees (494 | 4.0%) make up the most common classes of employment.
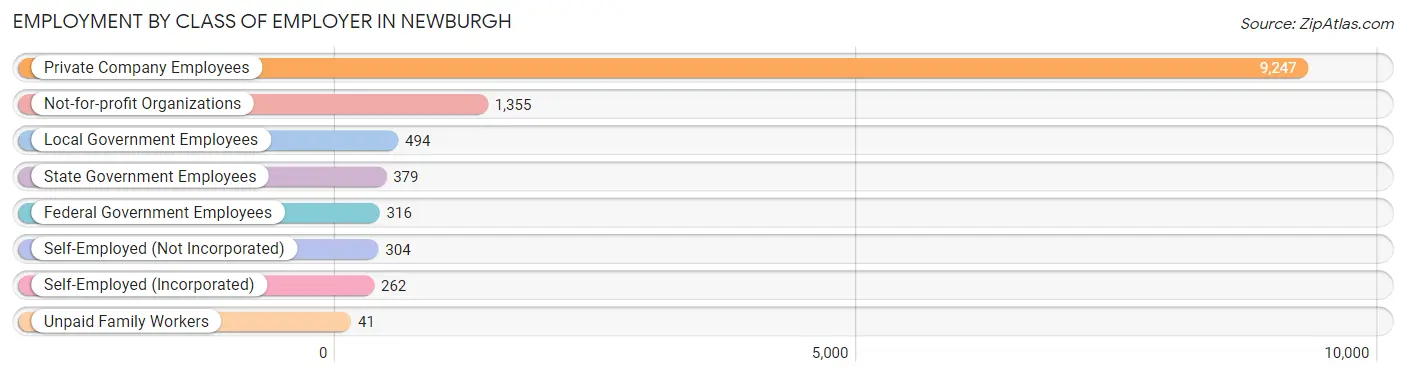
| Employer Class | # Employees | % Employees |
| Private Company Employees | 9,247 | 74.6% |
| Self-Employed (Incorporated) | 262 | 2.1% |
| Self-Employed (Not Incorporated) | 304 | 2.5% |
| Not-for-profit Organizations | 1,355 | 10.9% |
| Local Government Employees | 494 | 4.0% |
| State Government Employees | 379 | 3.1% |
| Federal Government Employees | 316 | 2.5% |
| Unpaid Family Workers | 41 | 0.3% |
| Total | 12,398 | 100.0% |
Employment Status by Age in Newburgh
According to the labor force statistics for Newburgh, out of the total population over 16 years of age (22,550), 61.4% or 13,846 individuals are in the labor force, with 7.8% or 1,080 of them unemployed. The age group with the highest labor force participation rate is 45 to 54 years, with 81.5% or 3,311 individuals in the labor force. Within the labor force, the 16 to 19 years age range has the highest percentage of unemployed individuals, with 32.4% or 223 of them being unemployed.
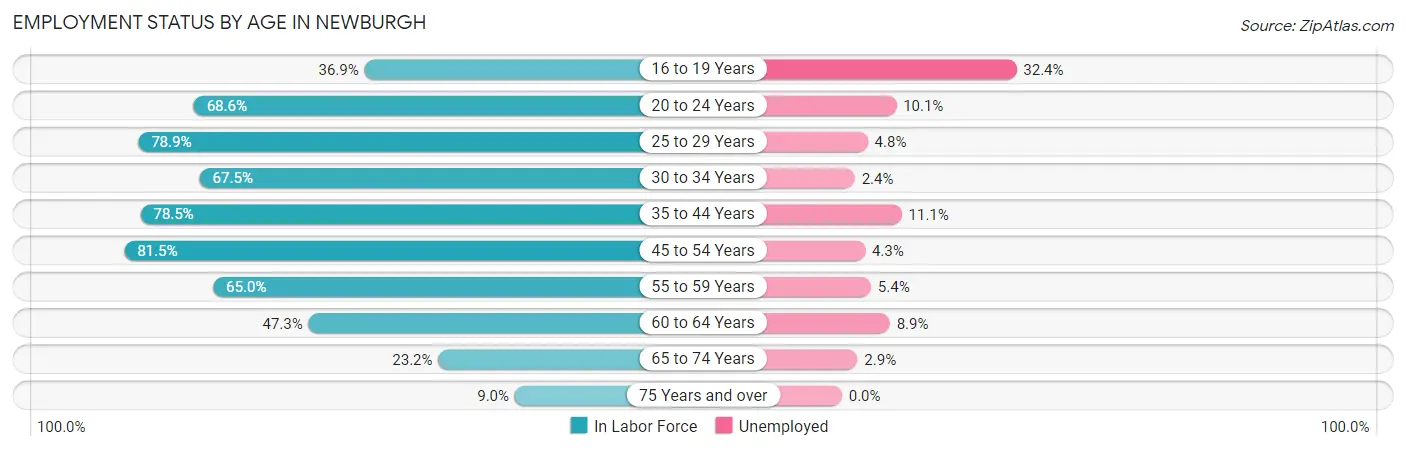
| Age Bracket | In Labor Force | Unemployed |
| 16 to 19 Years | 687 (36.9%) | 223 (32.4%) |
| 20 to 24 Years | 1,678 (68.6%) | 169 (10.1%) |
| 25 to 29 Years | 1,943 (78.9%) | 93 (4.8%) |
| 30 to 34 Years | 1,476 (67.5%) | 35 (2.4%) |
| 35 to 44 Years | 2,645 (78.5%) | 294 (11.1%) |
| 45 to 54 Years | 3,311 (81.5%) | 142 (4.3%) |
| 55 to 59 Years | 826 (65.0%) | 45 (5.4%) |
| 60 to 64 Years | 630 (47.3%) | 56 (8.9%) |
| 65 to 74 Years | 517 (23.2%) | 15 (2.9%) |
| 75 Years and over | 120 (9.0%) | 0 (0.0%) |
| Total | 13,846 (61.4%) | 1,080 (7.8%) |
Employment Status by Educational Attainment in Newburgh
According to labor force statistics for Newburgh, 73.8% of individuals (10,836) out of the total population between 25 and 64 years of age (14,683) are in the labor force, with 6.2% or 672 of them being unemployed. The group with the highest labor force participation rate are those with the educational attainment of bachelor's degree or higher, with 84.2% or 2,381 individuals in the labor force. Within the labor force, individuals with less than high school education have the highest percentage of unemployment, with 14.2% or 245 of them being unemployed.
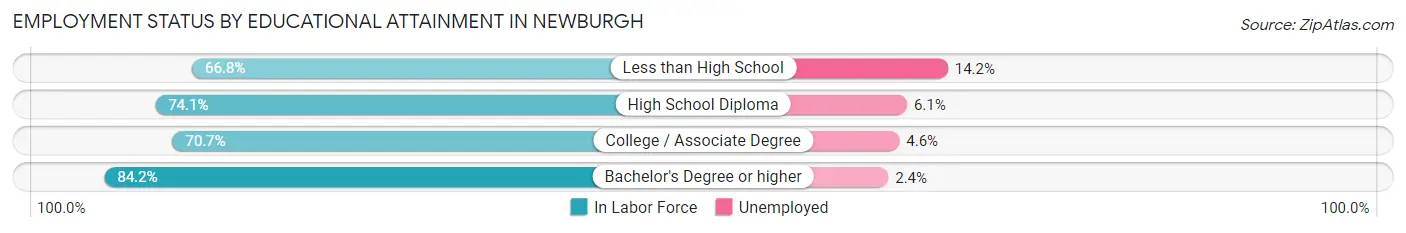
| Educational Attainment | In Labor Force | Unemployed |
| Less than High School | 1,728 (66.8%) | 367 (14.2%) |
| High School Diploma | 3,703 (74.1%) | 305 (6.1%) |
| College / Associate Degree | 3,020 (70.7%) | 196 (4.6%) |
| Bachelor's Degree or higher | 2,381 (84.2%) | 68 (2.4%) |
| Total | 10,836 (73.8%) | 910 (6.2%) |
Employment Occupations by Sex in Newburgh
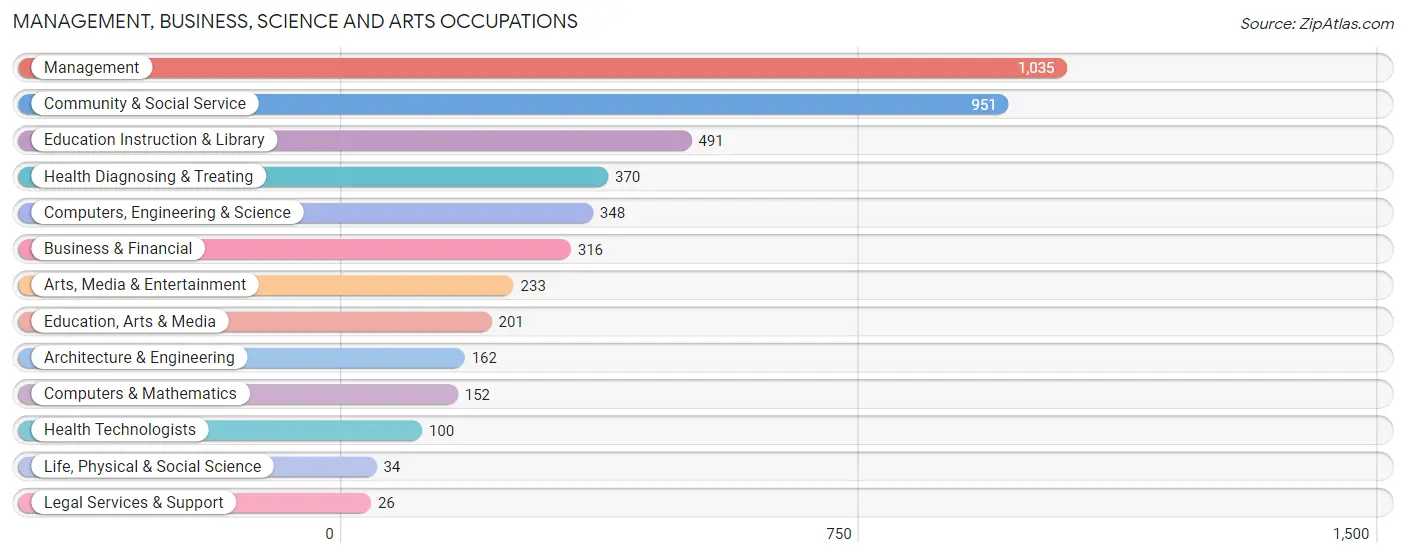
Management, Business, Science and Arts Occupations
The most common Management, Business, Science and Arts occupations in Newburgh are Management (1,035 | 8.1%), Community & Social Service (951 | 7.4%), Education Instruction & Library (491 | 3.8%), Health Diagnosing & Treating (370 | 2.9%), and Computers, Engineering & Science (348 | 2.7%).
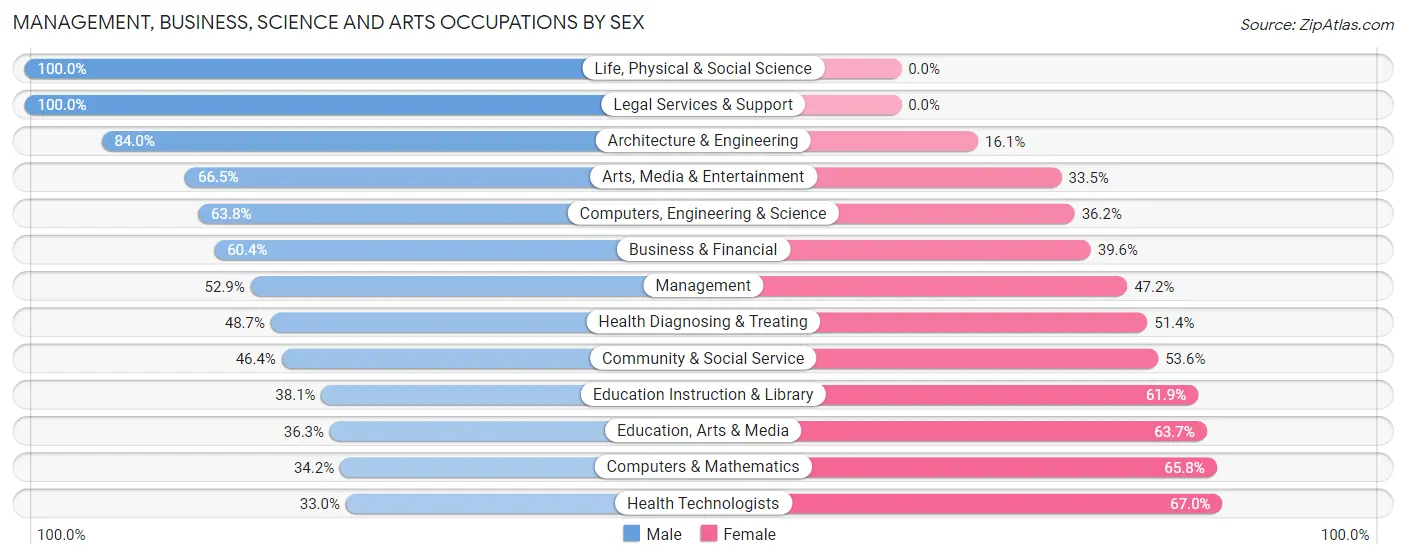
Management, Business, Science and Arts Occupations by Sex
Within the Management, Business, Science and Arts occupations in Newburgh, the most male-oriented occupations are Life, Physical & Social Science (100.0%), Legal Services & Support (100.0%), and Architecture & Engineering (84.0%), while the most female-oriented occupations are Health Technologists (67.0%), Computers & Mathematics (65.8%), and Education, Arts & Media (63.7%).
| Occupation | Male | Female |
| Management | 547 (52.8%) | 488 (47.1%) |
| Business & Financial | 191 (60.4%) | 125 (39.6%) |
| Computers, Engineering & Science | 222 (63.8%) | 126 (36.2%) |
| Computers & Mathematics | 52 (34.2%) | 100 (65.8%) |
| Architecture & Engineering | 136 (84.0%) | 26 (16.1%) |
| Life, Physical & Social Science | 34 (100.0%) | 0 (0.0%) |
| Community & Social Service | 441 (46.4%) | 510 (53.6%) |
| Education, Arts & Media | 73 (36.3%) | 128 (63.7%) |
| Legal Services & Support | 26 (100.0%) | 0 (0.0%) |
| Education Instruction & Library | 187 (38.1%) | 304 (61.9%) |
| Arts, Media & Entertainment | 155 (66.5%) | 78 (33.5%) |
| Health Diagnosing & Treating | 180 (48.6%) | 190 (51.3%) |
| Health Technologists | 33 (33.0%) | 67 (67.0%) |
| Total (Category) | 1,581 (52.3%) | 1,439 (47.6%) |
| Total (Overall) | 6,081 (47.6%) | 6,680 (52.3%) |
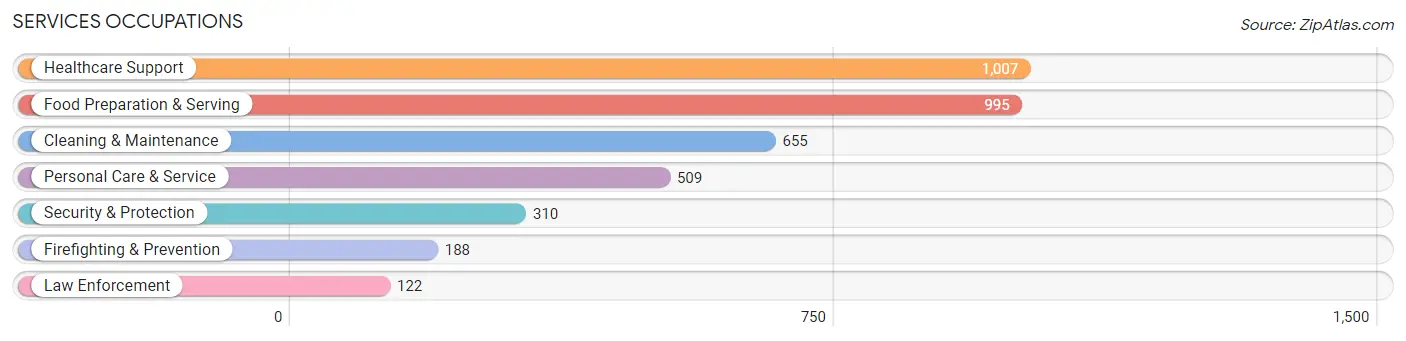
Services Occupations
The most common Services occupations in Newburgh are Healthcare Support (1,007 | 7.9%), Food Preparation & Serving (995 | 7.8%), Cleaning & Maintenance (655 | 5.1%), Personal Care & Service (509 | 4.0%), and Security & Protection (310 | 2.4%).
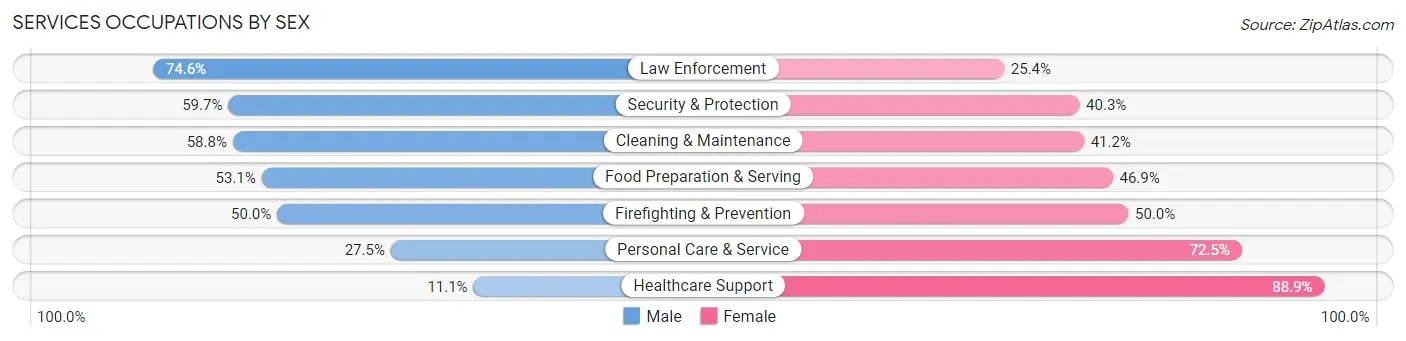
Services Occupations by Sex
Within the Services occupations in Newburgh, the most male-oriented occupations are Law Enforcement (74.6%), Security & Protection (59.7%), and Cleaning & Maintenance (58.8%), while the most female-oriented occupations are Healthcare Support (88.9%), Personal Care & Service (72.5%), and Firefighting & Prevention (50.0%).
| Occupation | Male | Female |
| Healthcare Support | 112 (11.1%) | 895 (88.9%) |
| Security & Protection | 185 (59.7%) | 125 (40.3%) |
| Firefighting & Prevention | 94 (50.0%) | 94 (50.0%) |
| Law Enforcement | 91 (74.6%) | 31 (25.4%) |
| Food Preparation & Serving | 528 (53.1%) | 467 (46.9%) |
| Cleaning & Maintenance | 385 (58.8%) | 270 (41.2%) |
| Personal Care & Service | 140 (27.5%) | 369 (72.5%) |
| Total (Category) | 1,350 (38.8%) | 2,126 (61.2%) |
| Total (Overall) | 6,081 (47.6%) | 6,680 (52.3%) |
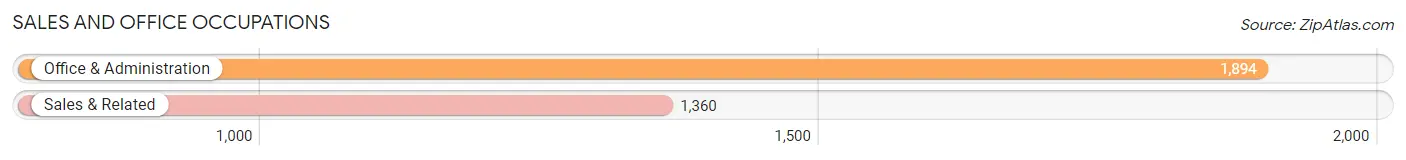
Sales and Office Occupations
The most common Sales and Office occupations in Newburgh are Office & Administration (1,894 | 14.8%), and Sales & Related (1,360 | 10.7%).
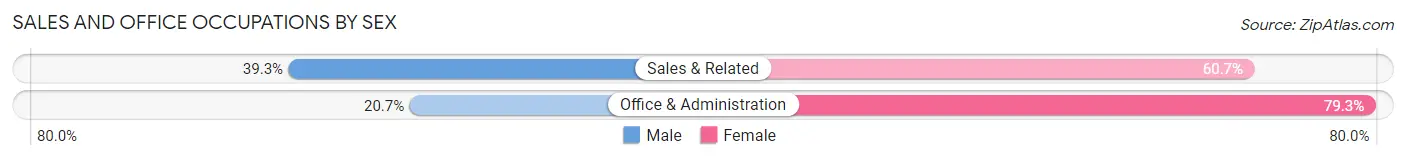
Sales and Office Occupations by Sex
| Occupation | Male | Female |
| Sales & Related | 535 (39.3%) | 825 (60.7%) |
| Office & Administration | 392 (20.7%) | 1,502 (79.3%) |
| Total (Category) | 927 (28.5%) | 2,327 (71.5%) |
| Total (Overall) | 6,081 (47.6%) | 6,680 (52.3%) |
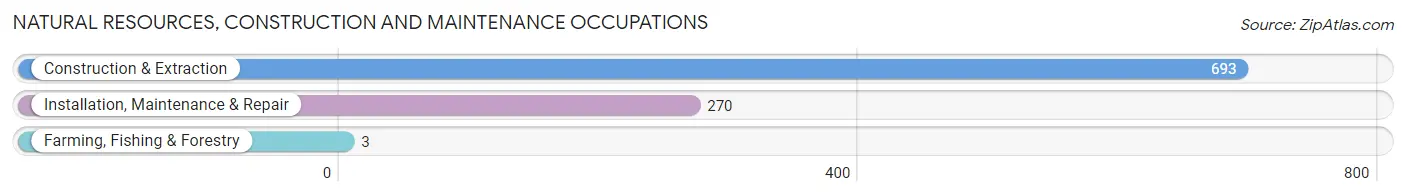
Natural Resources, Construction and Maintenance Occupations
The most common Natural Resources, Construction and Maintenance occupations in Newburgh are Construction & Extraction (693 | 5.4%), Installation, Maintenance & Repair (270 | 2.1%), and Farming, Fishing & Forestry (3 | 0.0%).
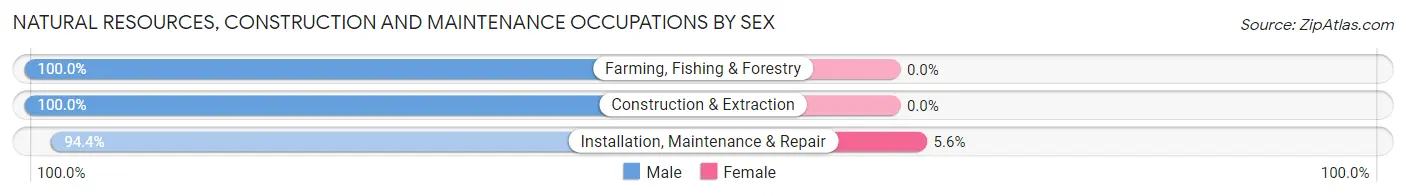
Natural Resources, Construction and Maintenance Occupations by Sex
| Occupation | Male | Female |
| Farming, Fishing & Forestry | 3 (100.0%) | 0 (0.0%) |
| Construction & Extraction | 693 (100.0%) | 0 (0.0%) |
| Installation, Maintenance & Repair | 255 (94.4%) | 15 (5.6%) |
| Total (Category) | 951 (98.5%) | 15 (1.5%) |
| Total (Overall) | 6,081 (47.6%) | 6,680 (52.3%) |
Production, Transportation and Moving Occupations
The most common Production, Transportation and Moving occupations in Newburgh are Production (846 | 6.6%), Material Moving (714 | 5.6%), and Transportation (485 | 3.8%).
Production, Transportation and Moving Occupations by Sex
| Occupation | Male | Female |
| Production | 452 (53.4%) | 394 (46.6%) |
| Transportation | 313 (64.5%) | 172 (35.5%) |
| Material Moving | 507 (71.0%) | 207 (29.0%) |
| Total (Category) | 1,272 (62.2%) | 773 (37.8%) |
| Total (Overall) | 6,081 (47.6%) | 6,680 (52.3%) |
Employment Industries by Sex in Newburgh
Employment Industries in Newburgh
The major employment industries in Newburgh include Health Care & Social Assistance (2,103 | 16.5%), Retail Trade (2,076 | 16.3%), Educational Services (1,237 | 9.7%), Transportation & Warehousing (1,011 | 7.9%), and Construction (891 | 7.0%).
Employment Industries by Sex in Newburgh
The Newburgh industries that see more men than women are Utilities (100.0%), Construction (95.3%), and Arts, Entertainment & Recreation (89.2%), whereas the industries that tend to have a higher number of women are Agriculture, Fishing & Hunting (83.8%), Health Care & Social Assistance (79.1%), and Finance & Insurance (78.6%).
| Industry | Male | Female |
| Agriculture, Fishing & Hunting | 13 (16.3%) | 67 (83.8%) |
| Mining, Quarrying, & Extraction | 0 (0.0%) | 0 (0.0%) |
| Construction | 849 (95.3%) | 42 (4.7%) |
| Manufacturing | 370 (44.1%) | 469 (55.9%) |
| Wholesale Trade | 302 (54.9%) | 248 (45.1%) |
| Retail Trade | 925 (44.6%) | 1,151 (55.4%) |
| Transportation & Warehousing | 634 (62.7%) | 377 (37.3%) |
| Utilities | 28 (100.0%) | 0 (0.0%) |
| Information | 85 (64.4%) | 47 (35.6%) |
| Finance & Insurance | 99 (21.4%) | 363 (78.6%) |
| Real Estate, Rental & Leasing | 52 (59.8%) | 35 (40.2%) |
| Professional & Scientific | 299 (69.9%) | 129 (30.1%) |
| Enterprise Management | 0 (0.0%) | 0 (0.0%) |
| Administrative & Support | 307 (66.3%) | 156 (33.7%) |
| Educational Services | 419 (33.9%) | 818 (66.1%) |
| Health Care & Social Assistance | 439 (20.9%) | 1,664 (79.1%) |
| Arts, Entertainment & Recreation | 281 (89.2%) | 34 (10.8%) |
| Accommodation & Food Services | 410 (47.7%) | 449 (52.3%) |
| Public Administration | 216 (52.4%) | 196 (47.6%) |
| Total | 6,081 (47.6%) | 6,680 (52.3%) |
Education in Newburgh
School Enrollment in Newburgh
The most common levels of schooling among the 8,768 students in Newburgh are college / undergraduate (2,383 | 27.2%), middle school (2,307 | 26.3%), and elementary school (1,537 | 17.5%).
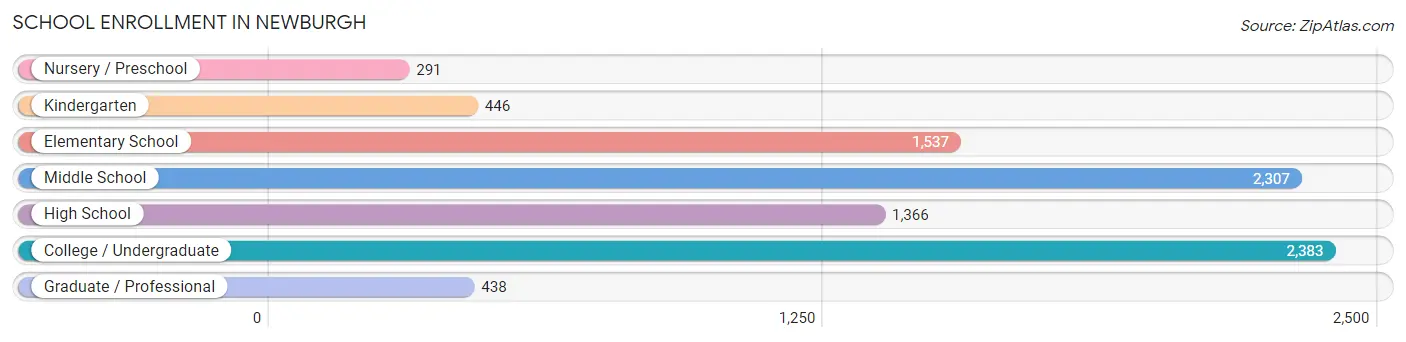
| School Level | # Students | % Students |
| Nursery / Preschool | 291 | 3.3% |
| Kindergarten | 446 | 5.1% |
| Elementary School | 1,537 | 17.5% |
| Middle School | 2,307 | 26.3% |
| High School | 1,366 | 15.6% |
| College / Undergraduate | 2,383 | 27.2% |
| Graduate / Professional | 438 | 5.0% |
| Total | 8,768 | 100.0% |
School Enrollment by Age by Funding Source in Newburgh
Out of a total of 8,768 students who are enrolled in schools in Newburgh, 1,815 (20.7%) attend a private institution, while the remaining 6,953 (79.3%) are enrolled in public schools. The age group of 20 to 24 year olds has the highest likelihood of being enrolled in private schools, with 829 (61.0% in the age bracket) enrolled. Conversely, the age group of 5 to 9 year old has the lowest likelihood of being enrolled in a private school, with 1,835 (99.4% in the age bracket) attending a public institution.
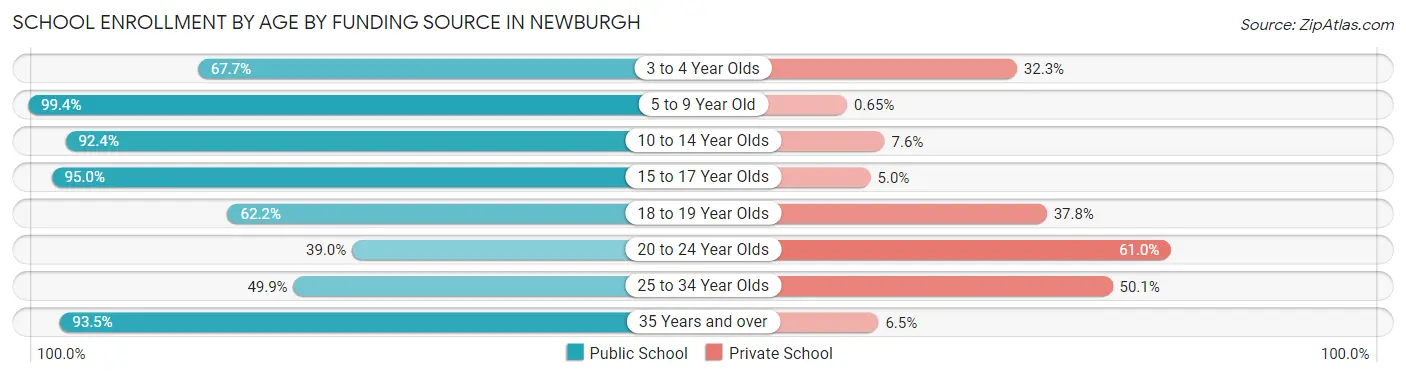
| Age Bracket | Public School | Private School |
| 3 to 4 Year Olds | 170 (67.7%) | 81 (32.3%) |
| 5 to 9 Year Old | 1,835 (99.4%) | 12 (0.6%) |
| 10 to 14 Year Olds | 2,291 (92.4%) | 189 (7.6%) |
| 15 to 17 Year Olds | 892 (95.0%) | 47 (5.0%) |
| 18 to 19 Year Olds | 518 (62.2%) | 315 (37.8%) |
| 20 to 24 Year Olds | 530 (39.0%) | 829 (61.0%) |
| 25 to 34 Year Olds | 313 (49.9%) | 314 (50.1%) |
| 35 Years and over | 404 (93.5%) | 28 (6.5%) |
| Total | 6,953 (79.3%) | 1,815 (20.7%) |
Educational Attainment by Field of Study in Newburgh
Business (636 | 16.9%), education (471 | 12.6%), visual & performing arts (412 | 11.0%), psychology (298 | 7.9%), and social sciences (293 | 7.8%) are the most common fields of study among 3,754 individuals in Newburgh who have obtained a bachelor's degree or higher.
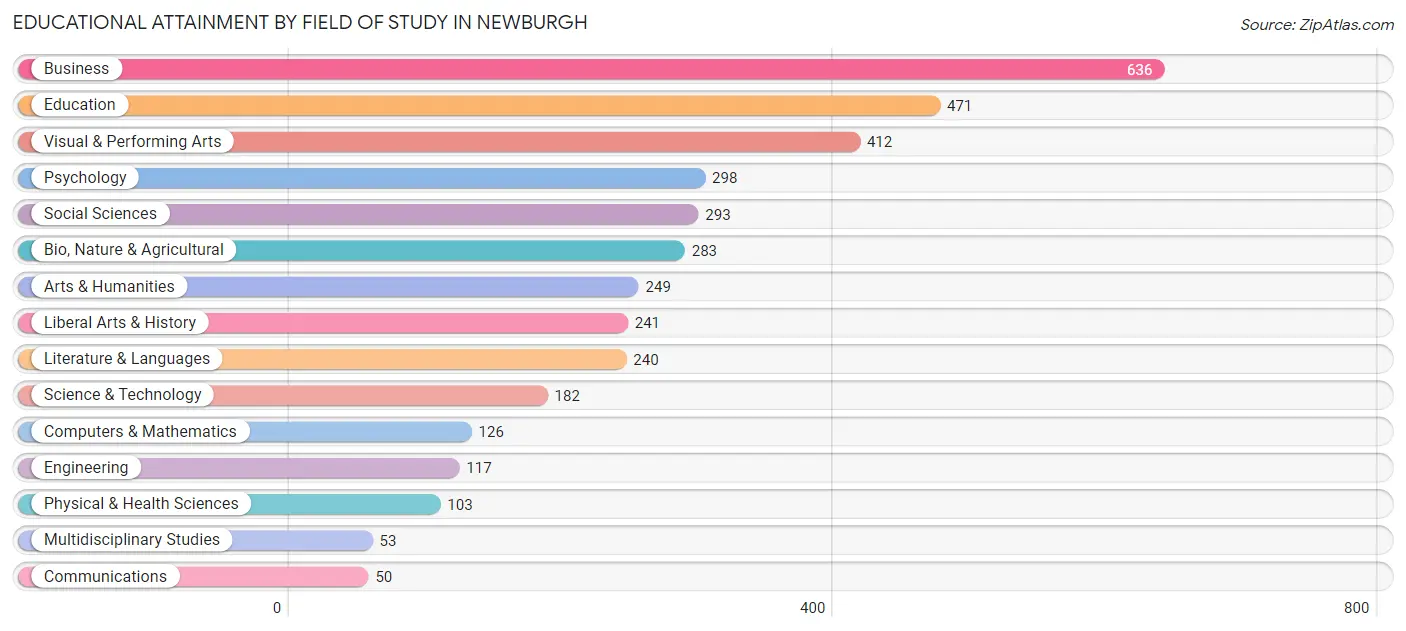
| Field of Study | # Graduates | % Graduates |
| Computers & Mathematics | 126 | 3.4% |
| Bio, Nature & Agricultural | 283 | 7.5% |
| Physical & Health Sciences | 103 | 2.7% |
| Psychology | 298 | 7.9% |
| Social Sciences | 293 | 7.8% |
| Engineering | 117 | 3.1% |
| Multidisciplinary Studies | 53 | 1.4% |
| Science & Technology | 182 | 4.9% |
| Business | 636 | 16.9% |
| Education | 471 | 12.6% |
| Literature & Languages | 240 | 6.4% |
| Liberal Arts & History | 241 | 6.4% |
| Visual & Performing Arts | 412 | 11.0% |
| Communications | 50 | 1.3% |
| Arts & Humanities | 249 | 6.6% |
| Total | 3,754 | 100.0% |
Transportation & Commute in Newburgh
Vehicle Availability by Sex in Newburgh
The most prevalent vehicle ownership categories in Newburgh are males with 1 vehicle (1,926, accounting for 33.1%) and females with 1 vehicle (2,441, making up 31.5%).
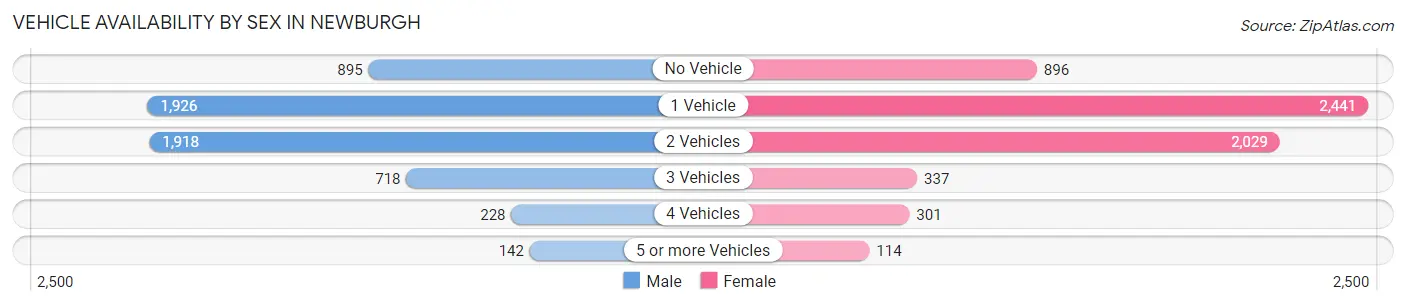
| Vehicles Available | Male | Female |
| No Vehicle | 895 (15.4%) | 896 (14.6%) |
| 1 Vehicle | 1,926 (33.1%) | 2,441 (39.9%) |
| 2 Vehicles | 1,918 (32.9%) | 2,029 (33.2%) |
| 3 Vehicles | 718 (12.3%) | 337 (5.5%) |
| 4 Vehicles | 228 (3.9%) | 301 (4.9%) |
| 5 or more Vehicles | 142 (2.4%) | 114 (1.9%) |
| Total | 5,827 (100.0%) | 6,118 (100.0%) |
Commute Time in Newburgh
The most frequently occuring commute durations in Newburgh are 15 to 19 minutes (2,075 commuters, 17.9%), 5 to 9 minutes (1,883 commuters, 16.3%), and 20 to 24 minutes (1,796 commuters, 15.5%).
| Commute Time | # Commuters | % Commuters |
| Less than 5 Minutes | 94 | 0.8% |
| 5 to 9 Minutes | 1,883 | 16.3% |
| 10 to 14 Minutes | 1,359 | 11.7% |
| 15 to 19 Minutes | 2,075 | 17.9% |
| 20 to 24 Minutes | 1,796 | 15.5% |
| 25 to 29 Minutes | 675 | 5.8% |
| 30 to 34 Minutes | 1,467 | 12.7% |
| 35 to 39 Minutes | 153 | 1.3% |
| 40 to 44 Minutes | 387 | 3.3% |
| 45 to 59 Minutes | 791 | 6.8% |
| 60 to 89 Minutes | 499 | 4.3% |
| 90 or more Minutes | 394 | 3.4% |
Commute Time by Sex in Newburgh
The most common commute times in Newburgh are 20 to 24 minutes (1,095 commuters, 19.5%) for males and 15 to 19 minutes (1,146 commuters, 19.2%) for females.
| Commute Time | Male | Female |
| Less than 5 Minutes | 10 (0.2%) | 84 (1.4%) |
| 5 to 9 Minutes | 937 (16.7%) | 946 (15.9%) |
| 10 to 14 Minutes | 422 (7.5%) | 937 (15.7%) |
| 15 to 19 Minutes | 929 (16.6%) | 1,146 (19.2%) |
| 20 to 24 Minutes | 1,095 (19.5%) | 701 (11.8%) |
| 25 to 29 Minutes | 262 (4.7%) | 413 (6.9%) |
| 30 to 34 Minutes | 821 (14.6%) | 646 (10.8%) |
| 35 to 39 Minutes | 105 (1.9%) | 48 (0.8%) |
| 40 to 44 Minutes | 272 (4.9%) | 115 (1.9%) |
| 45 to 59 Minutes | 257 (4.6%) | 534 (9.0%) |
| 60 to 89 Minutes | 252 (4.5%) | 247 (4.1%) |
| 90 or more Minutes | 251 (4.5%) | 143 (2.4%) |
Time of Departure to Work by Sex in Newburgh
The most frequent times of departure to work in Newburgh are 6:30 AM to 6:59 AM (654, 11.7%) for males and 8:00 AM to 8:29 AM (978, 16.4%) for females.
| Time of Departure | Male | Female |
| 12:00 AM to 4:59 AM | 143 (2.5%) | 258 (4.3%) |
| 5:00 AM to 5:29 AM | 372 (6.6%) | 246 (4.1%) |
| 5:30 AM to 5:59 AM | 236 (4.2%) | 197 (3.3%) |
| 6:00 AM to 6:29 AM | 374 (6.7%) | 492 (8.3%) |
| 6:30 AM to 6:59 AM | 654 (11.7%) | 175 (2.9%) |
| 7:00 AM to 7:29 AM | 641 (11.4%) | 872 (14.6%) |
| 7:30 AM to 7:59 AM | 498 (8.9%) | 551 (9.2%) |
| 8:00 AM to 8:29 AM | 652 (11.6%) | 978 (16.4%) |
| 8:30 AM to 8:59 AM | 201 (3.6%) | 511 (8.6%) |
| 9:00 AM to 9:59 AM | 430 (7.7%) | 414 (7.0%) |
| 10:00 AM to 10:59 AM | 393 (7.0%) | 353 (5.9%) |
| 11:00 AM to 11:59 AM | 149 (2.6%) | 90 (1.5%) |
| 12:00 PM to 3:59 PM | 335 (6.0%) | 449 (7.5%) |
| 4:00 PM to 11:59 PM | 535 (9.5%) | 374 (6.3%) |
| Total | 5,613 (100.0%) | 5,960 (100.0%) |
Housing Occupancy in Newburgh
Occupancy by Ownership in Newburgh
Of the total 10,505 dwellings in Newburgh, owner-occupied units account for 3,530 (33.6%), while renter-occupied units make up 6,975 (66.4%).
| Occupancy | # Housing Units | % Housing Units |
| Owner Occupied Housing Units | 3,530 | 33.6% |
| Renter-Occupied Housing Units | 6,975 | 66.4% |
| Total Occupied Housing Units | 10,505 | 100.0% |
Occupancy by Household Size in Newburgh
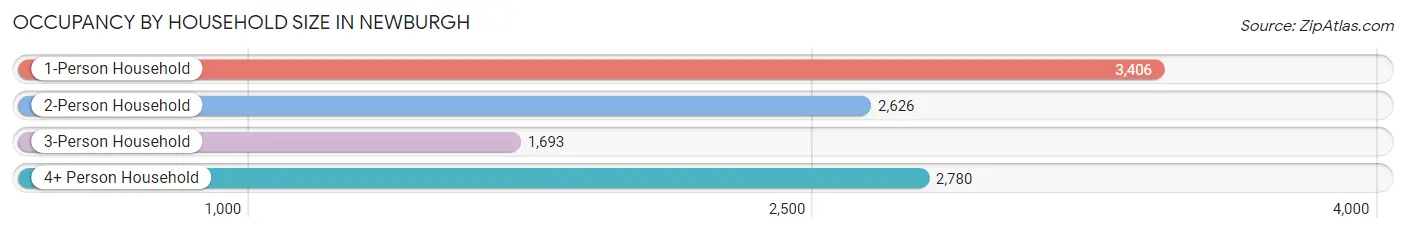
| Household Size | # Housing Units | % Housing Units |
| 1-Person Household | 3,406 | 32.4% |
| 2-Person Household | 2,626 | 25.0% |
| 3-Person Household | 1,693 | 16.1% |
| 4+ Person Household | 2,780 | 26.5% |
| Total Housing Units | 10,505 | 100.0% |
Occupancy by Ownership by Household Size in Newburgh
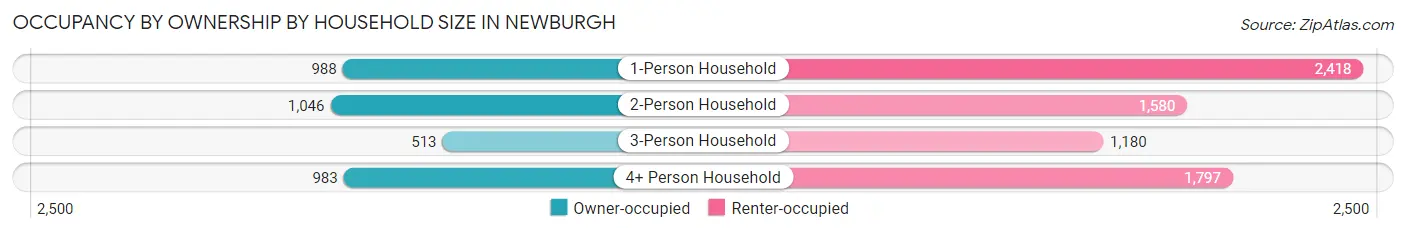
| Household Size | Owner-occupied | Renter-occupied |
| 1-Person Household | 988 (29.0%) | 2,418 (71.0%) |
| 2-Person Household | 1,046 (39.8%) | 1,580 (60.2%) |
| 3-Person Household | 513 (30.3%) | 1,180 (69.7%) |
| 4+ Person Household | 983 (35.4%) | 1,797 (64.6%) |
| Total Housing Units | 3,530 (33.6%) | 6,975 (66.4%) |
Occupancy by Educational Attainment in Newburgh
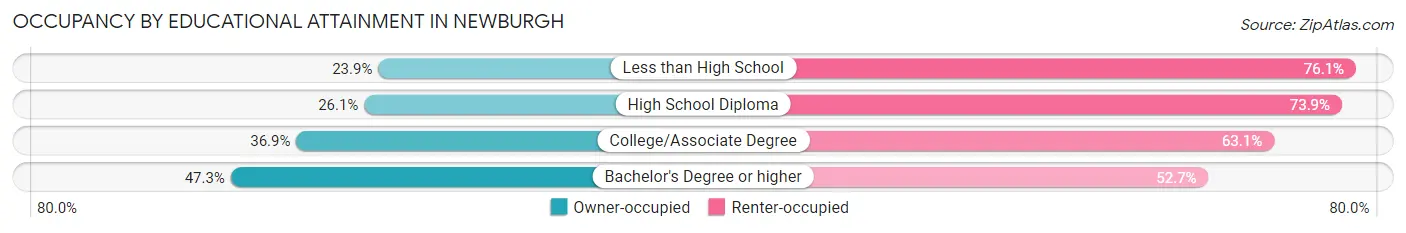
| Household Size | Owner-occupied | Renter-occupied |
| Less than High School | 378 (23.9%) | 1,203 (76.1%) |
| High School Diploma | 903 (26.1%) | 2,551 (73.9%) |
| College/Associate Degree | 1,202 (36.9%) | 2,055 (63.1%) |
| Bachelor's Degree or higher | 1,047 (47.3%) | 1,166 (52.7%) |
Occupancy by Age of Householder in Newburgh
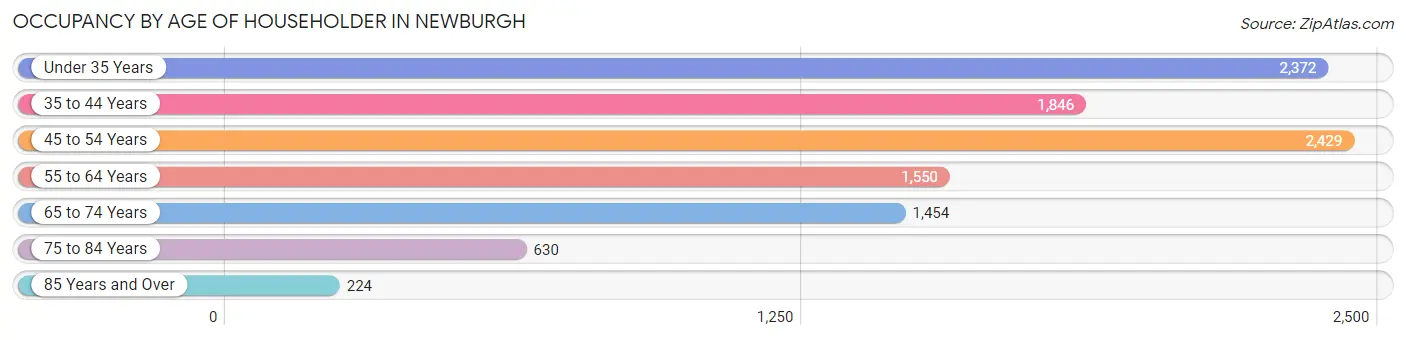
| Age Bracket | # Households | % Households |
| Under 35 Years | 2,372 | 22.6% |
| 35 to 44 Years | 1,846 | 17.6% |
| 45 to 54 Years | 2,429 | 23.1% |
| 55 to 64 Years | 1,550 | 14.7% |
| 65 to 74 Years | 1,454 | 13.8% |
| 75 to 84 Years | 630 | 6.0% |
| 85 Years and Over | 224 | 2.1% |
| Total | 10,505 | 100.0% |
Housing Finances in Newburgh
Median Income by Occupancy in Newburgh
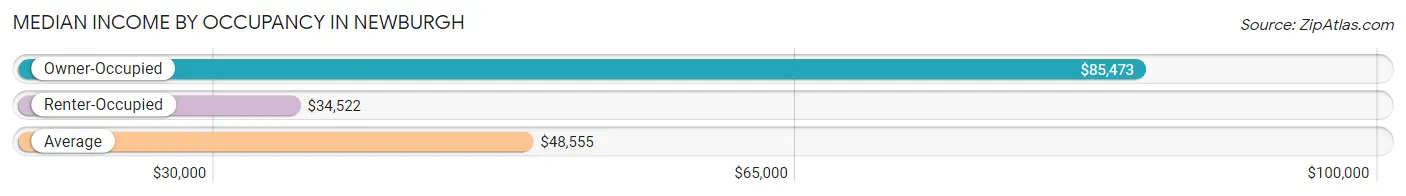
| Occupancy Type | # Households | Median Income |
| Owner-Occupied | 3,530 (33.6%) | $85,473 |
| Renter-Occupied | 6,975 (66.4%) | $34,522 |
| Average | 10,505 (100.0%) | $48,555 |
Occupancy by Householder Income Bracket in Newburgh
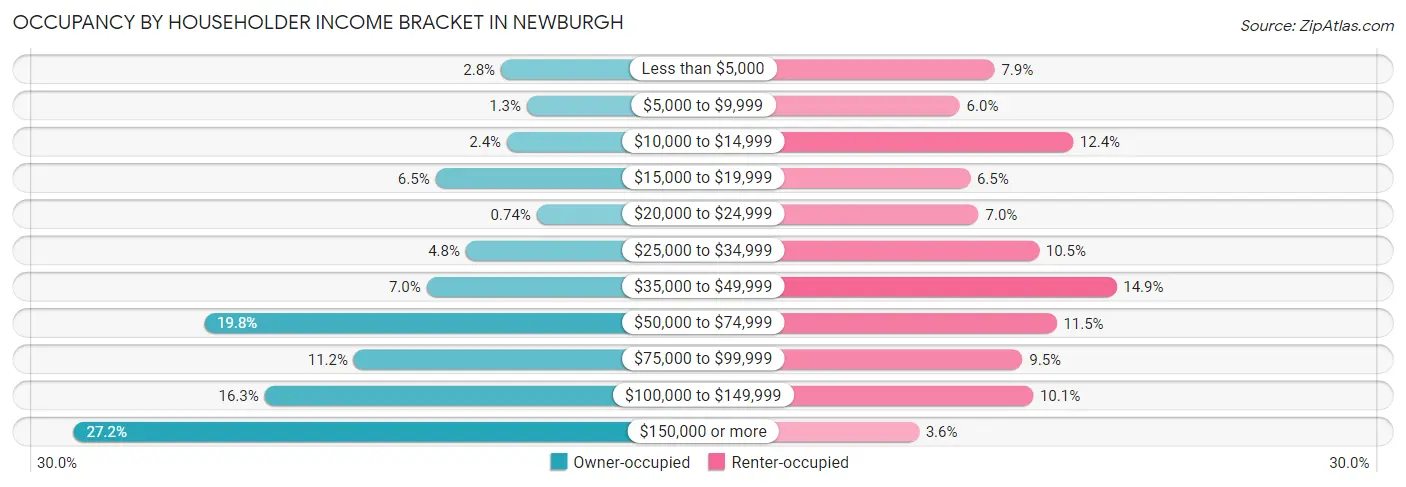
| Income Bracket | Owner-occupied | Renter-occupied |
| Less than $5,000 | 98 (2.8%) | 554 (7.9%) |
| $5,000 to $9,999 | 46 (1.3%) | 415 (5.9%) |
| $10,000 to $14,999 | 86 (2.4%) | 866 (12.4%) |
| $15,000 to $19,999 | 230 (6.5%) | 456 (6.5%) |
| $20,000 to $24,999 | 26 (0.7%) | 490 (7.0%) |
| $25,000 to $34,999 | 169 (4.8%) | 730 (10.5%) |
| $35,000 to $49,999 | 248 (7.0%) | 1,039 (14.9%) |
| $50,000 to $74,999 | 697 (19.8%) | 801 (11.5%) |
| $75,000 to $99,999 | 395 (11.2%) | 665 (9.5%) |
| $100,000 to $149,999 | 575 (16.3%) | 707 (10.1%) |
| $150,000 or more | 960 (27.2%) | 252 (3.6%) |
| Total | 3,530 (100.0%) | 6,975 (100.0%) |
Monthly Housing Cost Tiers in Newburgh
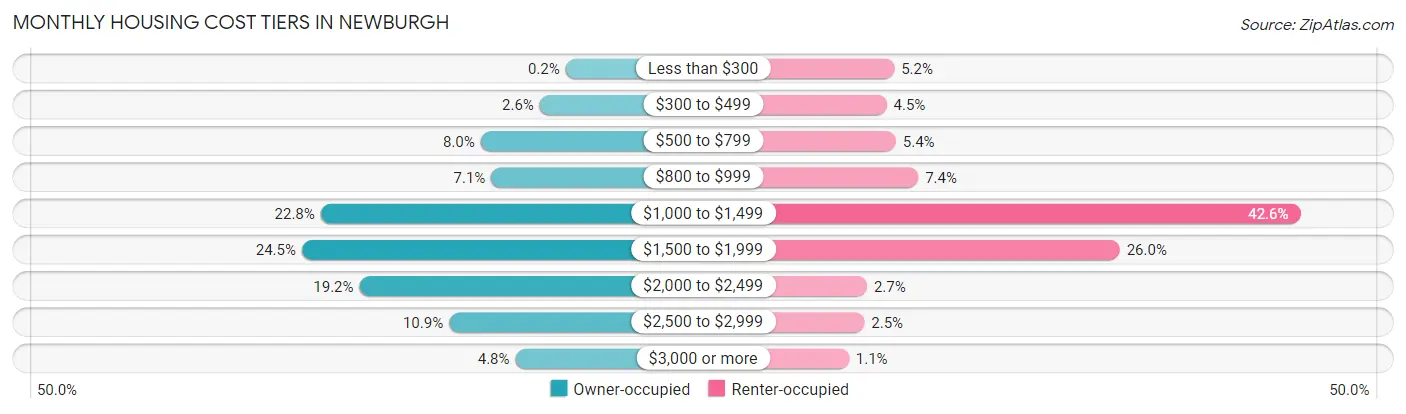
| Monthly Cost | Owner-occupied | Renter-occupied |
| Less than $300 | 7 (0.2%) | 365 (5.2%) |
| $300 to $499 | 91 (2.6%) | 316 (4.5%) |
| $500 to $799 | 283 (8.0%) | 375 (5.4%) |
| $800 to $999 | 249 (7.0%) | 519 (7.4%) |
| $1,000 to $1,499 | 803 (22.8%) | 2,972 (42.6%) |
| $1,500 to $1,999 | 864 (24.5%) | 1,813 (26.0%) |
| $2,000 to $2,499 | 677 (19.2%) | 190 (2.7%) |
| $2,500 to $2,999 | 386 (10.9%) | 173 (2.5%) |
| $3,000 or more | 170 (4.8%) | 73 (1.1%) |
| Total | 3,530 (100.0%) | 6,975 (100.0%) |
Physical Housing Characteristics in Newburgh
Housing Structures in Newburgh
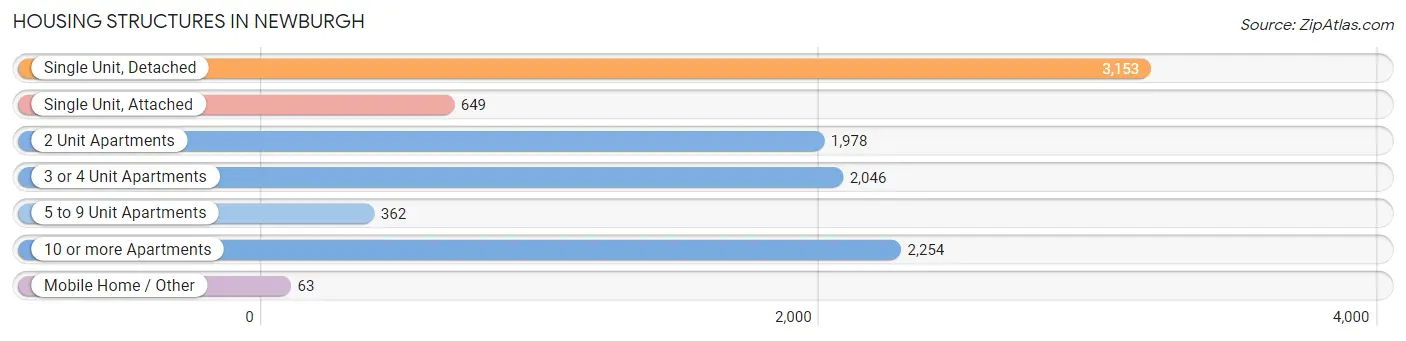
| Structure Type | # Housing Units | % Housing Units |
| Single Unit, Detached | 3,153 | 30.0% |
| Single Unit, Attached | 649 | 6.2% |
| 2 Unit Apartments | 1,978 | 18.8% |
| 3 or 4 Unit Apartments | 2,046 | 19.5% |
| 5 to 9 Unit Apartments | 362 | 3.5% |
| 10 or more Apartments | 2,254 | 21.5% |
| Mobile Home / Other | 63 | 0.6% |
| Total | 10,505 | 100.0% |
Housing Structures by Occupancy in Newburgh
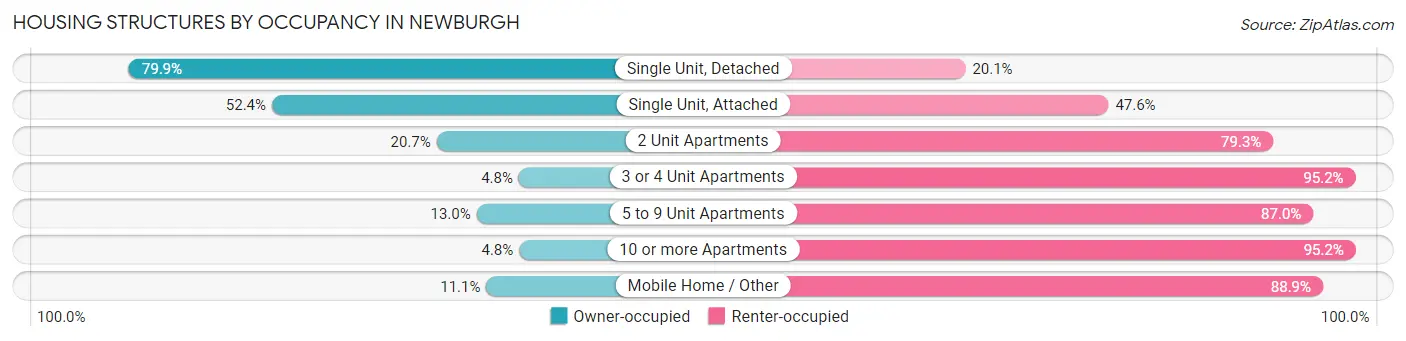
| Structure Type | Owner-occupied | Renter-occupied |
| Single Unit, Detached | 2,520 (79.9%) | 633 (20.1%) |
| Single Unit, Attached | 340 (52.4%) | 309 (47.6%) |
| 2 Unit Apartments | 409 (20.7%) | 1,569 (79.3%) |
| 3 or 4 Unit Apartments | 99 (4.8%) | 1,947 (95.2%) |
| 5 to 9 Unit Apartments | 47 (13.0%) | 315 (87.0%) |
| 10 or more Apartments | 108 (4.8%) | 2,146 (95.2%) |
| Mobile Home / Other | 7 (11.1%) | 56 (88.9%) |
| Total | 3,530 (33.6%) | 6,975 (66.4%) |
Housing Structures by Number of Rooms in Newburgh
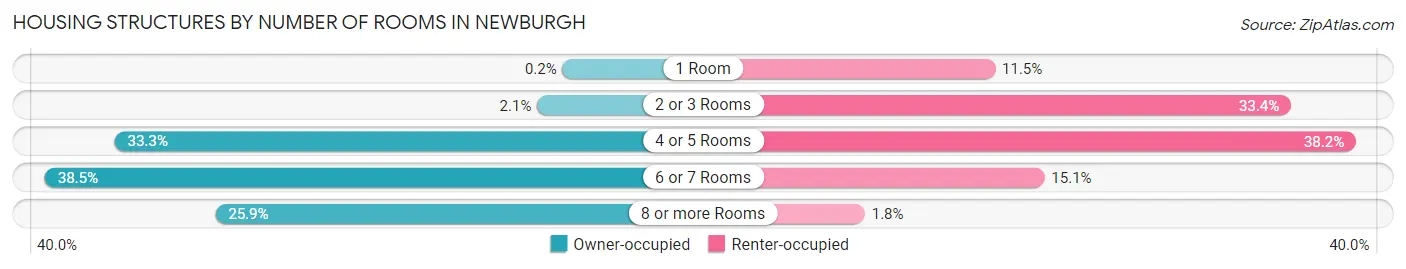
| Number of Rooms | Owner-occupied | Renter-occupied |
| 1 Room | 7 (0.2%) | 801 (11.5%) |
| 2 or 3 Rooms | 73 (2.1%) | 2,328 (33.4%) |
| 4 or 5 Rooms | 1,177 (33.3%) | 2,663 (38.2%) |
| 6 or 7 Rooms | 1,359 (38.5%) | 1,055 (15.1%) |
| 8 or more Rooms | 914 (25.9%) | 128 (1.8%) |
| Total | 3,530 (100.0%) | 6,975 (100.0%) |
Housing Structure by Heating Type in Newburgh
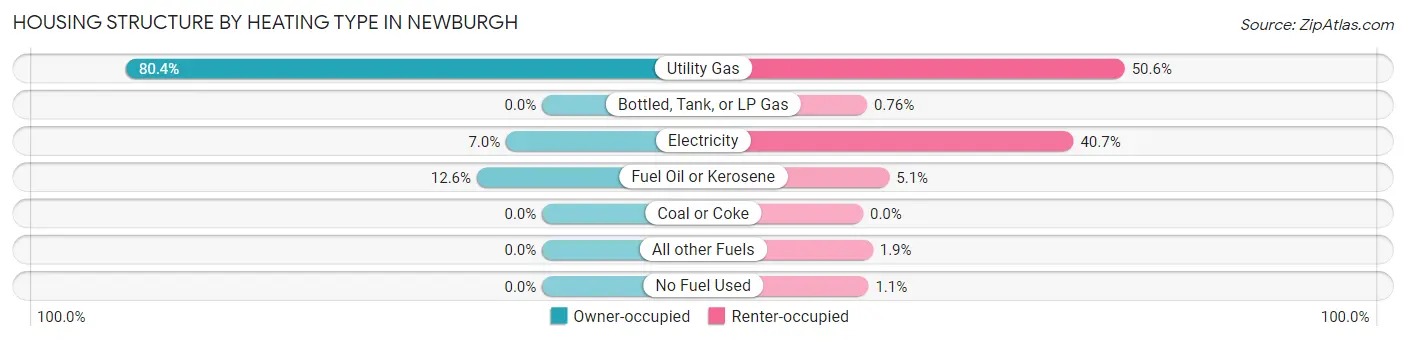
| Heating Type | Owner-occupied | Renter-occupied |
| Utility Gas | 2,839 (80.4%) | 3,527 (50.6%) |
| Bottled, Tank, or LP Gas | 0 (0.0%) | 53 (0.8%) |
| Electricity | 246 (7.0%) | 2,837 (40.7%) |
| Fuel Oil or Kerosene | 445 (12.6%) | 354 (5.1%) |
| Coal or Coke | 0 (0.0%) | 0 (0.0%) |
| All other Fuels | 0 (0.0%) | 131 (1.9%) |
| No Fuel Used | 0 (0.0%) | 73 (1.1%) |
| Total | 3,530 (100.0%) | 6,975 (100.0%) |
Household Vehicle Usage in Newburgh
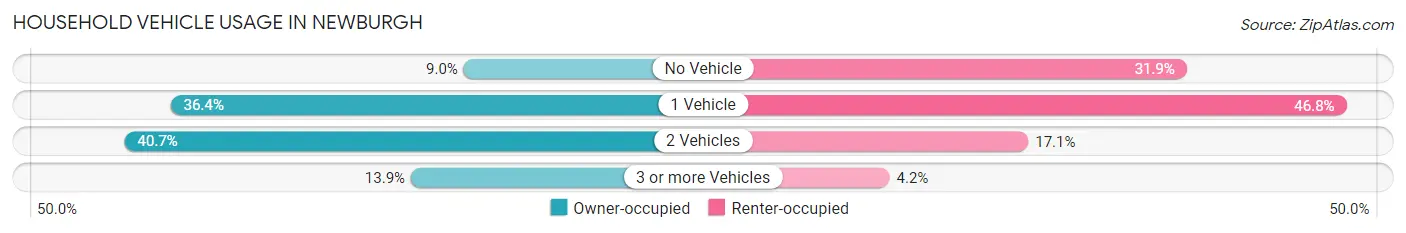
| Vehicles per Household | Owner-occupied | Renter-occupied |
| No Vehicle | 318 (9.0%) | 2,225 (31.9%) |
| 1 Vehicle | 1,284 (36.4%) | 3,265 (46.8%) |
| 2 Vehicles | 1,436 (40.7%) | 1,194 (17.1%) |
| 3 or more Vehicles | 492 (13.9%) | 291 (4.2%) |
| Total | 3,530 (100.0%) | 6,975 (100.0%) |
Real Estate & Mortgages in Newburgh
Real Estate and Mortgage Overview in Newburgh
| Characteristic | Without Mortgage | With Mortgage |
| Housing Units | 1,145 | 2,385 |
| Median Property Value | $188,500 | $191,400 |
| Median Household Income | $70,063 | $644 |
| Monthly Housing Costs | $1,001 | $170 |
| Real Estate Taxes | $5,077 | $28 |
Property Value by Mortgage Status in Newburgh
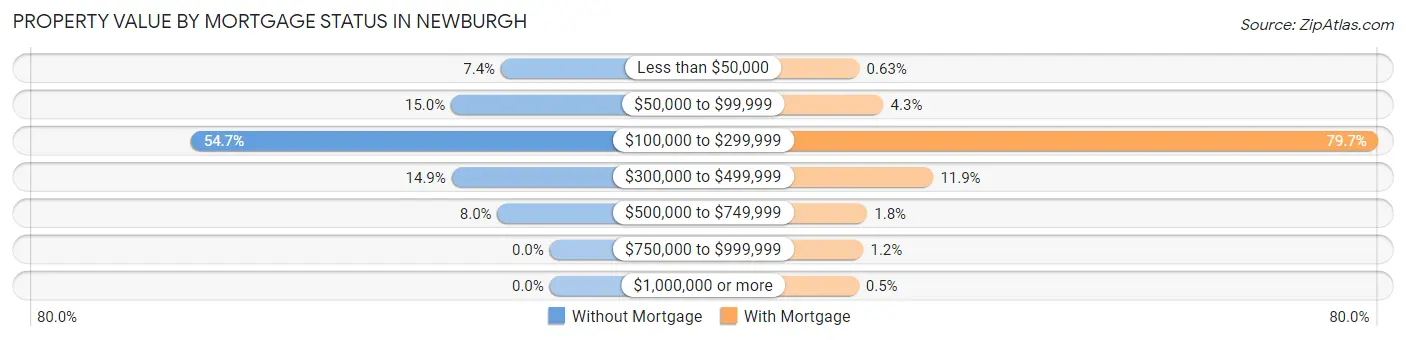
| Property Value | Without Mortgage | With Mortgage |
| Less than $50,000 | 85 (7.4%) | 15 (0.6%) |
| $50,000 to $99,999 | 172 (15.0%) | 102 (4.3%) |
| $100,000 to $299,999 | 626 (54.7%) | 1,901 (79.7%) |
| $300,000 to $499,999 | 171 (14.9%) | 283 (11.9%) |
| $500,000 to $749,999 | 91 (8.0%) | 43 (1.8%) |
| $750,000 to $999,999 | 0 (0.0%) | 29 (1.2%) |
| $1,000,000 or more | 0 (0.0%) | 12 (0.5%) |
| Total | 1,145 (100.0%) | 2,385 (100.0%) |
Household Income by Mortgage Status in Newburgh
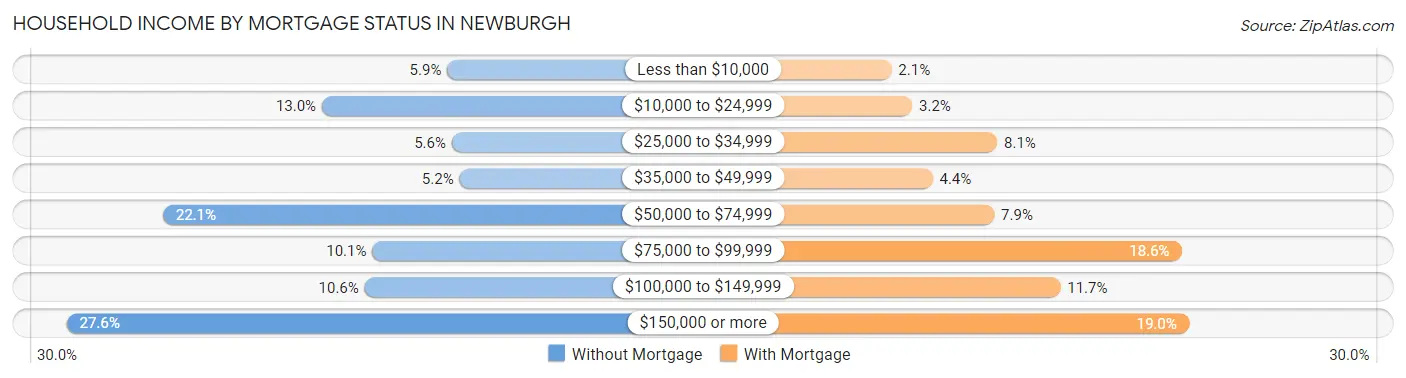
| Household Income | Without Mortgage | With Mortgage |
| Less than $10,000 | 67 (5.9%) | 49 (2.1%) |
| $10,000 to $24,999 | 149 (13.0%) | 77 (3.2%) |
| $25,000 to $34,999 | 64 (5.6%) | 193 (8.1%) |
| $35,000 to $49,999 | 59 (5.1%) | 105 (4.4%) |
| $50,000 to $74,999 | 253 (22.1%) | 189 (7.9%) |
| $75,000 to $99,999 | 116 (10.1%) | 444 (18.6%) |
| $100,000 to $149,999 | 121 (10.6%) | 279 (11.7%) |
| $150,000 or more | 316 (27.6%) | 454 (19.0%) |
| Total | 1,145 (100.0%) | 2,385 (100.0%) |
Property Value to Household Income Ratio in Newburgh
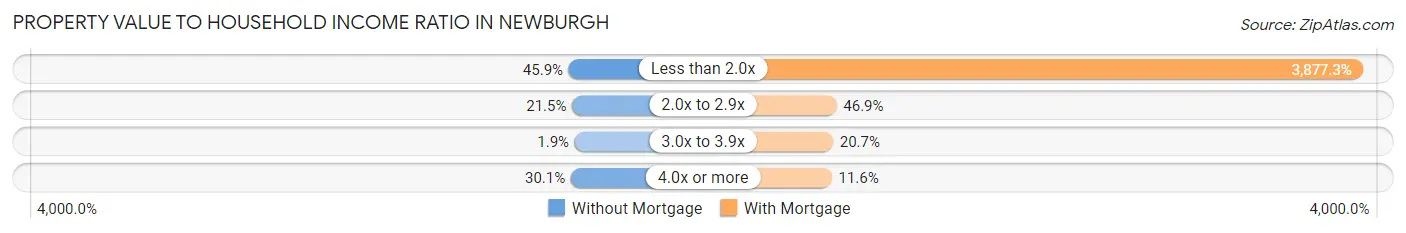
| Value-to-Income Ratio | Without Mortgage | With Mortgage |
| Less than 2.0x | 525 (45.9%) | 92,473 (3,877.3%) |
| 2.0x to 2.9x | 246 (21.5%) | 1,119 (46.9%) |
| 3.0x to 3.9x | 22 (1.9%) | 494 (20.7%) |
| 4.0x or more | 345 (30.1%) | 277 (11.6%) |
| Total | 1,145 (100.0%) | 2,385 (100.0%) |
Real Estate Taxes by Mortgage Status in Newburgh
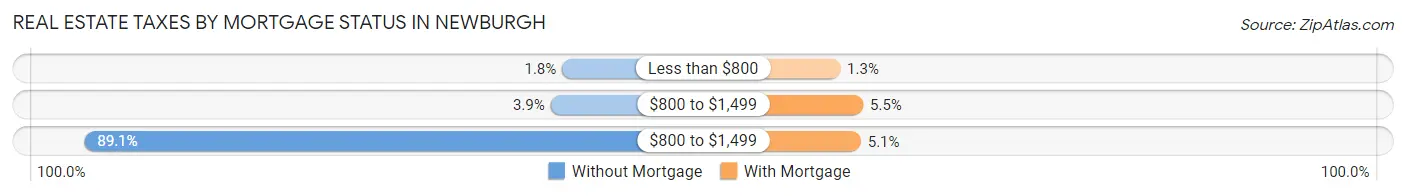
| Property Taxes | Without Mortgage | With Mortgage |
| Less than $800 | 21 (1.8%) | 31 (1.3%) |
| $800 to $1,499 | 45 (3.9%) | 131 (5.5%) |
| $800 to $1,499 | 1,020 (89.1%) | 121 (5.1%) |
| Total | 1,145 (100.0%) | 2,385 (100.0%) |
Health & Disability in Newburgh
Health Insurance Coverage by Age in Newburgh
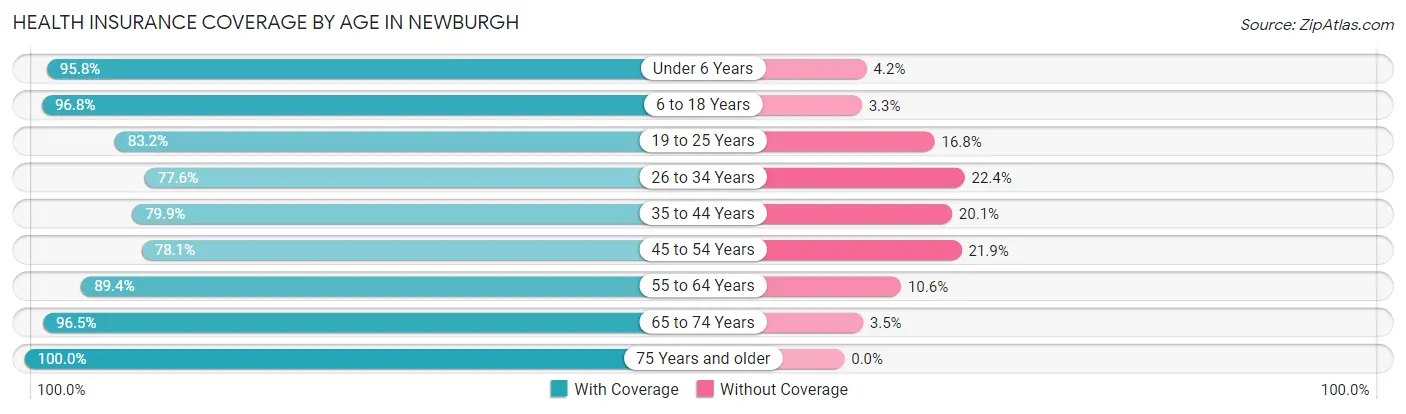
| Age Bracket | With Coverage | Without Coverage |
| Under 6 Years | 1,884 (95.8%) | 82 (4.2%) |
| 6 to 18 Years | 5,351 (96.8%) | 180 (3.3%) |
| 19 to 25 Years | 2,782 (83.2%) | 563 (16.8%) |
| 26 to 34 Years | 3,339 (77.6%) | 965 (22.4%) |
| 35 to 44 Years | 2,680 (79.9%) | 673 (20.1%) |
| 45 to 54 Years | 3,174 (78.1%) | 888 (21.9%) |
| 55 to 64 Years | 2,326 (89.4%) | 275 (10.6%) |
| 65 to 74 Years | 2,151 (96.5%) | 77 (3.5%) |
| 75 Years and older | 1,327 (100.0%) | 0 (0.0%) |
| Total | 25,014 (87.1%) | 3,703 (12.9%) |
Health Insurance Coverage by Citizenship Status in Newburgh
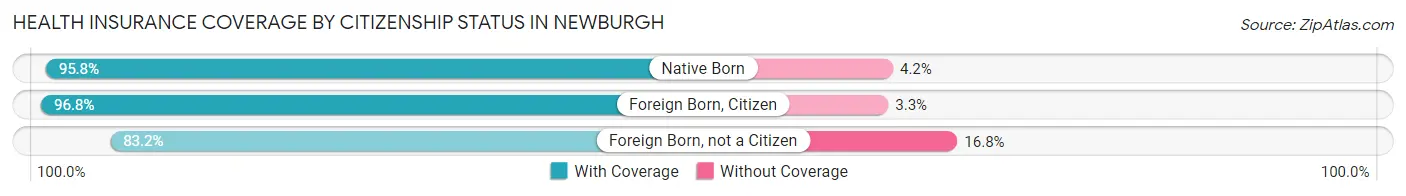
| Citizenship Status | With Coverage | Without Coverage |
| Native Born | 1,884 (95.8%) | 82 (4.2%) |
| Foreign Born, Citizen | 5,351 (96.8%) | 180 (3.3%) |
| Foreign Born, not a Citizen | 2,782 (83.2%) | 563 (16.8%) |
Health Insurance Coverage by Household Income in Newburgh
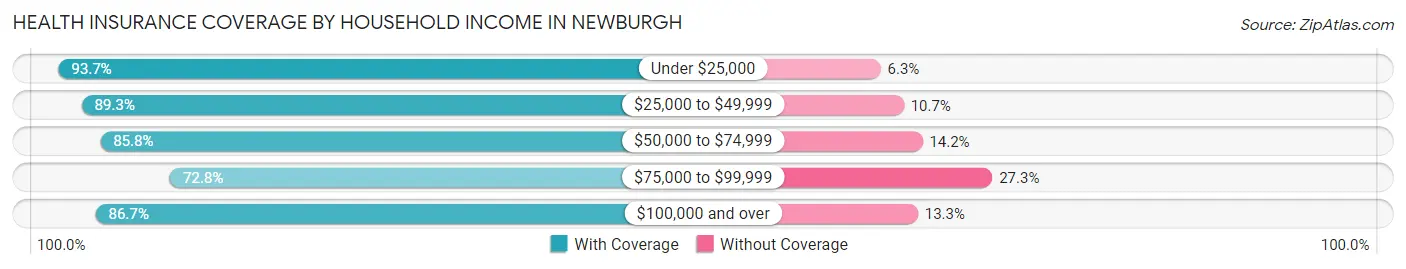
| Household Income | With Coverage | Without Coverage |
| Under $25,000 | 5,766 (93.7%) | 390 (6.3%) |
| $25,000 to $49,999 | 4,423 (89.3%) | 528 (10.7%) |
| $50,000 to $74,999 | 4,076 (85.8%) | 673 (14.2%) |
| $75,000 to $99,999 | 2,469 (72.8%) | 925 (27.3%) |
| $100,000 and over | 7,449 (86.7%) | 1,143 (13.3%) |
Public vs Private Health Insurance Coverage by Age in Newburgh
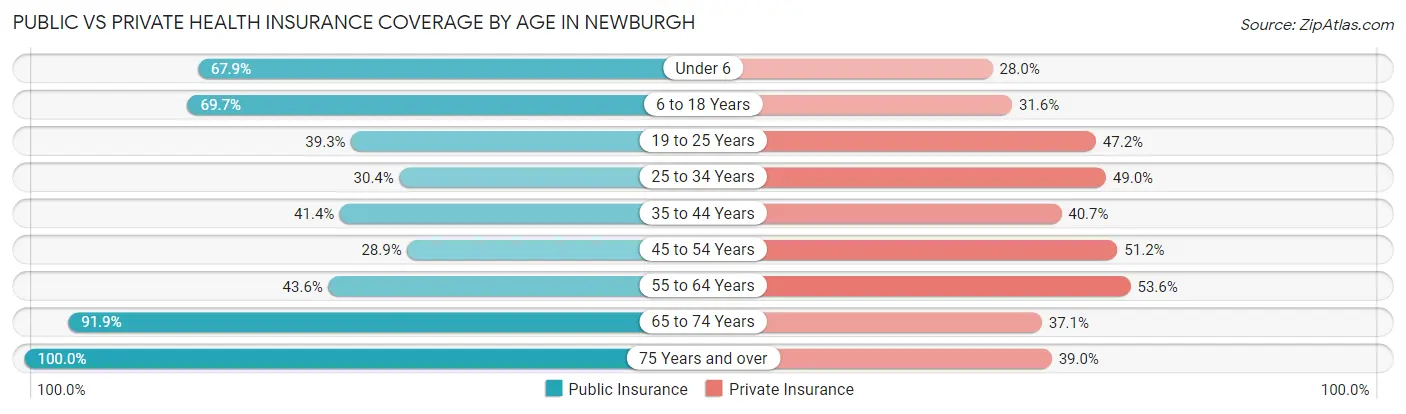
| Age Bracket | Public Insurance | Private Insurance |
| Under 6 | 1,334 (67.8%) | 550 (28.0%) |
| 6 to 18 Years | 3,857 (69.7%) | 1,748 (31.6%) |
| 19 to 25 Years | 1,316 (39.3%) | 1,578 (47.2%) |
| 25 to 34 Years | 1,308 (30.4%) | 2,110 (49.0%) |
| 35 to 44 Years | 1,389 (41.4%) | 1,366 (40.7%) |
| 45 to 54 Years | 1,175 (28.9%) | 2,078 (51.2%) |
| 55 to 64 Years | 1,133 (43.6%) | 1,394 (53.6%) |
| 65 to 74 Years | 2,047 (91.9%) | 827 (37.1%) |
| 75 Years and over | 1,327 (100.0%) | 517 (39.0%) |
| Total | 14,886 (51.8%) | 12,168 (42.4%) |
Disability Status by Sex by Age in Newburgh
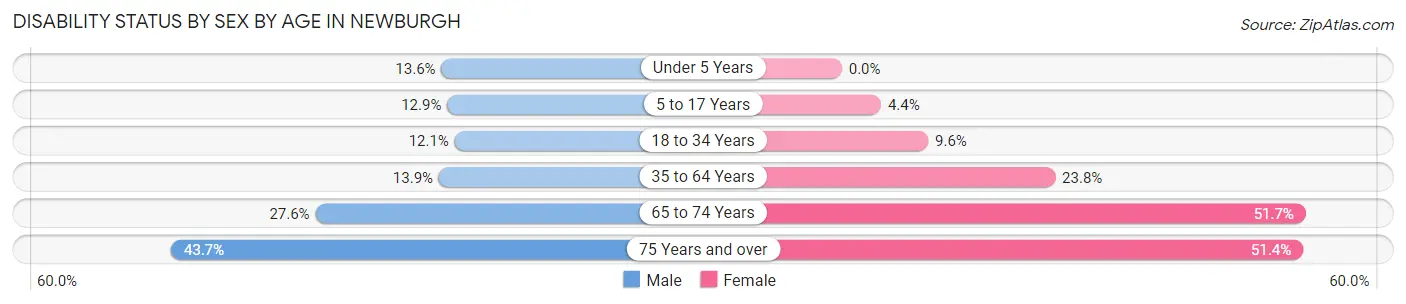
| Age Bracket | Male | Female |
| Under 5 Years | 113 (13.6%) | 0 (0.0%) |
| 5 to 17 Years | 394 (12.9%) | 104 (4.4%) |
| 18 to 34 Years | 445 (12.1%) | 425 (9.6%) |
| 35 to 64 Years | 654 (13.9%) | 1,259 (23.8%) |
| 65 to 74 Years | 225 (27.6%) | 730 (51.7%) |
| 75 Years and over | 198 (43.7%) | 449 (51.4%) |
Disability Class by Sex by Age in Newburgh
Disability Class: Hearing Difficulty
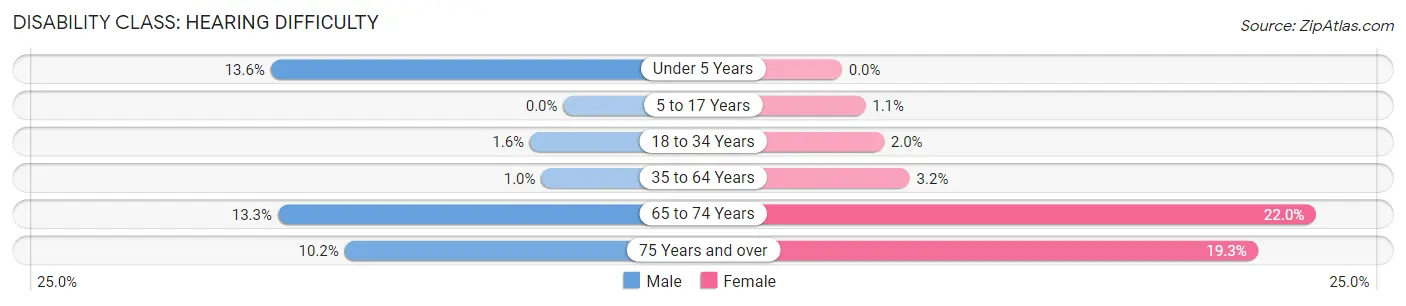
| Age Bracket | Male | Female |
| Under 5 Years | 113 (13.6%) | 0 (0.0%) |
| 5 to 17 Years | 0 (0.0%) | 26 (1.1%) |
| 18 to 34 Years | 57 (1.5%) | 86 (1.9%) |
| 35 to 64 Years | 48 (1.0%) | 167 (3.2%) |
| 65 to 74 Years | 108 (13.3%) | 311 (22.0%) |
| 75 Years and over | 46 (10.2%) | 169 (19.3%) |
Disability Class: Vision Difficulty
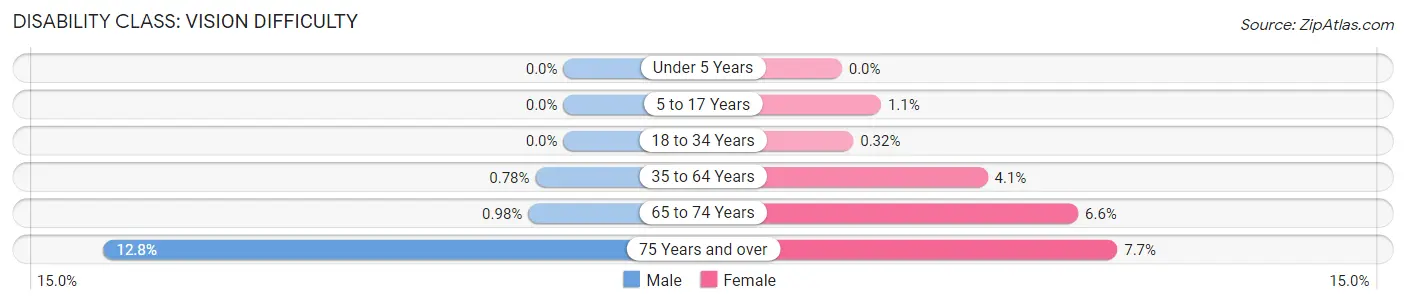
| Age Bracket | Male | Female |
| Under 5 Years | 0 (0.0%) | 0 (0.0%) |
| 5 to 17 Years | 0 (0.0%) | 26 (1.1%) |
| 18 to 34 Years | 0 (0.0%) | 14 (0.3%) |
| 35 to 64 Years | 37 (0.8%) | 215 (4.1%) |
| 65 to 74 Years | 8 (1.0%) | 93 (6.6%) |
| 75 Years and over | 58 (12.8%) | 67 (7.7%) |
Disability Class: Cognitive Difficulty
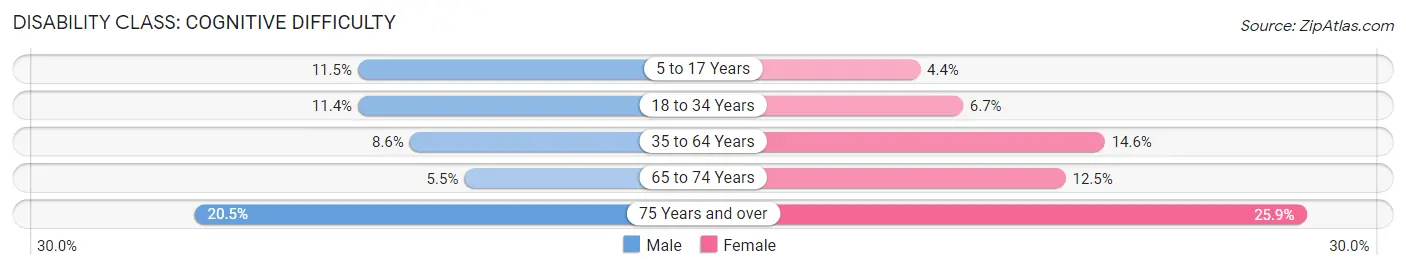
| Age Bracket | Male | Female |
| 5 to 17 Years | 349 (11.5%) | 104 (4.4%) |
| 18 to 34 Years | 421 (11.4%) | 298 (6.7%) |
| 35 to 64 Years | 404 (8.6%) | 776 (14.6%) |
| 65 to 74 Years | 45 (5.5%) | 176 (12.5%) |
| 75 Years and over | 93 (20.5%) | 226 (25.9%) |
Disability Class: Ambulatory Difficulty
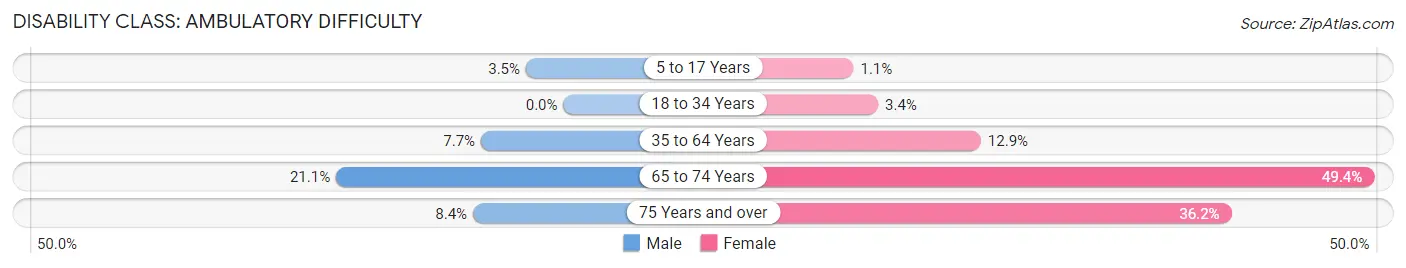
| Age Bracket | Male | Female |
| 5 to 17 Years | 106 (3.5%) | 26 (1.1%) |
| 18 to 34 Years | 0 (0.0%) | 149 (3.4%) |
| 35 to 64 Years | 361 (7.6%) | 684 (12.9%) |
| 65 to 74 Years | 172 (21.1%) | 698 (49.4%) |
| 75 Years and over | 38 (8.4%) | 316 (36.2%) |
Disability Class: Self-Care Difficulty
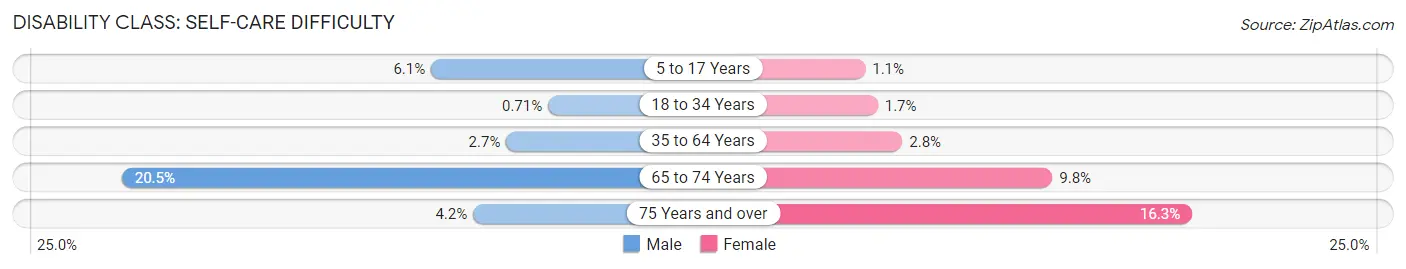
| Age Bracket | Male | Female |
| 5 to 17 Years | 187 (6.1%) | 26 (1.1%) |
| 18 to 34 Years | 26 (0.7%) | 74 (1.7%) |
| 35 to 64 Years | 125 (2.6%) | 149 (2.8%) |
| 65 to 74 Years | 167 (20.5%) | 138 (9.8%) |
| 75 Years and over | 19 (4.2%) | 142 (16.3%) |
Technology Access in Newburgh
Computing Device Access in Newburgh
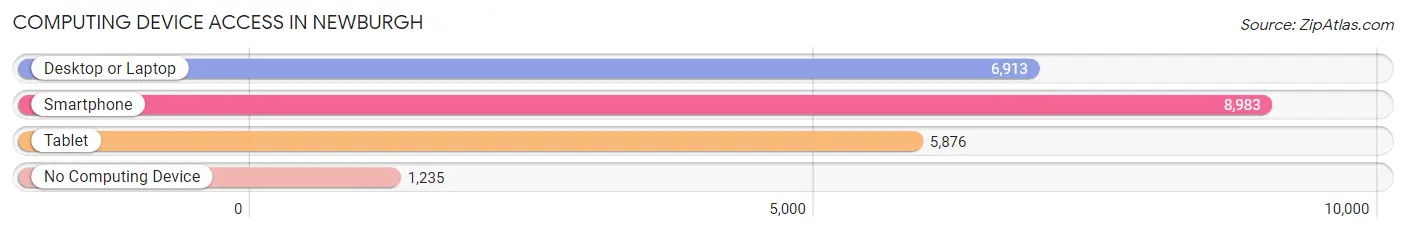
| Device Type | # Households | % Households |
| Desktop or Laptop | 6,913 | 65.8% |
| Smartphone | 8,983 | 85.5% |
| Tablet | 5,876 | 55.9% |
| No Computing Device | 1,235 | 11.8% |
| Total | 10,505 | 100.0% |
Internet Access in Newburgh
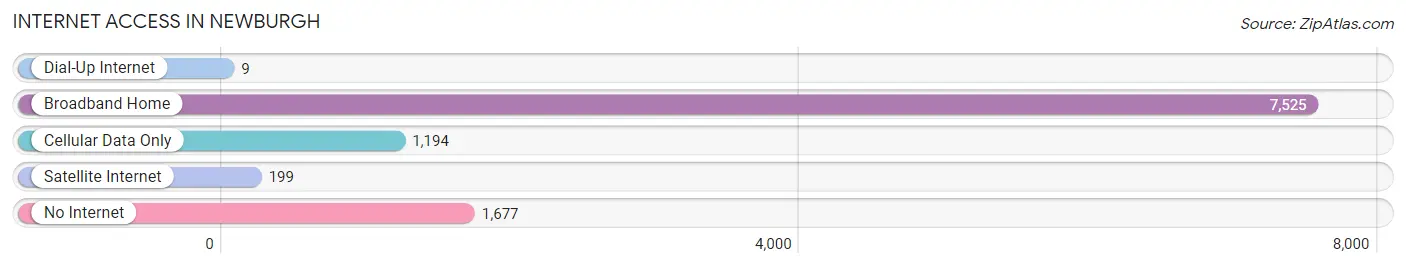
| Internet Type | # Households | % Households |
| Dial-Up Internet | 9 | 0.1% |
| Broadband Home | 7,525 | 71.6% |
| Cellular Data Only | 1,194 | 11.4% |
| Satellite Internet | 199 | 1.9% |
| No Internet | 1,677 | 16.0% |
| Total | 10,505 | 100.0% |
Newburgh Summary
Newburgh is a city located in Orange County, New York, United States. It is situated on the west bank of the Hudson River, approximately 60 miles north of New York City. The city has a population of approximately 28,000 people, making it the second largest city in Orange County.
Geography
Newburgh is located in the Hudson Valley region of New York, on the west bank of the Hudson River. The city is bordered by the towns of New Windsor to the north, Cornwall to the east, and Marlboro to the south. The city is situated at an elevation of approximately 200 feet above sea level. The terrain of the city is mostly flat, with some rolling hills in the northern and eastern parts of the city. The city is located in a temperate climate zone, with hot summers and cold winters.
History
Newburgh was first settled in 1709 by Dutch settlers, who named the settlement Newburgh after the city of Bremen in Germany. The settlement was incorporated as a village in 1788, and was later incorporated as a city in 1865. During the Revolutionary War, Newburgh served as the headquarters of the Continental Army. The city was a major industrial center during the 19th and early 20th centuries, with numerous factories and mills located along the Hudson River. The city was also a major transportation hub, with the Newburgh-Beacon Bridge connecting the city to Beacon, New York.
Economy
Newburgh’s economy is largely based on manufacturing and services. The city is home to several large manufacturing companies, including PepsiCo, IBM, and General Electric. The city is also home to several educational institutions, including Mount Saint Mary College and SUNY Orange. The city is also home to several medical facilities, including St. Luke’s Cornwall Hospital and Montefiore St. Luke’s Cornwall.
Demographics
As of the 2010 census, Newburgh had a population of 28,000 people. The racial makeup of the city was 57.3% White, 28.2% African American, 0.4% Native American, 2.2% Asian, 0.1% Pacific Islander, 8.2% from other races, and 3.8% from two or more races. Hispanic or Latino of any race were 18.3% of the population. The median household income in the city was $35,000, and the median family income was $41,000.
Newburgh is a diverse city, with a variety of cultures and backgrounds represented. The city is home to a large Hispanic population, as well as a large African American population. The city is also home to a large Jewish population, with several synagogues located in the city. The city is also home to a large Irish American population, with several Irish pubs and restaurants located in the city.
Common Questions
What is the Total Population of Newburgh?
Total Population of Newburgh is 28,751.
What is the Total Male Population of Newburgh?
Total Male Population of Newburgh is 13,568.
What is the Total Female Population of Newburgh?
Total Female Population of Newburgh is 15,183.
What is the Ratio of Males per 100 Females in Newburgh?
There are 89.36 Males per 100 Females in Newburgh.
What is the Ratio of Females per 100 Males in Newburgh?
There are 111.90 Females per 100 Males in Newburgh.
What is the Median Population Age in Newburgh?
Median Population Age in Newburgh is 32.2 Years.
What is the Average Family Size in Newburgh
Average Family Size in Newburgh is 3.5 People.
What is the Average Household Size in Newburgh
Average Household Size in Newburgh is 2.6 People.
What is Per Capita Income in Newburgh?
Per Capita income in Newburgh is $27,253.
What is the Median Family Income in Newburgh?
Median Family Income in Newburgh is $59,183.
What is the Median Household income in Newburgh?
Median Household Income in Newburgh is $48,555.
What is Income or Wage Gap in Newburgh?
Income or Wage Gap in Newburgh is 27.2%.
Women in Newburgh earn 72.8 cents for every dollar earned by a man.
What is Family Income Deficit in Newburgh?
Family Income Deficit in Newburgh is $13,058.
Families that are below poverty line in Newburgh earn $13,058 less on average than the poverty threshold level.
What is Inequality or Gini Index in Newburgh?
Inequality or Gini Index in Newburgh is 0.52.
How Large is the Labor Force in Newburgh?
There are 13,846 People in the Labor Forcein in Newburgh.
What is the Percentage of People in the Labor Force in Newburgh?
61.4% of People are in the Labor Force in Newburgh.
What is the Unemployment Rate in Newburgh?
Unemployment Rate in Newburgh is 7.8%.