Cities with the Highest Percentage of Immigrants from Trinidad and Tobago in New Jersey
RELATED REPORTS & OPTIONS
Trinidad and Tobago
New Jersey
Compare Cities
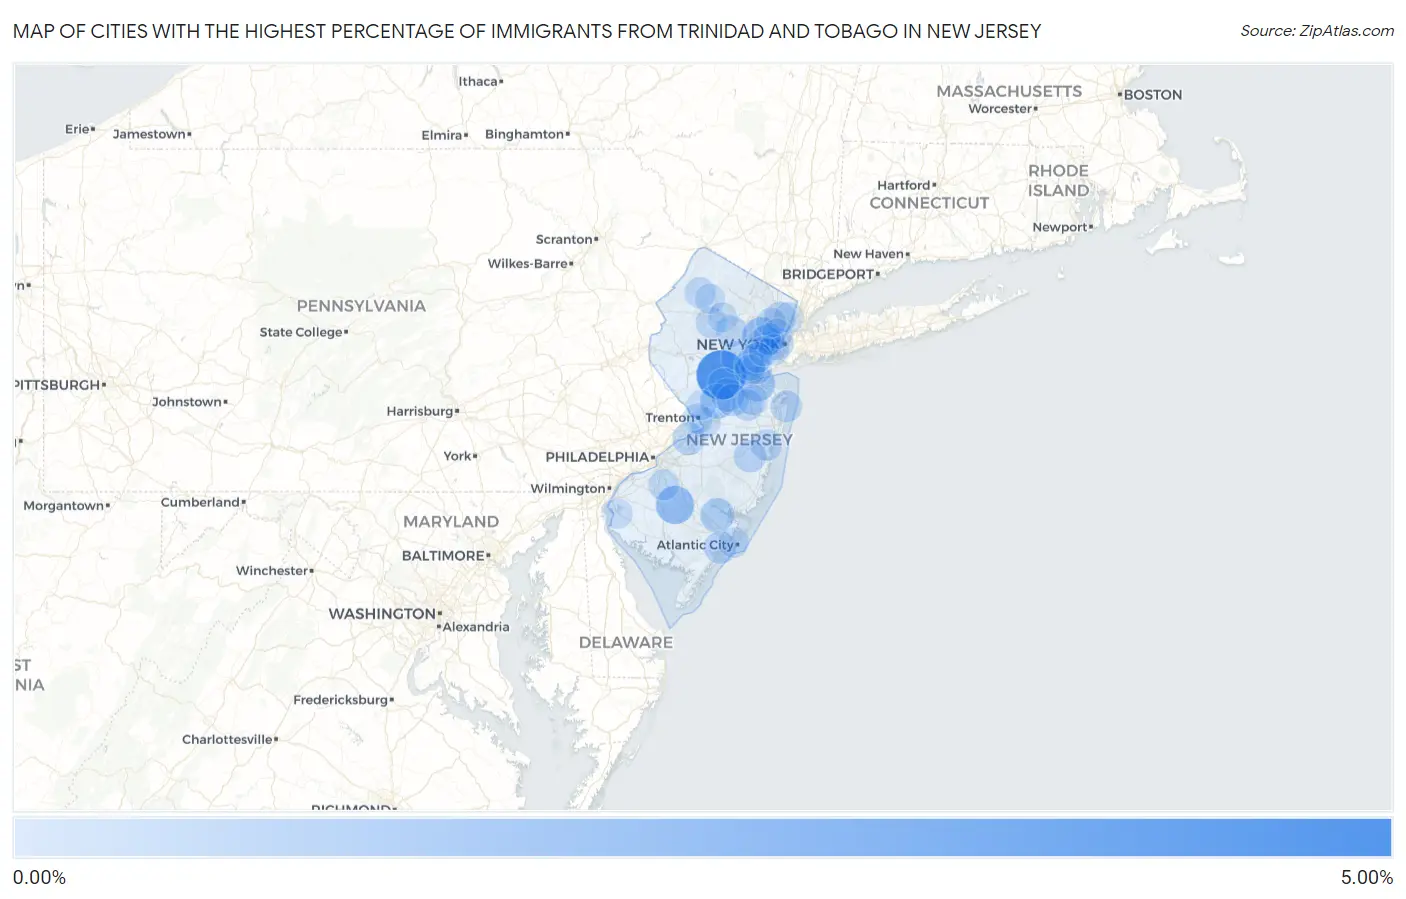
Map of Cities with the Highest Percentage of Immigrants from Trinidad and Tobago in New Jersey
0.00%
5.00%
Cities with the Highest Percentage of Immigrants from Trinidad and Tobago in New Jersey
| City | Trinidad and Tobago | vs State | vs National | |
| 1. | Teterboro Borough | 4.40% | 0.17%(+4.23)#-1 | 0.070%(+4.33)#0 |
| 2. | East Millstone | 4.25% | 0.17%(+4.08)#0 | 0.070%(+4.18)#1 |
| 3. | Victory Lakes | 1.82% | 0.17%(+1.65)#1 | 0.070%(+1.75)#2 |
| 4. | East Orange | 1.76% | 0.17%(+1.59)#2 | 0.070%(+1.69)#3 |
| 5. | Cliffside Park Borough | 1.67% | 0.17%(+1.50)#3 | 0.070%(+1.60)#4 |
| 6. | Laurence Harbor | 1.23% | 0.17%(+1.06)#4 | 0.070%(+1.16)#5 |
| 7. | Vauxhall | 1.20% | 0.17%(+1.03)#5 | 0.070%(+1.13)#6 |
| 8. | Robbinsville Center | 1.17% | 0.17%(+1.01)#6 | 0.070%(+1.10)#7 |
| 9. | Plainsboro Center | 1.12% | 0.17%(+0.953)#7 | 0.070%(+1.05)#8 |
| 10. | Egg Harbor City | 0.96% | 0.17%(+0.792)#8 | 0.070%(+0.890)#9 |
| 11. | Union Beach Borough | 0.96% | 0.17%(+0.788)#9 | 0.070%(+0.887)#10 |
| 12. | Bergenfield Borough | 0.84% | 0.17%(+0.675)#10 | 0.070%(+0.773)#11 |
| 13. | Dayton | 0.80% | 0.17%(+0.633)#11 | 0.070%(+0.732)#12 |
| 14. | Bedminster | 0.79% | 0.17%(+0.626)#12 | 0.070%(+0.724)#13 |
| 15. | Watsessing | 0.78% | 0.17%(+0.609)#13 | 0.070%(+0.707)#14 |
| 16. | Glen Ridge Borough | 0.65% | 0.17%(+0.486)#14 | 0.070%(+0.584)#15 |
| 17. | Burlington | 0.65% | 0.17%(+0.483)#15 | 0.070%(+0.581)#16 |
| 18. | Plainfield | 0.65% | 0.17%(+0.478)#16 | 0.070%(+0.576)#17 |
| 19. | Bogota Borough | 0.63% | 0.17%(+0.458)#17 | 0.070%(+0.557)#18 |
| 20. | Landing | 0.62% | 0.17%(+0.457)#18 | 0.070%(+0.555)#19 |
| 21. | Roselle Borough | 0.62% | 0.17%(+0.450)#19 | 0.070%(+0.548)#20 |
| 22. | Rossmoor | 0.61% | 0.17%(+0.445)#20 | 0.070%(+0.543)#21 |
| 23. | Pine Ridge At Crestwood | 0.60% | 0.17%(+0.430)#21 | 0.070%(+0.529)#22 |
| 24. | Linwood | 0.59% | 0.17%(+0.422)#22 | 0.070%(+0.520)#23 |
| 25. | Dumont Borough | 0.57% | 0.17%(+0.404)#23 | 0.070%(+0.502)#24 |
| 26. | Jersey City | 0.55% | 0.17%(+0.383)#24 | 0.070%(+0.481)#515 |
| 27. | Lodi Borough | 0.53% | 0.17%(+0.360)#25 | 0.070%(+0.458)#516 |
| 28. | Netcong Borough | 0.52% | 0.17%(+0.349)#26 | 0.070%(+0.447)#517 |
| 29. | Newark | 0.51% | 0.17%(+0.342)#27 | 0.070%(+0.440)#518 |
| 30. | Ampere North | 0.50% | 0.17%(+0.336)#28 | 0.070%(+0.434)#519 |
| 31. | North Plainfield Borough | 0.49% | 0.17%(+0.326)#29 | 0.070%(+0.424)#520 |
| 32. | Rahway | 0.49% | 0.17%(+0.324)#30 | 0.070%(+0.422)#521 |
| 33. | English Creek | 0.47% | 0.17%(+0.299)#31 | 0.070%(+0.397)#522 |
| 34. | Cedar Knolls | 0.45% | 0.17%(+0.286)#32 | 0.070%(+0.385)#523 |
| 35. | Pemberton Borough | 0.45% | 0.17%(+0.280)#33 | 0.070%(+0.379)#524 |
| 36. | Long Branch | 0.45% | 0.17%(+0.280)#34 | 0.070%(+0.378)#525 |
| 37. | Riverdale Borough | 0.44% | 0.17%(+0.273)#35 | 0.070%(+0.371)#526 |
| 38. | Morristown | 0.43% | 0.17%(+0.264)#36 | 0.070%(+0.362)#527 |
| 39. | North Haledon Borough | 0.43% | 0.17%(+0.264)#37 | 0.070%(+0.362)#528 |
| 40. | Yorketown | 0.43% | 0.17%(+0.262)#38 | 0.070%(+0.360)#529 |
| 41. | Allendale Borough | 0.43% | 0.17%(+0.257)#39 | 0.070%(+0.356)#530 |
| 42. | Hawthorne Borough | 0.42% | 0.17%(+0.254)#40 | 0.070%(+0.352)#531 |
| 43. | Closter Borough | 0.42% | 0.17%(+0.253)#41 | 0.070%(+0.351)#532 |
| 44. | Haworth Borough | 0.42% | 0.17%(+0.251)#42 | 0.070%(+0.349)#533 |
| 45. | Hackensack | 0.42% | 0.17%(+0.247)#43 | 0.070%(+0.345)#534 |
| 46. | Newton | 0.39% | 0.17%(+0.226)#44 | 0.070%(+0.324)#535 |
| 47. | Freehold Borough | 0.39% | 0.17%(+0.224)#45 | 0.070%(+0.322)#536 |
| 48. | Harrison | 0.39% | 0.17%(+0.222)#46 | 0.070%(+0.320)#537 |
| 49. | Franklin Park | 0.39% | 0.17%(+0.219)#47 | 0.070%(+0.318)#538 |
| 50. | Leisure Village East | 0.39% | 0.17%(+0.219)#48 | 0.070%(+0.317)#539 |
| 51. | Succasunna | 0.39% | 0.17%(+0.218)#49 | 0.070%(+0.317)#540 |
| 52. | Sayreville Borough | 0.37% | 0.17%(+0.206)#50 | 0.070%(+0.305)#541 |
| 53. | Sewaren | 0.37% | 0.17%(+0.203)#51 | 0.070%(+0.301)#542 |
| 54. | Bloomingdale Borough | 0.36% | 0.17%(+0.194)#52 | 0.070%(+0.293)#543 |
| 55. | Iselin | 0.36% | 0.17%(+0.194)#53 | 0.070%(+0.292)#544 |
| 56. | Leonia Borough | 0.35% | 0.17%(+0.177)#54 | 0.070%(+0.275)#545 |
| 57. | Pine Brook | 0.34% | 0.17%(+0.174)#55 | 0.070%(+0.272)#546 |
| 58. | Turnersville | 0.33% | 0.17%(+0.167)#56 | 0.070%(+0.265)#547 |
| 59. | Marmora | 0.33% | 0.17%(+0.157)#57 | 0.070%(+0.255)#548 |
| 60. | Fords | 0.32% | 0.17%(+0.156)#58 | 0.070%(+0.254)#549 |
| 61. | Washington Borough | 0.32% | 0.17%(+0.150)#59 | 0.070%(+0.248)#550 |
| 62. | Wenonah Borough | 0.32% | 0.17%(+0.148)#60 | 0.070%(+0.246)#551 |
| 63. | Bayonne | 0.30% | 0.17%(+0.137)#61 | 0.070%(+0.235)#552 |
| 64. | Keansburg Borough | 0.30% | 0.17%(+0.129)#62 | 0.070%(+0.227)#553 |
| 65. | Lavallette Borough | 0.29% | 0.17%(+0.127)#63 | 0.070%(+0.225)#554 |
| 66. | Westwood Borough | 0.29% | 0.17%(+0.126)#64 | 0.070%(+0.224)#555 |
| 67. | Harrington Park Borough | 0.29% | 0.17%(+0.122)#65 | 0.070%(+0.220)#556 |
| 68. | Sicklerville | 0.28% | 0.17%(+0.111)#66 | 0.070%(+0.209)#557 |
| 69. | Englewood | 0.27% | 0.17%(+0.107)#67 | 0.070%(+0.205)#558 |
| 70. | White Horse | 0.26% | 0.17%(+0.090)#68 | 0.070%(+0.188)#559 |
| 71. | Atlantic City | 0.25% | 0.17%(+0.084)#69 | 0.070%(+0.182)#560 |
| 72. | Lyons | 0.25% | 0.17%(+0.083)#70 | 0.070%(+0.181)#561 |
| 73. | Robertsville | 0.25% | 0.17%(+0.077)#71 | 0.070%(+0.175)#562 |
| 74. | Woodlynne Borough | 0.24% | 0.17%(+0.073)#72 | 0.070%(+0.171)#563 |
| 75. | Franklin Lakes Borough | 0.24% | 0.17%(+0.068)#73 | 0.070%(+0.166)#564 |
| 76. | Matawan Borough | 0.23% | 0.17%(+0.063)#74 | 0.070%(+0.161)#565 |
| 77. | Garwood Borough | 0.22% | 0.17%(+0.052)#75 | 0.070%(+0.150)#566 |
| 78. | Packanack Lake | 0.22% | 0.17%(+0.049)#76 | 0.070%(+0.147)#567 |
| 79. | Linden | 0.22% | 0.17%(+0.048)#77 | 0.070%(+0.146)#568 |
| 80. | Trenton | 0.21% | 0.17%(+0.045)#78 | 0.070%(+0.143)#569 |
| 81. | Haledon Borough | 0.21% | 0.17%(+0.044)#79 | 0.070%(+0.143)#570 |
| 82. | Westmont | 0.21% | 0.17%(+0.044)#80 | 0.070%(+0.142)#571 |
| 83. | Fair Lawn Borough | 0.20% | 0.17%(+0.035)#81 | 0.070%(+0.133)#572 |
| 84. | Wood Ridge Borough | 0.20% | 0.17%(+0.032)#82 | 0.070%(+0.131)#573 |
| 85. | Spotswood Borough | 0.20% | 0.17%(+0.029)#83 | 0.070%(+0.127)#574 |
| 86. | Flanders | 0.20% | 0.17%(+0.028)#84 | 0.070%(+0.127)#575 |
| 87. | Maywood Borough | 0.19% | 0.17%(+0.021)#85 | 0.070%(+0.119)#576 |
| 88. | Salem | 0.19% | 0.17%(+0.021)#86 | 0.070%(+0.119)#577 |
| 89. | Secaucus | 0.18% | 0.17%(+0.014)#87 | 0.070%(+0.112)#578 |
| 90. | Lake Mohawk | 0.16% | 0.17%(-0.003)#88 | 0.070%(+0.095)#579 |
| 91. | Elizabeth | 0.16% | 0.17%(-0.005)#89 | 0.070%(+0.093)#580 |
| 92. | Lawrenceville | 0.16% | 0.17%(-0.008)#90 | 0.070%(+0.090)#581 |
| 93. | Palisades Park Borough | 0.16% | 0.17%(-0.010)#91 | 0.070%(+0.088)#582 |
| 94. | Oak Ridge | 0.15% | 0.17%(-0.013)#92 | 0.070%(+0.085)#583 |
| 95. | New Milford Borough | 0.15% | 0.17%(-0.014)#93 | 0.070%(+0.084)#584 |
| 96. | Belmar Borough | 0.15% | 0.17%(-0.015)#94 | 0.070%(+0.083)#585 |
| 97. | Somerville Borough | 0.15% | 0.17%(-0.016)#95 | 0.070%(+0.083)#586 |
| 98. | Parsippany | 0.15% | 0.17%(-0.017)#96 | 0.070%(+0.082)#587 |
| 99. | Passaic | 0.14% | 0.17%(-0.025)#97 | 0.070%(+0.073)#588 |
| 100. | Dover | 0.14% | 0.17%(-0.032)#98 | 0.070%(+0.066)#589 |
Common Questions
What are the Top 10 Cities with the Highest Percentage of Immigrants from Trinidad and Tobago in New Jersey?
Top 10 Cities with the Highest Percentage of Immigrants from Trinidad and Tobago in New Jersey are:
#1
4.25%
#2
1.82%
#3
1.76%
#4
1.23%
#5
1.12%
#6
0.96%
#7
0.80%
#8
0.65%
#9
0.65%
#10
0.61%
What city has the Highest Percentage of Immigrants from Trinidad and Tobago in New Jersey?
East Millstone has the Highest Percentage of Immigrants from Trinidad and Tobago in New Jersey with 4.25%.
What is the Percentage of Immigrants from Trinidad and Tobago in the State of New Jersey?
Percentage of Immigrants from Trinidad and Tobago in New Jersey is 0.17%.
What is the Percentage of Immigrants from Trinidad and Tobago in the United States?
Percentage of Immigrants from Trinidad and Tobago in the United States is 0.070%.