Islip Terrace, NY
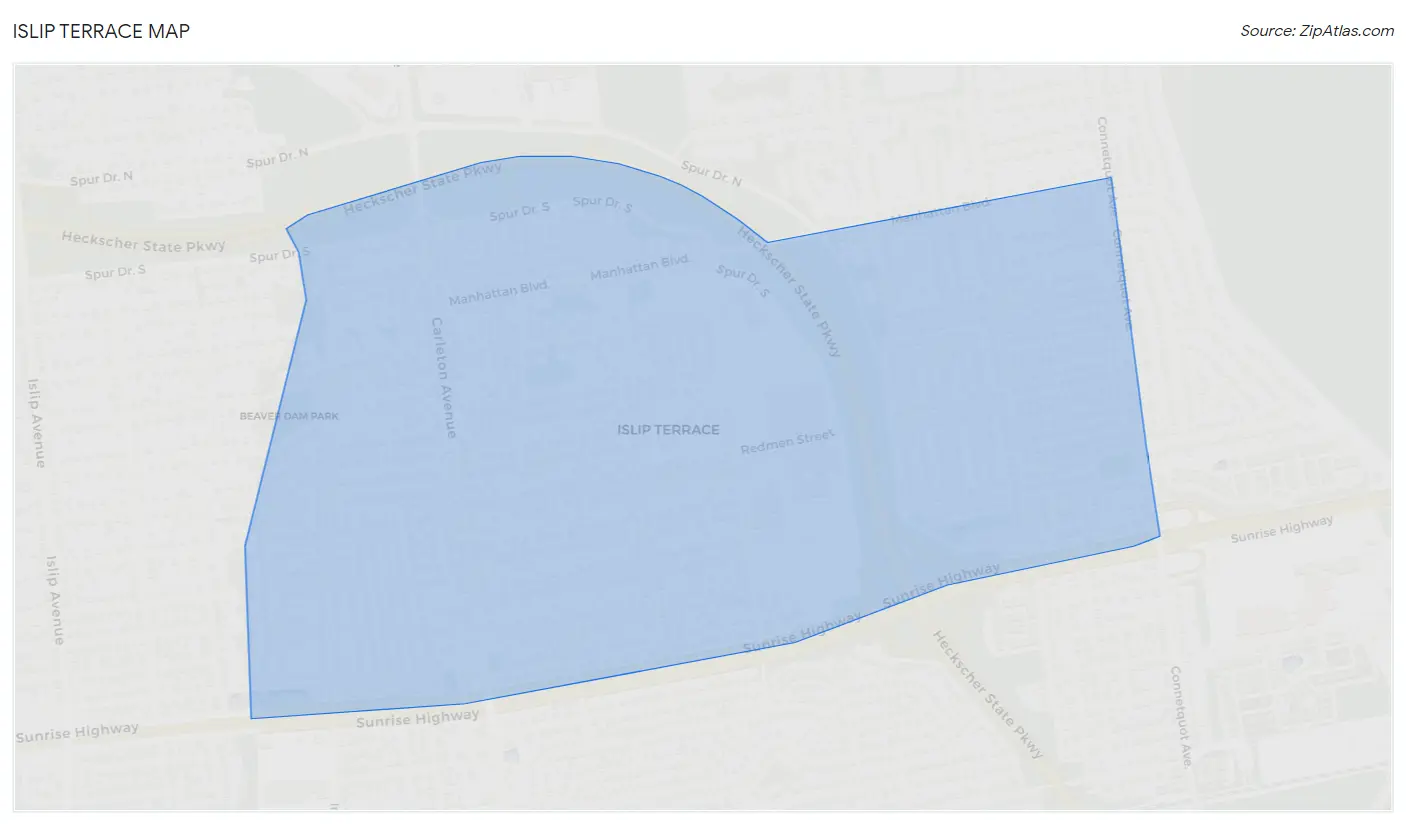
Islip Terrace Map
Islip Terrace Overview
5,318
TOTAL POPULATION
2,660
MALE POPULATION
2,658
FEMALE POPULATION
100.08
MALES / 100 FEMALES
99.92
FEMALES / 100 MALES
39.4
MEDIAN AGE
3.4
AVG FAMILY SIZE
3.1
AVG HOUSEHOLD SIZE
$50,715
PER CAPITA INCOME
$152,697
AVG FAMILY INCOME
$149,946
AVG HOUSEHOLD INCOME
49.8%
WAGE / INCOME GAP [ % ]
50.2¢/ $1
WAGE / INCOME GAP [ $ ]
0.32
INEQUALITY / GINI INDEX
3,189
LABOR FORCE [ PEOPLE ]
75.0%
PERCENT IN LABOR FORCE
0.3%
UNEMPLOYMENT RATE
Islip Terrace Zip Codes
Islip Terrace Area Codes
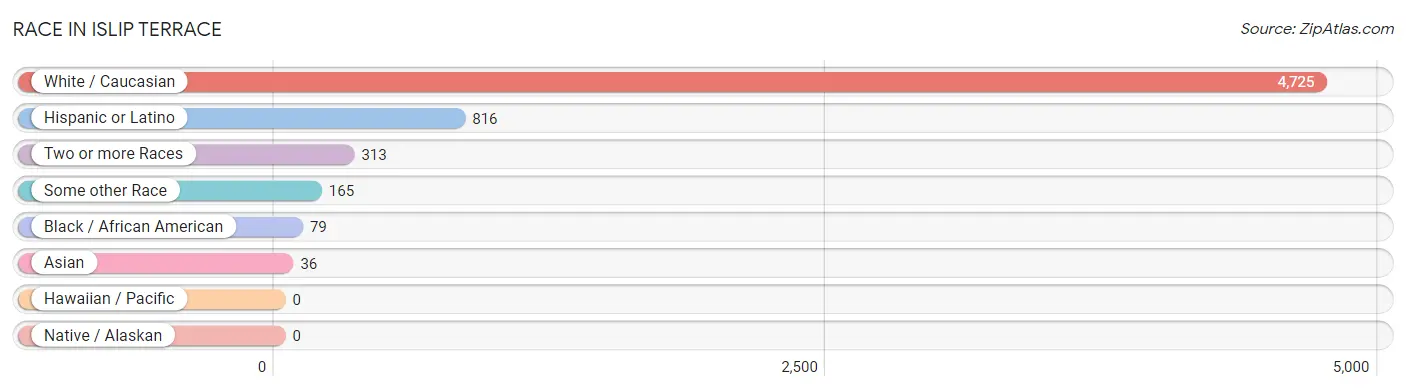
Race in Islip Terrace
The most populous races in Islip Terrace are White / Caucasian (4,725 | 88.8%), Hispanic or Latino (816 | 15.3%), and Two or more Races (313 | 5.9%).
| Race | # Population | % Population |
| Asian | 36 | 0.7% |
| Black / African American | 79 | 1.5% |
| Hawaiian / Pacific | 0 | 0.0% |
| Hispanic or Latino | 816 | 15.3% |
| Native / Alaskan | 0 | 0.0% |
| White / Caucasian | 4,725 | 88.8% |
| Two or more Races | 313 | 5.9% |
| Some other Race | 165 | 3.1% |
| Total | 5,318 | 100.0% |
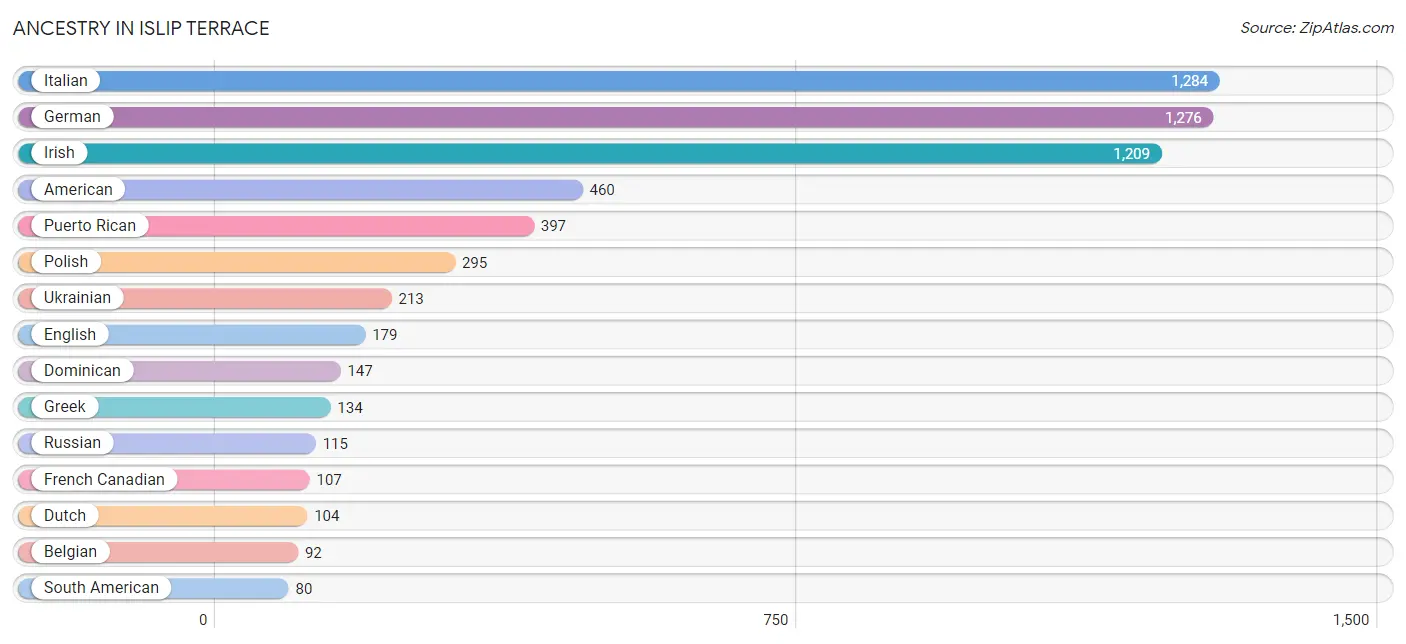
Ancestry in Islip Terrace
The most populous ancestries reported in Islip Terrace are Italian (1,284 | 24.1%), German (1,276 | 24.0%), Irish (1,209 | 22.7%), American (460 | 8.6%), and Puerto Rican (397 | 7.5%), together accounting for 87.0% of all Islip Terrace residents.
| Ancestry | # Population | % Population |
| American | 460 | 8.6% |
| Arab | 7 | 0.1% |
| Austrian | 34 | 0.6% |
| Belgian | 92 | 1.7% |
| British | 11 | 0.2% |
| Canadian | 38 | 0.7% |
| Central American | 31 | 0.6% |
| Czech | 17 | 0.3% |
| Danish | 6 | 0.1% |
| Dominican | 147 | 2.8% |
| Dutch | 104 | 2.0% |
| Eastern European | 7 | 0.1% |
| Ecuadorian | 75 | 1.4% |
| English | 179 | 3.4% |
| European | 4 | 0.1% |
| French | 51 | 1.0% |
| French Canadian | 107 | 2.0% |
| German | 1,276 | 24.0% |
| Greek | 134 | 2.5% |
| Indian (Asian) | 27 | 0.5% |
| Iranian | 27 | 0.5% |
| Irish | 1,209 | 22.7% |
| Israeli | 25 | 0.5% |
| Italian | 1,284 | 24.1% |
| Korean | 32 | 0.6% |
| Lithuanian | 11 | 0.2% |
| Mexican | 7 | 0.1% |
| Norwegian | 60 | 1.1% |
| Peruvian | 5 | 0.1% |
| Polish | 295 | 5.6% |
| Portuguese | 12 | 0.2% |
| Puerto Rican | 397 | 7.5% |
| Russian | 115 | 2.2% |
| Salvadoran | 31 | 0.6% |
| Scotch-Irish | 8 | 0.2% |
| Scottish | 8 | 0.2% |
| Slavic | 12 | 0.2% |
| Slovak | 34 | 0.6% |
| South American | 80 | 1.5% |
| Spaniard | 11 | 0.2% |
| Spanish | 17 | 0.3% |
| Swiss | 11 | 0.2% |
| Thai | 2 | 0.0% |
| Ukrainian | 213 | 4.0% |
| Welsh | 11 | 0.2% |
| West Indian | 61 | 1.1% | View All 46 Rows |
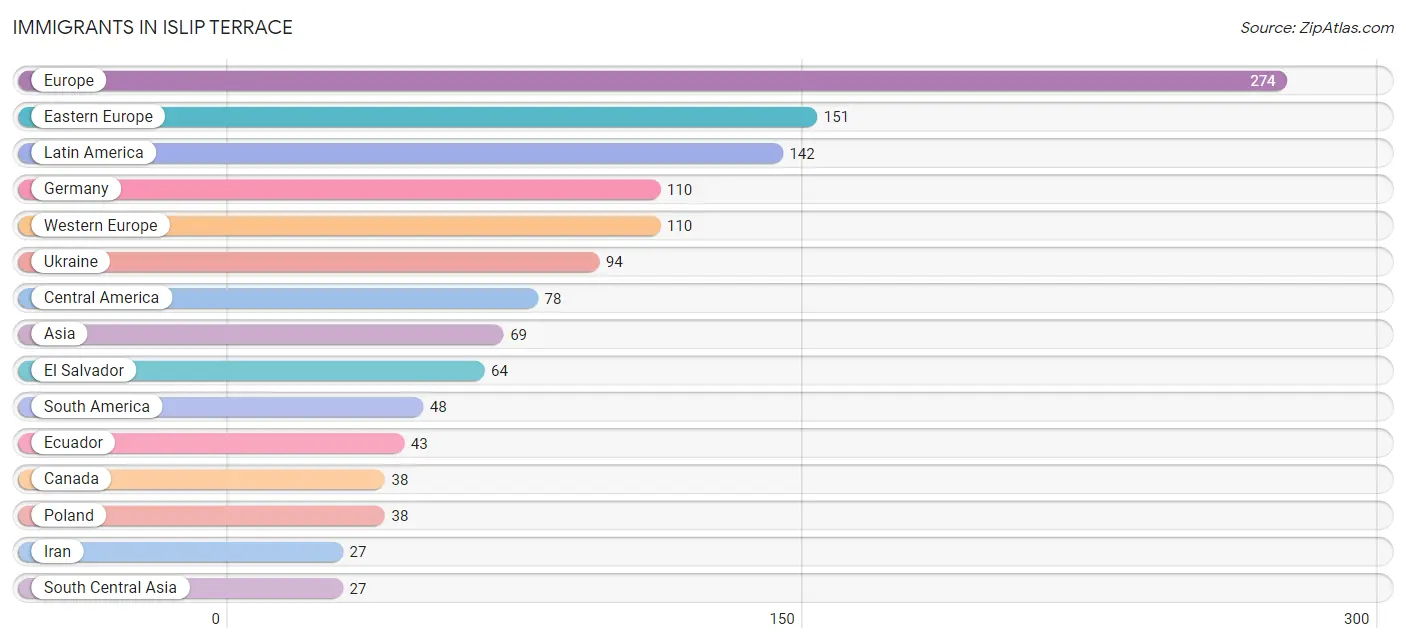
Immigrants in Islip Terrace
The most numerous immigrant groups reported in Islip Terrace came from Europe (274 | 5.1%), Eastern Europe (151 | 2.8%), Latin America (142 | 2.7%), Germany (110 | 2.1%), and Western Europe (110 | 2.1%), together accounting for 14.8% of all Islip Terrace residents.
| Immigration Origin | # Population | % Population |
| Asia | 69 | 1.3% |
| Canada | 38 | 0.7% |
| Caribbean | 16 | 0.3% |
| Central America | 78 | 1.5% |
| China | 16 | 0.3% |
| Eastern Asia | 16 | 0.3% |
| Eastern Europe | 151 | 2.8% |
| Ecuador | 43 | 0.8% |
| El Salvador | 64 | 1.2% |
| Europe | 274 | 5.1% |
| Germany | 110 | 2.1% |
| Iran | 27 | 0.5% |
| Ireland | 10 | 0.2% |
| Israel | 12 | 0.2% |
| Latin America | 142 | 2.7% |
| Northern Europe | 10 | 0.2% |
| Panama | 14 | 0.3% |
| Peru | 5 | 0.1% |
| Philippines | 14 | 0.3% |
| Poland | 38 | 0.7% |
| Portugal | 3 | 0.1% |
| Russia | 19 | 0.4% |
| South America | 48 | 0.9% |
| South Central Asia | 27 | 0.5% |
| South Eastern Asia | 14 | 0.3% |
| Southern Europe | 3 | 0.1% |
| Trinidad and Tobago | 16 | 0.3% |
| Ukraine | 94 | 1.8% |
| Western Asia | 12 | 0.2% |
| Western Europe | 110 | 2.1% | View All 30 Rows |
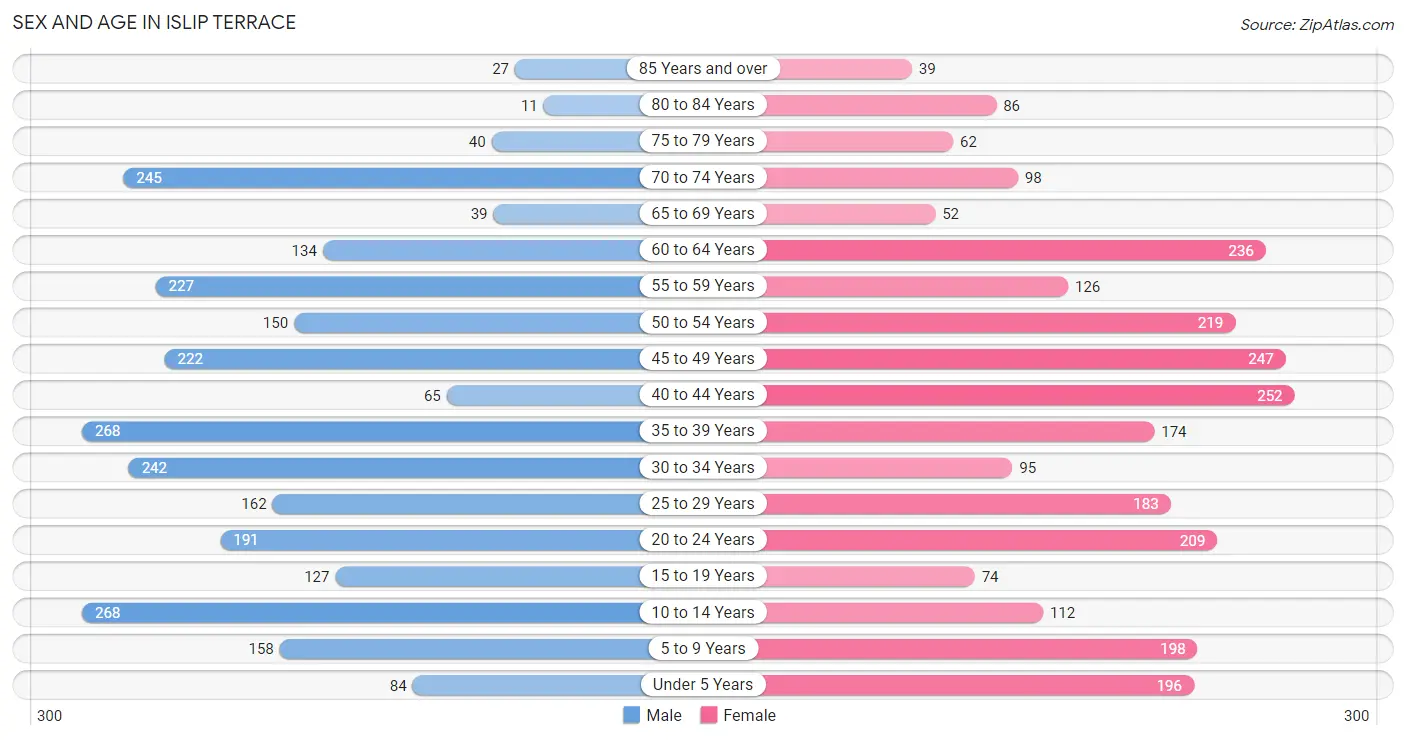
Sex and Age in Islip Terrace
Sex and Age in Islip Terrace
The most populous age groups in Islip Terrace are 10 to 14 Years (268 | 10.1%) for men and 40 to 44 Years (252 | 9.5%) for women.
| Age Bracket | Male | Female |
| Under 5 Years | 84 (3.2%) | 196 (7.4%) |
| 5 to 9 Years | 158 (5.9%) | 198 (7.4%) |
| 10 to 14 Years | 268 (10.1%) | 112 (4.2%) |
| 15 to 19 Years | 127 (4.8%) | 74 (2.8%) |
| 20 to 24 Years | 191 (7.2%) | 209 (7.9%) |
| 25 to 29 Years | 162 (6.1%) | 183 (6.9%) |
| 30 to 34 Years | 242 (9.1%) | 95 (3.6%) |
| 35 to 39 Years | 268 (10.1%) | 174 (6.6%) |
| 40 to 44 Years | 65 (2.4%) | 252 (9.5%) |
| 45 to 49 Years | 222 (8.4%) | 247 (9.3%) |
| 50 to 54 Years | 150 (5.6%) | 219 (8.2%) |
| 55 to 59 Years | 227 (8.5%) | 126 (4.7%) |
| 60 to 64 Years | 134 (5.0%) | 236 (8.9%) |
| 65 to 69 Years | 39 (1.5%) | 52 (2.0%) |
| 70 to 74 Years | 245 (9.2%) | 98 (3.7%) |
| 75 to 79 Years | 40 (1.5%) | 62 (2.3%) |
| 80 to 84 Years | 11 (0.4%) | 86 (3.2%) |
| 85 Years and over | 27 (1.0%) | 39 (1.5%) |
| Total | 2,660 (100.0%) | 2,658 (100.0%) |
Families and Households in Islip Terrace
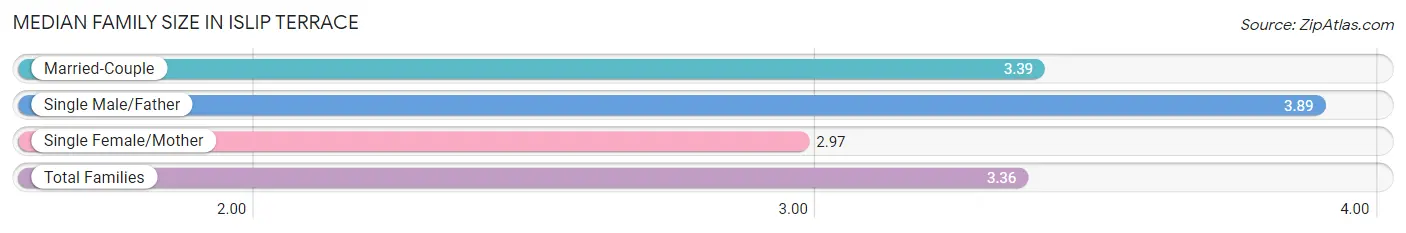
Median Family Size in Islip Terrace
The median family size in Islip Terrace is 3.36 persons per family, with single male/father families (89 | 6.4%) accounting for the largest median family size of 3.89 persons per family. On the other hand, single female/mother families (209 | 15.0%) represent the smallest median family size with 2.97 persons per family.
| Family Type | # Families | Family Size |
| Married-Couple | 1,094 (78.6%) | 3.39 |
| Single Male/Father | 89 (6.4%) | 3.89 |
| Single Female/Mother | 209 (15.0%) | 2.97 |
| Total Families | 1,392 (100.0%) | 3.36 |
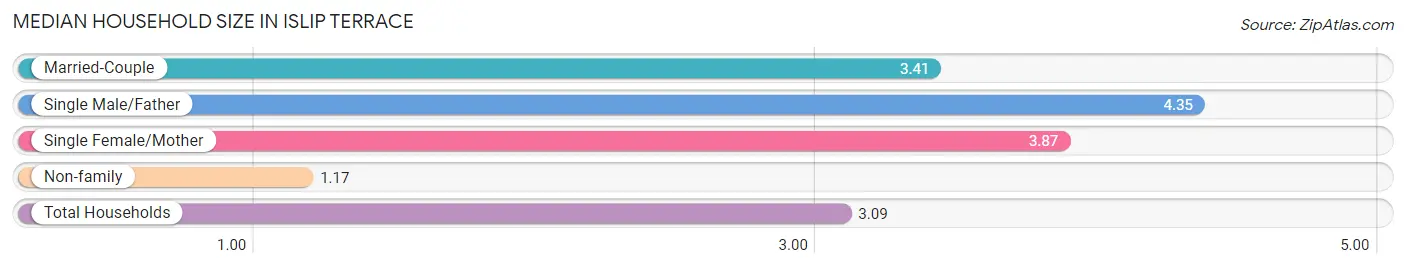
Median Household Size in Islip Terrace
The median household size in Islip Terrace is 3.09 persons per household, with single male/father households (89 | 5.2%) accounting for the largest median household size of 4.35 persons per household. non-family households (331 | 19.2%) represent the smallest median household size with 1.17 persons per household.
| Household Type | # Households | Household Size |
| Married-Couple | 1,094 (63.5%) | 3.41 |
| Single Male/Father | 89 (5.2%) | 4.35 |
| Single Female/Mother | 209 (12.1%) | 3.87 |
| Non-family | 331 (19.2%) | 1.17 |
| Total Households | 1,723 (100.0%) | 3.09 |
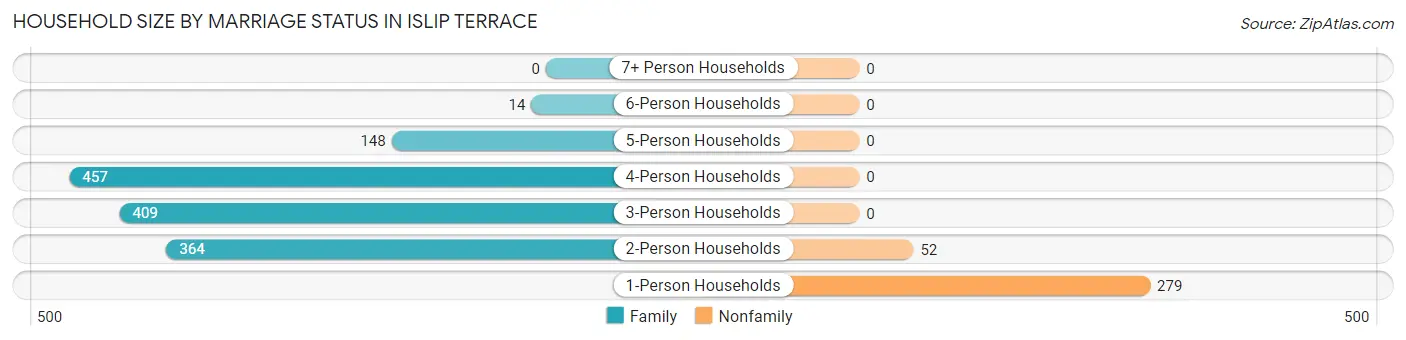
Household Size by Marriage Status in Islip Terrace
Out of a total of 1,723 households in Islip Terrace, 1,392 (80.8%) are family households, while 331 (19.2%) are nonfamily households. The most numerous type of family households are 4-person households, comprising 457, and the most common type of nonfamily households are 1-person households, comprising 279.
| Household Size | Family Households | Nonfamily Households |
| 1-Person Households | - | 279 (16.2%) |
| 2-Person Households | 364 (21.1%) | 52 (3.0%) |
| 3-Person Households | 409 (23.7%) | 0 (0.0%) |
| 4-Person Households | 457 (26.5%) | 0 (0.0%) |
| 5-Person Households | 148 (8.6%) | 0 (0.0%) |
| 6-Person Households | 14 (0.8%) | 0 (0.0%) |
| 7+ Person Households | 0 (0.0%) | 0 (0.0%) |
| Total | 1,392 (80.8%) | 331 (19.2%) |
Female Fertility in Islip Terrace
Fertility by Age in Islip Terrace
Average fertility rate in Islip Terrace is 55.0 births per 1,000 women. Women in the age bracket of 20 to 34 years have the highest fertility rate with 146.0 births per 1,000 women. Women in the age bracket of 20 to 34 years acount for 100.0% of all women with births.
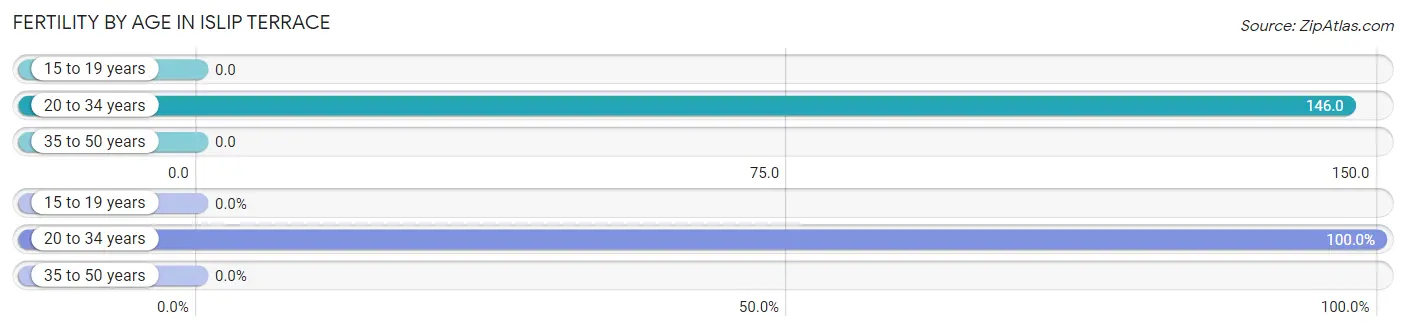
| Age Bracket | Women with Births | Births / 1,000 Women |
| 15 to 19 years | 0 (0.0%) | 0.0 |
| 20 to 34 years | 71 (100.0%) | 146.0 |
| 35 to 50 years | 0 (0.0%) | 0.0 |
| Total | 71 (100.0%) | 55.0 |
Fertility by Age by Marriage Status in Islip Terrace
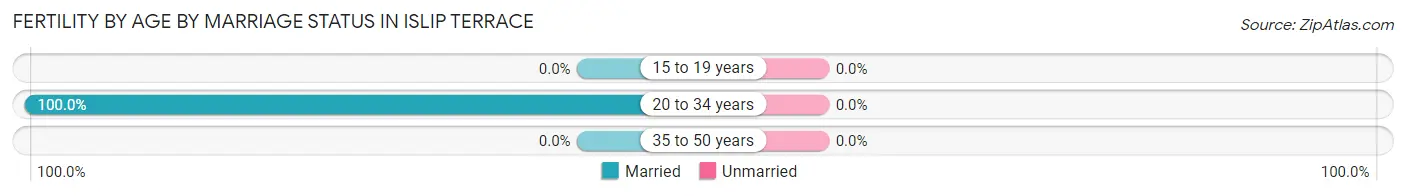
| Age Bracket | Married | Unmarried |
| 15 to 19 years | 0 (0.0%) | 0 (0.0%) |
| 20 to 34 years | 71 (100.0%) | 0 (0.0%) |
| 35 to 50 years | 0 (0.0%) | 0 (0.0%) |
| Total | 71 (100.0%) | 0 (0.0%) |
Fertility by Education in Islip Terrace
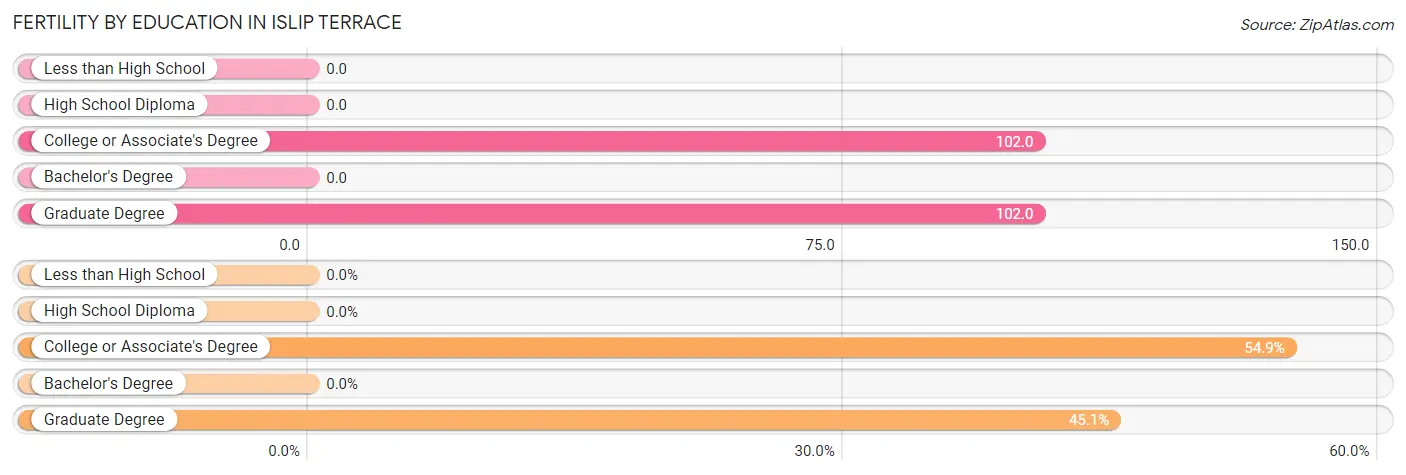
| Educational Attainment | Women with Births | Births / 1,000 Women |
| Less than High School | 0 (0.0%) | 0.0 |
| High School Diploma | 0 (0.0%) | 0.0 |
| College or Associate's Degree | 39 (54.9%) | 102.0 |
| Bachelor's Degree | 0 (0.0%) | 0.0 |
| Graduate Degree | 32 (45.1%) | 102.0 |
| Total | 71 (100.0%) | 55.0 |
Fertility by Education by Marriage Status in Islip Terrace
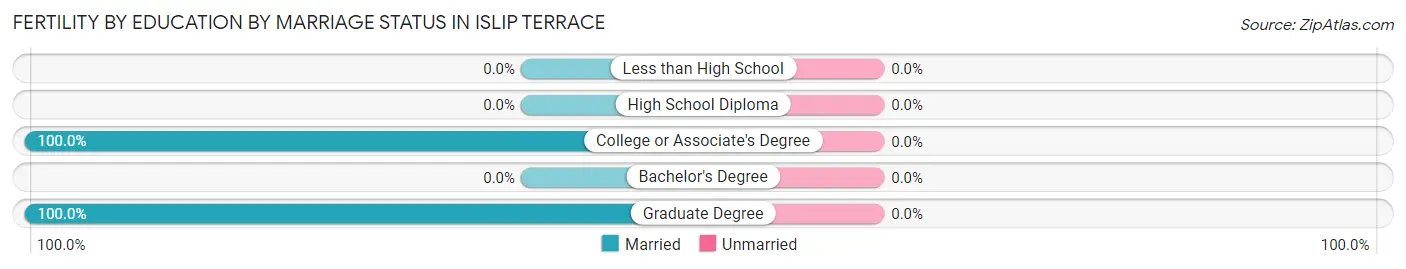
| Educational Attainment | Married | Unmarried |
| Less than High School | 0 (0.0%) | 0 (0.0%) |
| High School Diploma | 0 (0.0%) | 0 (0.0%) |
| College or Associate's Degree | 39 (100.0%) | 0 (0.0%) |
| Bachelor's Degree | 0 (0.0%) | 0 (0.0%) |
| Graduate Degree | 32 (100.0%) | 0 (0.0%) |
| Total | 71 (100.0%) | 0 (0.0%) |
Income in Islip Terrace
Income Overview in Islip Terrace
Per Capita Income in Islip Terrace is $50,715, while median incomes of families and households are $152,697 and $149,946 respectively.
| Characteristic | Number | Measure |
| Per Capita Income | 5,318 | $50,715 |
| Median Family Income | 1,392 | $152,697 |
| Mean Family Income | 1,392 | $148,919 |
| Median Household Income | 1,723 | $149,946 |
| Mean Household Income | 1,723 | $152,183 |
| Income Deficit | 1,392 | $0 |
| Wage / Income Gap (%) | 5,318 | 49.80% |
| Wage / Income Gap ($) | 5,318 | 50.20¢ per $1 |
| Gini / Inequality Index | 5,318 | 0.32 |
Earnings by Sex in Islip Terrace
Average Earnings in Islip Terrace are $59,417, $77,198 for men and $38,750 for women, a difference of 49.8%.
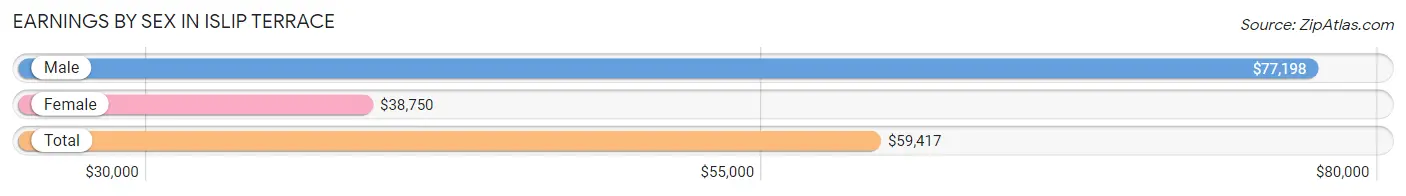
| Sex | Number | Average Earnings |
| Male | 1,727 (52.5%) | $77,198 |
| Female | 1,564 (47.5%) | $38,750 |
| Total | 3,291 (100.0%) | $59,417 |
Earnings by Sex by Income Bracket in Islip Terrace
The most common earnings brackets in Islip Terrace are $100,000+ for men (633 | 36.6%) and $100,000+ for women (265 | 16.9%).
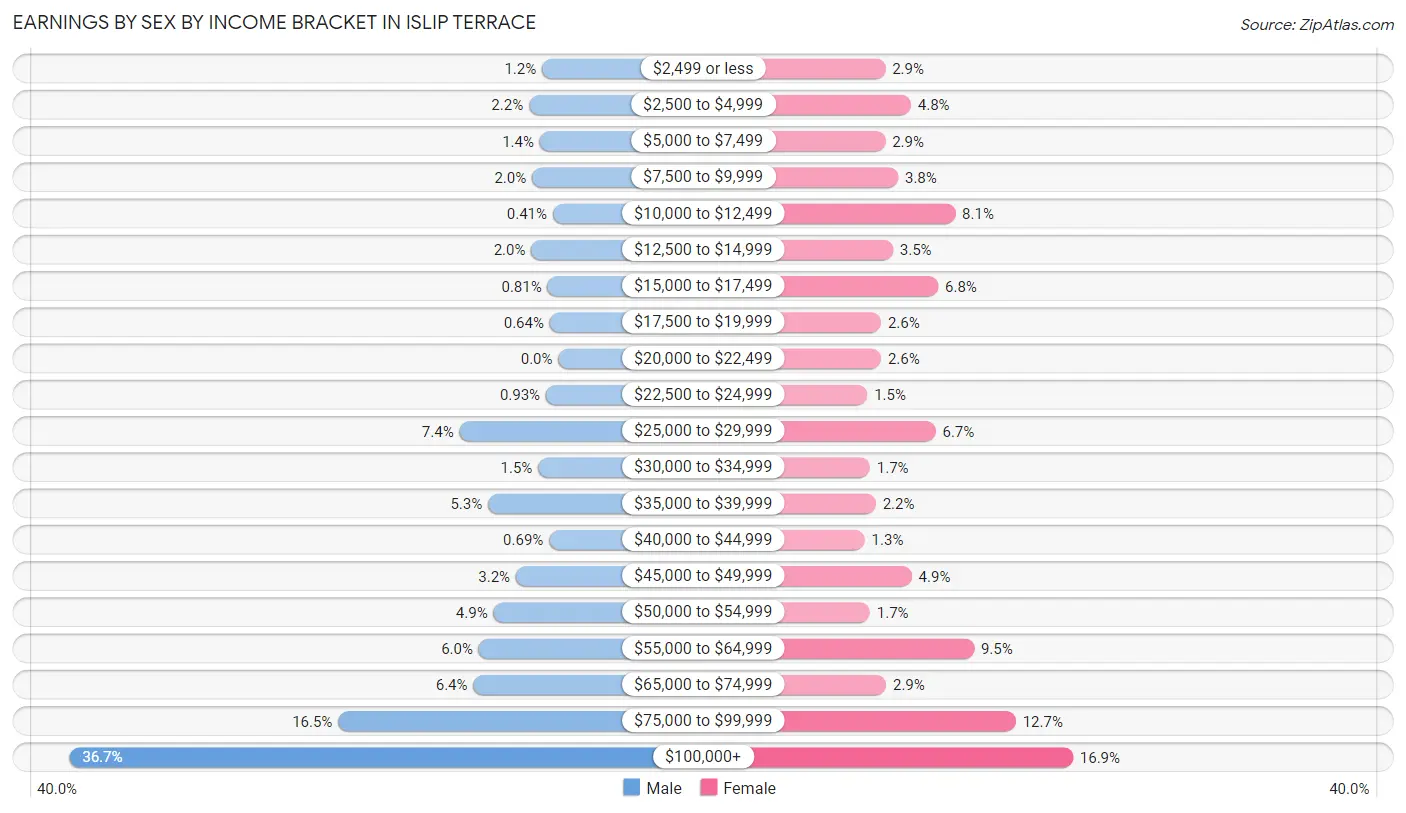
| Income | Male | Female |
| $2,499 or less | 21 (1.2%) | 45 (2.9%) |
| $2,500 to $4,999 | 38 (2.2%) | 75 (4.8%) |
| $5,000 to $7,499 | 24 (1.4%) | 45 (2.9%) |
| $7,500 to $9,999 | 34 (2.0%) | 60 (3.8%) |
| $10,000 to $12,499 | 7 (0.4%) | 127 (8.1%) |
| $12,500 to $14,999 | 35 (2.0%) | 54 (3.5%) |
| $15,000 to $17,499 | 14 (0.8%) | 107 (6.8%) |
| $17,500 to $19,999 | 11 (0.6%) | 40 (2.6%) |
| $20,000 to $22,499 | 0 (0.0%) | 40 (2.6%) |
| $22,500 to $24,999 | 16 (0.9%) | 24 (1.5%) |
| $25,000 to $29,999 | 128 (7.4%) | 104 (6.7%) |
| $30,000 to $34,999 | 26 (1.5%) | 27 (1.7%) |
| $35,000 to $39,999 | 91 (5.3%) | 34 (2.2%) |
| $40,000 to $44,999 | 12 (0.7%) | 21 (1.3%) |
| $45,000 to $49,999 | 55 (3.2%) | 76 (4.9%) |
| $50,000 to $54,999 | 84 (4.9%) | 27 (1.7%) |
| $55,000 to $64,999 | 103 (6.0%) | 149 (9.5%) |
| $65,000 to $74,999 | 110 (6.4%) | 46 (2.9%) |
| $75,000 to $99,999 | 285 (16.5%) | 198 (12.7%) |
| $100,000+ | 633 (36.6%) | 265 (16.9%) |
| Total | 1,727 (100.0%) | 1,564 (100.0%) |
Earnings by Sex by Educational Attainment in Islip Terrace
Average earnings in Islip Terrace are $82,483 for men and $53,657 for women, a difference of 34.9%. Men with an educational attainment of bachelor's degree enjoy the highest average annual earnings of $103,036, while those with college or associate's degree education earn the least with $71,188. Women with an educational attainment of graduate degree earn the most with the average annual earnings of $98,313, while those with less than high school education have the smallest earnings of $11,500.
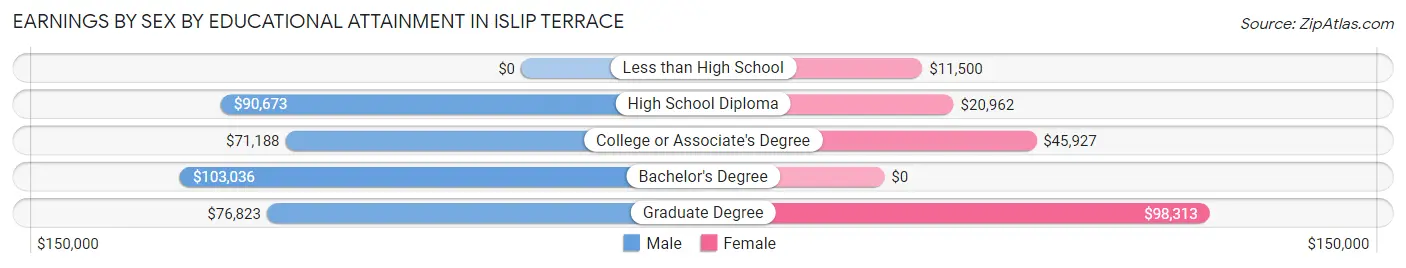
| Educational Attainment | Male Income | Female Income |
| Less than High School | - | - |
| High School Diploma | $90,673 | $20,962 |
| College or Associate's Degree | $71,188 | $45,927 |
| Bachelor's Degree | $103,036 | $0 |
| Graduate Degree | $76,823 | $98,313 |
| Total | $82,483 | $53,657 |
Family Income in Islip Terrace
Family Income Brackets in Islip Terrace
According to the Islip Terrace family income data, there are 354 families falling into the $150,000 to $199,999 income range, which is the most common income bracket and makes up 25.4% of all families.
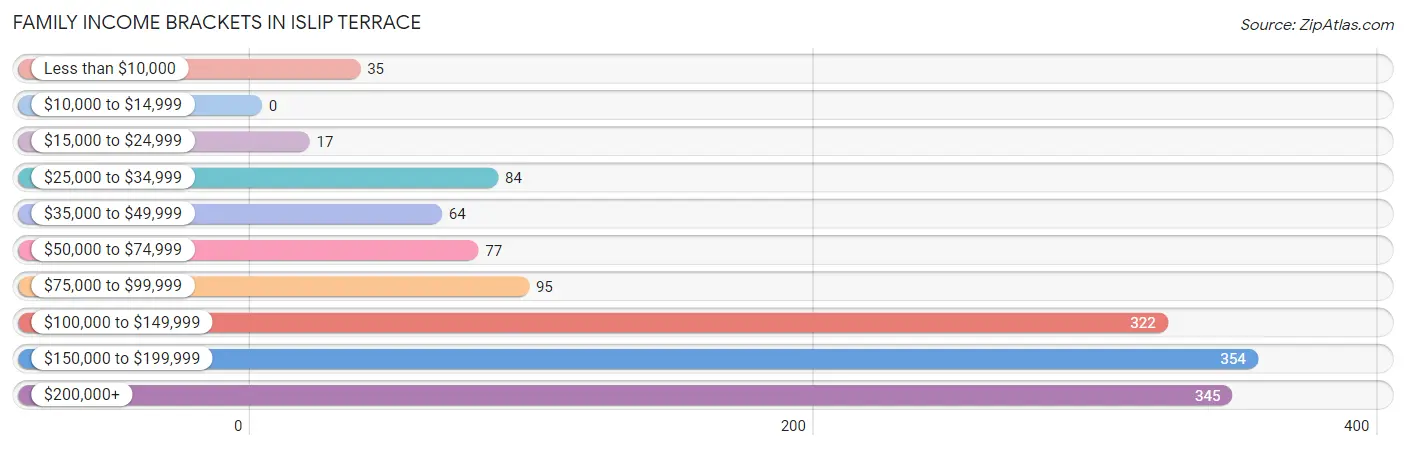
| Income Bracket | # Families | % Families |
| Less than $10,000 | 35 | 2.5% |
| $10,000 to $14,999 | 0 | 0.0% |
| $15,000 to $24,999 | 17 | 1.2% |
| $25,000 to $34,999 | 84 | 6.0% |
| $35,000 to $49,999 | 64 | 4.6% |
| $50,000 to $74,999 | 77 | 5.5% |
| $75,000 to $99,999 | 95 | 6.8% |
| $100,000 to $149,999 | 322 | 23.1% |
| $150,000 to $199,999 | 354 | 25.4% |
| $200,000+ | 345 | 24.8% |
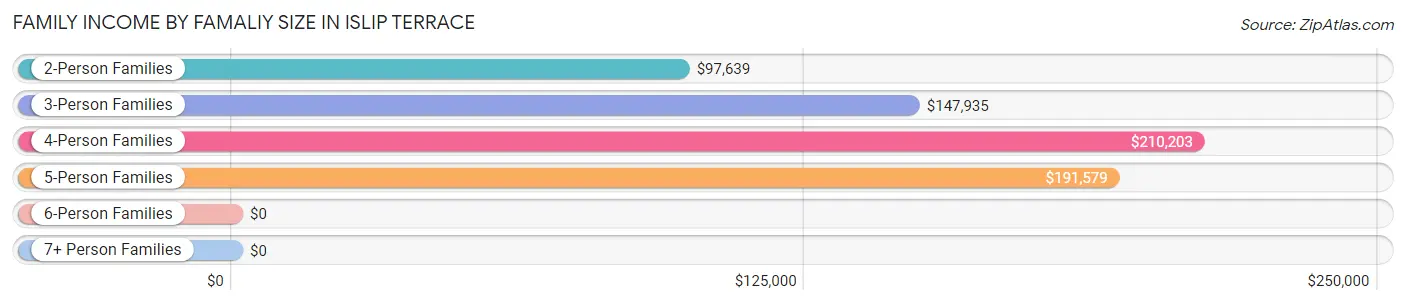
Family Income by Famaliy Size in Islip Terrace
4-person families (405 | 29.1%) account for the highest median family income in Islip Terrace with $210,203 per family, while 4-person families (405 | 29.1%) have the highest median income of $52,551 per family member.
| Income Bracket | # Families | Median Income |
| 2-Person Families | 415 (29.8%) | $97,639 |
| 3-Person Families | 466 (33.5%) | $147,935 |
| 4-Person Families | 405 (29.1%) | $210,203 |
| 5-Person Families | 106 (7.6%) | $191,579 |
| 6-Person Families | 0 (0.0%) | $0 |
| 7+ Person Families | 0 (0.0%) | $0 |
| Total | 1,392 (100.0%) | $152,697 |
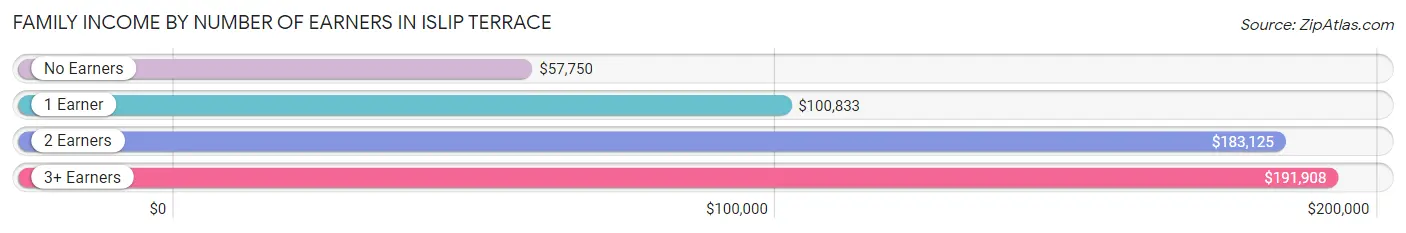
Family Income by Number of Earners in Islip Terrace
The median family income in Islip Terrace is $152,697, with families comprising 3+ earners (313) having the highest median family income of $191,908, while families with no earners (110) have the lowest median family income of $57,750, accounting for 22.5% and 7.9% of families, respectively.
| Number of Earners | # Families | Median Income |
| No Earners | 110 (7.9%) | $57,750 |
| 1 Earner | 276 (19.8%) | $100,833 |
| 2 Earners | 693 (49.8%) | $183,125 |
| 3+ Earners | 313 (22.5%) | $191,908 |
| Total | 1,392 (100.0%) | $152,697 |
Household Income in Islip Terrace
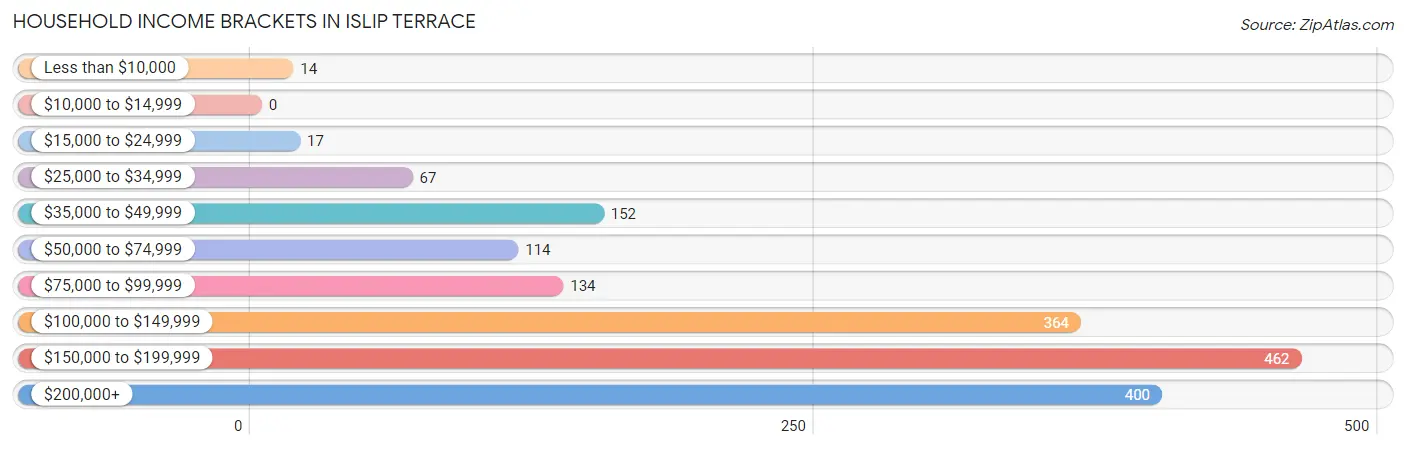
Household Income Brackets in Islip Terrace
With 462 households falling in the category, the $150,000 to $199,999 income range is the most frequent in Islip Terrace, accounting for 26.8% of all households.
| Income Bracket | # Households | % Households |
| Less than $10,000 | 14 | 0.8% |
| $10,000 to $14,999 | 0 | 0.0% |
| $15,000 to $24,999 | 17 | 1.0% |
| $25,000 to $34,999 | 67 | 3.9% |
| $35,000 to $49,999 | 152 | 8.8% |
| $50,000 to $74,999 | 114 | 6.6% |
| $75,000 to $99,999 | 134 | 7.8% |
| $100,000 to $149,999 | 364 | 21.1% |
| $150,000 to $199,999 | 462 | 26.8% |
| $200,000+ | 400 | 23.2% |
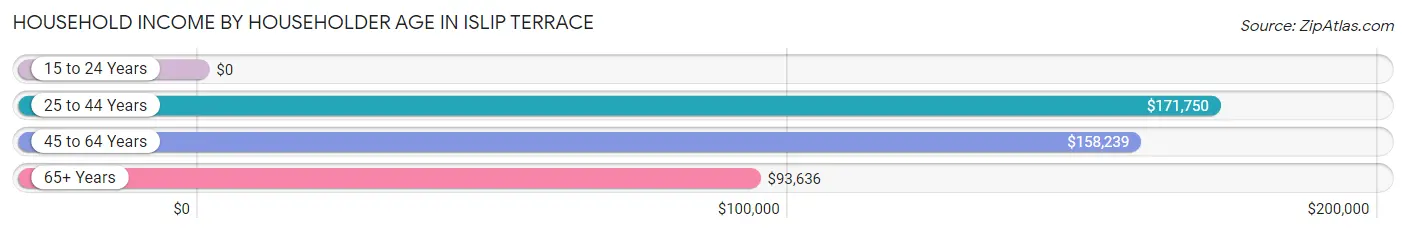
Household Income by Householder Age in Islip Terrace
The median household income in Islip Terrace is $149,946, with the highest median household income of $171,750 found in the 25 to 44 years age bracket for the primary householder. A total of 494 households (28.7%) fall into this category. Meanwhile, the 15 to 24 years age bracket for the primary householder has the lowest median household income of $0, with 7 households (0.4%) in this group.
| Income Bracket | # Households | Median Income |
| 15 to 24 Years | 7 (0.4%) | $0 |
| 25 to 44 Years | 494 (28.7%) | $171,750 |
| 45 to 64 Years | 742 (43.1%) | $158,239 |
| 65+ Years | 480 (27.9%) | $93,636 |
| Total | 1,723 (100.0%) | $149,946 |
Poverty in Islip Terrace
Income Below Poverty by Sex and Age in Islip Terrace
With 3.6% poverty level for males and 4.5% for females among the residents of Islip Terrace, 12 to 14 year old males and 25 to 34 year old females are the most vulnerable to poverty, with 37 males (33.6%) and 53 females (19.1%) in their respective age groups living below the poverty level.
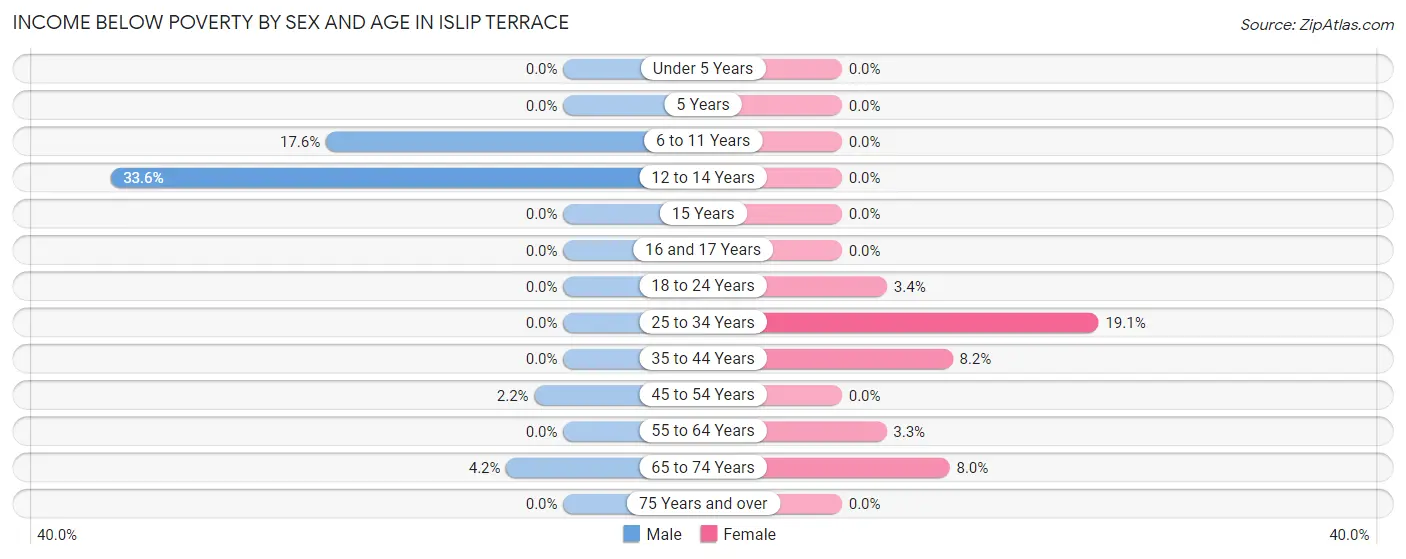
| Age Bracket | Male | Female |
| Under 5 Years | 0 (0.0%) | 0 (0.0%) |
| 5 Years | 0 (0.0%) | 0 (0.0%) |
| 6 to 11 Years | 37 (17.6%) | 0 (0.0%) |
| 12 to 14 Years | 37 (33.6%) | 0 (0.0%) |
| 15 Years | 0 (0.0%) | 0 (0.0%) |
| 16 and 17 Years | 0 (0.0%) | 0 (0.0%) |
| 18 to 24 Years | 0 (0.0%) | 7 (3.4%) |
| 25 to 34 Years | 0 (0.0%) | 53 (19.1%) |
| 35 to 44 Years | 0 (0.0%) | 35 (8.2%) |
| 45 to 54 Years | 8 (2.1%) | 0 (0.0%) |
| 55 to 64 Years | 0 (0.0%) | 12 (3.3%) |
| 65 to 74 Years | 12 (4.2%) | 12 (8.0%) |
| 75 Years and over | 0 (0.0%) | 0 (0.0%) |
| Total | 94 (3.6%) | 119 (4.5%) |
Income Above Poverty by Sex and Age in Islip Terrace
According to the poverty statistics in Islip Terrace, males aged under 5 years and females aged under 5 years are the age groups that are most secure financially, with 100.0% of males and 100.0% of females in these age groups living above the poverty line.
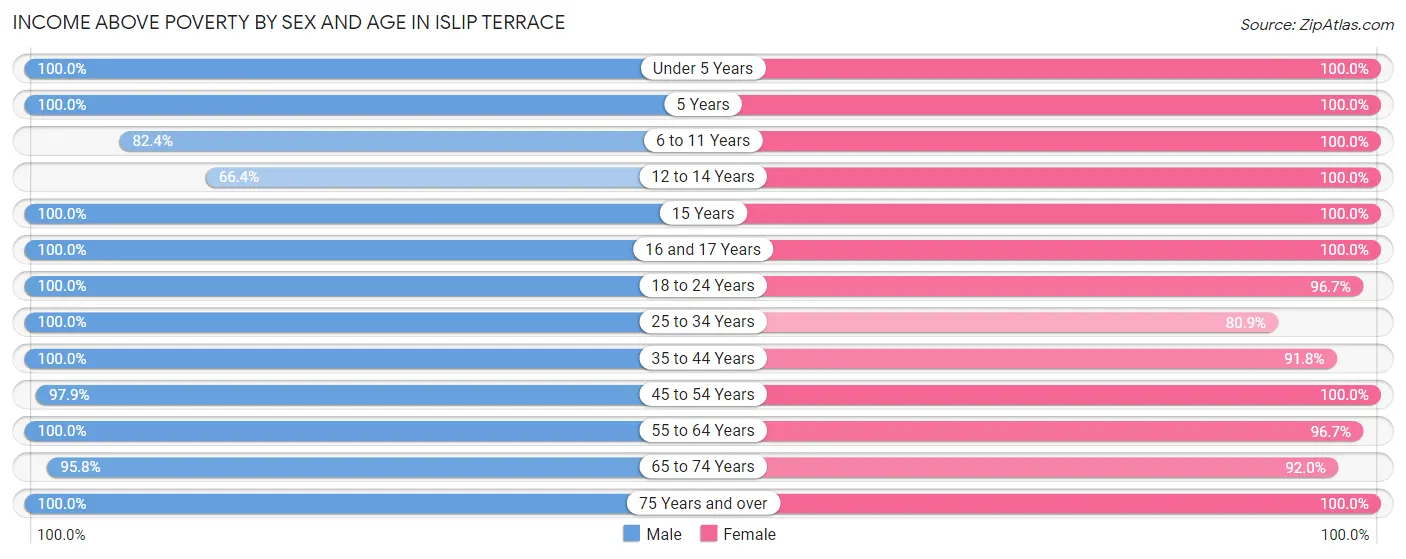
| Age Bracket | Male | Female |
| Under 5 Years | 84 (100.0%) | 196 (100.0%) |
| 5 Years | 54 (100.0%) | 19 (100.0%) |
| 6 to 11 Years | 173 (82.4%) | 222 (100.0%) |
| 12 to 14 Years | 73 (66.4%) | 69 (100.0%) |
| 15 Years | 19 (100.0%) | 31 (100.0%) |
| 16 and 17 Years | 40 (100.0%) | 43 (100.0%) |
| 18 to 24 Years | 259 (100.0%) | 202 (96.7%) |
| 25 to 34 Years | 404 (100.0%) | 225 (80.9%) |
| 35 to 44 Years | 333 (100.0%) | 391 (91.8%) |
| 45 to 54 Years | 364 (97.9%) | 466 (100.0%) |
| 55 to 64 Years | 361 (100.0%) | 350 (96.7%) |
| 65 to 74 Years | 272 (95.8%) | 138 (92.0%) |
| 75 Years and over | 78 (100.0%) | 187 (100.0%) |
| Total | 2,514 (96.4%) | 2,539 (95.5%) |
Income Below Poverty Among Married-Couple Families in Islip Terrace
The poverty statistics for married-couple families in Islip Terrace show that 1.1% or 12 of the total 1,094 families live below the poverty line. Families with no children have the highest poverty rate of 2.1%, comprising of 12 families. On the other hand, families with 1 or 2 children have the lowest poverty rate of 0.0%, which includes 0 families.
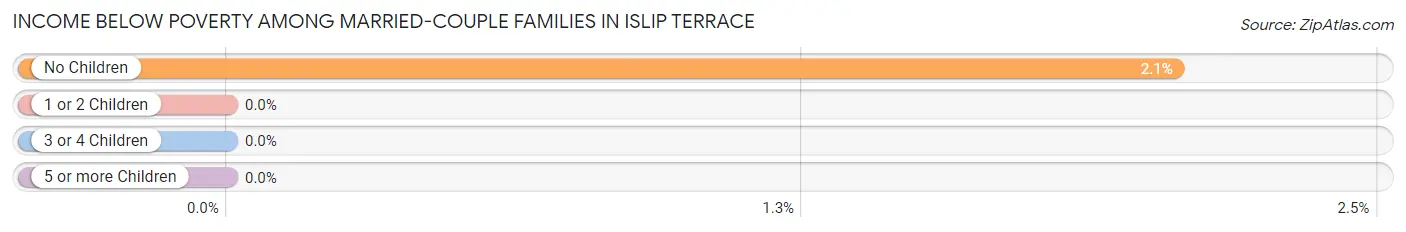
| Children | Above Poverty | Below Poverty |
| No Children | 570 (97.9%) | 12 (2.1%) |
| 1 or 2 Children | 470 (100.0%) | 0 (0.0%) |
| 3 or 4 Children | 42 (100.0%) | 0 (0.0%) |
| 5 or more Children | 0 (0.0%) | 0 (0.0%) |
| Total | 1,082 (98.9%) | 12 (1.1%) |
Income Below Poverty Among Single-Parent Households in Islip Terrace
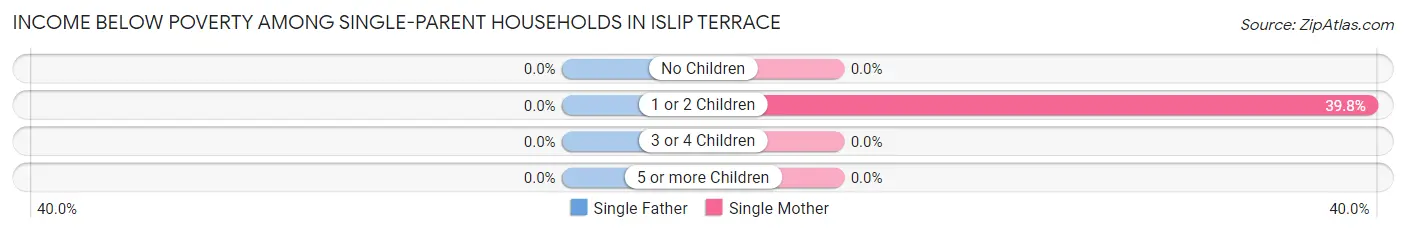
| Children | Single Father | Single Mother |
| No Children | 0 (0.0%) | 0 (0.0%) |
| 1 or 2 Children | 0 (0.0%) | 35 (39.8%) |
| 3 or 4 Children | 0 (0.0%) | 0 (0.0%) |
| 5 or more Children | 0 (0.0%) | 0 (0.0%) |
| Total | 0 (0.0%) | 35 (16.8%) |
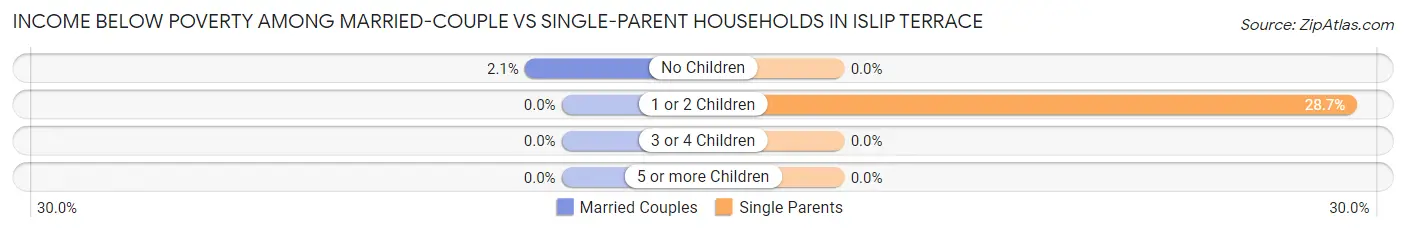
Income Below Poverty Among Married-Couple vs Single-Parent Households in Islip Terrace
The poverty data for Islip Terrace shows that 12 of the married-couple family households (1.1%) and 35 of the single-parent households (11.7%) are living below the poverty level. Within the married-couple family households, those with no children have the highest poverty rate, with 12 households (2.1%) falling below the poverty line. Among the single-parent households, those with 1 or 2 children have the highest poverty rate, with 35 household (28.7%) living below poverty.
| Children | Married-Couple Families | Single-Parent Households |
| No Children | 12 (2.1%) | 0 (0.0%) |
| 1 or 2 Children | 0 (0.0%) | 35 (28.7%) |
| 3 or 4 Children | 0 (0.0%) | 0 (0.0%) |
| 5 or more Children | 0 (0.0%) | 0 (0.0%) |
| Total | 12 (1.1%) | 35 (11.7%) |
Employment Characteristics in Islip Terrace
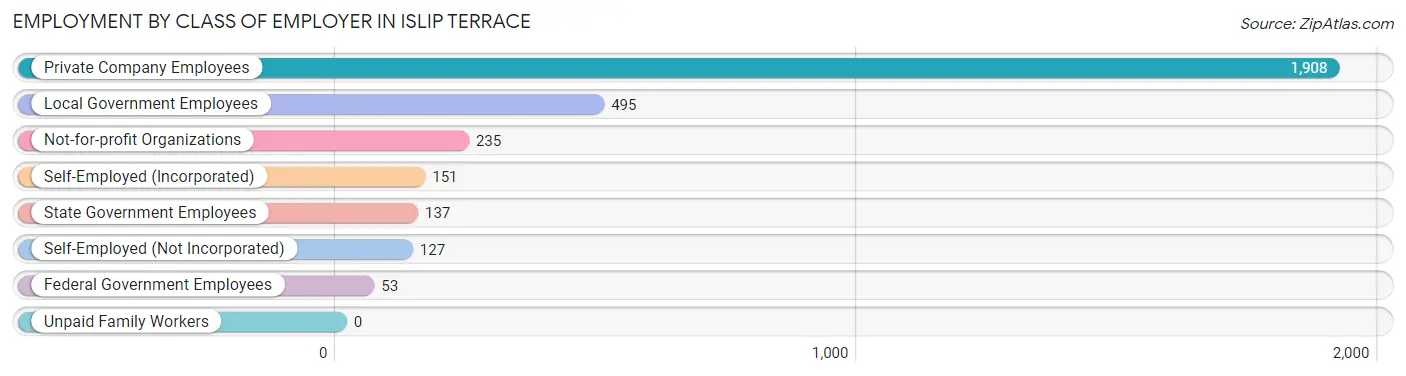
Employment by Class of Employer in Islip Terrace
Among the 3,106 employed individuals in Islip Terrace, private company employees (1,908 | 61.4%), local government employees (495 | 15.9%), and not-for-profit organizations (235 | 7.6%) make up the most common classes of employment.
| Employer Class | # Employees | % Employees |
| Private Company Employees | 1,908 | 61.4% |
| Self-Employed (Incorporated) | 151 | 4.9% |
| Self-Employed (Not Incorporated) | 127 | 4.1% |
| Not-for-profit Organizations | 235 | 7.6% |
| Local Government Employees | 495 | 15.9% |
| State Government Employees | 137 | 4.4% |
| Federal Government Employees | 53 | 1.7% |
| Unpaid Family Workers | 0 | 0.0% |
| Total | 3,106 | 100.0% |
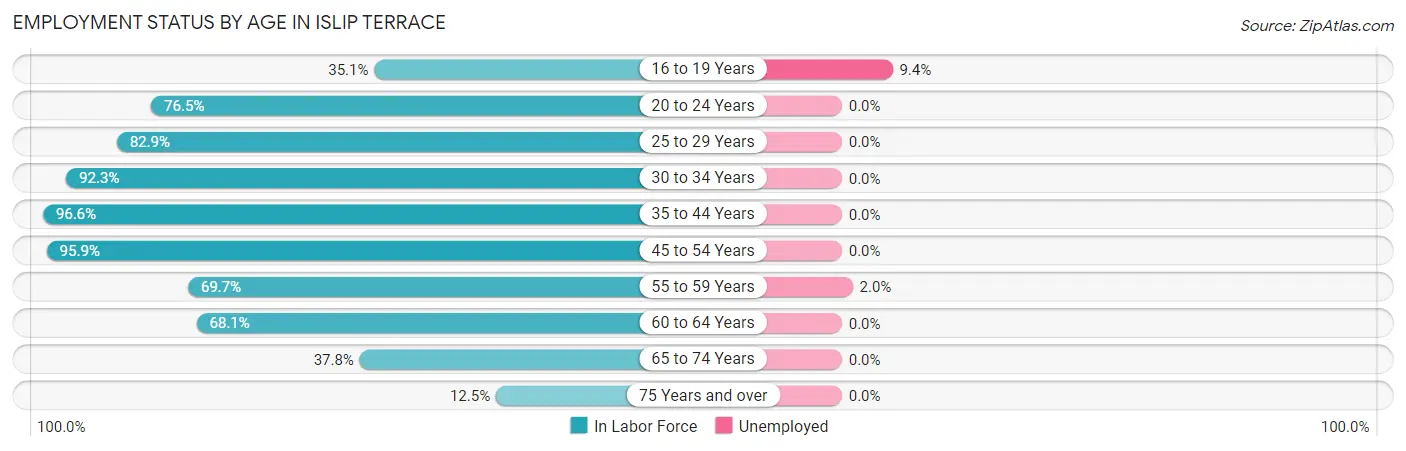
Employment Status by Age in Islip Terrace
According to the labor force statistics for Islip Terrace, out of the total population over 16 years of age (4,252), 75.0% or 3,189 individuals are in the labor force, with 0.3% or 10 of them unemployed. The age group with the highest labor force participation rate is 35 to 44 years, with 96.6% or 733 individuals in the labor force. Within the labor force, the 16 to 19 years age range has the highest percentage of unemployed individuals, with 9.4% or 5 of them being unemployed.
| Age Bracket | In Labor Force | Unemployed |
| 16 to 19 Years | 53 (35.1%) | 5 (9.4%) |
| 20 to 24 Years | 306 (76.5%) | 0 (0.0%) |
| 25 to 29 Years | 286 (82.9%) | 0 (0.0%) |
| 30 to 34 Years | 311 (92.3%) | 0 (0.0%) |
| 35 to 44 Years | 733 (96.6%) | 0 (0.0%) |
| 45 to 54 Years | 804 (95.9%) | 0 (0.0%) |
| 55 to 59 Years | 246 (69.7%) | 5 (2.0%) |
| 60 to 64 Years | 252 (68.1%) | 0 (0.0%) |
| 65 to 74 Years | 164 (37.8%) | 0 (0.0%) |
| 75 Years and over | 33 (12.5%) | 0 (0.0%) |
| Total | 3,189 (75.0%) | 10 (0.3%) |
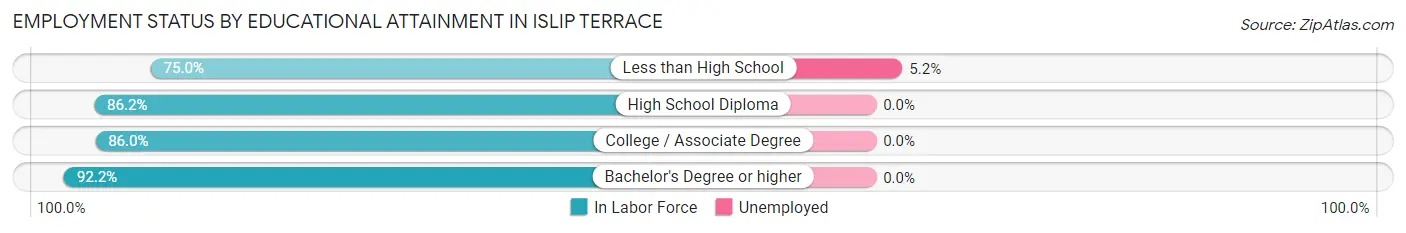
Employment Status by Educational Attainment in Islip Terrace
According to labor force statistics for Islip Terrace, 87.7% of individuals (2,633) out of the total population between 25 and 64 years of age (3,002) are in the labor force, with 0.2% or 5 of them being unemployed. The group with the highest labor force participation rate are those with the educational attainment of bachelor's degree or higher, with 92.2% or 924 individuals in the labor force. Within the labor force, individuals with less than high school education have the highest percentage of unemployment, with 5.2% or 5 of them being unemployed.
| Educational Attainment | In Labor Force | Unemployed |
| Less than High School | 96 (75.0%) | 7 (5.2%) |
| High School Diploma | 739 (86.2%) | 0 (0.0%) |
| College / Associate Degree | 873 (86.0%) | 0 (0.0%) |
| Bachelor's Degree or higher | 924 (92.2%) | 0 (0.0%) |
| Total | 2,633 (87.7%) | 6 (0.2%) |
Employment Occupations by Sex in Islip Terrace
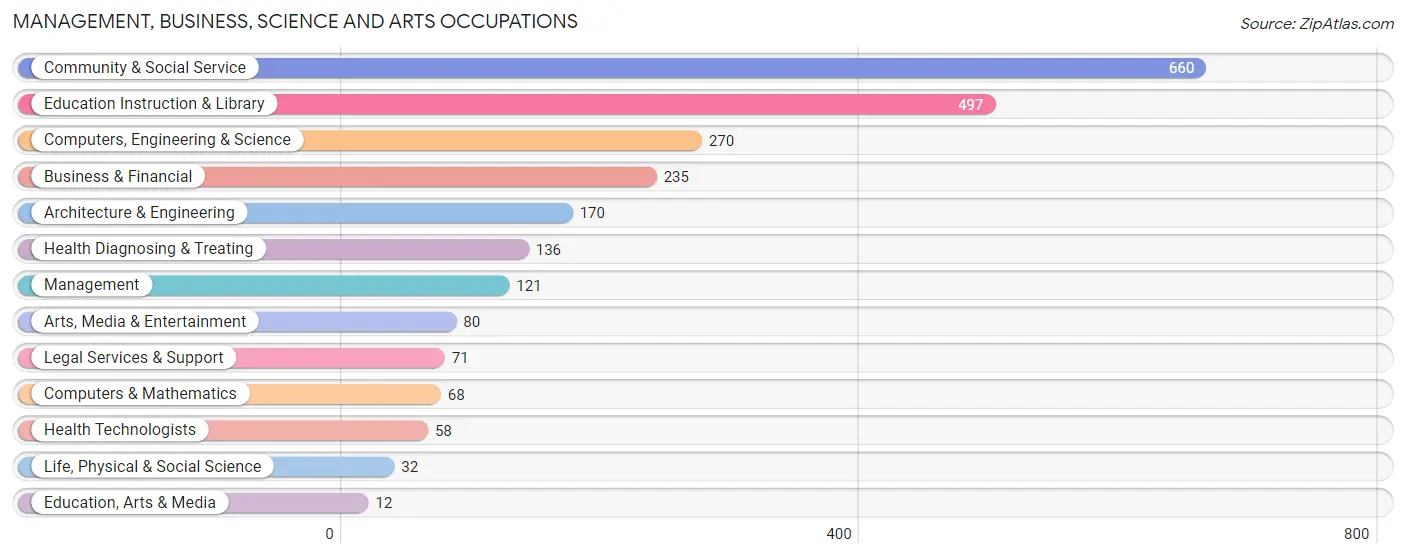
Management, Business, Science and Arts Occupations
The most common Management, Business, Science and Arts occupations in Islip Terrace are Community & Social Service (660 | 20.8%), Education Instruction & Library (497 | 15.6%), Computers, Engineering & Science (270 | 8.5%), Business & Financial (235 | 7.4%), and Architecture & Engineering (170 | 5.3%).
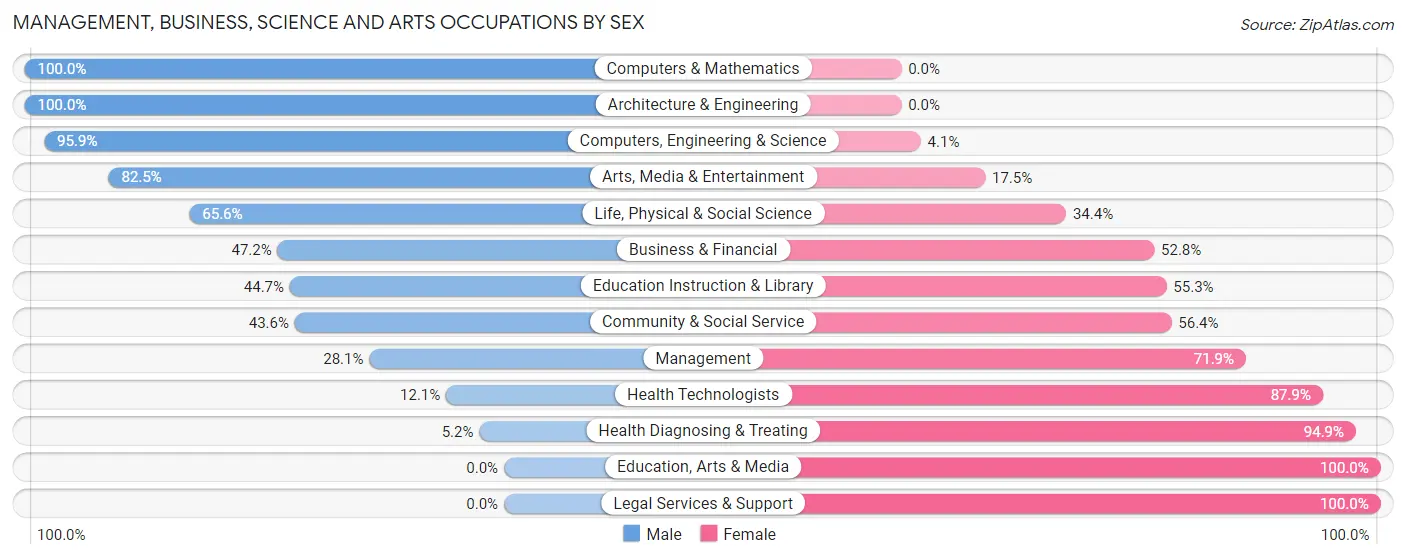
Management, Business, Science and Arts Occupations by Sex
Within the Management, Business, Science and Arts occupations in Islip Terrace, the most male-oriented occupations are Computers & Mathematics (100.0%), Architecture & Engineering (100.0%), and Computers, Engineering & Science (95.9%), while the most female-oriented occupations are Education, Arts & Media (100.0%), Legal Services & Support (100.0%), and Health Diagnosing & Treating (94.9%).
| Occupation | Male | Female |
| Management | 34 (28.1%) | 87 (71.9%) |
| Business & Financial | 111 (47.2%) | 124 (52.8%) |
| Computers, Engineering & Science | 259 (95.9%) | 11 (4.1%) |
| Computers & Mathematics | 68 (100.0%) | 0 (0.0%) |
| Architecture & Engineering | 170 (100.0%) | 0 (0.0%) |
| Life, Physical & Social Science | 21 (65.6%) | 11 (34.4%) |
| Community & Social Service | 288 (43.6%) | 372 (56.4%) |
| Education, Arts & Media | 0 (0.0%) | 12 (100.0%) |
| Legal Services & Support | 0 (0.0%) | 71 (100.0%) |
| Education Instruction & Library | 222 (44.7%) | 275 (55.3%) |
| Arts, Media & Entertainment | 66 (82.5%) | 14 (17.5%) |
| Health Diagnosing & Treating | 7 (5.1%) | 129 (94.9%) |
| Health Technologists | 7 (12.1%) | 51 (87.9%) |
| Total (Category) | 699 (49.2%) | 723 (50.8%) |
| Total (Overall) | 1,697 (53.4%) | 1,481 (46.6%) |
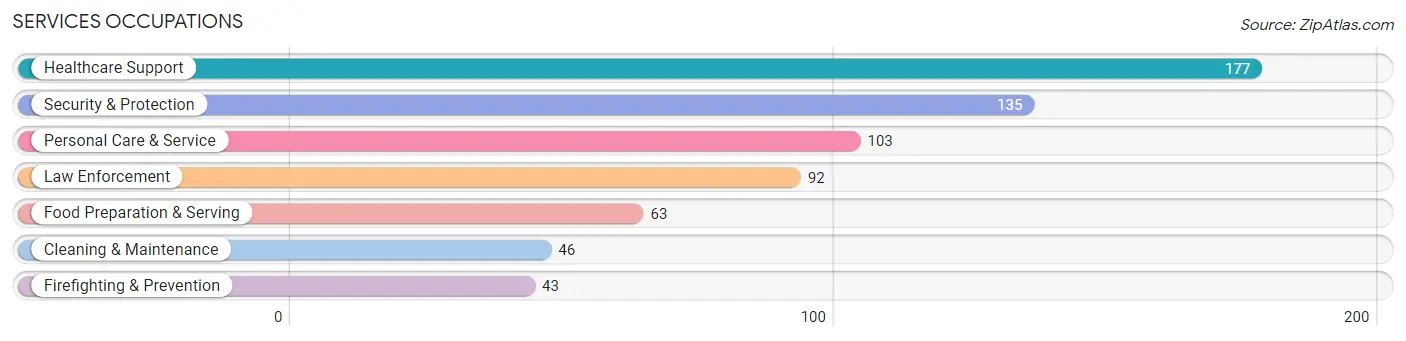
Services Occupations
The most common Services occupations in Islip Terrace are Healthcare Support (177 | 5.6%), Security & Protection (135 | 4.3%), Personal Care & Service (103 | 3.2%), Law Enforcement (92 | 2.9%), and Food Preparation & Serving (63 | 2.0%).
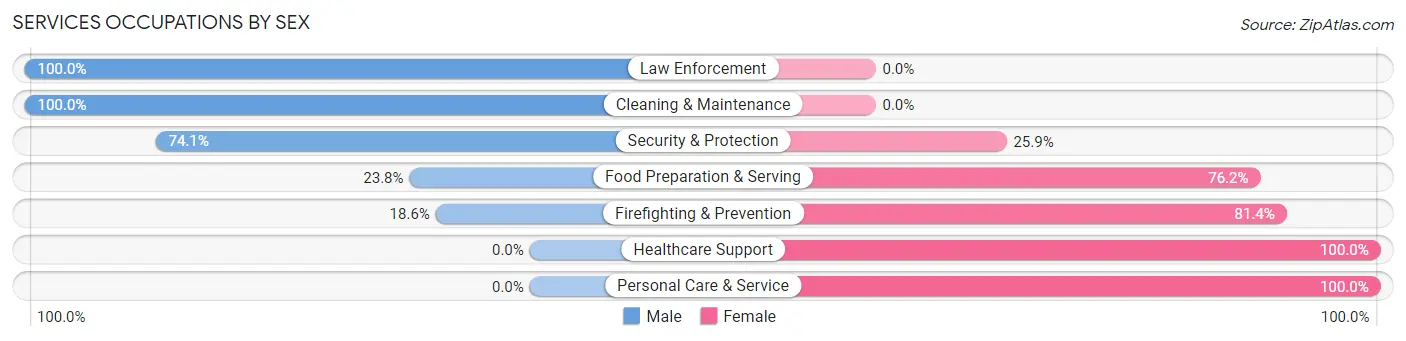
Services Occupations by Sex
Within the Services occupations in Islip Terrace, the most male-oriented occupations are Law Enforcement (100.0%), Cleaning & Maintenance (100.0%), and Security & Protection (74.1%), while the most female-oriented occupations are Healthcare Support (100.0%), Personal Care & Service (100.0%), and Firefighting & Prevention (81.4%).
| Occupation | Male | Female |
| Healthcare Support | 0 (0.0%) | 177 (100.0%) |
| Security & Protection | 100 (74.1%) | 35 (25.9%) |
| Firefighting & Prevention | 8 (18.6%) | 35 (81.4%) |
| Law Enforcement | 92 (100.0%) | 0 (0.0%) |
| Food Preparation & Serving | 15 (23.8%) | 48 (76.2%) |
| Cleaning & Maintenance | 46 (100.0%) | 0 (0.0%) |
| Personal Care & Service | 0 (0.0%) | 103 (100.0%) |
| Total (Category) | 161 (30.7%) | 363 (69.3%) |
| Total (Overall) | 1,697 (53.4%) | 1,481 (46.6%) |
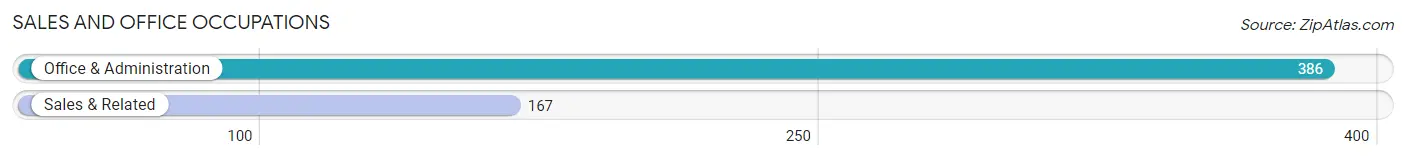
Sales and Office Occupations
The most common Sales and Office occupations in Islip Terrace are Office & Administration (386 | 12.1%), and Sales & Related (167 | 5.2%).
Sales and Office Occupations by Sex
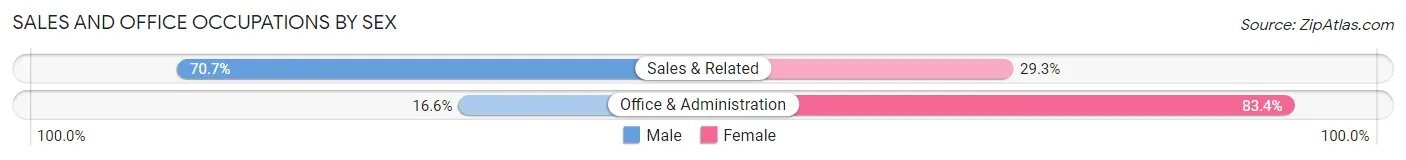
| Occupation | Male | Female |
| Sales & Related | 118 (70.7%) | 49 (29.3%) |
| Office & Administration | 64 (16.6%) | 322 (83.4%) |
| Total (Category) | 182 (32.9%) | 371 (67.1%) |
| Total (Overall) | 1,697 (53.4%) | 1,481 (46.6%) |
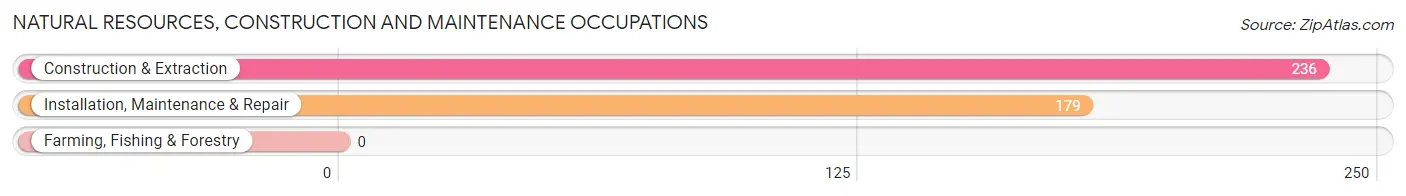
Natural Resources, Construction and Maintenance Occupations
The most common Natural Resources, Construction and Maintenance occupations in Islip Terrace are Construction & Extraction (236 | 7.4%), and Installation, Maintenance & Repair (179 | 5.6%).
Natural Resources, Construction and Maintenance Occupations by Sex
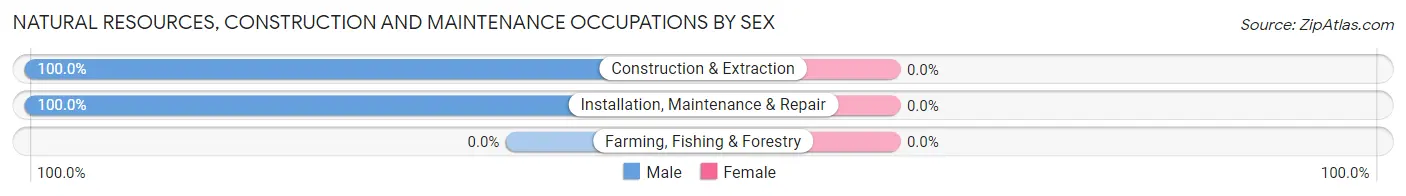
| Occupation | Male | Female |
| Farming, Fishing & Forestry | 0 (0.0%) | 0 (0.0%) |
| Construction & Extraction | 236 (100.0%) | 0 (0.0%) |
| Installation, Maintenance & Repair | 179 (100.0%) | 0 (0.0%) |
| Total (Category) | 415 (100.0%) | 0 (0.0%) |
| Total (Overall) | 1,697 (53.4%) | 1,481 (46.6%) |
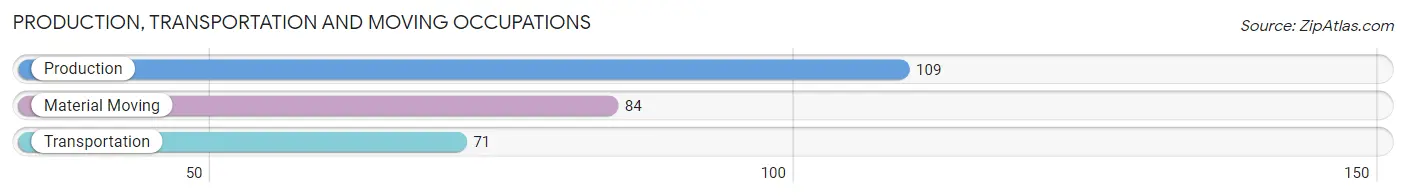
Production, Transportation and Moving Occupations
The most common Production, Transportation and Moving occupations in Islip Terrace are Production (109 | 3.4%), Material Moving (84 | 2.6%), and Transportation (71 | 2.2%).
Production, Transportation and Moving Occupations by Sex
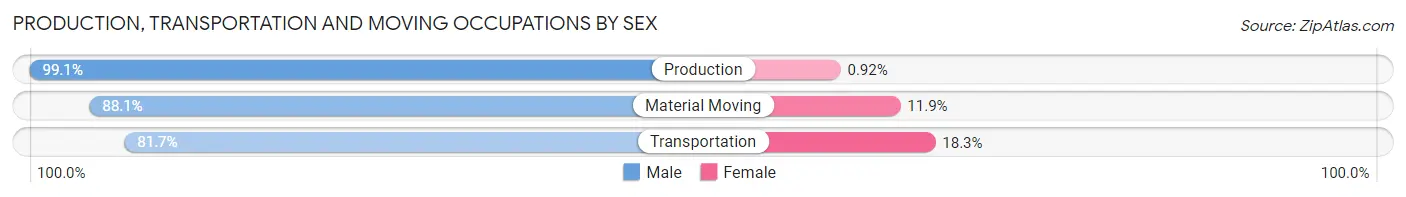
| Occupation | Male | Female |
| Production | 108 (99.1%) | 1 (0.9%) |
| Transportation | 58 (81.7%) | 13 (18.3%) |
| Material Moving | 74 (88.1%) | 10 (11.9%) |
| Total (Category) | 240 (90.9%) | 24 (9.1%) |
| Total (Overall) | 1,697 (53.4%) | 1,481 (46.6%) |
Employment Industries by Sex in Islip Terrace
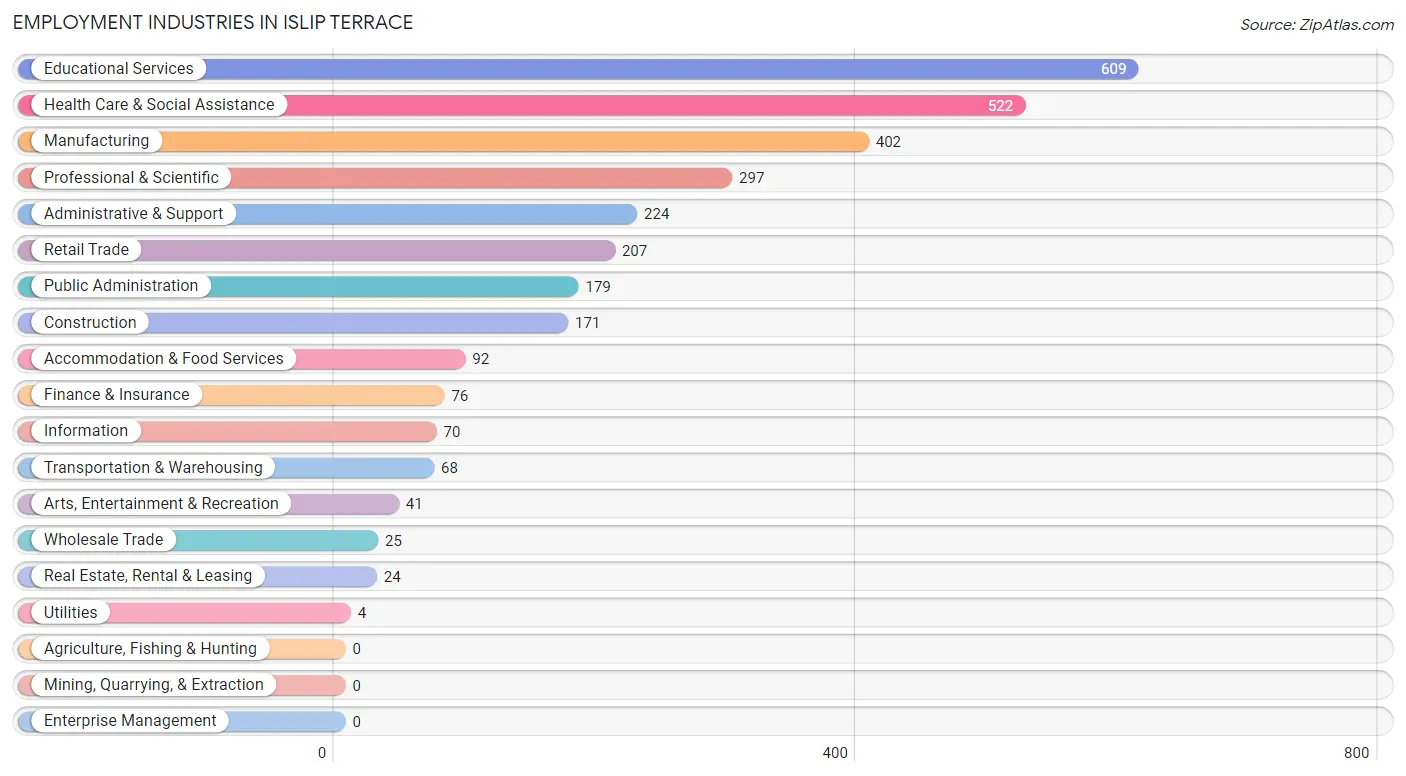
Employment Industries in Islip Terrace
The major employment industries in Islip Terrace include Educational Services (609 | 19.2%), Health Care & Social Assistance (522 | 16.4%), Manufacturing (402 | 12.7%), Professional & Scientific (297 | 9.3%), and Administrative & Support (224 | 7.0%).
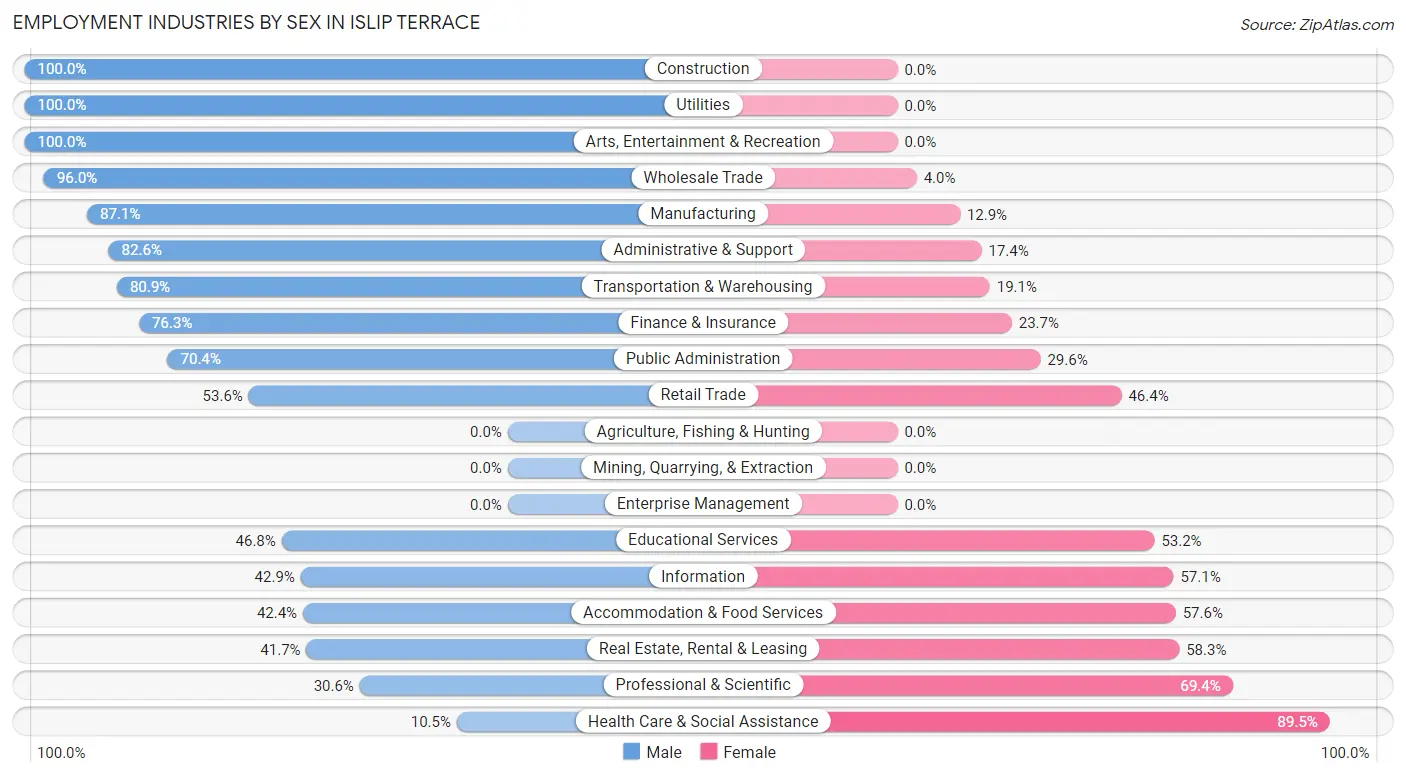
Employment Industries by Sex in Islip Terrace
The Islip Terrace industries that see more men than women are Construction (100.0%), Utilities (100.0%), and Arts, Entertainment & Recreation (100.0%), whereas the industries that tend to have a higher number of women are Health Care & Social Assistance (89.5%), Professional & Scientific (69.4%), and Real Estate, Rental & Leasing (58.3%).
| Industry | Male | Female |
| Agriculture, Fishing & Hunting | 0 (0.0%) | 0 (0.0%) |
| Mining, Quarrying, & Extraction | 0 (0.0%) | 0 (0.0%) |
| Construction | 171 (100.0%) | 0 (0.0%) |
| Manufacturing | 350 (87.1%) | 52 (12.9%) |
| Wholesale Trade | 24 (96.0%) | 1 (4.0%) |
| Retail Trade | 111 (53.6%) | 96 (46.4%) |
| Transportation & Warehousing | 55 (80.9%) | 13 (19.1%) |
| Utilities | 4 (100.0%) | 0 (0.0%) |
| Information | 30 (42.9%) | 40 (57.1%) |
| Finance & Insurance | 58 (76.3%) | 18 (23.7%) |
| Real Estate, Rental & Leasing | 10 (41.7%) | 14 (58.3%) |
| Professional & Scientific | 91 (30.6%) | 206 (69.4%) |
| Enterprise Management | 0 (0.0%) | 0 (0.0%) |
| Administrative & Support | 185 (82.6%) | 39 (17.4%) |
| Educational Services | 285 (46.8%) | 324 (53.2%) |
| Health Care & Social Assistance | 55 (10.5%) | 467 (89.5%) |
| Arts, Entertainment & Recreation | 41 (100.0%) | 0 (0.0%) |
| Accommodation & Food Services | 39 (42.4%) | 53 (57.6%) |
| Public Administration | 126 (70.4%) | 53 (29.6%) |
| Total | 1,697 (53.4%) | 1,481 (46.6%) |
Education in Islip Terrace
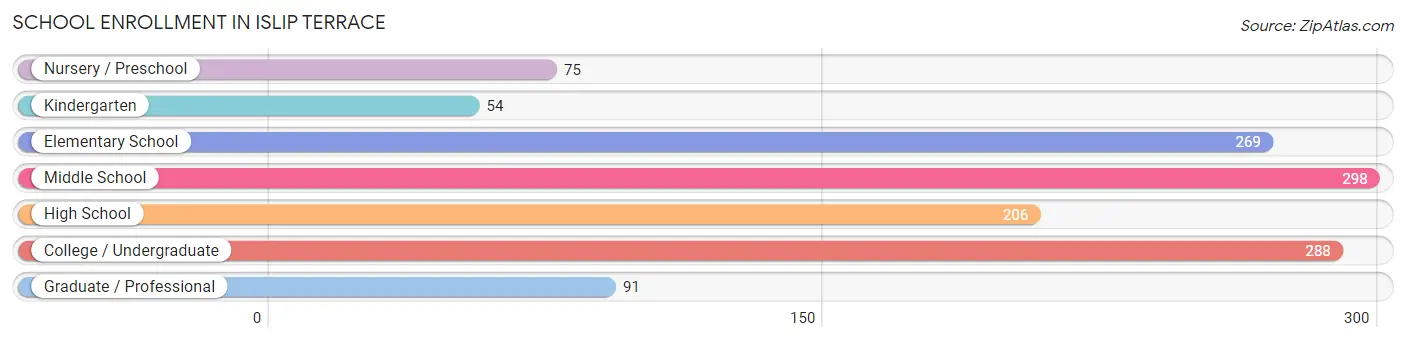
School Enrollment in Islip Terrace
The most common levels of schooling among the 1,281 students in Islip Terrace are middle school (298 | 23.3%), college / undergraduate (288 | 22.5%), and elementary school (269 | 21.0%).
| School Level | # Students | % Students |
| Nursery / Preschool | 75 | 5.9% |
| Kindergarten | 54 | 4.2% |
| Elementary School | 269 | 21.0% |
| Middle School | 298 | 23.3% |
| High School | 206 | 16.1% |
| College / Undergraduate | 288 | 22.5% |
| Graduate / Professional | 91 | 7.1% |
| Total | 1,281 | 100.0% |
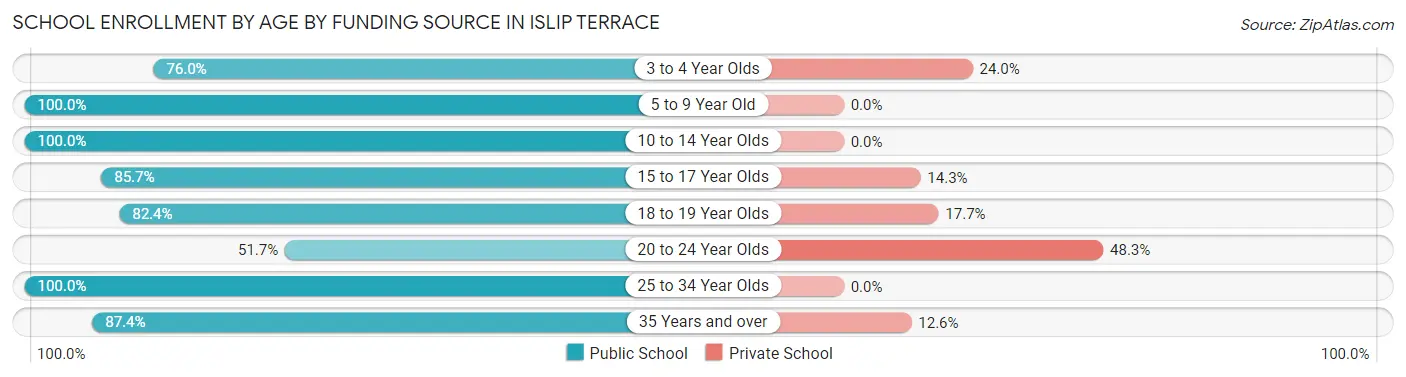
School Enrollment by Age by Funding Source in Islip Terrace
Out of a total of 1,281 students who are enrolled in schools in Islip Terrace, 164 (12.8%) attend a private institution, while the remaining 1,117 (87.2%) are enrolled in public schools. The age group of 20 to 24 year olds has the highest likelihood of being enrolled in private schools, with 101 (48.3% in the age bracket) enrolled. Conversely, the age group of 5 to 9 year old has the lowest likelihood of being enrolled in a private school, with 305 (100.0% in the age bracket) attending a public institution.
| Age Bracket | Public School | Private School |
| 3 to 4 Year Olds | 57 (76.0%) | 18 (24.0%) |
| 5 to 9 Year Old | 305 (100.0%) | 0 (0.0%) |
| 10 to 14 Year Olds | 340 (100.0%) | 0 (0.0%) |
| 15 to 17 Year Olds | 114 (85.7%) | 19 (14.3%) |
| 18 to 19 Year Olds | 56 (82.4%) | 12 (17.6%) |
| 20 to 24 Year Olds | 108 (51.7%) | 101 (48.3%) |
| 25 to 34 Year Olds | 40 (100.0%) | 0 (0.0%) |
| 35 Years and over | 97 (87.4%) | 14 (12.6%) |
| Total | 1,117 (87.2%) | 164 (12.8%) |
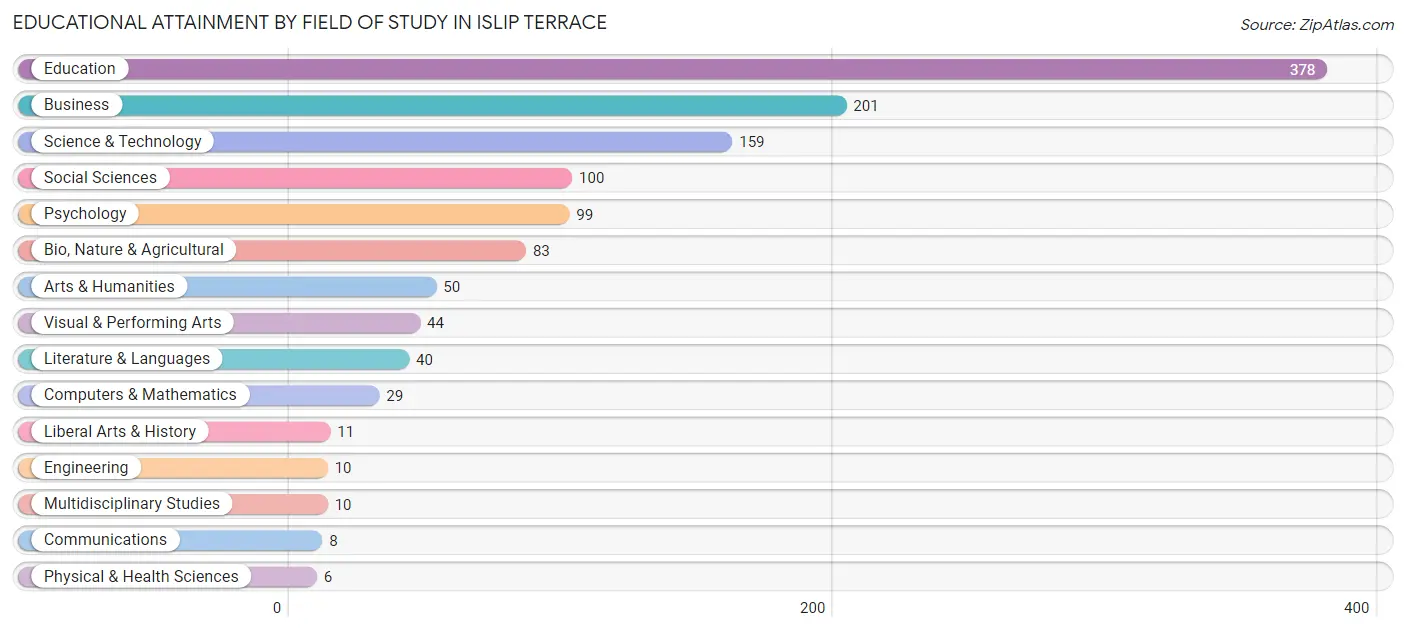
Educational Attainment by Field of Study in Islip Terrace
Education (378 | 30.8%), business (201 | 16.4%), science & technology (159 | 13.0%), social sciences (100 | 8.1%), and psychology (99 | 8.1%) are the most common fields of study among 1,228 individuals in Islip Terrace who have obtained a bachelor's degree or higher.
| Field of Study | # Graduates | % Graduates |
| Computers & Mathematics | 29 | 2.4% |
| Bio, Nature & Agricultural | 83 | 6.8% |
| Physical & Health Sciences | 6 | 0.5% |
| Psychology | 99 | 8.1% |
| Social Sciences | 100 | 8.1% |
| Engineering | 10 | 0.8% |
| Multidisciplinary Studies | 10 | 0.8% |
| Science & Technology | 159 | 13.0% |
| Business | 201 | 16.4% |
| Education | 378 | 30.8% |
| Literature & Languages | 40 | 3.3% |
| Liberal Arts & History | 11 | 0.9% |
| Visual & Performing Arts | 44 | 3.6% |
| Communications | 8 | 0.6% |
| Arts & Humanities | 50 | 4.1% |
| Total | 1,228 | 100.0% |
Transportation & Commute in Islip Terrace
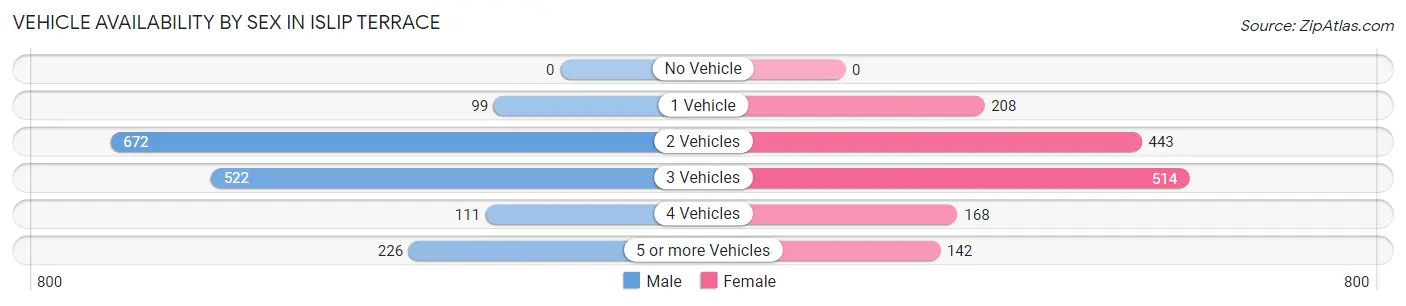
Vehicle Availability by Sex in Islip Terrace
The most prevalent vehicle ownership categories in Islip Terrace are males with 2 vehicles (672, accounting for 41.2%) and females with 2 vehicles (443, making up 45.6%).
| Vehicles Available | Male | Female |
| No Vehicle | 0 (0.0%) | 0 (0.0%) |
| 1 Vehicle | 99 (6.1%) | 208 (14.1%) |
| 2 Vehicles | 672 (41.2%) | 443 (30.0%) |
| 3 Vehicles | 522 (32.0%) | 514 (34.8%) |
| 4 Vehicles | 111 (6.8%) | 168 (11.4%) |
| 5 or more Vehicles | 226 (13.9%) | 142 (9.6%) |
| Total | 1,630 (100.0%) | 1,475 (100.0%) |
Commute Time in Islip Terrace
The most frequently occuring commute durations in Islip Terrace are 15 to 19 minutes (571 commuters, 19.6%), 10 to 14 minutes (552 commuters, 18.9%), and 20 to 24 minutes (437 commuters, 15.0%).
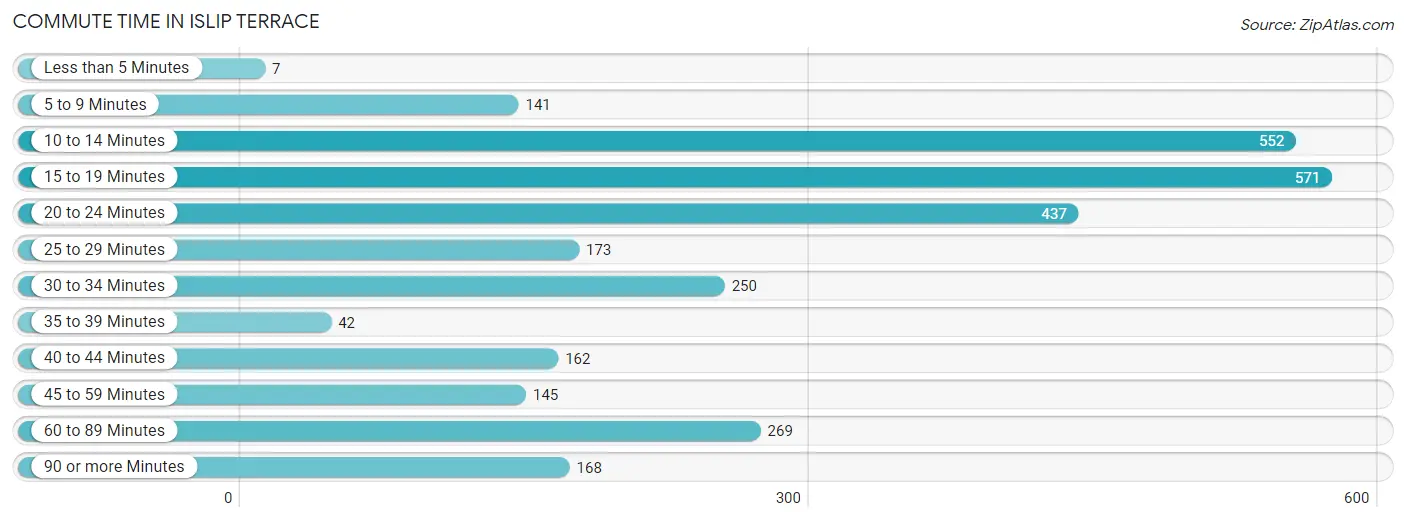
| Commute Time | # Commuters | % Commuters |
| Less than 5 Minutes | 7 | 0.2% |
| 5 to 9 Minutes | 141 | 4.8% |
| 10 to 14 Minutes | 552 | 18.9% |
| 15 to 19 Minutes | 571 | 19.6% |
| 20 to 24 Minutes | 437 | 15.0% |
| 25 to 29 Minutes | 173 | 5.9% |
| 30 to 34 Minutes | 250 | 8.6% |
| 35 to 39 Minutes | 42 | 1.4% |
| 40 to 44 Minutes | 162 | 5.6% |
| 45 to 59 Minutes | 145 | 5.0% |
| 60 to 89 Minutes | 269 | 9.2% |
| 90 or more Minutes | 168 | 5.8% |
Commute Time by Sex in Islip Terrace
The most common commute times in Islip Terrace are 10 to 14 minutes (407 commuters, 26.7%) for males and 15 to 19 minutes (414 commuters, 29.7%) for females.
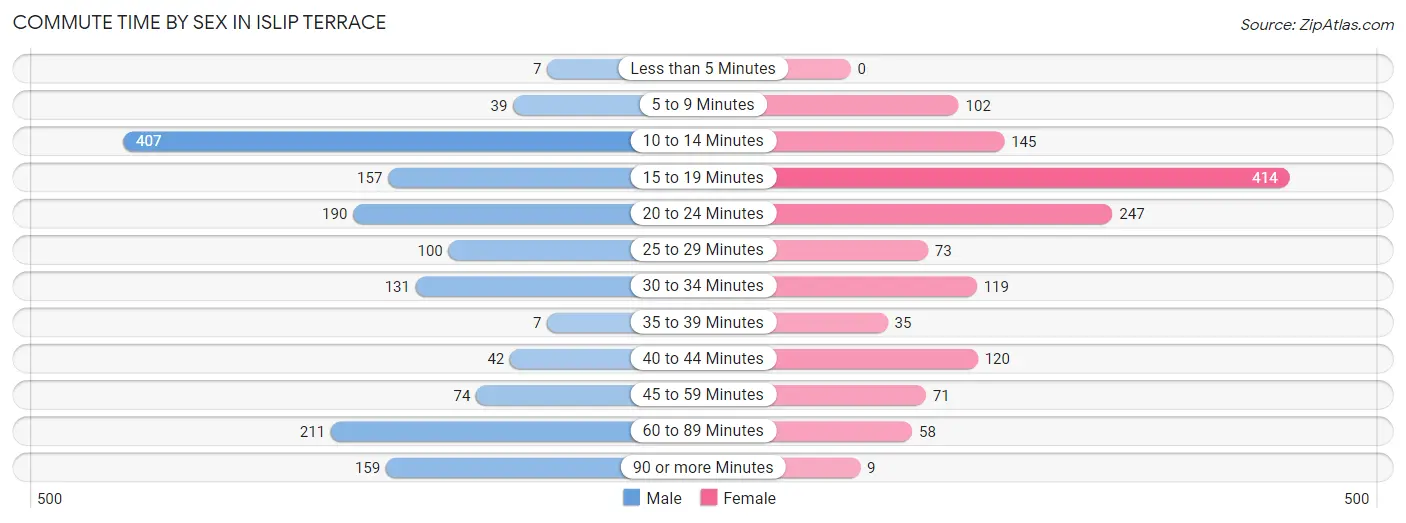
| Commute Time | Male | Female |
| Less than 5 Minutes | 7 (0.5%) | 0 (0.0%) |
| 5 to 9 Minutes | 39 (2.6%) | 102 (7.3%) |
| 10 to 14 Minutes | 407 (26.7%) | 145 (10.4%) |
| 15 to 19 Minutes | 157 (10.3%) | 414 (29.7%) |
| 20 to 24 Minutes | 190 (12.5%) | 247 (17.7%) |
| 25 to 29 Minutes | 100 (6.6%) | 73 (5.2%) |
| 30 to 34 Minutes | 131 (8.6%) | 119 (8.5%) |
| 35 to 39 Minutes | 7 (0.5%) | 35 (2.5%) |
| 40 to 44 Minutes | 42 (2.8%) | 120 (8.6%) |
| 45 to 59 Minutes | 74 (4.9%) | 71 (5.1%) |
| 60 to 89 Minutes | 211 (13.9%) | 58 (4.2%) |
| 90 or more Minutes | 159 (10.4%) | 9 (0.6%) |
Time of Departure to Work by Sex in Islip Terrace
The most frequent times of departure to work in Islip Terrace are 6:00 AM to 6:29 AM (257, 16.9%) for males and 8:00 AM to 8:29 AM (278, 20.0%) for females.
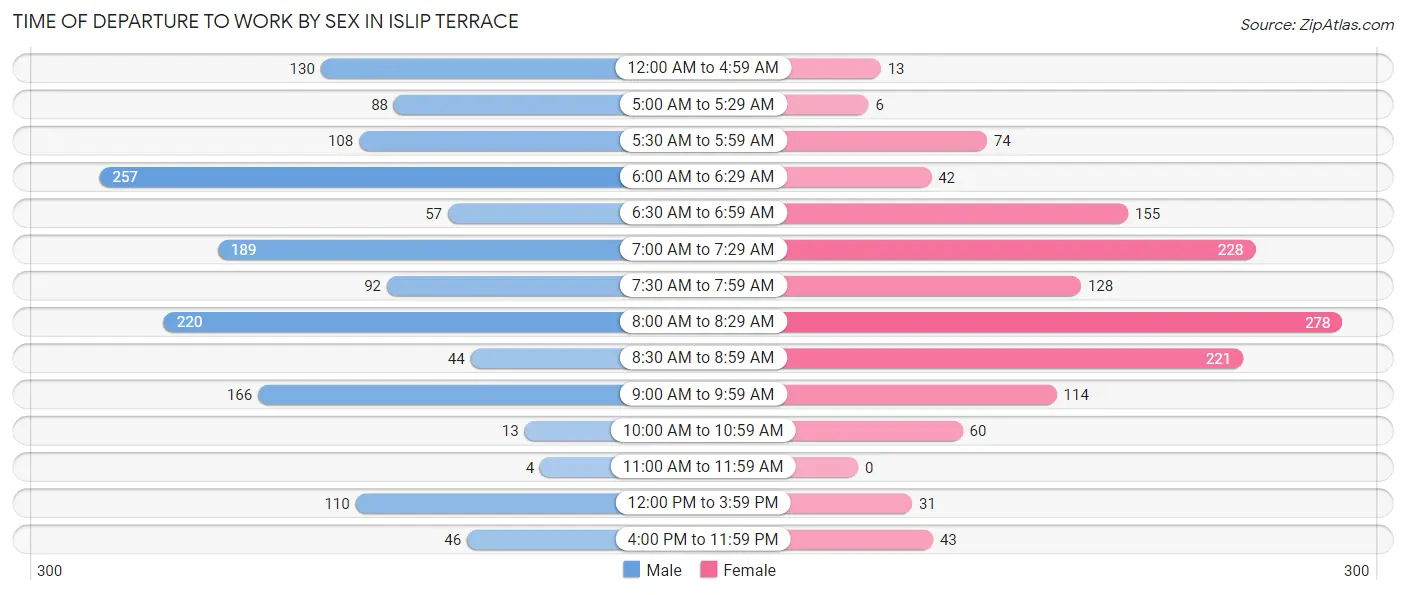
| Time of Departure | Male | Female |
| 12:00 AM to 4:59 AM | 130 (8.5%) | 13 (0.9%) |
| 5:00 AM to 5:29 AM | 88 (5.8%) | 6 (0.4%) |
| 5:30 AM to 5:59 AM | 108 (7.1%) | 74 (5.3%) |
| 6:00 AM to 6:29 AM | 257 (16.9%) | 42 (3.0%) |
| 6:30 AM to 6:59 AM | 57 (3.7%) | 155 (11.1%) |
| 7:00 AM to 7:29 AM | 189 (12.4%) | 228 (16.4%) |
| 7:30 AM to 7:59 AM | 92 (6.0%) | 128 (9.2%) |
| 8:00 AM to 8:29 AM | 220 (14.4%) | 278 (20.0%) |
| 8:30 AM to 8:59 AM | 44 (2.9%) | 221 (15.9%) |
| 9:00 AM to 9:59 AM | 166 (10.9%) | 114 (8.2%) |
| 10:00 AM to 10:59 AM | 13 (0.9%) | 60 (4.3%) |
| 11:00 AM to 11:59 AM | 4 (0.3%) | 0 (0.0%) |
| 12:00 PM to 3:59 PM | 110 (7.2%) | 31 (2.2%) |
| 4:00 PM to 11:59 PM | 46 (3.0%) | 43 (3.1%) |
| Total | 1,524 (100.0%) | 1,393 (100.0%) |
Housing Occupancy in Islip Terrace
Occupancy by Ownership in Islip Terrace
Of the total 1,723 dwellings in Islip Terrace, owner-occupied units account for 1,526 (88.6%), while renter-occupied units make up 197 (11.4%).
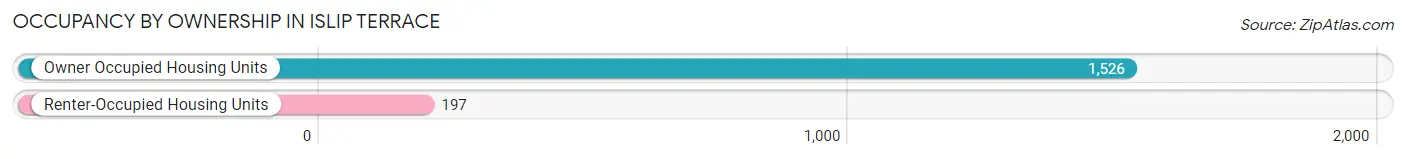
| Occupancy | # Housing Units | % Housing Units |
| Owner Occupied Housing Units | 1,526 | 88.6% |
| Renter-Occupied Housing Units | 197 | 11.4% |
| Total Occupied Housing Units | 1,723 | 100.0% |
Occupancy by Household Size in Islip Terrace
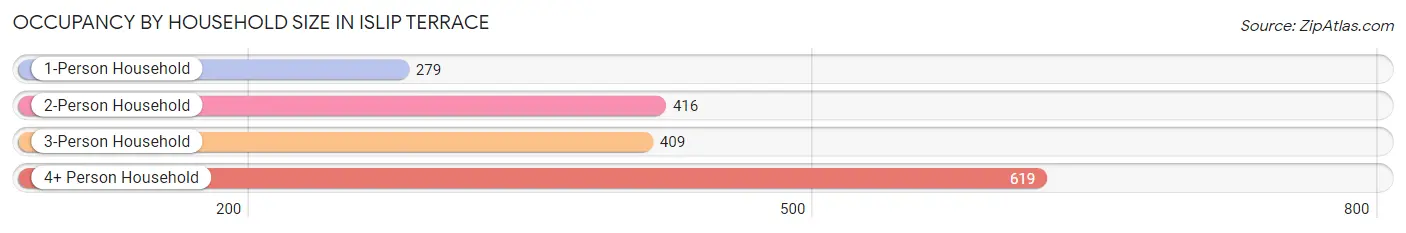
| Household Size | # Housing Units | % Housing Units |
| 1-Person Household | 279 | 16.2% |
| 2-Person Household | 416 | 24.1% |
| 3-Person Household | 409 | 23.7% |
| 4+ Person Household | 619 | 35.9% |
| Total Housing Units | 1,723 | 100.0% |
Occupancy by Ownership by Household Size in Islip Terrace
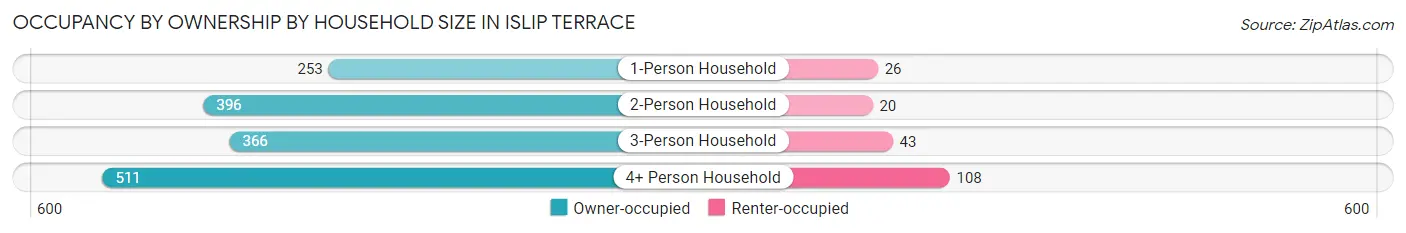
| Household Size | Owner-occupied | Renter-occupied |
| 1-Person Household | 253 (90.7%) | 26 (9.3%) |
| 2-Person Household | 396 (95.2%) | 20 (4.8%) |
| 3-Person Household | 366 (89.5%) | 43 (10.5%) |
| 4+ Person Household | 511 (82.6%) | 108 (17.4%) |
| Total Housing Units | 1,526 (88.6%) | 197 (11.4%) |
Occupancy by Educational Attainment in Islip Terrace
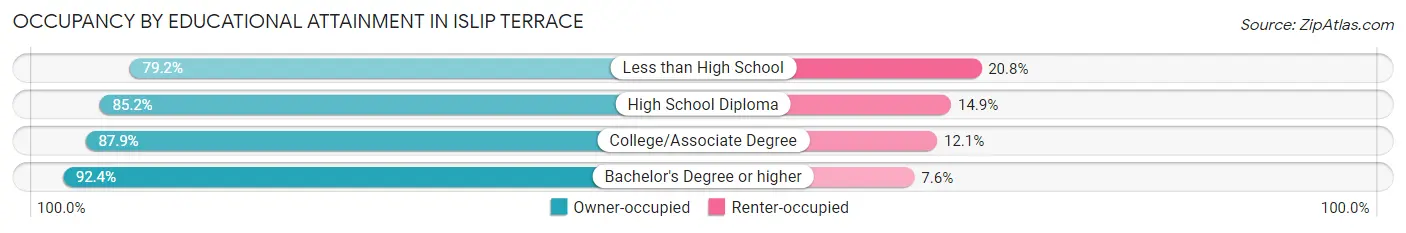
| Household Size | Owner-occupied | Renter-occupied |
| Less than High School | 19 (79.2%) | 5 (20.8%) |
| High School Diploma | 453 (85.2%) | 79 (14.8%) |
| College/Associate Degree | 481 (87.9%) | 66 (12.1%) |
| Bachelor's Degree or higher | 573 (92.4%) | 47 (7.6%) |
Occupancy by Age of Householder in Islip Terrace
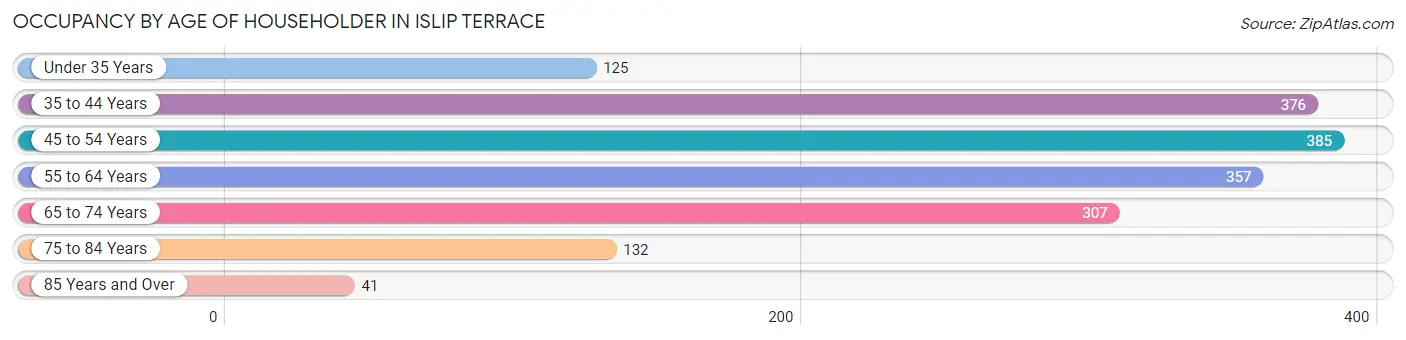
| Age Bracket | # Households | % Households |
| Under 35 Years | 125 | 7.2% |
| 35 to 44 Years | 376 | 21.8% |
| 45 to 54 Years | 385 | 22.3% |
| 55 to 64 Years | 357 | 20.7% |
| 65 to 74 Years | 307 | 17.8% |
| 75 to 84 Years | 132 | 7.7% |
| 85 Years and Over | 41 | 2.4% |
| Total | 1,723 | 100.0% |
Housing Finances in Islip Terrace
Median Income by Occupancy in Islip Terrace
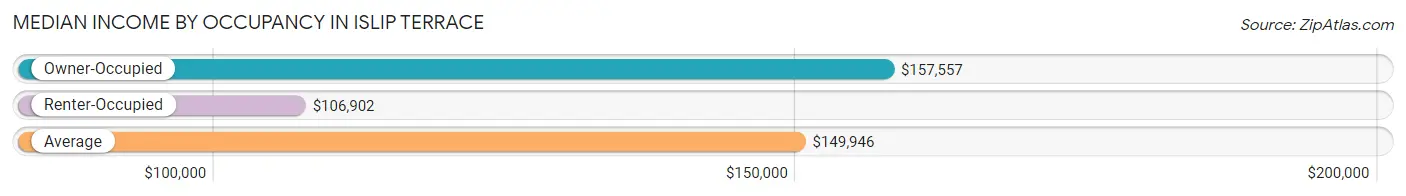
| Occupancy Type | # Households | Median Income |
| Owner-Occupied | 1,526 (88.6%) | $157,557 |
| Renter-Occupied | 197 (11.4%) | $106,902 |
| Average | 1,723 (100.0%) | $149,946 |
Occupancy by Householder Income Bracket in Islip Terrace
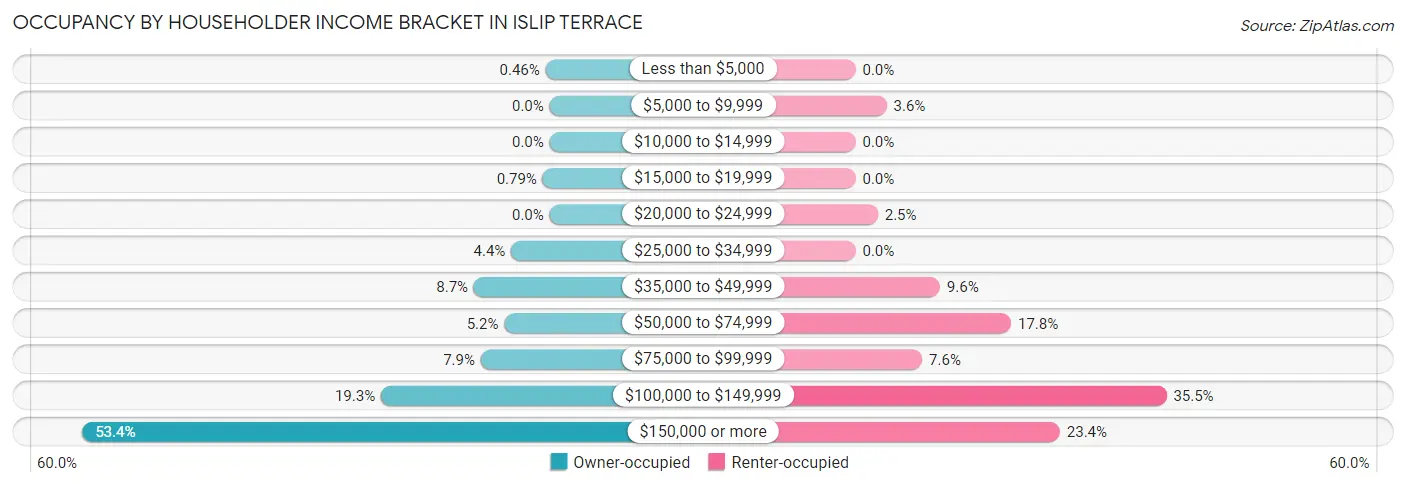
| Income Bracket | Owner-occupied | Renter-occupied |
| Less than $5,000 | 7 (0.5%) | 0 (0.0%) |
| $5,000 to $9,999 | 0 (0.0%) | 7 (3.5%) |
| $10,000 to $14,999 | 0 (0.0%) | 0 (0.0%) |
| $15,000 to $19,999 | 12 (0.8%) | 0 (0.0%) |
| $20,000 to $24,999 | 0 (0.0%) | 5 (2.5%) |
| $25,000 to $34,999 | 67 (4.4%) | 0 (0.0%) |
| $35,000 to $49,999 | 132 (8.6%) | 19 (9.6%) |
| $50,000 to $74,999 | 79 (5.2%) | 35 (17.8%) |
| $75,000 to $99,999 | 120 (7.9%) | 15 (7.6%) |
| $100,000 to $149,999 | 294 (19.3%) | 70 (35.5%) |
| $150,000 or more | 815 (53.4%) | 46 (23.4%) |
| Total | 1,526 (100.0%) | 197 (100.0%) |
Monthly Housing Cost Tiers in Islip Terrace
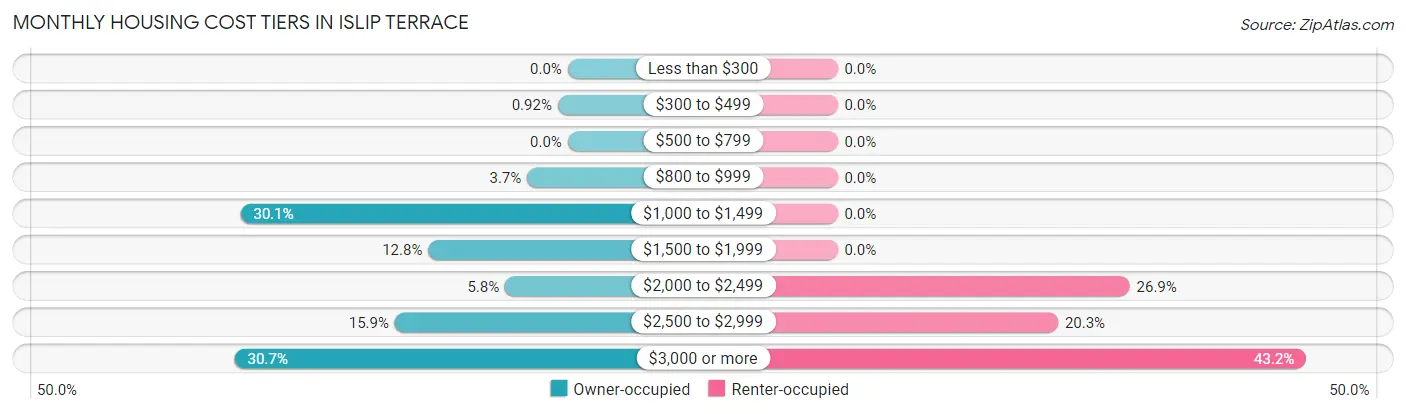
| Monthly Cost | Owner-occupied | Renter-occupied |
| Less than $300 | 0 (0.0%) | 0 (0.0%) |
| $300 to $499 | 14 (0.9%) | 0 (0.0%) |
| $500 to $799 | 0 (0.0%) | 0 (0.0%) |
| $800 to $999 | 57 (3.7%) | 0 (0.0%) |
| $1,000 to $1,499 | 460 (30.1%) | 0 (0.0%) |
| $1,500 to $1,999 | 196 (12.8%) | 0 (0.0%) |
| $2,000 to $2,499 | 88 (5.8%) | 53 (26.9%) |
| $2,500 to $2,999 | 243 (15.9%) | 40 (20.3%) |
| $3,000 or more | 468 (30.7%) | 85 (43.1%) |
| Total | 1,526 (100.0%) | 197 (100.0%) |
Physical Housing Characteristics in Islip Terrace
Housing Structures in Islip Terrace
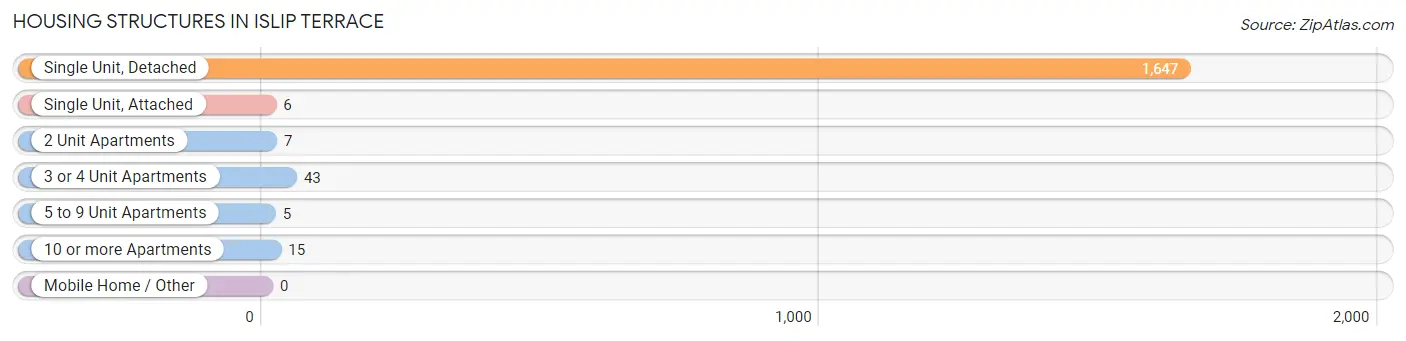
| Structure Type | # Housing Units | % Housing Units |
| Single Unit, Detached | 1,647 | 95.6% |
| Single Unit, Attached | 6 | 0.4% |
| 2 Unit Apartments | 7 | 0.4% |
| 3 or 4 Unit Apartments | 43 | 2.5% |
| 5 to 9 Unit Apartments | 5 | 0.3% |
| 10 or more Apartments | 15 | 0.9% |
| Mobile Home / Other | 0 | 0.0% |
| Total | 1,723 | 100.0% |
Housing Structures by Occupancy in Islip Terrace
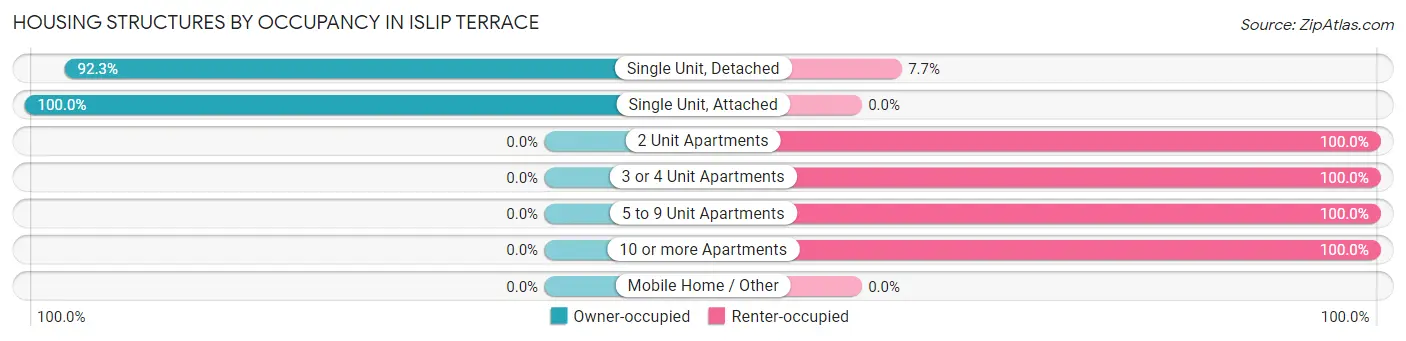
| Structure Type | Owner-occupied | Renter-occupied |
| Single Unit, Detached | 1,520 (92.3%) | 127 (7.7%) |
| Single Unit, Attached | 6 (100.0%) | 0 (0.0%) |
| 2 Unit Apartments | 0 (0.0%) | 7 (100.0%) |
| 3 or 4 Unit Apartments | 0 (0.0%) | 43 (100.0%) |
| 5 to 9 Unit Apartments | 0 (0.0%) | 5 (100.0%) |
| 10 or more Apartments | 0 (0.0%) | 15 (100.0%) |
| Mobile Home / Other | 0 (0.0%) | 0 (0.0%) |
| Total | 1,526 (88.6%) | 197 (11.4%) |
Housing Structures by Number of Rooms in Islip Terrace
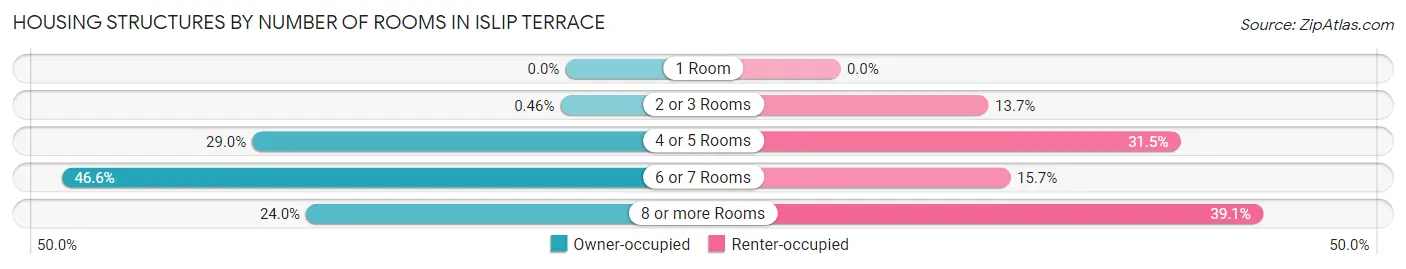
| Number of Rooms | Owner-occupied | Renter-occupied |
| 1 Room | 0 (0.0%) | 0 (0.0%) |
| 2 or 3 Rooms | 7 (0.5%) | 27 (13.7%) |
| 4 or 5 Rooms | 442 (29.0%) | 62 (31.5%) |
| 6 or 7 Rooms | 711 (46.6%) | 31 (15.7%) |
| 8 or more Rooms | 366 (24.0%) | 77 (39.1%) |
| Total | 1,526 (100.0%) | 197 (100.0%) |
Housing Structure by Heating Type in Islip Terrace
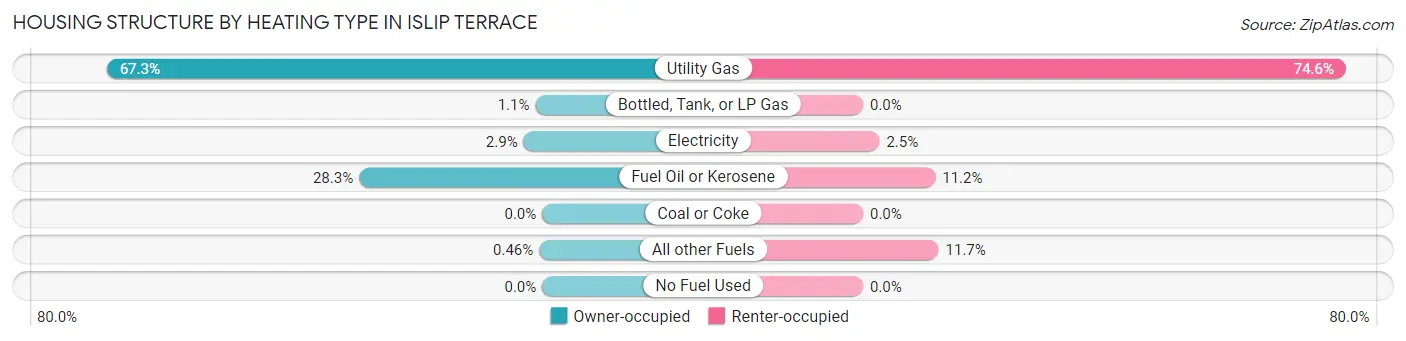
| Heating Type | Owner-occupied | Renter-occupied |
| Utility Gas | 1,027 (67.3%) | 147 (74.6%) |
| Bottled, Tank, or LP Gas | 16 (1.1%) | 0 (0.0%) |
| Electricity | 44 (2.9%) | 5 (2.5%) |
| Fuel Oil or Kerosene | 432 (28.3%) | 22 (11.2%) |
| Coal or Coke | 0 (0.0%) | 0 (0.0%) |
| All other Fuels | 7 (0.5%) | 23 (11.7%) |
| No Fuel Used | 0 (0.0%) | 0 (0.0%) |
| Total | 1,526 (100.0%) | 197 (100.0%) |
Household Vehicle Usage in Islip Terrace
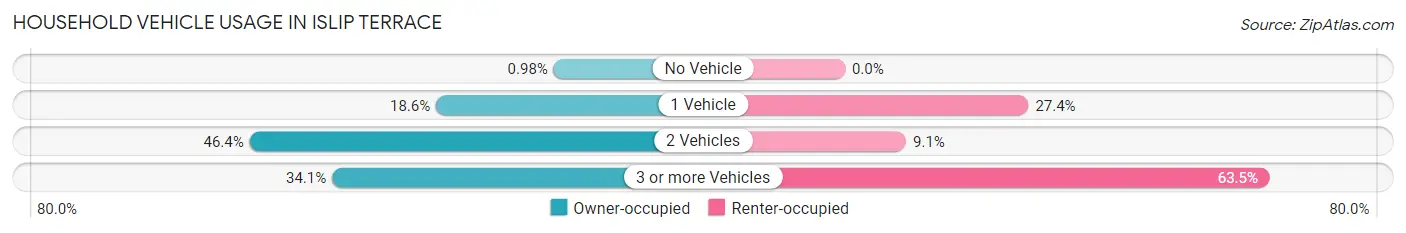
| Vehicles per Household | Owner-occupied | Renter-occupied |
| No Vehicle | 15 (1.0%) | 0 (0.0%) |
| 1 Vehicle | 283 (18.5%) | 54 (27.4%) |
| 2 Vehicles | 708 (46.4%) | 18 (9.1%) |
| 3 or more Vehicles | 520 (34.1%) | 125 (63.4%) |
| Total | 1,526 (100.0%) | 197 (100.0%) |
Real Estate & Mortgages in Islip Terrace
Real Estate and Mortgage Overview in Islip Terrace
| Characteristic | Without Mortgage | With Mortgage |
| Housing Units | 676 | 850 |
| Median Property Value | $420,700 | $464,400 |
| Median Household Income | $118,393 | $538 |
| Monthly Housing Costs | $1,310 | $468 |
| Real Estate Taxes | $10,001 | $0 |
Property Value by Mortgage Status in Islip Terrace
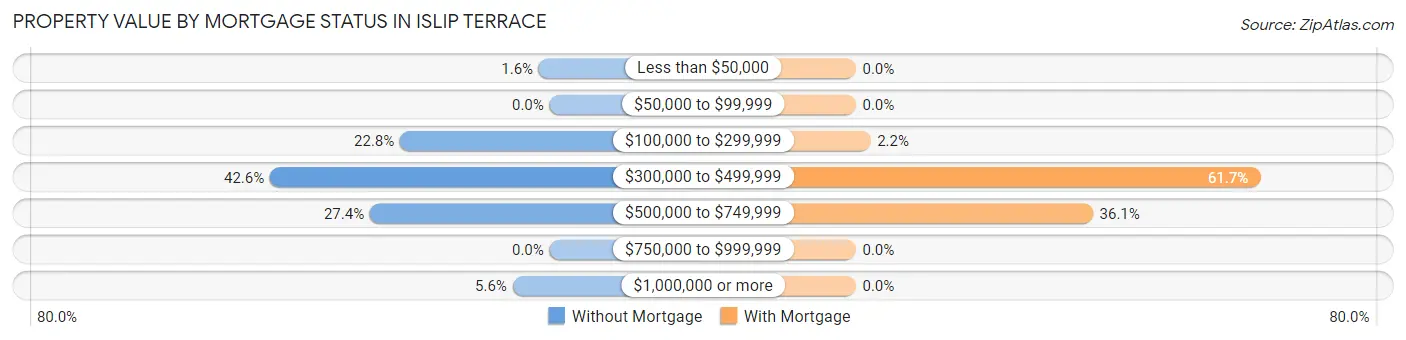
| Property Value | Without Mortgage | With Mortgage |
| Less than $50,000 | 11 (1.6%) | 0 (0.0%) |
| $50,000 to $99,999 | 0 (0.0%) | 0 (0.0%) |
| $100,000 to $299,999 | 154 (22.8%) | 19 (2.2%) |
| $300,000 to $499,999 | 288 (42.6%) | 524 (61.7%) |
| $500,000 to $749,999 | 185 (27.4%) | 307 (36.1%) |
| $750,000 to $999,999 | 0 (0.0%) | 0 (0.0%) |
| $1,000,000 or more | 38 (5.6%) | 0 (0.0%) |
| Total | 676 (100.0%) | 850 (100.0%) |
Household Income by Mortgage Status in Islip Terrace
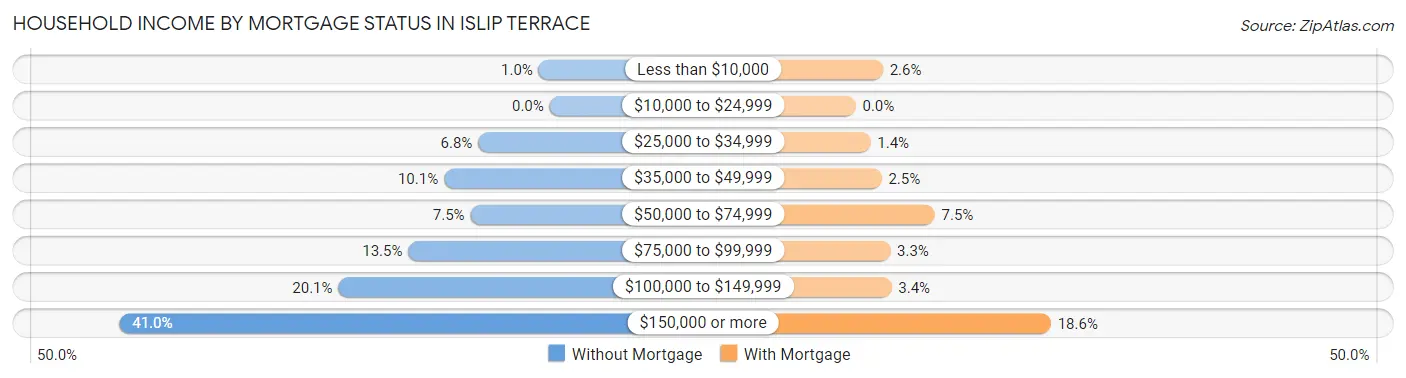
| Household Income | Without Mortgage | With Mortgage |
| Less than $10,000 | 7 (1.0%) | 22 (2.6%) |
| $10,000 to $24,999 | 0 (0.0%) | 0 (0.0%) |
| $25,000 to $34,999 | 46 (6.8%) | 12 (1.4%) |
| $35,000 to $49,999 | 68 (10.1%) | 21 (2.5%) |
| $50,000 to $74,999 | 51 (7.5%) | 64 (7.5%) |
| $75,000 to $99,999 | 91 (13.5%) | 28 (3.3%) |
| $100,000 to $149,999 | 136 (20.1%) | 29 (3.4%) |
| $150,000 or more | 277 (41.0%) | 158 (18.6%) |
| Total | 676 (100.0%) | 850 (100.0%) |
Property Value to Household Income Ratio in Islip Terrace
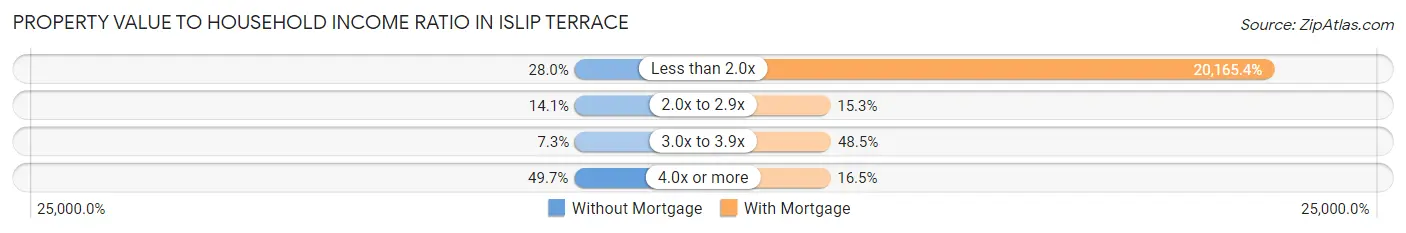
| Value-to-Income Ratio | Without Mortgage | With Mortgage |
| Less than 2.0x | 189 (28.0%) | 171,406 (20,165.4%) |
| 2.0x to 2.9x | 95 (14.1%) | 130 (15.3%) |
| 3.0x to 3.9x | 49 (7.2%) | 412 (48.5%) |
| 4.0x or more | 336 (49.7%) | 140 (16.5%) |
| Total | 676 (100.0%) | 850 (100.0%) |
Real Estate Taxes by Mortgage Status in Islip Terrace
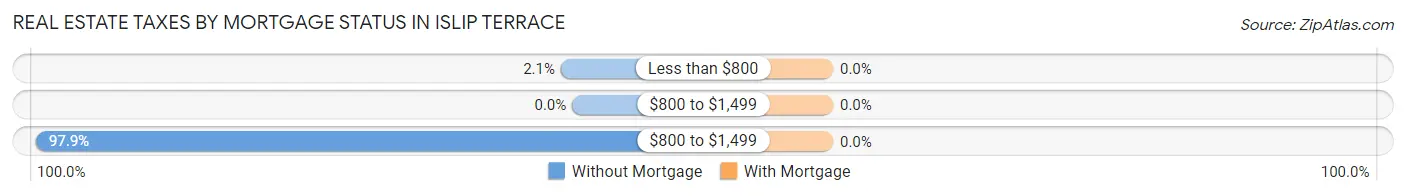
| Property Taxes | Without Mortgage | With Mortgage |
| Less than $800 | 14 (2.1%) | 0 (0.0%) |
| $800 to $1,499 | 0 (0.0%) | 0 (0.0%) |
| $800 to $1,499 | 662 (97.9%) | 0 (0.0%) |
| Total | 676 (100.0%) | 850 (100.0%) |
Health & Disability in Islip Terrace
Health Insurance Coverage by Age in Islip Terrace
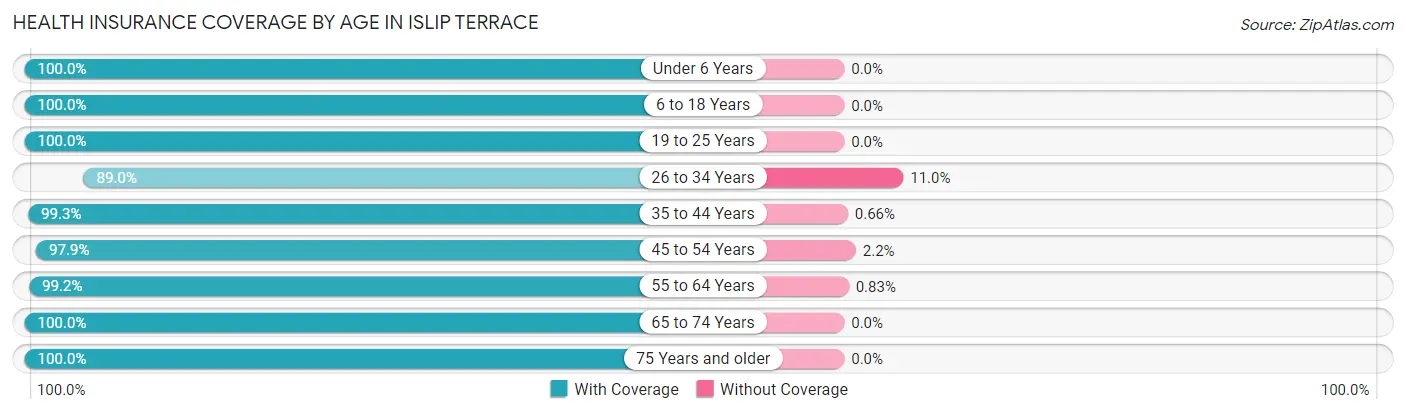
| Age Bracket | With Coverage | Without Coverage |
| Under 6 Years | 353 (100.0%) | 0 (0.0%) |
| 6 to 18 Years | 864 (100.0%) | 0 (0.0%) |
| 19 to 25 Years | 464 (100.0%) | 0 (0.0%) |
| 26 to 34 Years | 550 (89.0%) | 68 (11.0%) |
| 35 to 44 Years | 754 (99.3%) | 5 (0.7%) |
| 45 to 54 Years | 820 (97.9%) | 18 (2.1%) |
| 55 to 64 Years | 717 (99.2%) | 6 (0.8%) |
| 65 to 74 Years | 434 (100.0%) | 0 (0.0%) |
| 75 Years and older | 265 (100.0%) | 0 (0.0%) |
| Total | 5,221 (98.2%) | 97 (1.8%) |
Health Insurance Coverage by Citizenship Status in Islip Terrace
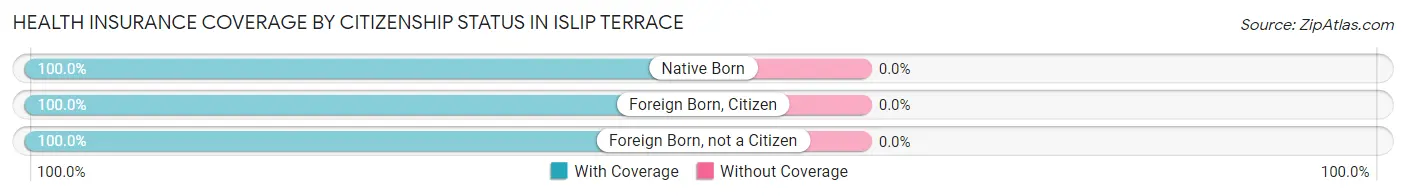
| Citizenship Status | With Coverage | Without Coverage |
| Native Born | 353 (100.0%) | 0 (0.0%) |
| Foreign Born, Citizen | 864 (100.0%) | 0 (0.0%) |
| Foreign Born, not a Citizen | 464 (100.0%) | 0 (0.0%) |
Health Insurance Coverage by Household Income in Islip Terrace
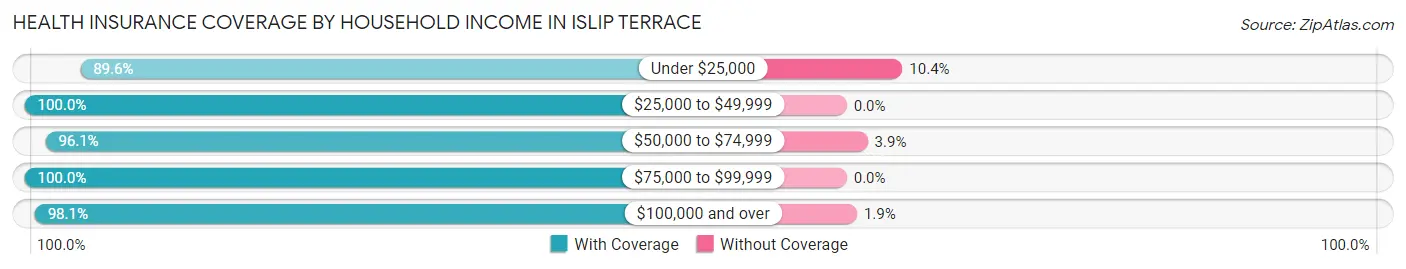
| Household Income | With Coverage | Without Coverage |
| Under $25,000 | 43 (89.6%) | 5 (10.4%) |
| $25,000 to $49,999 | 387 (100.0%) | 0 (0.0%) |
| $50,000 to $74,999 | 295 (96.1%) | 12 (3.9%) |
| $75,000 to $99,999 | 378 (100.0%) | 0 (0.0%) |
| $100,000 and over | 4,117 (98.1%) | 80 (1.9%) |
Public vs Private Health Insurance Coverage by Age in Islip Terrace
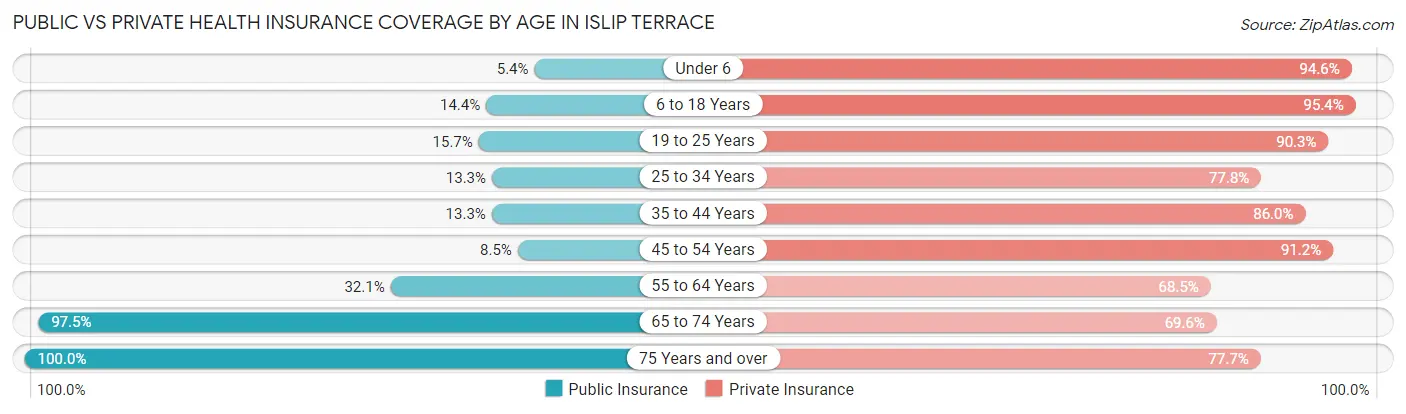
| Age Bracket | Public Insurance | Private Insurance |
| Under 6 | 19 (5.4%) | 334 (94.6%) |
| 6 to 18 Years | 124 (14.3%) | 824 (95.4%) |
| 19 to 25 Years | 73 (15.7%) | 419 (90.3%) |
| 25 to 34 Years | 82 (13.3%) | 481 (77.8%) |
| 35 to 44 Years | 101 (13.3%) | 653 (86.0%) |
| 45 to 54 Years | 71 (8.5%) | 764 (91.2%) |
| 55 to 64 Years | 232 (32.1%) | 495 (68.5%) |
| 65 to 74 Years | 423 (97.5%) | 302 (69.6%) |
| 75 Years and over | 265 (100.0%) | 206 (77.7%) |
| Total | 1,390 (26.1%) | 4,478 (84.2%) |
Disability Status by Sex by Age in Islip Terrace
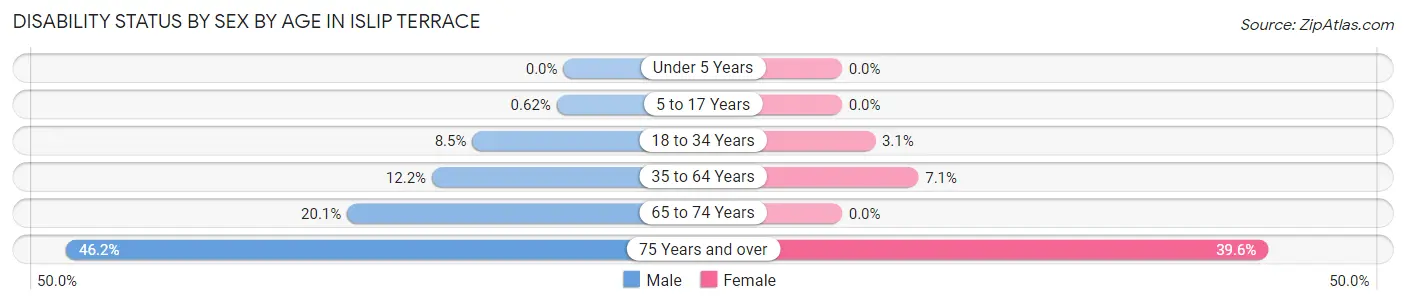
| Age Bracket | Male | Female |
| Under 5 Years | 0 (0.0%) | 0 (0.0%) |
| 5 to 17 Years | 3 (0.6%) | 0 (0.0%) |
| 18 to 34 Years | 56 (8.5%) | 15 (3.1%) |
| 35 to 64 Years | 130 (12.2%) | 89 (7.1%) |
| 65 to 74 Years | 57 (20.1%) | 0 (0.0%) |
| 75 Years and over | 36 (46.2%) | 74 (39.6%) |
Disability Class by Sex by Age in Islip Terrace
Disability Class: Hearing Difficulty
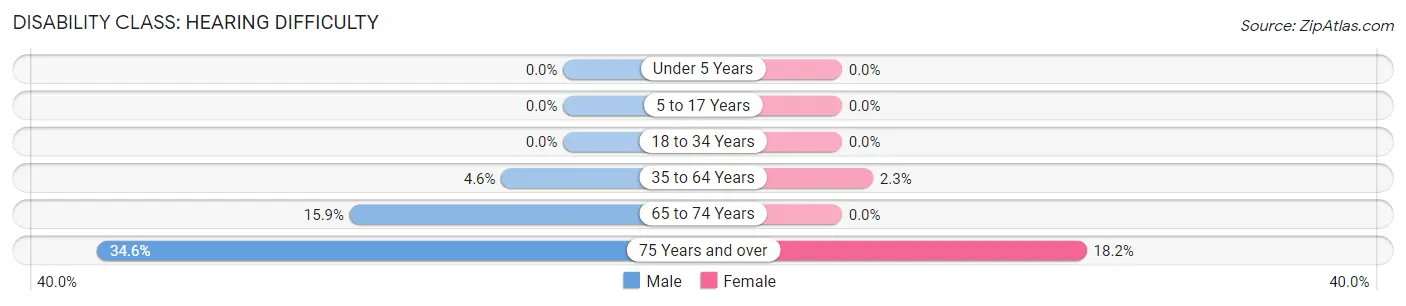
| Age Bracket | Male | Female |
| Under 5 Years | 0 (0.0%) | 0 (0.0%) |
| 5 to 17 Years | 0 (0.0%) | 0 (0.0%) |
| 18 to 34 Years | 0 (0.0%) | 0 (0.0%) |
| 35 to 64 Years | 49 (4.6%) | 29 (2.3%) |
| 65 to 74 Years | 45 (15.9%) | 0 (0.0%) |
| 75 Years and over | 27 (34.6%) | 34 (18.2%) |
Disability Class: Vision Difficulty
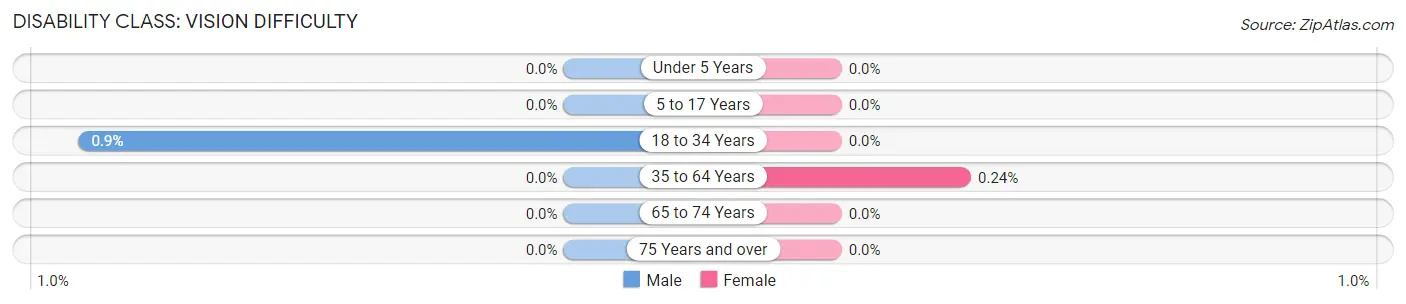
| Age Bracket | Male | Female |
| Under 5 Years | 0 (0.0%) | 0 (0.0%) |
| 5 to 17 Years | 0 (0.0%) | 0 (0.0%) |
| 18 to 34 Years | 6 (0.9%) | 0 (0.0%) |
| 35 to 64 Years | 0 (0.0%) | 3 (0.2%) |
| 65 to 74 Years | 0 (0.0%) | 0 (0.0%) |
| 75 Years and over | 0 (0.0%) | 0 (0.0%) |
Disability Class: Cognitive Difficulty
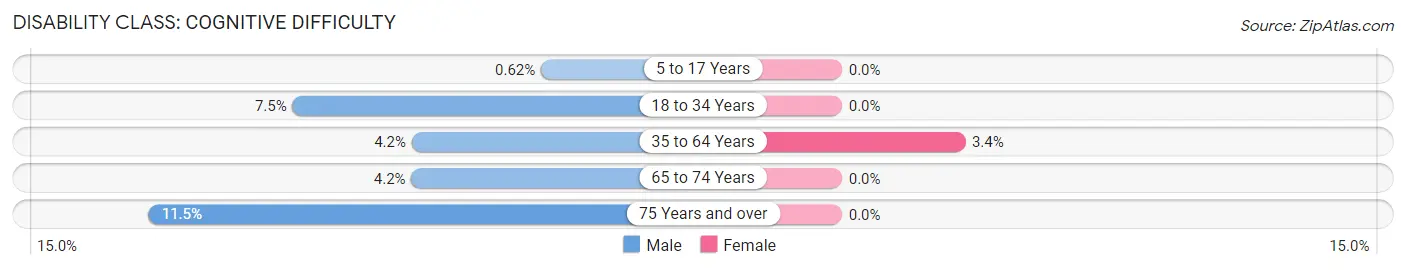
| Age Bracket | Male | Female |
| 5 to 17 Years | 3 (0.6%) | 0 (0.0%) |
| 18 to 34 Years | 50 (7.5%) | 0 (0.0%) |
| 35 to 64 Years | 45 (4.2%) | 43 (3.4%) |
| 65 to 74 Years | 12 (4.2%) | 0 (0.0%) |
| 75 Years and over | 9 (11.5%) | 0 (0.0%) |
Disability Class: Ambulatory Difficulty
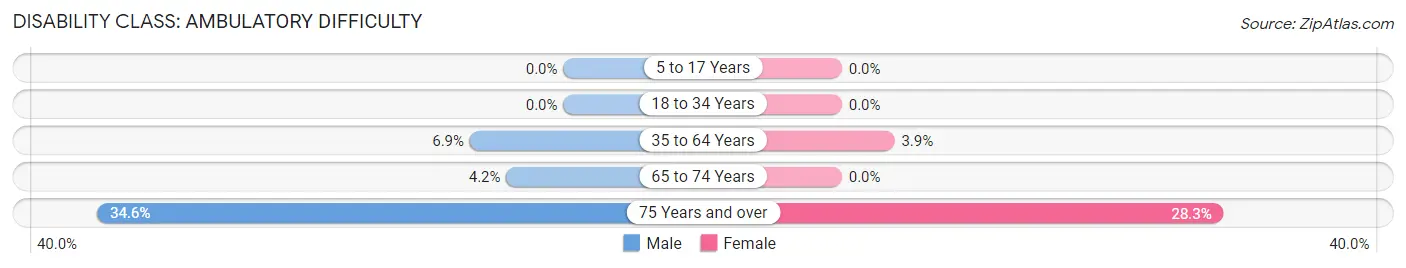
| Age Bracket | Male | Female |
| 5 to 17 Years | 0 (0.0%) | 0 (0.0%) |
| 18 to 34 Years | 0 (0.0%) | 0 (0.0%) |
| 35 to 64 Years | 74 (6.9%) | 49 (3.9%) |
| 65 to 74 Years | 12 (4.2%) | 0 (0.0%) |
| 75 Years and over | 27 (34.6%) | 53 (28.3%) |
Disability Class: Self-Care Difficulty
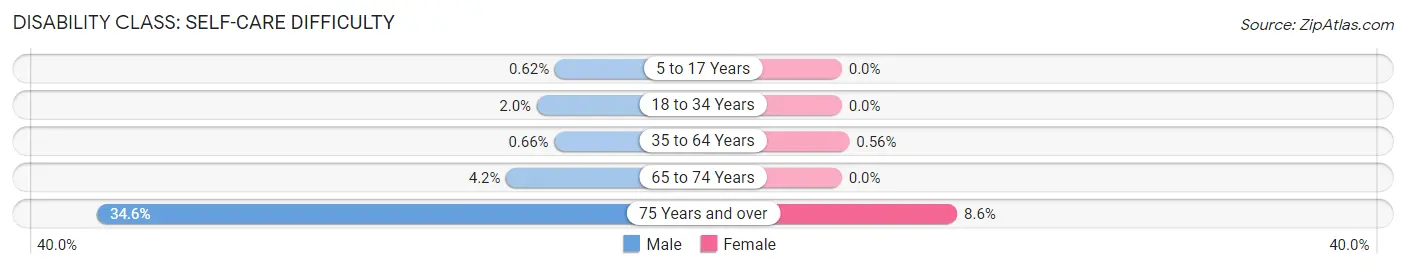
| Age Bracket | Male | Female |
| 5 to 17 Years | 3 (0.6%) | 0 (0.0%) |
| 18 to 34 Years | 13 (2.0%) | 0 (0.0%) |
| 35 to 64 Years | 7 (0.7%) | 7 (0.6%) |
| 65 to 74 Years | 12 (4.2%) | 0 (0.0%) |
| 75 Years and over | 27 (34.6%) | 16 (8.6%) |
Technology Access in Islip Terrace
Computing Device Access in Islip Terrace
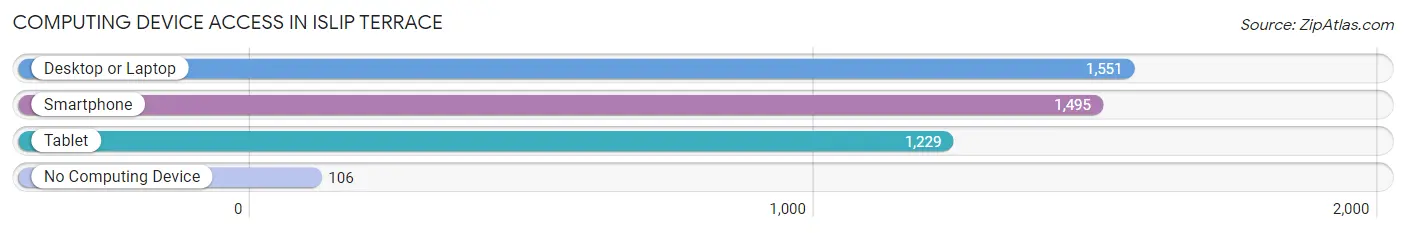
| Device Type | # Households | % Households |
| Desktop or Laptop | 1,551 | 90.0% |
| Smartphone | 1,495 | 86.8% |
| Tablet | 1,229 | 71.3% |
| No Computing Device | 106 | 6.1% |
| Total | 1,723 | 100.0% |
Internet Access in Islip Terrace
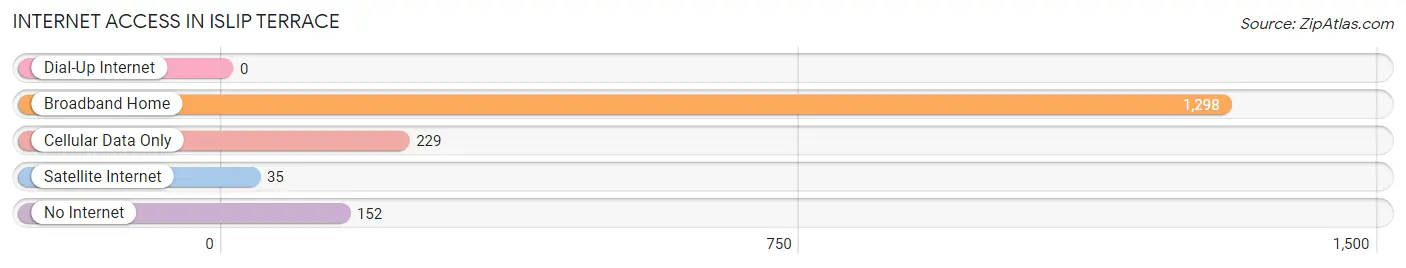
| Internet Type | # Households | % Households |
| Dial-Up Internet | 0 | 0.0% |
| Broadband Home | 1,298 | 75.3% |
| Cellular Data Only | 229 | 13.3% |
| Satellite Internet | 35 | 2.0% |
| No Internet | 152 | 8.8% |
| Total | 1,723 | 100.0% |
Islip Terrace Summary
Islip Terrace is a hamlet located in the Town of Islip in Suffolk County, New York. It is situated on the south shore of Long Island, approximately 50 miles east of New York City. The hamlet is bordered by the hamlets of Bohemia to the west, East Islip to the north, and Bay Shore to the east. Islip Terrace is home to a population of approximately 8,000 people.
History
The area that is now Islip Terrace was originally inhabited by the Secatogue Indians, a sub-tribe of the Algonquin Nation. The Secatogue Indians were a peaceful people who lived off the land, fishing and hunting in the area. The first European settlers arrived in the area in the late 1600s. The area was originally known as “South Islip” and was part of the Town of Islip.
In the late 1800s, the area began to develop as a summer resort destination. The area was known for its beaches, fishing, and boating. In the early 1900s, the area began to develop as a residential community. The area was officially incorporated as the hamlet of Islip Terrace in 1927.
Geography
Islip Terrace is located on the south shore of Long Island, approximately 50 miles east of New York City. The hamlet is bordered by the hamlets of Bohemia to the west, East Islip to the north, and Bay Shore to the east. Islip Terrace is located in the Town of Islip in Suffolk County, New York. The hamlet is situated on the south shore of Long Island, approximately 50 miles east of New York City.
The hamlet is located on the south shore of Long Island, approximately 50 miles east of New York City. The hamlet is bordered by the hamlets of Bohemia to the west, East Islip to the north, and Bay Shore to the east. The hamlet is situated on the south shore of Long Island, approximately 50 miles east of New York City.
The hamlet is located on the south shore of Long Island, approximately 50 miles east of New York City. The hamlet is bordered by the hamlets of Bohemia to the west, East Islip to the north, and Bay Shore to the east. The hamlet is situated on the south shore of Long Island, approximately 50 miles east of New York City.
The hamlet is located on the south shore of Long Island, approximately 50 miles east of New York City. The hamlet is bordered by the hamlets of Bohemia to the west, East Islip to the north, and Bay Shore to the east. The hamlet is situated on the south shore of Long Island, approximately 50 miles east of New York City.
The hamlet is located on the south shore of Long Island, approximately 50 miles east of New York City. The hamlet is bordered by the hamlets of Bohemia to the west, East Islip to the north, and Bay Shore to the east. The hamlet is situated on the south shore of Long Island, approximately 50 miles east of New York City.
Economy
Islip Terrace is a primarily residential community, with a small commercial district located along the main thoroughfare of Carleton Avenue. The commercial district includes a variety of small businesses, including restaurants, retail stores, and professional services. The hamlet is also home to a number of industrial businesses, including a printing company, a metal fabrication shop, and a trucking company.
Demographics
As of the 2010 census, Islip Terrace had a population of 8,000 people. The population is primarily white (83.3%), with a small percentage of African American (7.2%), Hispanic (4.7%), and Asian (3.7%) residents. The median household income is $77,000, and the median home value is $360,000. The hamlet is served by the Islip Union Free School District.
Conclusion
Islip Terrace is a hamlet located in the Town of Islip in Suffolk County, New York. It is situated on the south shore of Long Island, approximately 50 miles east of New York City. The hamlet is bordered by the hamlets of Bohemia to the west, East Islip to the north, and Bay Shore to the east. Islip Terrace is home to a population of approximately 8,000 people. The hamlet is primarily residential, with a small commercial district located along the main thoroughfare of Carleton Avenue. The population is primarily white, with a small percentage of African American, Hispanic, and Asian residents. The median household income is $77,000, and the median home value is $360,000. The hamlet is served by the Islip Union Free School District.
Common Questions
What is the Total Population of Islip Terrace?
Total Population of Islip Terrace is 5,318.
What is the Total Male Population of Islip Terrace?
Total Male Population of Islip Terrace is 2,660.
What is the Total Female Population of Islip Terrace?
Total Female Population of Islip Terrace is 2,658.
What is the Ratio of Males per 100 Females in Islip Terrace?
There are 100.08 Males per 100 Females in Islip Terrace.
What is the Ratio of Females per 100 Males in Islip Terrace?
There are 99.92 Females per 100 Males in Islip Terrace.
What is the Median Population Age in Islip Terrace?
Median Population Age in Islip Terrace is 39.4 Years.
What is the Average Family Size in Islip Terrace
Average Family Size in Islip Terrace is 3.4 People.
What is the Average Household Size in Islip Terrace
Average Household Size in Islip Terrace is 3.1 People.
What is Per Capita Income in Islip Terrace?
Per Capita income in Islip Terrace is $50,715.
What is the Median Family Income in Islip Terrace?
Median Family Income in Islip Terrace is $152,697.
What is the Median Household income in Islip Terrace?
Median Household Income in Islip Terrace is $149,946.
What is Income or Wage Gap in Islip Terrace?
Income or Wage Gap in Islip Terrace is 49.8%.
Women in Islip Terrace earn 50.2 cents for every dollar earned by a man.
What is Inequality or Gini Index in Islip Terrace?
Inequality or Gini Index in Islip Terrace is 0.32.
How Large is the Labor Force in Islip Terrace?
There are 3,189 People in the Labor Forcein in Islip Terrace.
What is the Percentage of People in the Labor Force in Islip Terrace?
75.0% of People are in the Labor Force in Islip Terrace.
What is the Unemployment Rate in Islip Terrace?
Unemployment Rate in Islip Terrace is 0.3%.