Cities with the Highest Percentage of Immigrants from Israel in New York
RELATED REPORTS & OPTIONS
Israel
New York
Compare Cities
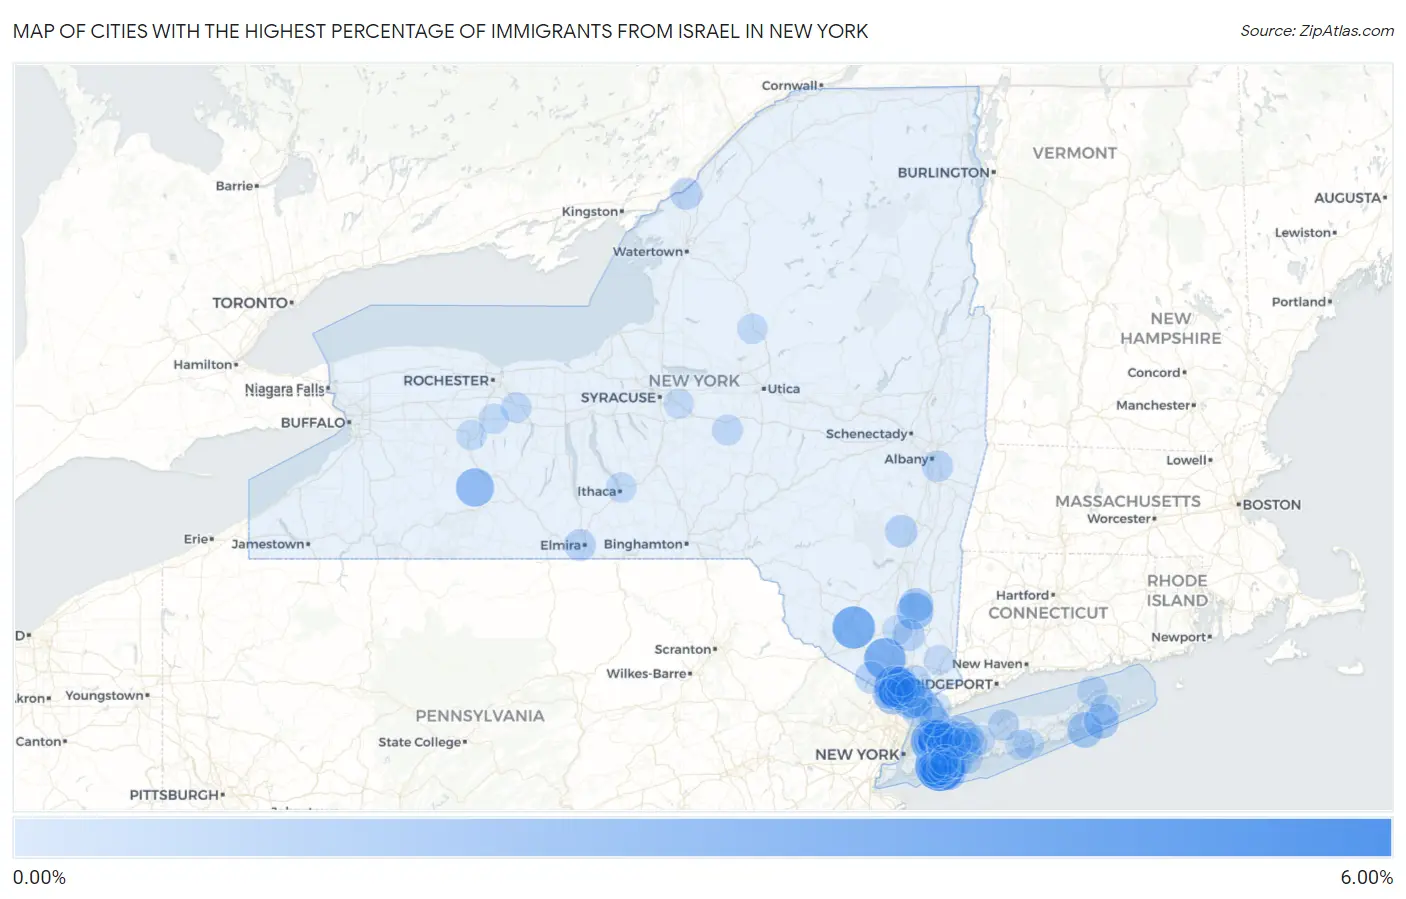
Map of Cities with the Highest Percentage of Immigrants from Israel in New York
0.00%
6.00%
Cities with the Highest Percentage of Immigrants from Israel in New York
| City | Israel | vs State | vs National | |
| 1. | Hewlett Harbor | 5.35% | 0.15%(+5.20)#4 | 0.042%(+5.31)#16 |
| 2. | Thomaston | 3.82% | 0.15%(+3.67)#5 | 0.042%(+3.78)#17 |
| 3. | Saddle Rock | 3.65% | 0.15%(+3.50)#6 | 0.042%(+3.60)#18 |
| 4. | Bloomingburg | 3.43% | 0.15%(+3.28)#7 | 0.042%(+3.39)#19 |
| 5. | Kiryas Joel | 3.17% | 0.15%(+3.02)#8 | 0.042%(+3.12)#20 |
| 6. | Hewlett Neck | 3.12% | 0.15%(+2.97)#9 | 0.042%(+3.08)#21 |
| 7. | Wesley Hills | 3.09% | 0.15%(+2.94)#10 | 0.042%(+3.04)#22 |
| 8. | Saddle Rock Estates | 2.96% | 0.15%(+2.81)#11 | 0.042%(+2.92)#23 |
| 9. | New Hempstead | 2.68% | 0.15%(+2.53)#12 | 0.042%(+2.64)#24 |
| 10. | Cedarhurst | 2.39% | 0.15%(+2.25)#13 | 0.042%(+2.35)#25 |
| 11. | Great Neck Estates | 2.35% | 0.15%(+2.20)#14 | 0.042%(+2.31)#26 |
| 12. | Great Neck Plaza | 2.34% | 0.15%(+2.19)#15 | 0.042%(+2.30)#27 |
| 13. | South Nyack | 2.33% | 0.15%(+2.18)#16 | 0.042%(+2.29)#28 |
| 14. | Canaseraga | 2.32% | 0.15%(+2.17)#17 | 0.042%(+2.28)#29 |
| 15. | Hewlett Bay Park | 2.27% | 0.15%(+2.12)#18 | 0.042%(+2.22)#30 |
| 16. | Kensington | 2.01% | 0.15%(+1.86)#19 | 0.042%(+1.96)#31 |
| 17. | North Hills | 1.95% | 0.15%(+1.81)#20 | 0.042%(+1.91)#32 |
| 18. | Woodmere | 1.95% | 0.15%(+1.80)#21 | 0.042%(+1.91)#153 |
| 19. | Spackenkill | 1.94% | 0.15%(+1.79)#22 | 0.042%(+1.90)#154 |
| 20. | Kaser | 1.80% | 0.15%(+1.65)#23 | 0.042%(+1.76)#155 |
| 21. | Airmont | 1.79% | 0.15%(+1.64)#24 | 0.042%(+1.74)#156 |
| 22. | Roslyn | 1.78% | 0.15%(+1.63)#25 | 0.042%(+1.73)#157 |
| 23. | Great Neck Gardens | 1.76% | 0.15%(+1.61)#26 | 0.042%(+1.71)#158 |
| 24. | Roslyn Estates | 1.63% | 0.15%(+1.48)#27 | 0.042%(+1.59)#159 |
| 25. | Southampton | 1.61% | 0.15%(+1.46)#28 | 0.042%(+1.56)#160 |
| 26. | Lido Beach | 1.49% | 0.15%(+1.34)#29 | 0.042%(+1.45)#161 |
| 27. | Russell Gardens | 1.45% | 0.15%(+1.31)#30 | 0.042%(+1.41)#162 |
| 28. | Sagaponack | 1.45% | 0.15%(+1.30)#31 | 0.042%(+1.41)#163 |
| 29. | Monsey | 1.44% | 0.15%(+1.29)#32 | 0.042%(+1.39)#164 |
| 30. | Kings Point | 1.38% | 0.15%(+1.23)#33 | 0.042%(+1.33)#165 |
| 31. | Great Neck | 1.32% | 0.15%(+1.17)#34 | 0.042%(+1.28)#166 |
| 32. | Arlington | 1.25% | 0.15%(+1.10)#35 | 0.042%(+1.21)#167 |
| 33. | Oyster Bay Cove | 1.13% | 0.15%(+0.984)#36 | 0.042%(+1.09)#168 |
| 34. | Orangeburg | 1.12% | 0.15%(+0.968)#37 | 0.042%(+1.07)#169 |
| 35. | Hewlett | 1.11% | 0.15%(+0.958)#38 | 0.042%(+1.06)#170 |
| 36. | Lawrence | 0.97% | 0.15%(+0.826)#39 | 0.042%(+0.932)#171 |
| 37. | Albertson | 0.92% | 0.15%(+0.774)#40 | 0.042%(+0.880)#172 |
| 38. | West Hempstead | 0.91% | 0.15%(+0.763)#41 | 0.042%(+0.870)#173 |
| 39. | Atlantic Beach | 0.91% | 0.15%(+0.760)#42 | 0.042%(+0.866)#174 |
| 40. | Palenville | 0.86% | 0.15%(+0.716)#43 | 0.042%(+0.823)#175 |
| 41. | Greenwood Lake | 0.79% | 0.15%(+0.644)#44 | 0.042%(+0.751)#176 |
| 42. | Beacon | 0.79% | 0.15%(+0.637)#45 | 0.042%(+0.744)#177 |
| 43. | Muttontown | 0.74% | 0.15%(+0.594)#46 | 0.042%(+0.701)#178 |
| 44. | South Valley Stream | 0.74% | 0.15%(+0.586)#47 | 0.042%(+0.693)#179 |
| 45. | Alexandria Bay | 0.71% | 0.15%(+0.559)#48 | 0.042%(+0.665)#180 |
| 46. | Manorhaven | 0.69% | 0.15%(+0.544)#49 | 0.042%(+0.651)#181 |
| 47. | West Elmira | 0.69% | 0.15%(+0.539)#50 | 0.042%(+0.646)#182 |
| 48. | Melville | 0.69% | 0.15%(+0.537)#51 | 0.042%(+0.644)#183 |
| 49. | East Atlantic Beach | 0.68% | 0.15%(+0.530)#52 | 0.042%(+0.637)#184 |
| 50. | Old Bethpage | 0.66% | 0.15%(+0.509)#53 | 0.042%(+0.616)#185 |
| 51. | Stony Brook | 0.62% | 0.15%(+0.475)#54 | 0.042%(+0.582)#186 |
| 52. | Pomona | 0.60% | 0.15%(+0.451)#55 | 0.042%(+0.557)#187 |
| 53. | Viola | 0.60% | 0.15%(+0.447)#56 | 0.042%(+0.554)#188 |
| 54. | East Greenbush | 0.59% | 0.15%(+0.445)#57 | 0.042%(+0.552)#189 |
| 55. | Herricks | 0.57% | 0.15%(+0.419)#58 | 0.042%(+0.526)#190 |
| 56. | Croton On Hudson | 0.56% | 0.15%(+0.410)#59 | 0.042%(+0.516)#191 |
| 57. | Nanuet | 0.53% | 0.15%(+0.386)#60 | 0.042%(+0.492)#192 |
| 58. | Roslyn Harbor | 0.51% | 0.15%(+0.359)#61 | 0.042%(+0.466)#193 |
| 59. | Tarrytown | 0.48% | 0.15%(+0.327)#62 | 0.042%(+0.434)#194 |
| 60. | Hamilton | 0.46% | 0.15%(+0.315)#63 | 0.042%(+0.422)#195 |
| 61. | Carle Place | 0.45% | 0.15%(+0.298)#64 | 0.042%(+0.405)#196 |
| 62. | Spring Valley | 0.43% | 0.15%(+0.285)#65 | 0.042%(+0.392)#197 |
| 63. | Searingtown | 0.43% | 0.15%(+0.277)#66 | 0.042%(+0.384)#198 |
| 64. | Scarsdale | 0.42% | 0.15%(+0.272)#67 | 0.042%(+0.379)#199 |
| 65. | Nazareth College | 0.41% | 0.15%(+0.258)#68 | 0.042%(+0.365)#200 |
| 66. | Victor | 0.40% | 0.15%(+0.255)#69 | 0.042%(+0.362)#201 |
| 67. | East Marion | 0.38% | 0.15%(+0.235)#70 | 0.042%(+0.342)#202 |
| 68. | Port Washington North | 0.38% | 0.15%(+0.230)#71 | 0.042%(+0.337)#203 |
| 69. | Bellmore | 0.38% | 0.15%(+0.228)#72 | 0.042%(+0.334)#204 |
| 70. | Glen Head | 0.37% | 0.15%(+0.226)#73 | 0.042%(+0.333)#205 |
| 71. | Harbor Isle | 0.37% | 0.15%(+0.219)#74 | 0.042%(+0.326)#206 |
| 72. | Merrick | 0.36% | 0.15%(+0.213)#75 | 0.042%(+0.320)#207 |
| 73. | East Rockaway | 0.36% | 0.15%(+0.209)#76 | 0.042%(+0.315)#208 |
| 74. | Lima | 0.36% | 0.15%(+0.208)#77 | 0.042%(+0.315)#209 |
| 75. | Northwest Harbor | 0.36% | 0.15%(+0.208)#78 | 0.042%(+0.314)#210 |
| 76. | East Massapequa | 0.35% | 0.15%(+0.205)#79 | 0.042%(+0.312)#211 |
| 77. | Brookhaven | 0.35% | 0.15%(+0.203)#80 | 0.042%(+0.310)#212 |
| 78. | Plainview | 0.35% | 0.15%(+0.201)#81 | 0.042%(+0.307)#213 |
| 79. | Geneseo | 0.34% | 0.15%(+0.188)#82 | 0.042%(+0.295)#214 |
| 80. | New City | 0.34% | 0.15%(+0.188)#83 | 0.042%(+0.295)#215 |
| 81. | Dix Hills | 0.33% | 0.15%(+0.184)#84 | 0.042%(+0.291)#216 |
| 82. | Harrison | 0.33% | 0.15%(+0.182)#85 | 0.042%(+0.289)#217 |
| 83. | West Hills | 0.33% | 0.15%(+0.182)#86 | 0.042%(+0.289)#218 |
| 84. | Cayuga Heights | 0.32% | 0.15%(+0.173)#87 | 0.042%(+0.279)#219 |
| 85. | Boonville | 0.31% | 0.15%(+0.165)#88 | 0.042%(+0.272)#220 |
| 86. | Jericho | 0.31% | 0.15%(+0.159)#89 | 0.042%(+0.266)#221 |
| 87. | Hastings On Hudson | 0.31% | 0.15%(+0.159)#90 | 0.042%(+0.265)#222 |
| 88. | New Square | 0.29% | 0.15%(+0.144)#91 | 0.042%(+0.250)#223 |
| 89. | Oceanside | 0.29% | 0.15%(+0.143)#92 | 0.042%(+0.250)#258 |
| 90. | Inwood | 0.29% | 0.15%(+0.138)#93 | 0.042%(+0.245)#259 |
| 91. | Suffern | 0.28% | 0.15%(+0.133)#94 | 0.042%(+0.239)#260 |
| 92. | Heritage Hills | 0.28% | 0.15%(+0.131)#95 | 0.042%(+0.238)#261 |
| 93. | Rockville Centre | 0.28% | 0.15%(+0.130)#96 | 0.042%(+0.237)#262 |
| 94. | Gardnertown | 0.28% | 0.15%(+0.130)#97 | 0.042%(+0.237)#263 |
| 95. | Manlius | 0.28% | 0.15%(+0.129)#98 | 0.042%(+0.236)#264 |
| 96. | Roessleville | 0.28% | 0.15%(+0.128)#99 | 0.042%(+0.234)#265 |
| 97. | Mamaroneck | 0.28% | 0.15%(+0.127)#100 | 0.042%(+0.234)#266 |
| 98. | Mount Ivy | 0.27% | 0.15%(+0.123)#101 | 0.042%(+0.230)#267 |
| 99. | Valley Cottage | 0.25% | 0.15%(+0.105)#102 | 0.042%(+0.212)#268 |
| 100. | East Patchogue | 0.25% | 0.15%(+0.103)#103 | 0.042%(+0.210)#269 |
Common Questions
What are the Top 10 Cities with the Highest Percentage of Immigrants from Israel in New York?
Top 10 Cities with the Highest Percentage of Immigrants from Israel in New York are:
#1
5.35%
#2
3.82%
#3
3.65%
#4
3.43%
#5
3.17%
#6
3.12%
#7
3.09%
#8
2.96%
#9
2.68%
#10
2.39%
What city has the Highest Percentage of Immigrants from Israel in New York?
Hewlett Harbor has the Highest Percentage of Immigrants from Israel in New York with 5.35%.
What is the Percentage of Immigrants from Israel in the State of New York?
Percentage of Immigrants from Israel in New York is 0.15%.
What is the Percentage of Immigrants from Israel in the United States?
Percentage of Immigrants from Israel in the United States is 0.042%.