Harriman, NY
Harriman Map
Harriman Overview
2,955
TOTAL POPULATION
1,340
MALE POPULATION
1,615
FEMALE POPULATION
82.97
MALES / 100 FEMALES
120.52
FEMALES / 100 MALES
37.8
MEDIAN AGE
3.7
AVG FAMILY SIZE
2.6
AVG HOUSEHOLD SIZE
$39,486
PER CAPITA INCOME
$87,813
AVG FAMILY INCOME
$74,861
AVG HOUSEHOLD INCOME
12.3%
WAGE / INCOME GAP [ % ]
87.7¢/ $1
WAGE / INCOME GAP [ $ ]
0.39
INEQUALITY / GINI INDEX
1,579
LABOR FORCE [ PEOPLE ]
70.9%
PERCENT IN LABOR FORCE
5.3%
UNEMPLOYMENT RATE
Harriman Zip Codes
Harriman Area Codes
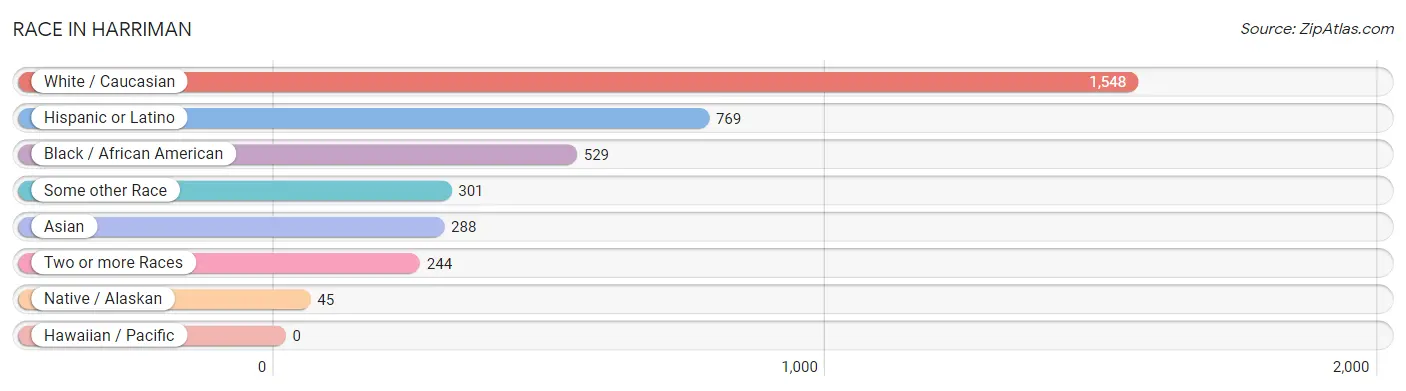
Race in Harriman
The most populous races in Harriman are White / Caucasian (1,548 | 52.4%), Hispanic or Latino (769 | 26.0%), and Black / African American (529 | 17.9%).
| Race | # Population | % Population |
| Asian | 288 | 9.8% |
| Black / African American | 529 | 17.9% |
| Hawaiian / Pacific | 0 | 0.0% |
| Hispanic or Latino | 769 | 26.0% |
| Native / Alaskan | 45 | 1.5% |
| White / Caucasian | 1,548 | 52.4% |
| Two or more Races | 244 | 8.3% |
| Some other Race | 301 | 10.2% |
| Total | 2,955 | 100.0% |
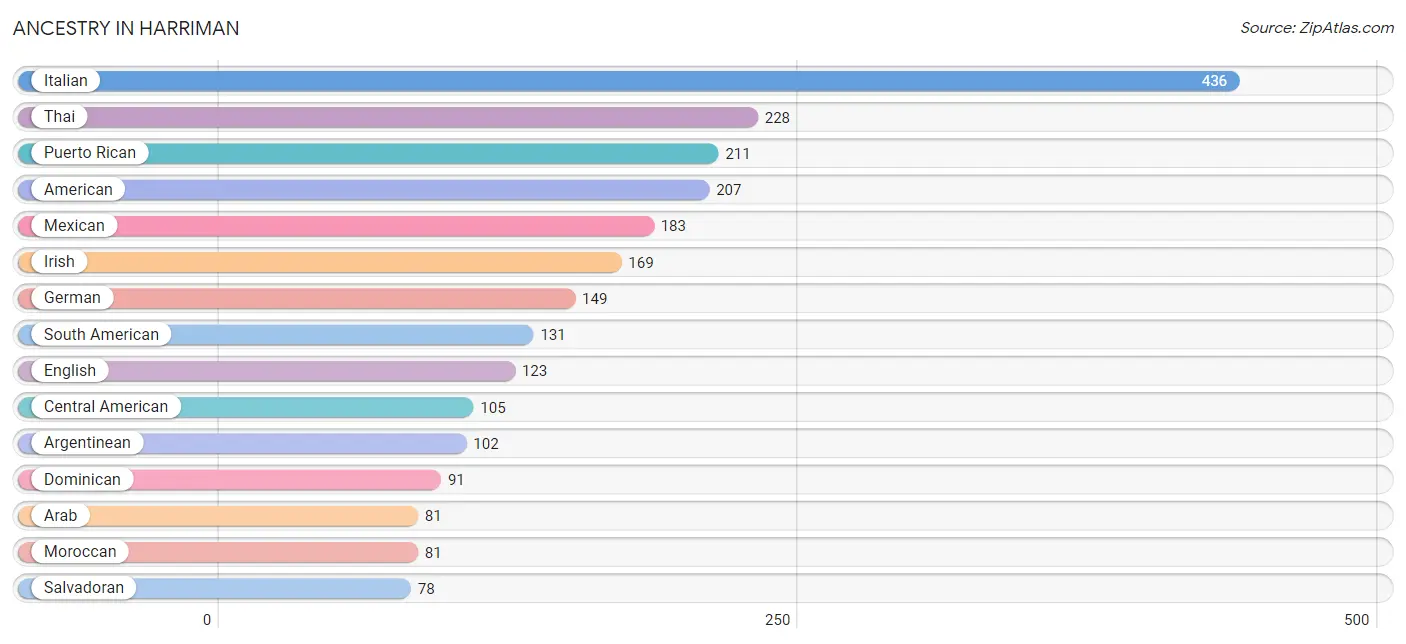
Ancestry in Harriman
The most populous ancestries reported in Harriman are Italian (436 | 14.7%), Thai (228 | 7.7%), Puerto Rican (211 | 7.1%), American (207 | 7.0%), and Mexican (183 | 6.2%), together accounting for 42.8% of all Harriman residents.
| Ancestry | # Population | % Population |
| African | 71 | 2.4% |
| American | 207 | 7.0% |
| Arab | 81 | 2.7% |
| Argentinean | 102 | 3.5% |
| Austrian | 9 | 0.3% |
| Brazilian | 33 | 1.1% |
| Central American | 105 | 3.5% |
| Central American Indian | 47 | 1.6% |
| Cherokee | 11 | 0.4% |
| Colombian | 24 | 0.8% |
| Cuban | 39 | 1.3% |
| Dominican | 91 | 3.1% |
| Dutch | 14 | 0.5% |
| Eastern European | 5 | 0.2% |
| Ecuadorian | 5 | 0.2% |
| English | 123 | 4.2% |
| European | 24 | 0.8% |
| Filipino | 9 | 0.3% |
| French | 11 | 0.4% |
| French Canadian | 6 | 0.2% |
| German | 149 | 5.0% |
| Greek | 21 | 0.7% |
| Guatemalan | 8 | 0.3% |
| Haitian | 66 | 2.2% |
| Honduran | 19 | 0.6% |
| Indian (Asian) | 5 | 0.2% |
| Irish | 169 | 5.7% |
| Italian | 436 | 14.7% |
| Jamaican | 7 | 0.2% |
| Korean | 8 | 0.3% |
| Mexican | 183 | 6.2% |
| Moroccan | 81 | 2.7% |
| Pennsylvania German | 27 | 0.9% |
| Polish | 17 | 0.6% |
| Portuguese | 20 | 0.7% |
| Puerto Rican | 211 | 7.1% |
| Russian | 33 | 1.1% |
| Salvadoran | 78 | 2.6% |
| Scandinavian | 6 | 0.2% |
| Scottish | 19 | 0.6% |
| South American | 131 | 4.4% |
| South American Indian | 2 | 0.1% |
| Sri Lankan | 21 | 0.7% |
| Subsaharan African | 71 | 2.4% |
| Swedish | 9 | 0.3% |
| Thai | 228 | 7.7% |
| Vietnamese | 42 | 1.4% |
| West Indian | 22 | 0.7% | View All 48 Rows |
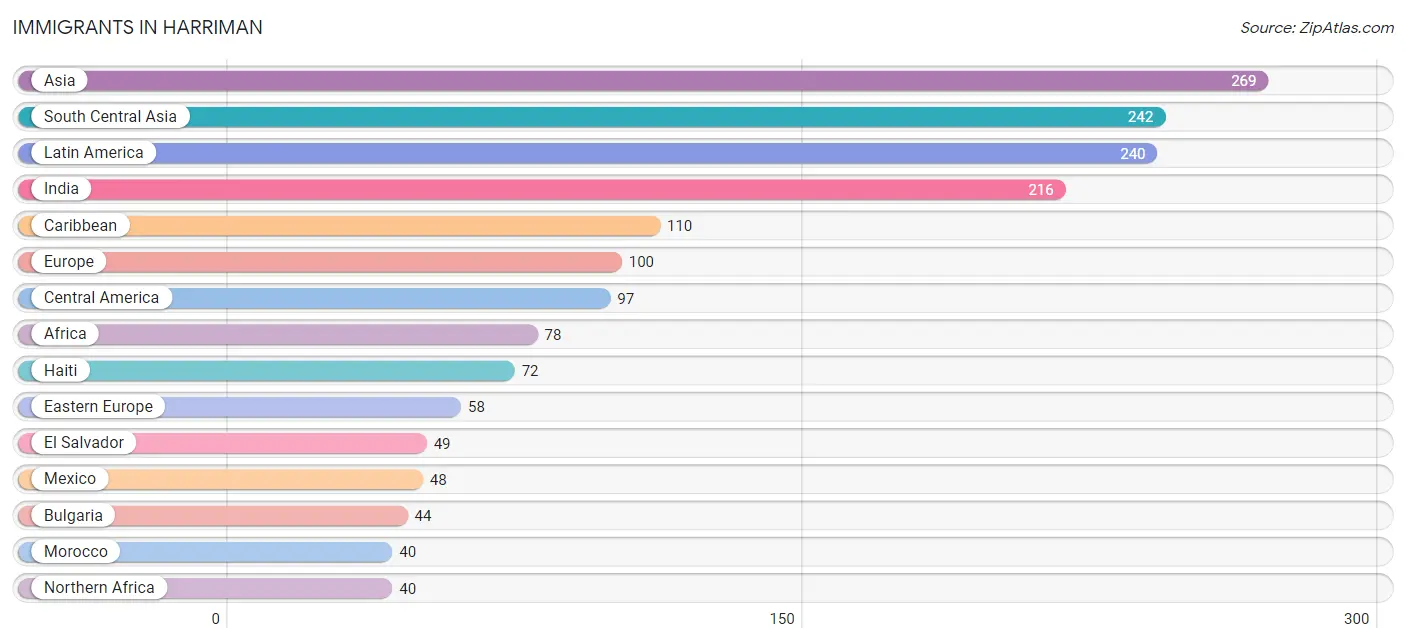
Immigrants in Harriman
The most numerous immigrant groups reported in Harriman came from Asia (269 | 9.1%), South Central Asia (242 | 8.2%), Latin America (240 | 8.1%), India (216 | 7.3%), and Caribbean (110 | 3.7%), together accounting for 36.4% of all Harriman residents.
| Immigration Origin | # Population | % Population |
| Africa | 78 | 2.6% |
| Asia | 269 | 9.1% |
| Austria | 5 | 0.2% |
| Bangladesh | 26 | 0.9% |
| Brazil | 33 | 1.1% |
| Bulgaria | 44 | 1.5% |
| Caribbean | 110 | 3.7% |
| Central America | 97 | 3.3% |
| China | 21 | 0.7% |
| Dominican Republic | 15 | 0.5% |
| Eastern Asia | 21 | 0.7% |
| Eastern Europe | 58 | 2.0% |
| El Salvador | 49 | 1.7% |
| Europe | 100 | 3.4% |
| France | 25 | 0.9% |
| Ghana | 38 | 1.3% |
| Greece | 6 | 0.2% |
| Haiti | 72 | 2.4% |
| India | 216 | 7.3% |
| Italy | 6 | 0.2% |
| Jamaica | 7 | 0.2% |
| Latin America | 240 | 8.1% |
| Mexico | 48 | 1.6% |
| Morocco | 40 | 1.3% |
| Northern Africa | 40 | 1.3% |
| Philippines | 6 | 0.2% |
| Poland | 3 | 0.1% |
| South America | 33 | 1.1% |
| South Central Asia | 242 | 8.2% |
| South Eastern Asia | 6 | 0.2% |
| Southern Europe | 12 | 0.4% |
| Taiwan | 9 | 0.3% |
| Trinidad and Tobago | 16 | 0.5% |
| Ukraine | 11 | 0.4% |
| Western Africa | 38 | 1.3% |
| Western Europe | 30 | 1.0% | View All 36 Rows |
Sex and Age in Harriman
Sex and Age in Harriman
The most populous age groups in Harriman are Under 5 Years (181 | 13.5%) for men and 55 to 59 Years (220 | 13.6%) for women.
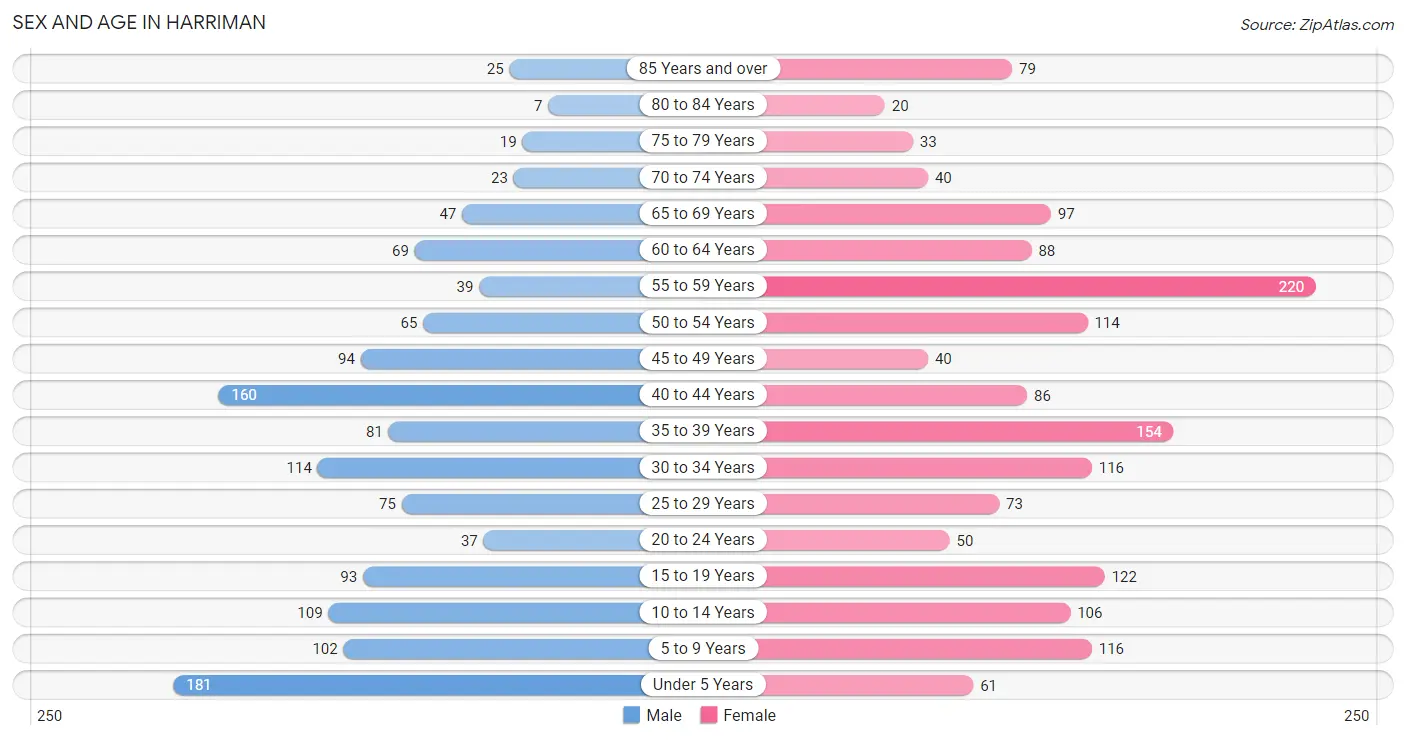
| Age Bracket | Male | Female |
| Under 5 Years | 181 (13.5%) | 61 (3.8%) |
| 5 to 9 Years | 102 (7.6%) | 116 (7.2%) |
| 10 to 14 Years | 109 (8.1%) | 106 (6.6%) |
| 15 to 19 Years | 93 (6.9%) | 122 (7.5%) |
| 20 to 24 Years | 37 (2.8%) | 50 (3.1%) |
| 25 to 29 Years | 75 (5.6%) | 73 (4.5%) |
| 30 to 34 Years | 114 (8.5%) | 116 (7.2%) |
| 35 to 39 Years | 81 (6.0%) | 154 (9.5%) |
| 40 to 44 Years | 160 (11.9%) | 86 (5.3%) |
| 45 to 49 Years | 94 (7.0%) | 40 (2.5%) |
| 50 to 54 Years | 65 (4.9%) | 114 (7.1%) |
| 55 to 59 Years | 39 (2.9%) | 220 (13.6%) |
| 60 to 64 Years | 69 (5.1%) | 88 (5.4%) |
| 65 to 69 Years | 47 (3.5%) | 97 (6.0%) |
| 70 to 74 Years | 23 (1.7%) | 40 (2.5%) |
| 75 to 79 Years | 19 (1.4%) | 33 (2.0%) |
| 80 to 84 Years | 7 (0.5%) | 20 (1.2%) |
| 85 Years and over | 25 (1.9%) | 79 (4.9%) |
| Total | 1,340 (100.0%) | 1,615 (100.0%) |
Families and Households in Harriman
Median Family Size in Harriman
The median family size in Harriman is 3.67 persons per family, with single male/father families (42 | 6.6%) accounting for the largest median family size of 3.93 persons per family. On the other hand, single female/mother families (186 | 29.2%) represent the smallest median family size with 3.24 persons per family.
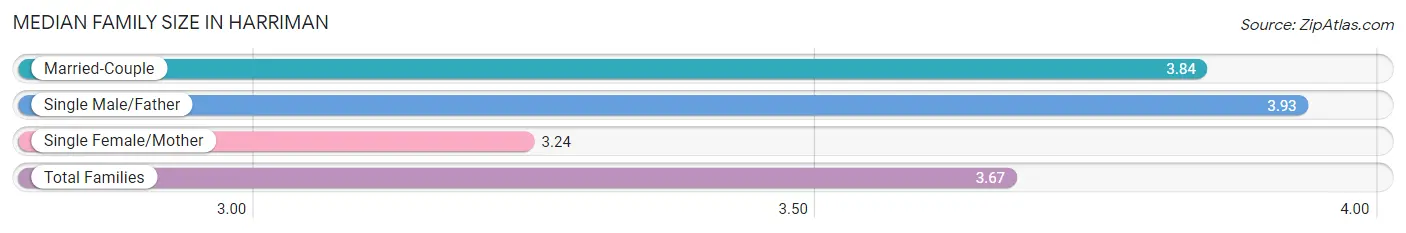
| Family Type | # Families | Family Size |
| Married-Couple | 409 (64.2%) | 3.84 |
| Single Male/Father | 42 (6.6%) | 3.93 |
| Single Female/Mother | 186 (29.2%) | 3.24 |
| Total Families | 637 (100.0%) | 3.67 |
Median Household Size in Harriman
The median household size in Harriman is 2.57 persons per household, with single male/father households (42 | 3.7%) accounting for the largest median household size of 3.93 persons per household. non-family households (512 | 44.6%) represent the smallest median household size with 1.14 persons per household.
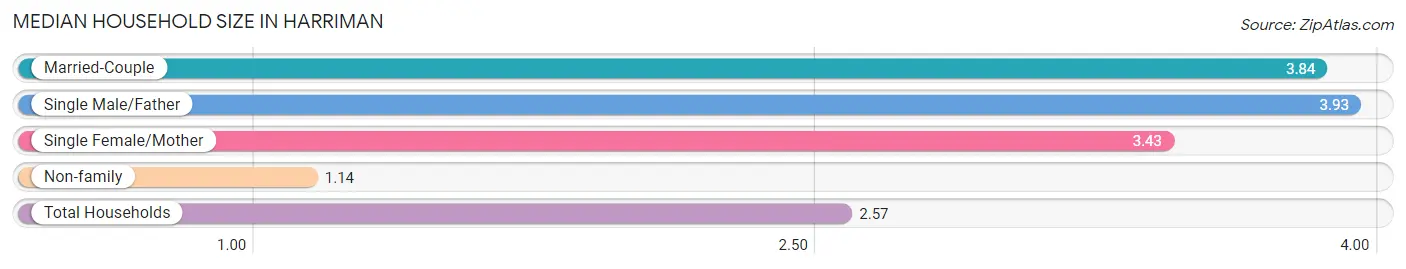
| Household Type | # Households | Household Size |
| Married-Couple | 409 (35.6%) | 3.84 |
| Single Male/Father | 42 (3.7%) | 3.93 |
| Single Female/Mother | 186 (16.2%) | 3.43 |
| Non-family | 512 (44.6%) | 1.14 |
| Total Households | 1,149 (100.0%) | 2.57 |
Household Size by Marriage Status in Harriman
Out of a total of 1,149 households in Harriman, 637 (55.4%) are family households, while 512 (44.6%) are nonfamily households. The most numerous type of family households are 2-person households, comprising 231, and the most common type of nonfamily households are 1-person households, comprising 461.
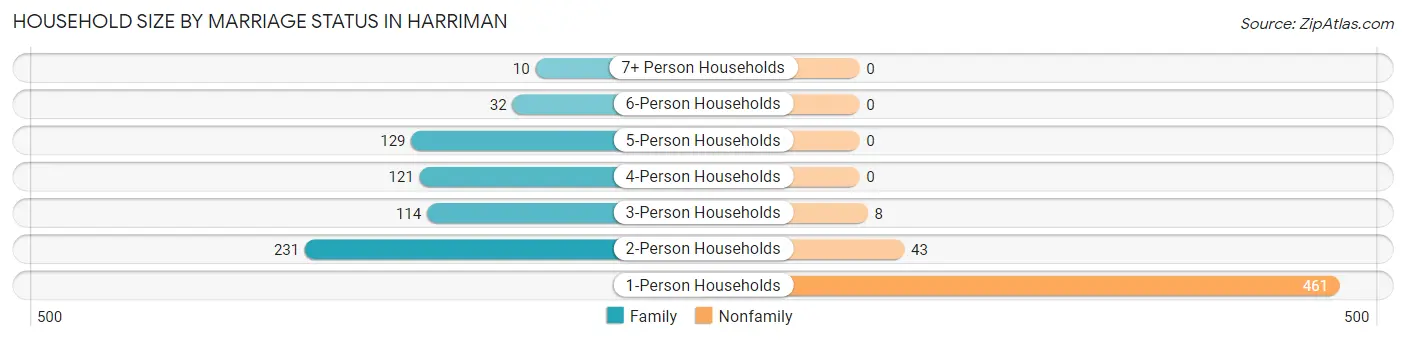
| Household Size | Family Households | Nonfamily Households |
| 1-Person Households | - | 461 (40.1%) |
| 2-Person Households | 231 (20.1%) | 43 (3.7%) |
| 3-Person Households | 114 (9.9%) | 8 (0.7%) |
| 4-Person Households | 121 (10.5%) | 0 (0.0%) |
| 5-Person Households | 129 (11.2%) | 0 (0.0%) |
| 6-Person Households | 32 (2.8%) | 0 (0.0%) |
| 7+ Person Households | 10 (0.9%) | 0 (0.0%) |
| Total | 637 (55.4%) | 512 (44.6%) |
Female Fertility in Harriman
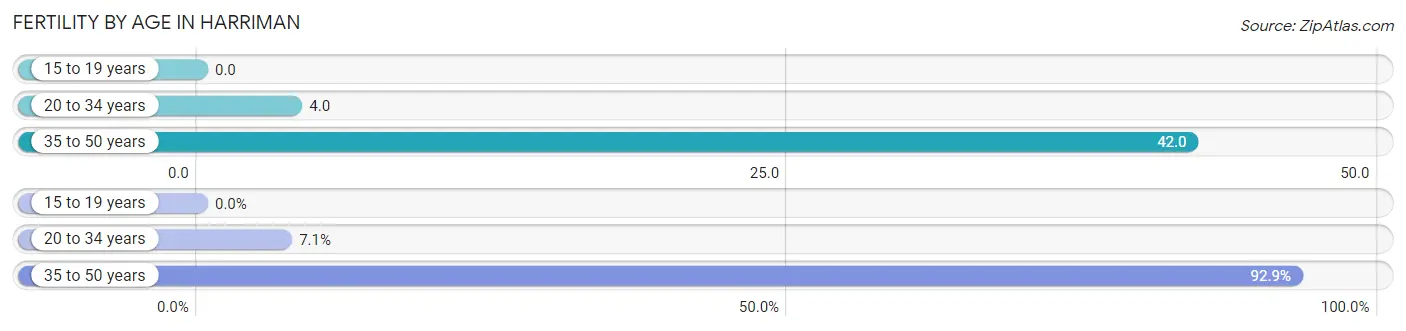
Fertility by Age in Harriman
Average fertility rate in Harriman is 21.0 births per 1,000 women. Women in the age bracket of 35 to 50 years have the highest fertility rate with 42.0 births per 1,000 women. Women in the age bracket of 35 to 50 years acount for 92.9% of all women with births.
| Age Bracket | Women with Births | Births / 1,000 Women |
| 15 to 19 years | 0 (0.0%) | 0.0 |
| 20 to 34 years | 1 (7.1%) | 4.0 |
| 35 to 50 years | 13 (92.9%) | 42.0 |
| Total | 14 (100.0%) | 21.0 |
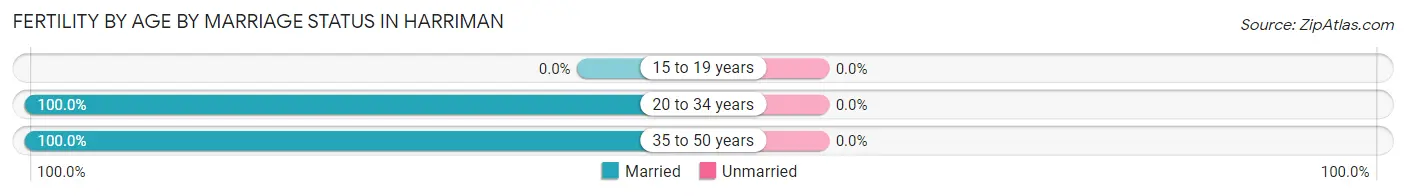
Fertility by Age by Marriage Status in Harriman
| Age Bracket | Married | Unmarried |
| 15 to 19 years | 0 (0.0%) | 0 (0.0%) |
| 20 to 34 years | 1 (100.0%) | 0 (0.0%) |
| 35 to 50 years | 13 (100.0%) | 0 (0.0%) |
| Total | 14 (100.0%) | 0 (0.0%) |
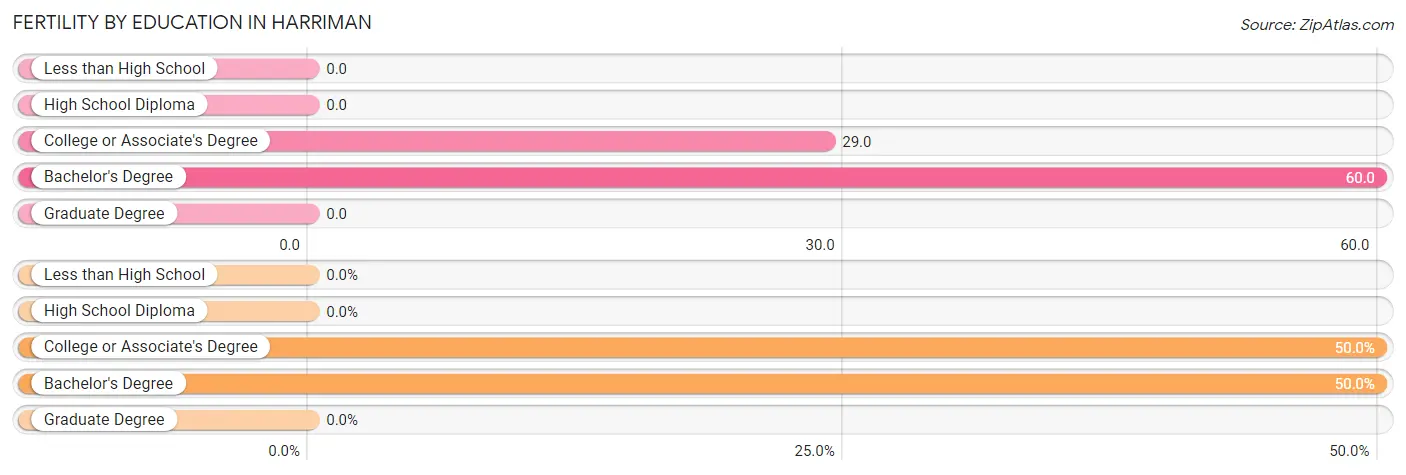
Fertility by Education in Harriman
| Educational Attainment | Women with Births | Births / 1,000 Women |
| Less than High School | 0 (0.0%) | 0.0 |
| High School Diploma | 0 (0.0%) | 0.0 |
| College or Associate's Degree | 7 (50.0%) | 29.0 |
| Bachelor's Degree | 7 (50.0%) | 60.0 |
| Graduate Degree | 0 (0.0%) | 0.0 |
| Total | 14 (100.0%) | 21.0 |
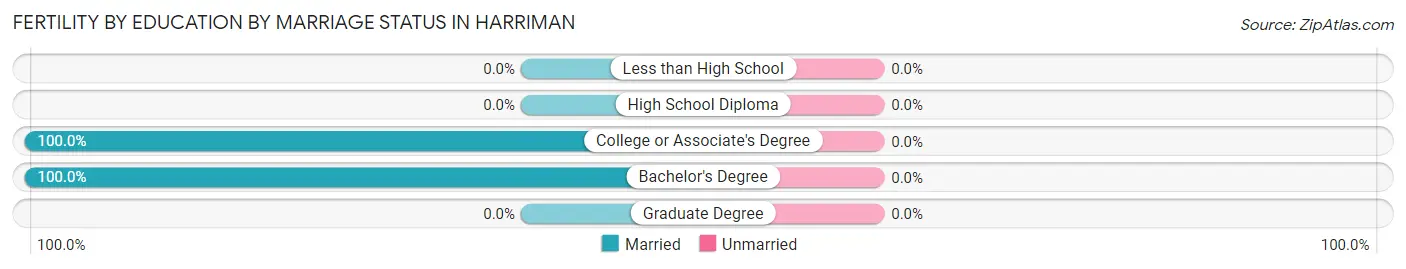
Fertility by Education by Marriage Status in Harriman
| Educational Attainment | Married | Unmarried |
| Less than High School | 0 (0.0%) | 0 (0.0%) |
| High School Diploma | 0 (0.0%) | 0 (0.0%) |
| College or Associate's Degree | 7 (100.0%) | 0 (0.0%) |
| Bachelor's Degree | 7 (100.0%) | 0 (0.0%) |
| Graduate Degree | 0 (0.0%) | 0 (0.0%) |
| Total | 14 (100.0%) | 0 (0.0%) |
Income in Harriman
Income Overview in Harriman
Per Capita Income in Harriman is $39,486, while median incomes of families and households are $87,813 and $74,861 respectively.
| Characteristic | Number | Measure |
| Per Capita Income | 2,955 | $39,486 |
| Median Family Income | 637 | $87,813 |
| Mean Family Income | 637 | $111,685 |
| Median Household Income | 1,149 | $74,861 |
| Mean Household Income | 1,149 | $95,589 |
| Income Deficit | 637 | $0 |
| Wage / Income Gap (%) | 2,955 | 12.33% |
| Wage / Income Gap ($) | 2,955 | 87.67¢ per $1 |
| Gini / Inequality Index | 2,955 | 0.39 |
Earnings by Sex in Harriman
Average Earnings in Harriman are $52,698, $46,645 for men and $53,204 for women, a difference of 12.3%.
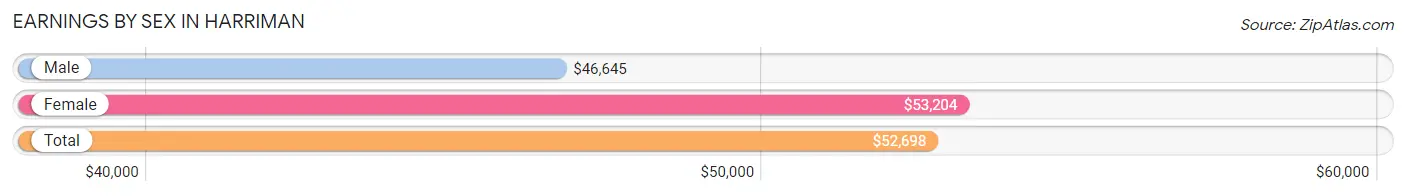
| Sex | Number | Average Earnings |
| Male | 705 (44.2%) | $46,645 |
| Female | 891 (55.8%) | $53,204 |
| Total | 1,596 (100.0%) | $52,698 |
Earnings by Sex by Income Bracket in Harriman
The most common earnings brackets in Harriman are $100,000+ for men (106 | 15.0%) and $50,000 to $54,999 for women (161 | 18.1%).
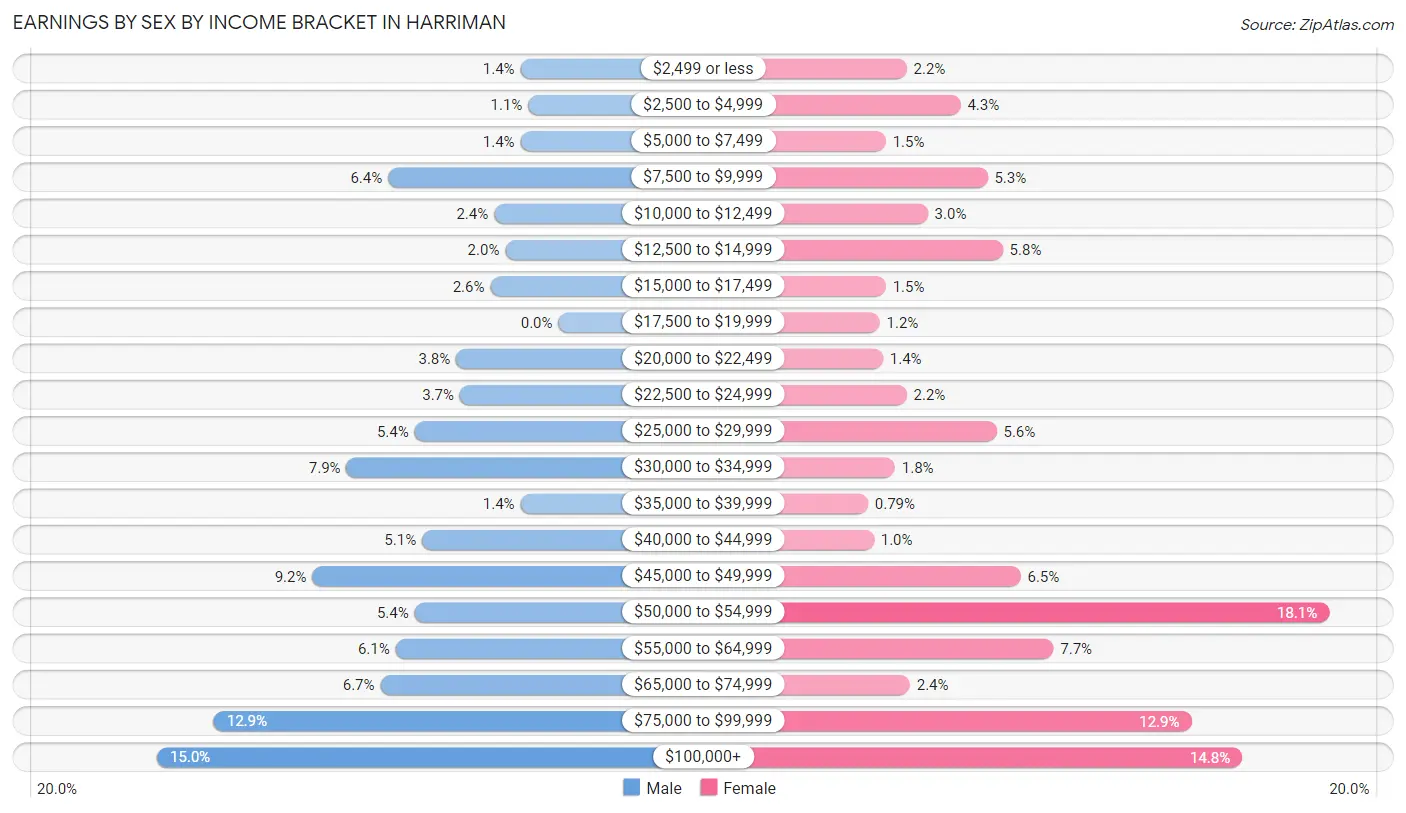
| Income | Male | Female |
| $2,499 or less | 10 (1.4%) | 20 (2.2%) |
| $2,500 to $4,999 | 8 (1.1%) | 38 (4.3%) |
| $5,000 to $7,499 | 10 (1.4%) | 13 (1.5%) |
| $7,500 to $9,999 | 45 (6.4%) | 47 (5.3%) |
| $10,000 to $12,499 | 17 (2.4%) | 27 (3.0%) |
| $12,500 to $14,999 | 14 (2.0%) | 52 (5.8%) |
| $15,000 to $17,499 | 18 (2.5%) | 13 (1.5%) |
| $17,500 to $19,999 | 0 (0.0%) | 11 (1.2%) |
| $20,000 to $22,499 | 27 (3.8%) | 12 (1.3%) |
| $22,500 to $24,999 | 26 (3.7%) | 20 (2.2%) |
| $25,000 to $29,999 | 38 (5.4%) | 50 (5.6%) |
| $30,000 to $34,999 | 56 (7.9%) | 16 (1.8%) |
| $35,000 to $39,999 | 10 (1.4%) | 7 (0.8%) |
| $40,000 to $44,999 | 36 (5.1%) | 9 (1.0%) |
| $45,000 to $49,999 | 65 (9.2%) | 58 (6.5%) |
| $50,000 to $54,999 | 38 (5.4%) | 161 (18.1%) |
| $55,000 to $64,999 | 43 (6.1%) | 69 (7.7%) |
| $65,000 to $74,999 | 47 (6.7%) | 21 (2.4%) |
| $75,000 to $99,999 | 91 (12.9%) | 115 (12.9%) |
| $100,000+ | 106 (15.0%) | 132 (14.8%) |
| Total | 705 (100.0%) | 891 (100.0%) |
Earnings by Sex by Educational Attainment in Harriman
Average earnings in Harriman are $51,250 for men and $53,974 for women, a difference of 5.1%. Men with an educational attainment of graduate degree enjoy the highest average annual earnings of $95,492, while those with high school diploma education earn the least with $44,766. Women with an educational attainment of graduate degree earn the most with the average annual earnings of $135,993, while those with college or associate's degree education have the smallest earnings of $25,865.
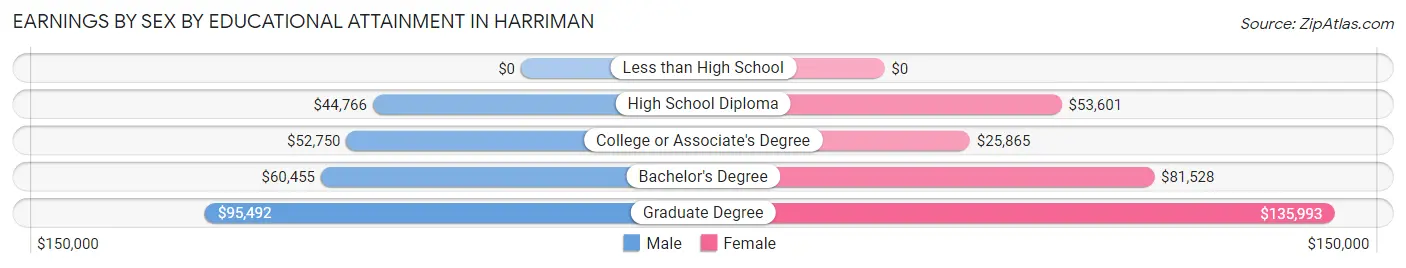
| Educational Attainment | Male Income | Female Income |
| Less than High School | - | - |
| High School Diploma | $44,766 | $53,601 |
| College or Associate's Degree | $52,750 | $25,865 |
| Bachelor's Degree | $60,455 | $81,528 |
| Graduate Degree | $95,492 | $135,993 |
| Total | $51,250 | $53,974 |
Family Income in Harriman
Family Income Brackets in Harriman
According to the Harriman family income data, there are 187 families falling into the $100,000 to $149,999 income range, which is the most common income bracket and makes up 29.4% of all families.
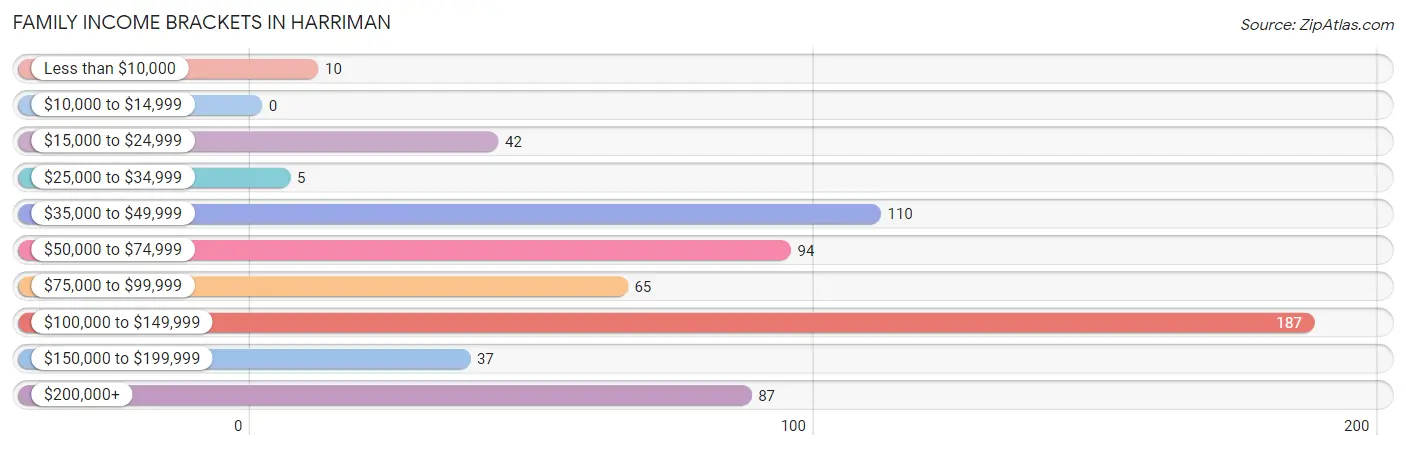
| Income Bracket | # Families | % Families |
| Less than $10,000 | 10 | 1.6% |
| $10,000 to $14,999 | 0 | 0.0% |
| $15,000 to $24,999 | 42 | 6.6% |
| $25,000 to $34,999 | 5 | 0.8% |
| $35,000 to $49,999 | 110 | 17.3% |
| $50,000 to $74,999 | 94 | 14.8% |
| $75,000 to $99,999 | 65 | 10.2% |
| $100,000 to $149,999 | 187 | 29.4% |
| $150,000 to $199,999 | 37 | 5.8% |
| $200,000+ | 87 | 13.7% |
Family Income by Famaliy Size in Harriman
4-person families (115 | 18.0%) account for the highest median family income in Harriman with $126,771 per family, while 2-person families (258 | 40.5%) have the highest median income of $58,906 per family member.
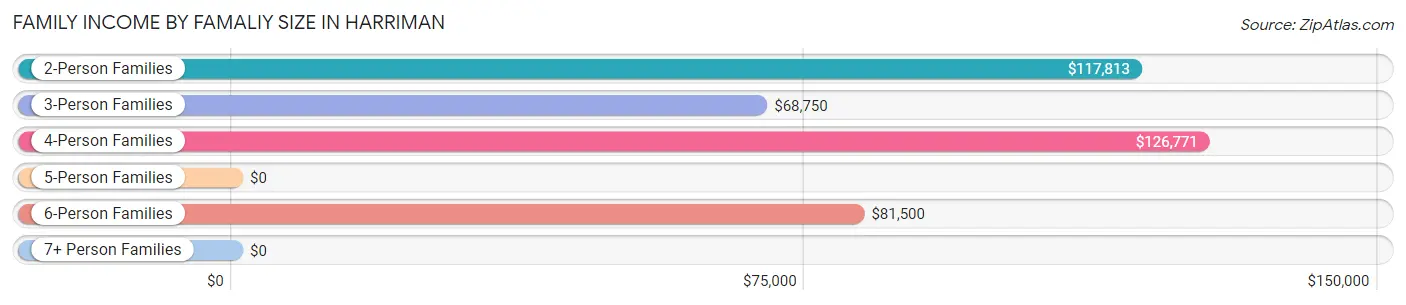
| Income Bracket | # Families | Median Income |
| 2-Person Families | 258 (40.5%) | $117,813 |
| 3-Person Families | 93 (14.6%) | $68,750 |
| 4-Person Families | 115 (18.0%) | $126,771 |
| 5-Person Families | 129 (20.3%) | $0 |
| 6-Person Families | 32 (5.0%) | $81,500 |
| 7+ Person Families | 10 (1.6%) | $0 |
| Total | 637 (100.0%) | $87,813 |
Family Income by Number of Earners in Harriman
The median family income in Harriman is $87,813, with families comprising 2 earners (350) having the highest median family income of $126,522, while families with no earners (40) have the lowest median family income of $44,286, accounting for 54.9% and 6.3% of families, respectively.
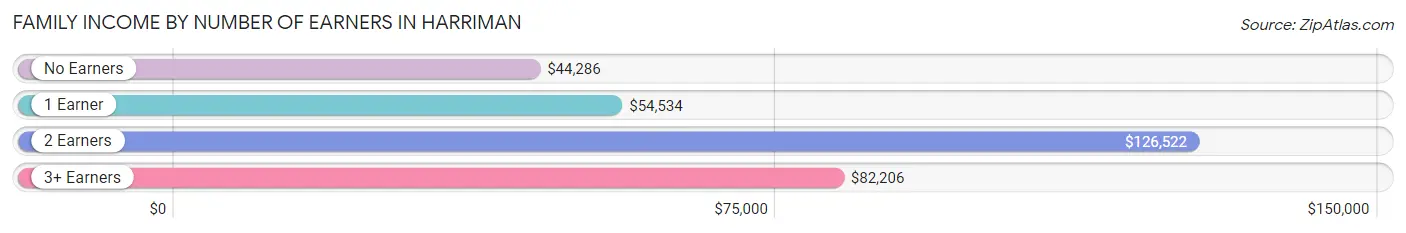
| Number of Earners | # Families | Median Income |
| No Earners | 40 (6.3%) | $44,286 |
| 1 Earner | 183 (28.7%) | $54,534 |
| 2 Earners | 350 (54.9%) | $126,522 |
| 3+ Earners | 64 (10.1%) | $82,206 |
| Total | 637 (100.0%) | $87,813 |
Household Income in Harriman
Household Income Brackets in Harriman
With 250 households falling in the category, the $100,000 to $149,999 income range is the most frequent in Harriman, accounting for 21.8% of all households. In contrast, only 20 households (1.7%) fall into the $10,000 to $14,999 income bracket, making it the least populous group.
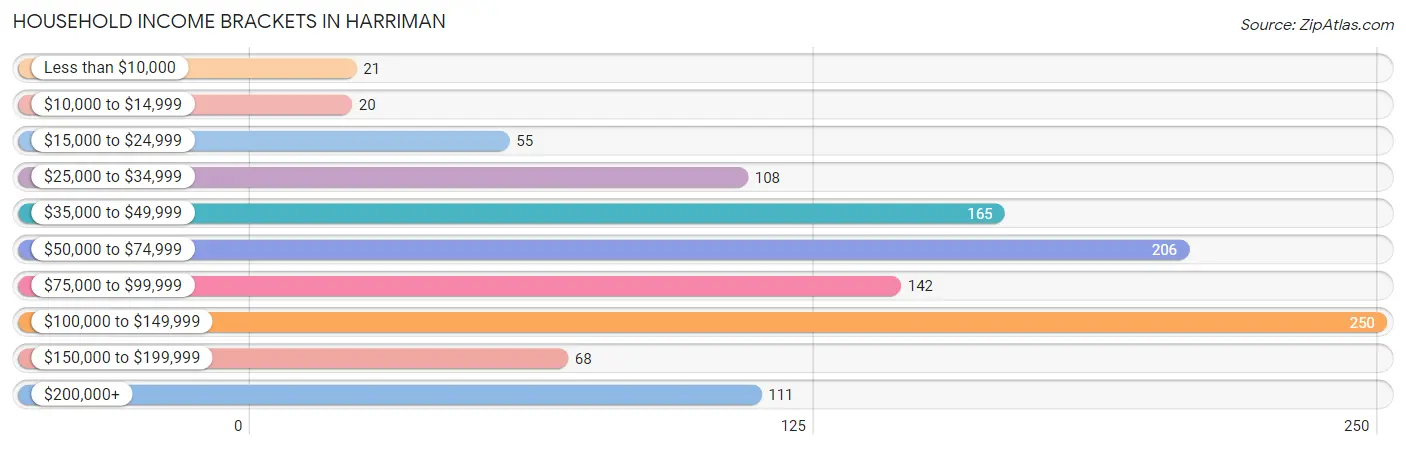
| Income Bracket | # Households | % Households |
| Less than $10,000 | 21 | 1.8% |
| $10,000 to $14,999 | 20 | 1.7% |
| $15,000 to $24,999 | 55 | 4.8% |
| $25,000 to $34,999 | 108 | 9.4% |
| $35,000 to $49,999 | 165 | 14.4% |
| $50,000 to $74,999 | 206 | 17.9% |
| $75,000 to $99,999 | 142 | 12.4% |
| $100,000 to $149,999 | 250 | 21.8% |
| $150,000 to $199,999 | 68 | 5.9% |
| $200,000+ | 111 | 9.7% |
Household Income by Householder Age in Harriman
The median household income in Harriman is $74,861, with the highest median household income of $93,125 found in the 25 to 44 years age bracket for the primary householder. A total of 471 households (41.0%) fall into this category.
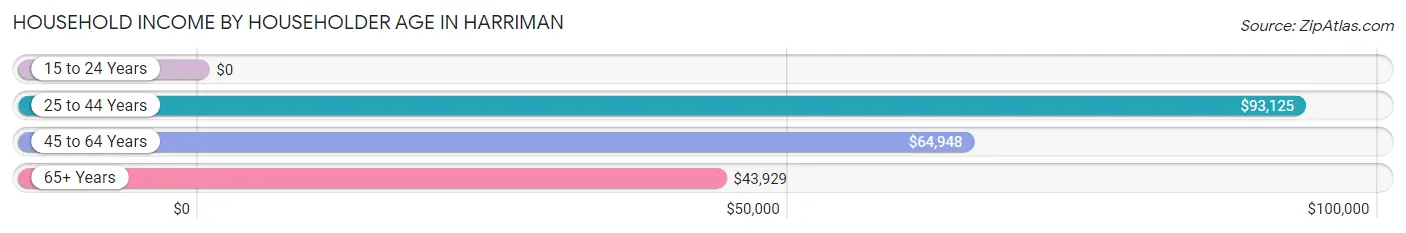
| Income Bracket | # Households | Median Income |
| 15 to 24 Years | 0 (0.0%) | $0 |
| 25 to 44 Years | 471 (41.0%) | $93,125 |
| 45 to 64 Years | 422 (36.7%) | $64,948 |
| 65+ Years | 256 (22.3%) | $43,929 |
| Total | 1,149 (100.0%) | $74,861 |
Poverty in Harriman
Income Below Poverty by Sex and Age in Harriman
With 9.0% poverty level for males and 6.0% for females among the residents of Harriman, 12 to 14 year old males and 25 to 34 year old females are the most vulnerable to poverty, with 23 males (33.3%) and 31 females (16.4%) in their respective age groups living below the poverty level.
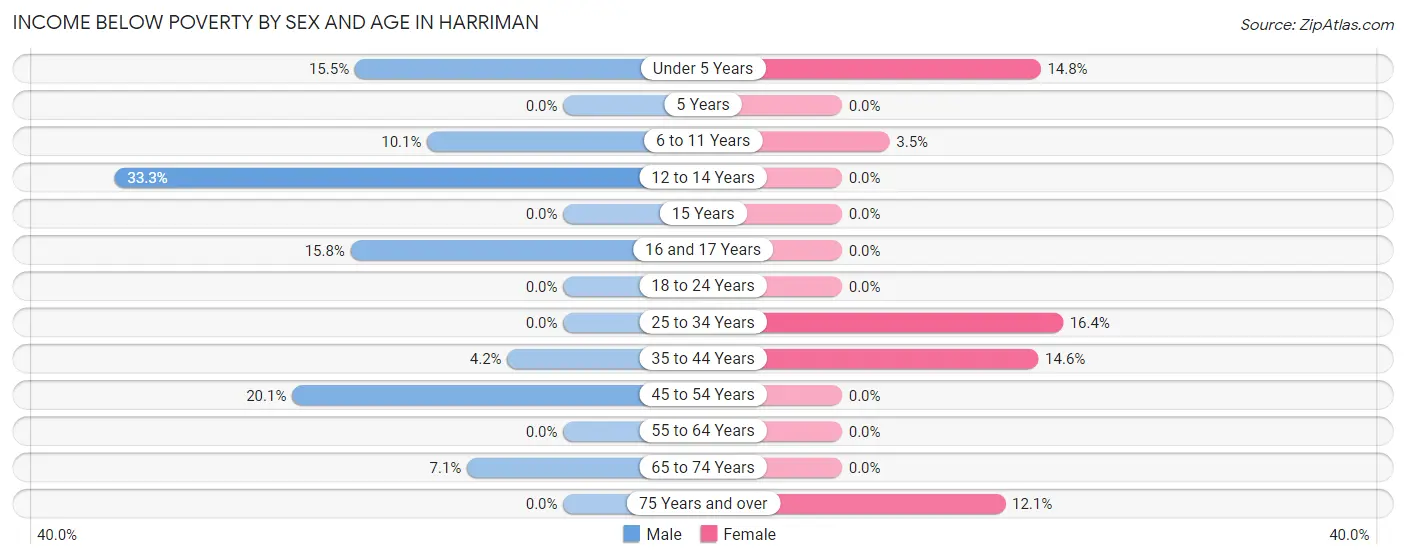
| Age Bracket | Male | Female |
| Under 5 Years | 28 (15.5%) | 9 (14.7%) |
| 5 Years | 0 (0.0%) | 0 (0.0%) |
| 6 to 11 Years | 10 (10.1%) | 6 (3.5%) |
| 12 to 14 Years | 23 (33.3%) | 0 (0.0%) |
| 15 Years | 0 (0.0%) | 0 (0.0%) |
| 16 and 17 Years | 12 (15.8%) | 0 (0.0%) |
| 18 to 24 Years | 0 (0.0%) | 0 (0.0%) |
| 25 to 34 Years | 0 (0.0%) | 31 (16.4%) |
| 35 to 44 Years | 10 (4.2%) | 35 (14.6%) |
| 45 to 54 Years | 32 (20.1%) | 0 (0.0%) |
| 55 to 64 Years | 0 (0.0%) | 0 (0.0%) |
| 65 to 74 Years | 5 (7.1%) | 0 (0.0%) |
| 75 Years and over | 0 (0.0%) | 16 (12.1%) |
| Total | 120 (9.0%) | 97 (6.0%) |
Income Above Poverty by Sex and Age in Harriman
According to the poverty statistics in Harriman, males aged 5 years and females aged 5 years are the age groups that are most secure financially, with 100.0% of males and 100.0% of females in these age groups living above the poverty line.
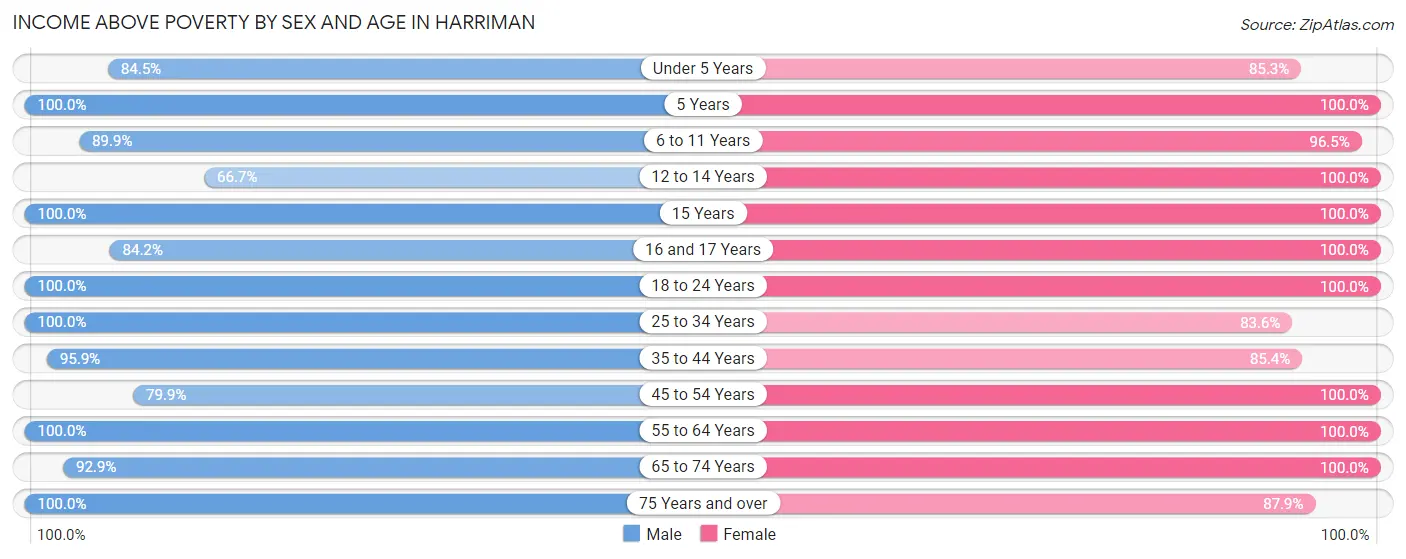
| Age Bracket | Male | Female |
| Under 5 Years | 153 (84.5%) | 52 (85.3%) |
| 5 Years | 35 (100.0%) | 6 (100.0%) |
| 6 to 11 Years | 89 (89.9%) | 164 (96.5%) |
| 12 to 14 Years | 46 (66.7%) | 46 (100.0%) |
| 15 Years | 6 (100.0%) | 47 (100.0%) |
| 16 and 17 Years | 64 (84.2%) | 60 (100.0%) |
| 18 to 24 Years | 48 (100.0%) | 65 (100.0%) |
| 25 to 34 Years | 189 (100.0%) | 158 (83.6%) |
| 35 to 44 Years | 231 (95.9%) | 205 (85.4%) |
| 45 to 54 Years | 127 (79.9%) | 154 (100.0%) |
| 55 to 64 Years | 108 (100.0%) | 308 (100.0%) |
| 65 to 74 Years | 65 (92.9%) | 137 (100.0%) |
| 75 Years and over | 51 (100.0%) | 116 (87.9%) |
| Total | 1,212 (91.0%) | 1,518 (94.0%) |
Income Below Poverty Among Married-Couple Families in Harriman
The poverty statistics for married-couple families in Harriman show that 10.3% or 42 of the total 409 families live below the poverty line. Families with 1 or 2 children have the highest poverty rate of 18.4%, comprising of 32 families. On the other hand, families with no children have the lowest poverty rate of 0.0%, which includes 0 families.
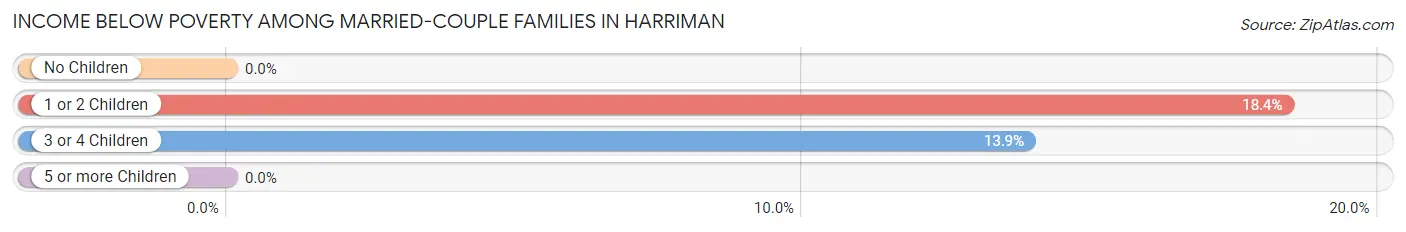
| Children | Above Poverty | Below Poverty |
| No Children | 163 (100.0%) | 0 (0.0%) |
| 1 or 2 Children | 142 (81.6%) | 32 (18.4%) |
| 3 or 4 Children | 62 (86.1%) | 10 (13.9%) |
| 5 or more Children | 0 (0.0%) | 0 (0.0%) |
| Total | 367 (89.7%) | 42 (10.3%) |
Income Below Poverty Among Single-Parent Households in Harriman
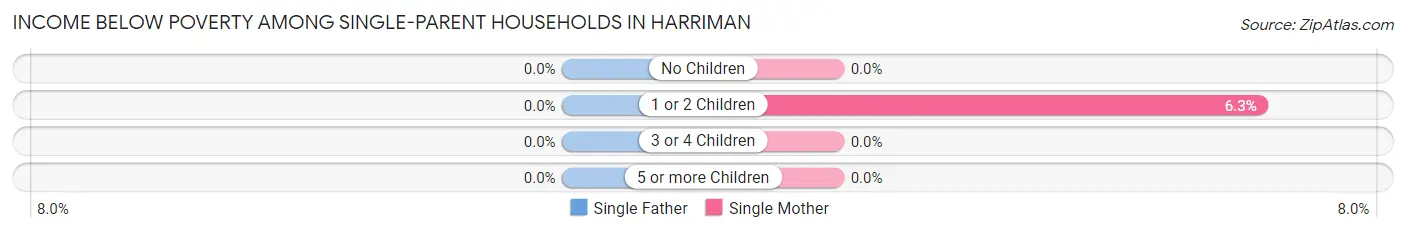
| Children | Single Father | Single Mother |
| No Children | 0 (0.0%) | 0 (0.0%) |
| 1 or 2 Children | 0 (0.0%) | 5 (6.3%) |
| 3 or 4 Children | 0 (0.0%) | 0 (0.0%) |
| 5 or more Children | 0 (0.0%) | 0 (0.0%) |
| Total | 0 (0.0%) | 5 (2.7%) |
Income Below Poverty Among Married-Couple vs Single-Parent Households in Harriman
The poverty data for Harriman shows that 42 of the married-couple family households (10.3%) and 5 of the single-parent households (2.2%) are living below the poverty level. Within the married-couple family households, those with 1 or 2 children have the highest poverty rate, with 32 households (18.4%) falling below the poverty line. Among the single-parent households, those with 1 or 2 children have the highest poverty rate, with 5 household (6.3%) living below poverty.
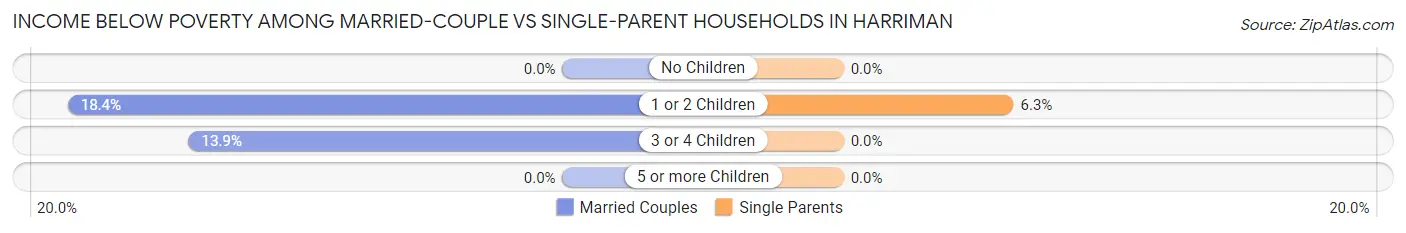
| Children | Married-Couple Families | Single-Parent Households |
| No Children | 0 (0.0%) | 0 (0.0%) |
| 1 or 2 Children | 32 (18.4%) | 5 (6.3%) |
| 3 or 4 Children | 10 (13.9%) | 0 (0.0%) |
| 5 or more Children | 0 (0.0%) | 0 (0.0%) |
| Total | 42 (10.3%) | 5 (2.2%) |
Employment Characteristics in Harriman
Employment by Class of Employer in Harriman
Among the 1,459 employed individuals in Harriman, private company employees (1,009 | 69.2%), local government employees (101 | 6.9%), and state government employees (88 | 6.0%) make up the most common classes of employment.
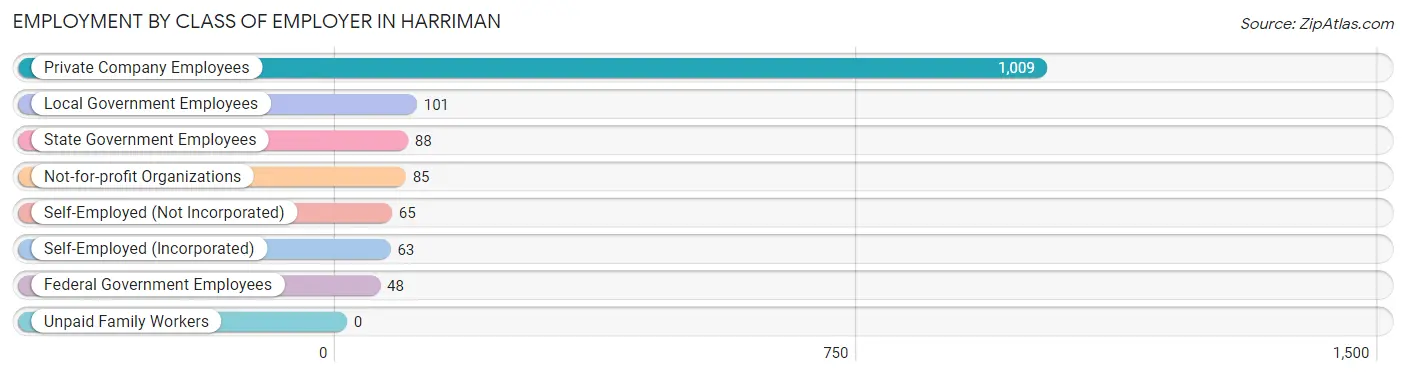
| Employer Class | # Employees | % Employees |
| Private Company Employees | 1,009 | 69.2% |
| Self-Employed (Incorporated) | 63 | 4.3% |
| Self-Employed (Not Incorporated) | 65 | 4.5% |
| Not-for-profit Organizations | 85 | 5.8% |
| Local Government Employees | 101 | 6.9% |
| State Government Employees | 88 | 6.0% |
| Federal Government Employees | 48 | 3.3% |
| Unpaid Family Workers | 0 | 0.0% |
| Total | 1,459 | 100.0% |
Employment Status by Age in Harriman
According to the labor force statistics for Harriman, out of the total population over 16 years of age (2,227), 70.9% or 1,579 individuals are in the labor force, with 5.3% or 84 of them unemployed. The age group with the highest labor force participation rate is 20 to 24 years, with 100.0% or 87 individuals in the labor force. Within the labor force, the 16 to 19 years age range has the highest percentage of unemployed individuals, with 60.3% or 35 of them being unemployed.
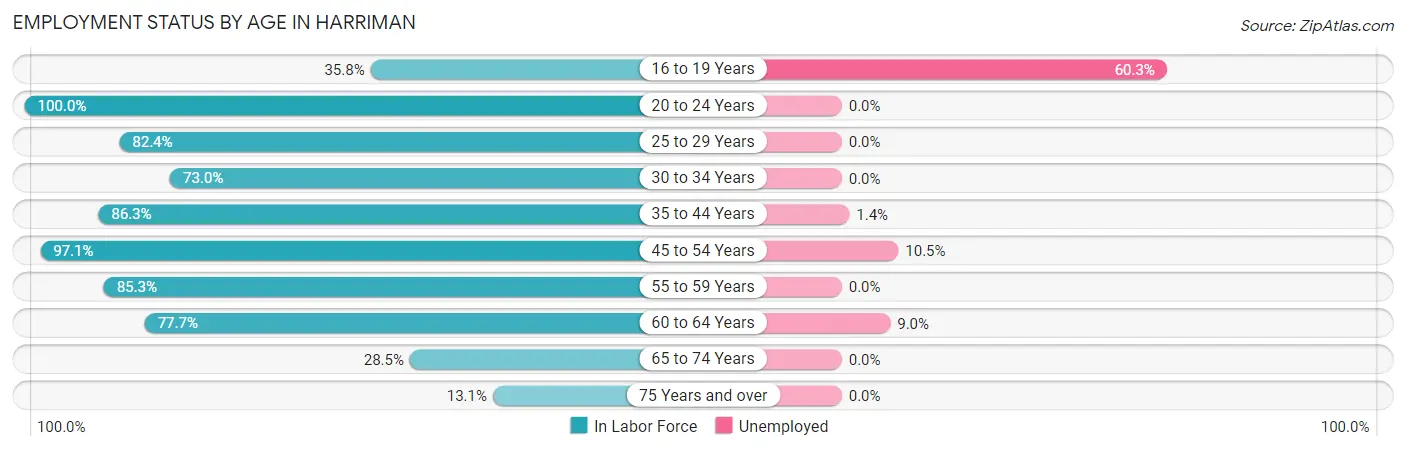
| Age Bracket | In Labor Force | Unemployed |
| 16 to 19 Years | 58 (35.8%) | 35 (60.3%) |
| 20 to 24 Years | 87 (100.0%) | 0 (0.0%) |
| 25 to 29 Years | 122 (82.4%) | 0 (0.0%) |
| 30 to 34 Years | 168 (73.0%) | 0 (0.0%) |
| 35 to 44 Years | 415 (86.3%) | 6 (1.4%) |
| 45 to 54 Years | 304 (97.1%) | 32 (10.5%) |
| 55 to 59 Years | 221 (85.3%) | 0 (0.0%) |
| 60 to 64 Years | 122 (77.7%) | 11 (9.0%) |
| 65 to 74 Years | 59 (28.5%) | 0 (0.0%) |
| 75 Years and over | 24 (13.1%) | 0 (0.0%) |
| Total | 1,579 (70.9%) | 84 (5.3%) |
Employment Status by Educational Attainment in Harriman
According to labor force statistics for Harriman, 85.1% of individuals (1,351) out of the total population between 25 and 64 years of age (1,588) are in the labor force, with 3.6% or 49 of them being unemployed. The group with the highest labor force participation rate are those with the educational attainment of bachelor's degree or higher, with 98.4% or 487 individuals in the labor force. Within the labor force, individuals with bachelor's degree or higher education have the highest percentage of unemployment, with 7.4% or 36 of them being unemployed.
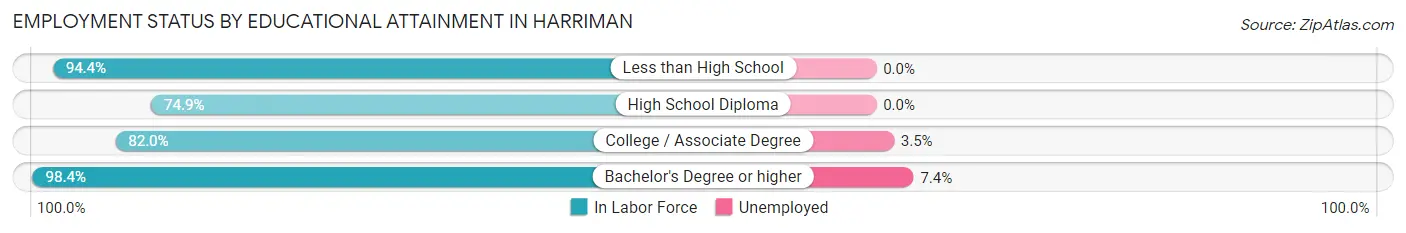
| Educational Attainment | In Labor Force | Unemployed |
| Less than High School | 68 (94.4%) | 0 (0.0%) |
| High School Diploma | 424 (74.9%) | 0 (0.0%) |
| College / Associate Degree | 373 (82.0%) | 16 (3.5%) |
| Bachelor's Degree or higher | 487 (98.4%) | 37 (7.4%) |
| Total | 1,351 (85.1%) | 57 (3.6%) |
Employment Occupations by Sex in Harriman
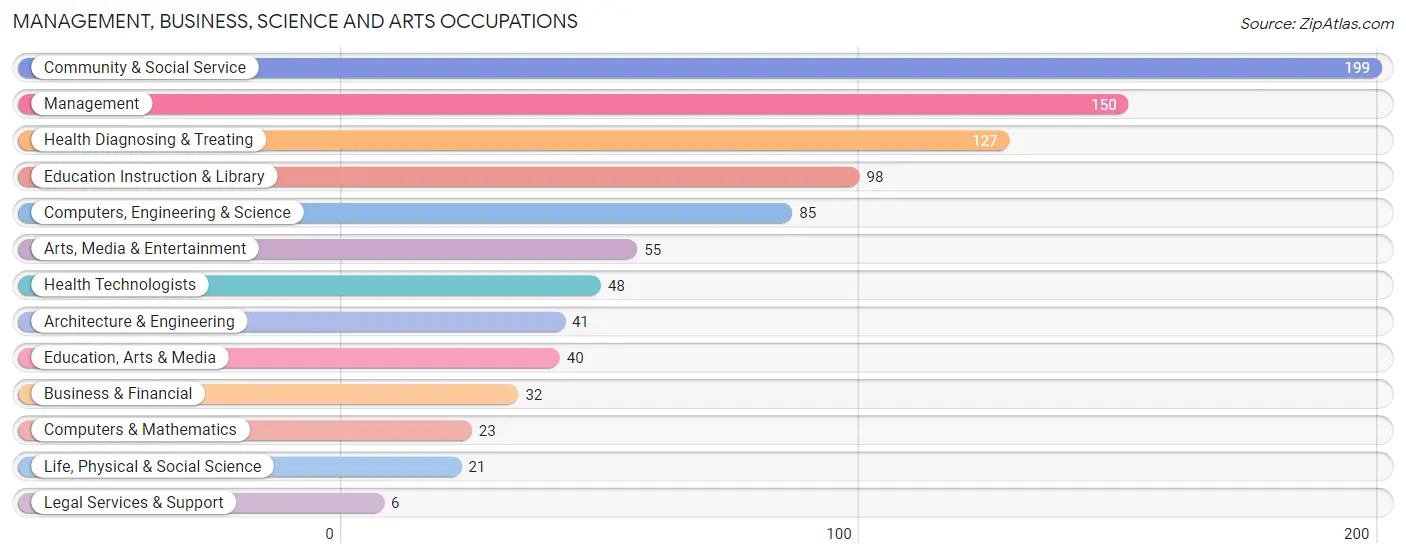
Management, Business, Science and Arts Occupations
The most common Management, Business, Science and Arts occupations in Harriman are Community & Social Service (199 | 13.3%), Management (150 | 10.0%), Health Diagnosing & Treating (127 | 8.5%), Education Instruction & Library (98 | 6.6%), and Computers, Engineering & Science (85 | 5.7%).
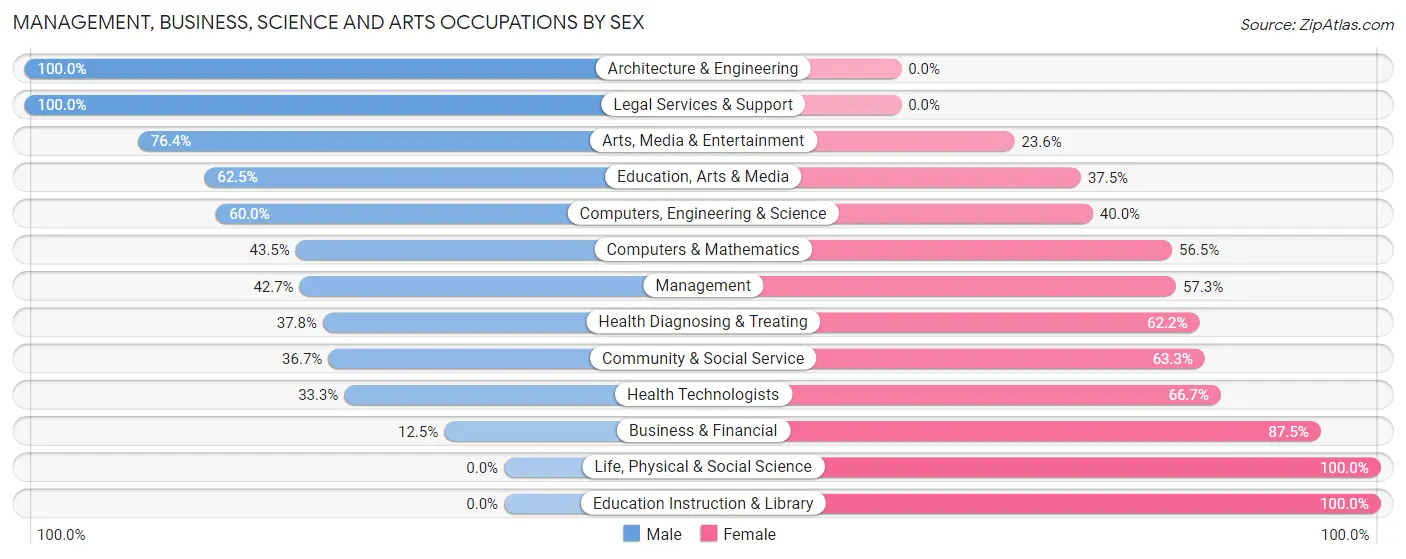
Management, Business, Science and Arts Occupations by Sex
Within the Management, Business, Science and Arts occupations in Harriman, the most male-oriented occupations are Architecture & Engineering (100.0%), Legal Services & Support (100.0%), and Arts, Media & Entertainment (76.4%), while the most female-oriented occupations are Life, Physical & Social Science (100.0%), Education Instruction & Library (100.0%), and Business & Financial (87.5%).
| Occupation | Male | Female |
| Management | 64 (42.7%) | 86 (57.3%) |
| Business & Financial | 4 (12.5%) | 28 (87.5%) |
| Computers, Engineering & Science | 51 (60.0%) | 34 (40.0%) |
| Computers & Mathematics | 10 (43.5%) | 13 (56.5%) |
| Architecture & Engineering | 41 (100.0%) | 0 (0.0%) |
| Life, Physical & Social Science | 0 (0.0%) | 21 (100.0%) |
| Community & Social Service | 73 (36.7%) | 126 (63.3%) |
| Education, Arts & Media | 25 (62.5%) | 15 (37.5%) |
| Legal Services & Support | 6 (100.0%) | 0 (0.0%) |
| Education Instruction & Library | 0 (0.0%) | 98 (100.0%) |
| Arts, Media & Entertainment | 42 (76.4%) | 13 (23.6%) |
| Health Diagnosing & Treating | 48 (37.8%) | 79 (62.2%) |
| Health Technologists | 16 (33.3%) | 32 (66.7%) |
| Total (Category) | 240 (40.5%) | 353 (59.5%) |
| Total (Overall) | 667 (44.6%) | 829 (55.4%) |
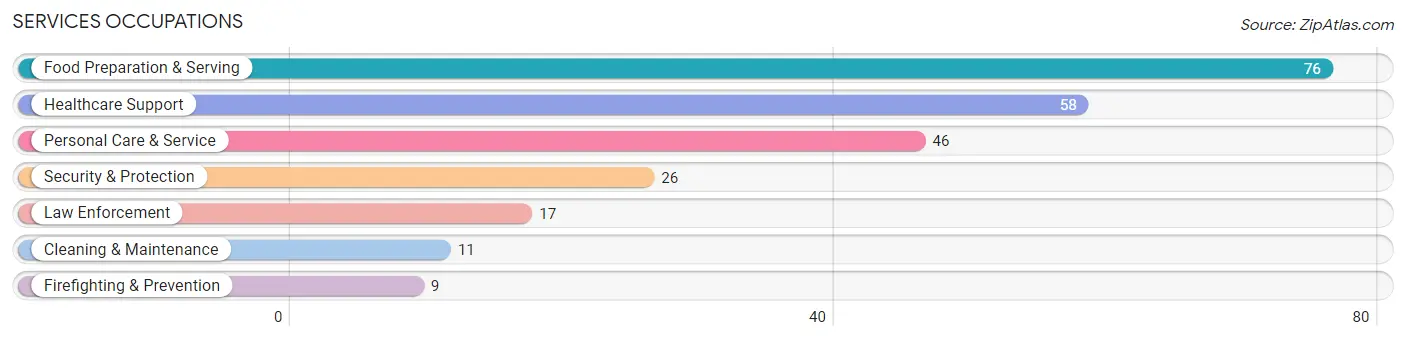
Services Occupations
The most common Services occupations in Harriman are Food Preparation & Serving (76 | 5.1%), Healthcare Support (58 | 3.9%), Personal Care & Service (46 | 3.1%), Security & Protection (26 | 1.7%), and Law Enforcement (17 | 1.1%).
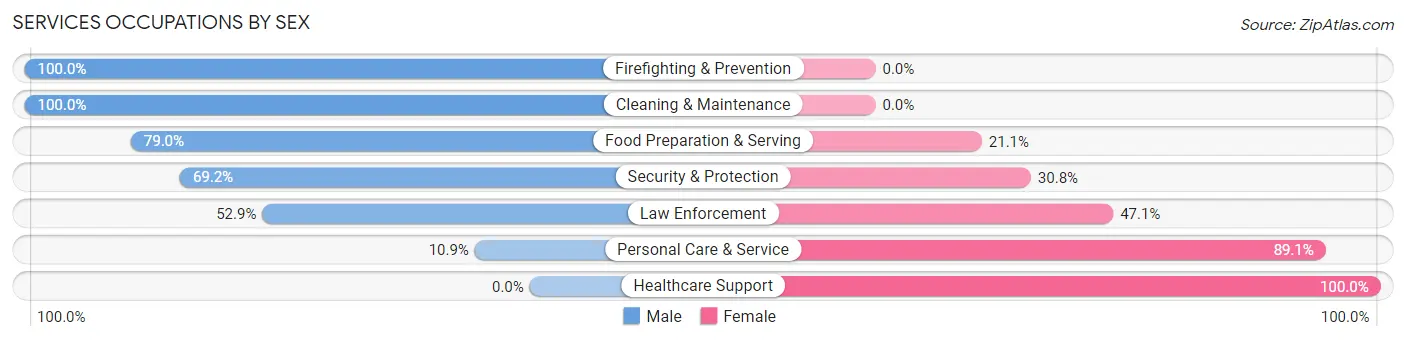
Services Occupations by Sex
Within the Services occupations in Harriman, the most male-oriented occupations are Firefighting & Prevention (100.0%), Cleaning & Maintenance (100.0%), and Food Preparation & Serving (78.9%), while the most female-oriented occupations are Healthcare Support (100.0%), Personal Care & Service (89.1%), and Law Enforcement (47.1%).
| Occupation | Male | Female |
| Healthcare Support | 0 (0.0%) | 58 (100.0%) |
| Security & Protection | 18 (69.2%) | 8 (30.8%) |
| Firefighting & Prevention | 9 (100.0%) | 0 (0.0%) |
| Law Enforcement | 9 (52.9%) | 8 (47.1%) |
| Food Preparation & Serving | 60 (78.9%) | 16 (21.0%) |
| Cleaning & Maintenance | 11 (100.0%) | 0 (0.0%) |
| Personal Care & Service | 5 (10.9%) | 41 (89.1%) |
| Total (Category) | 94 (43.3%) | 123 (56.7%) |
| Total (Overall) | 667 (44.6%) | 829 (55.4%) |
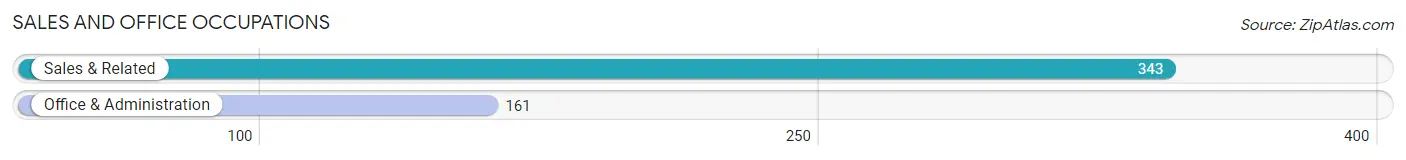
Sales and Office Occupations
The most common Sales and Office occupations in Harriman are Sales & Related (343 | 22.9%), and Office & Administration (161 | 10.8%).
Sales and Office Occupations by Sex
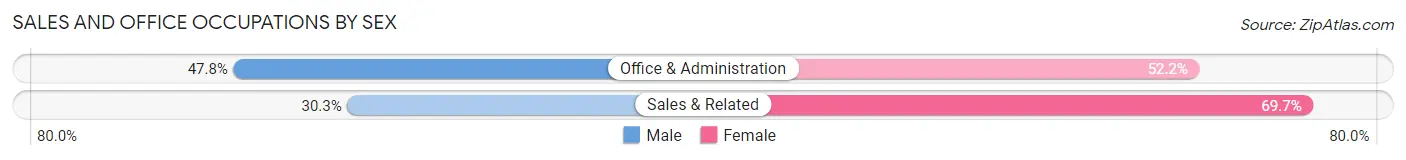
| Occupation | Male | Female |
| Sales & Related | 104 (30.3%) | 239 (69.7%) |
| Office & Administration | 77 (47.8%) | 84 (52.2%) |
| Total (Category) | 181 (35.9%) | 323 (64.1%) |
| Total (Overall) | 667 (44.6%) | 829 (55.4%) |
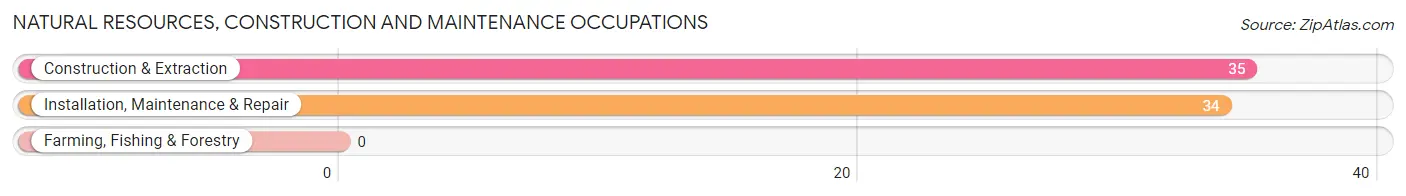
Natural Resources, Construction and Maintenance Occupations
The most common Natural Resources, Construction and Maintenance occupations in Harriman are Construction & Extraction (35 | 2.3%), and Installation, Maintenance & Repair (34 | 2.3%).
Natural Resources, Construction and Maintenance Occupations by Sex
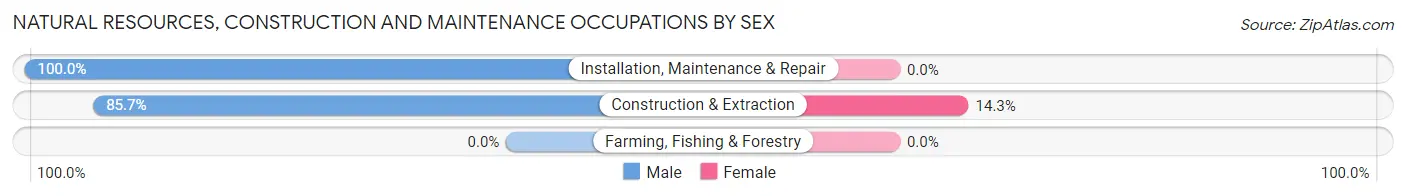
| Occupation | Male | Female |
| Farming, Fishing & Forestry | 0 (0.0%) | 0 (0.0%) |
| Construction & Extraction | 30 (85.7%) | 5 (14.3%) |
| Installation, Maintenance & Repair | 34 (100.0%) | 0 (0.0%) |
| Total (Category) | 64 (92.7%) | 5 (7.2%) |
| Total (Overall) | 667 (44.6%) | 829 (55.4%) |
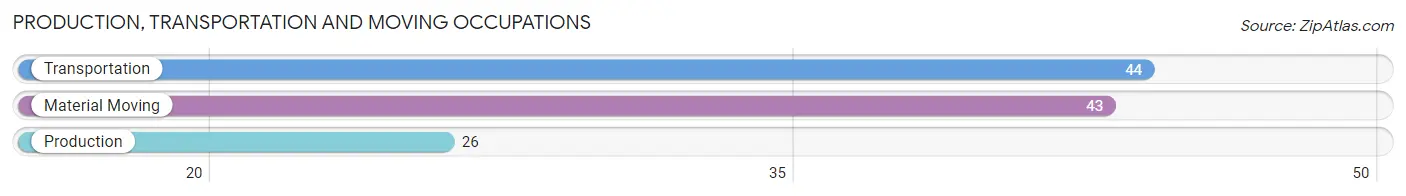
Production, Transportation and Moving Occupations
The most common Production, Transportation and Moving occupations in Harriman are Transportation (44 | 2.9%), Material Moving (43 | 2.9%), and Production (26 | 1.7%).
Production, Transportation and Moving Occupations by Sex
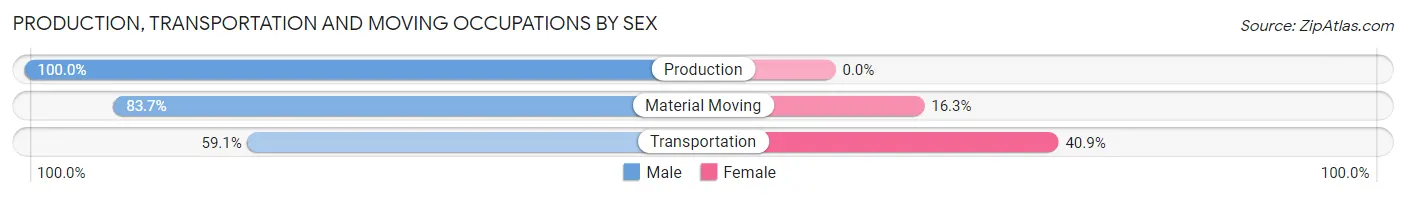
| Occupation | Male | Female |
| Production | 26 (100.0%) | 0 (0.0%) |
| Transportation | 26 (59.1%) | 18 (40.9%) |
| Material Moving | 36 (83.7%) | 7 (16.3%) |
| Total (Category) | 88 (77.9%) | 25 (22.1%) |
| Total (Overall) | 667 (44.6%) | 829 (55.4%) |
Employment Industries by Sex in Harriman
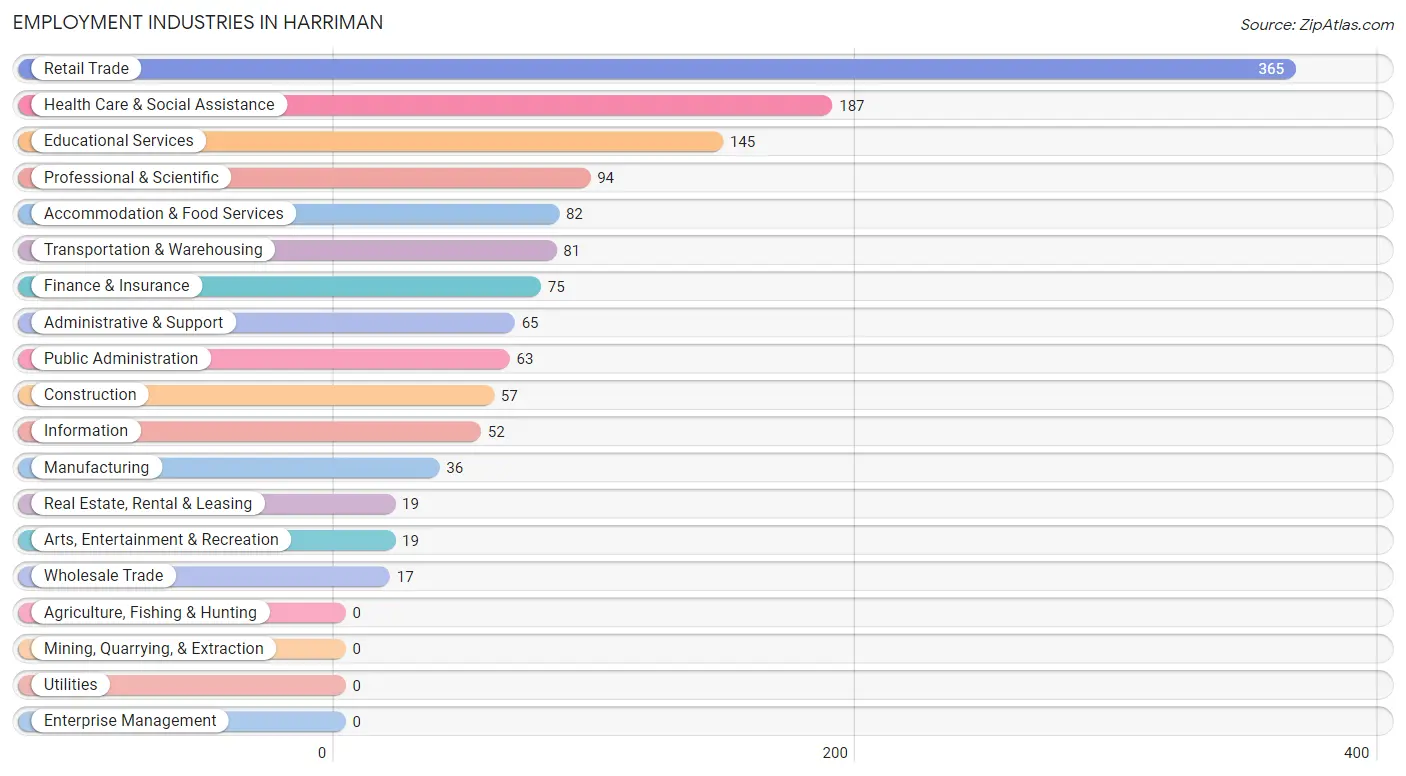
Employment Industries in Harriman
The major employment industries in Harriman include Retail Trade (365 | 24.4%), Health Care & Social Assistance (187 | 12.5%), Educational Services (145 | 9.7%), Professional & Scientific (94 | 6.3%), and Accommodation & Food Services (82 | 5.5%).
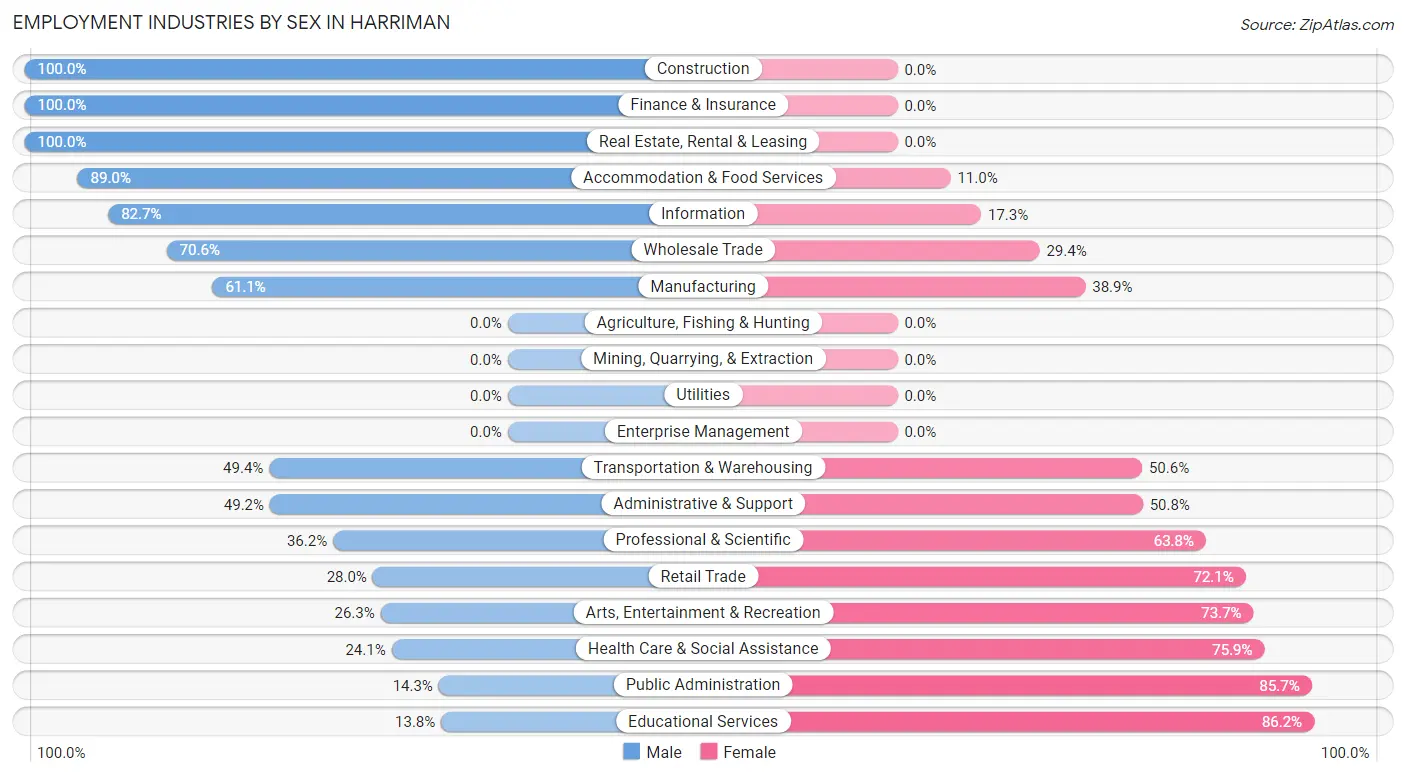
Employment Industries by Sex in Harriman
The Harriman industries that see more men than women are Construction (100.0%), Finance & Insurance (100.0%), and Real Estate, Rental & Leasing (100.0%), whereas the industries that tend to have a higher number of women are Educational Services (86.2%), Public Administration (85.7%), and Health Care & Social Assistance (75.9%).
| Industry | Male | Female |
| Agriculture, Fishing & Hunting | 0 (0.0%) | 0 (0.0%) |
| Mining, Quarrying, & Extraction | 0 (0.0%) | 0 (0.0%) |
| Construction | 57 (100.0%) | 0 (0.0%) |
| Manufacturing | 22 (61.1%) | 14 (38.9%) |
| Wholesale Trade | 12 (70.6%) | 5 (29.4%) |
| Retail Trade | 102 (28.0%) | 263 (72.1%) |
| Transportation & Warehousing | 40 (49.4%) | 41 (50.6%) |
| Utilities | 0 (0.0%) | 0 (0.0%) |
| Information | 43 (82.7%) | 9 (17.3%) |
| Finance & Insurance | 75 (100.0%) | 0 (0.0%) |
| Real Estate, Rental & Leasing | 19 (100.0%) | 0 (0.0%) |
| Professional & Scientific | 34 (36.2%) | 60 (63.8%) |
| Enterprise Management | 0 (0.0%) | 0 (0.0%) |
| Administrative & Support | 32 (49.2%) | 33 (50.8%) |
| Educational Services | 20 (13.8%) | 125 (86.2%) |
| Health Care & Social Assistance | 45 (24.1%) | 142 (75.9%) |
| Arts, Entertainment & Recreation | 5 (26.3%) | 14 (73.7%) |
| Accommodation & Food Services | 73 (89.0%) | 9 (11.0%) |
| Public Administration | 9 (14.3%) | 54 (85.7%) |
| Total | 667 (44.6%) | 829 (55.4%) |
Education in Harriman
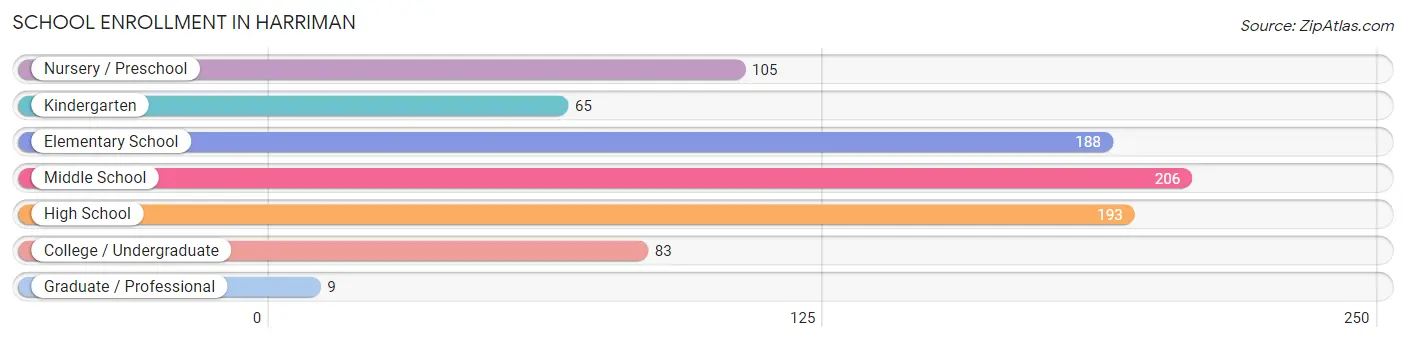
School Enrollment in Harriman
The most common levels of schooling among the 849 students in Harriman are middle school (206 | 24.3%), high school (193 | 22.7%), and elementary school (188 | 22.1%).
| School Level | # Students | % Students |
| Nursery / Preschool | 105 | 12.4% |
| Kindergarten | 65 | 7.7% |
| Elementary School | 188 | 22.1% |
| Middle School | 206 | 24.3% |
| High School | 193 | 22.7% |
| College / Undergraduate | 83 | 9.8% |
| Graduate / Professional | 9 | 1.1% |
| Total | 849 | 100.0% |
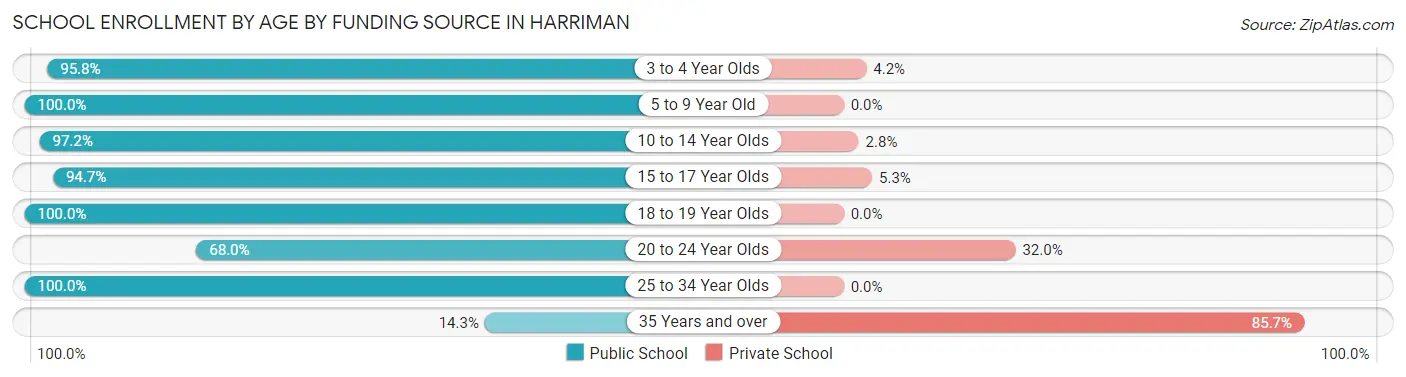
School Enrollment by Age by Funding Source in Harriman
Out of a total of 849 students who are enrolled in schools in Harriman, 54 (6.4%) attend a private institution, while the remaining 795 (93.6%) are enrolled in public schools. The age group of 35 years and over has the highest likelihood of being enrolled in private schools, with 24 (85.7% in the age bracket) enrolled. Conversely, the age group of 5 to 9 year old has the lowest likelihood of being enrolled in a private school, with 211 (100.0% in the age bracket) attending a public institution.
| Age Bracket | Public School | Private School |
| 3 to 4 Year Olds | 136 (95.8%) | 6 (4.2%) |
| 5 to 9 Year Old | 211 (100.0%) | 0 (0.0%) |
| 10 to 14 Year Olds | 209 (97.2%) | 6 (2.8%) |
| 15 to 17 Year Olds | 179 (94.7%) | 10 (5.3%) |
| 18 to 19 Year Olds | 15 (100.0%) | 0 (0.0%) |
| 20 to 24 Year Olds | 17 (68.0%) | 8 (32.0%) |
| 25 to 34 Year Olds | 24 (100.0%) | 0 (0.0%) |
| 35 Years and over | 4 (14.3%) | 24 (85.7%) |
| Total | 795 (93.6%) | 54 (6.4%) |
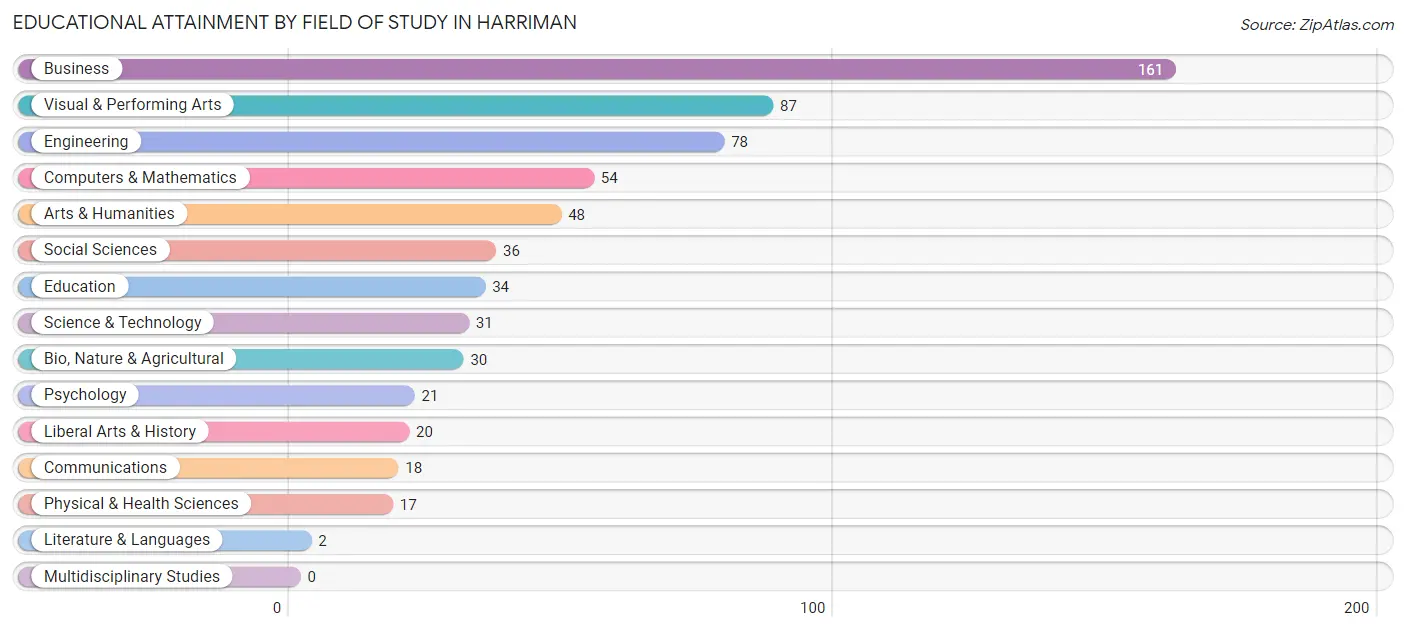
Educational Attainment by Field of Study in Harriman
Business (161 | 25.3%), visual & performing arts (87 | 13.7%), engineering (78 | 12.2%), computers & mathematics (54 | 8.5%), and arts & humanities (48 | 7.5%) are the most common fields of study among 637 individuals in Harriman who have obtained a bachelor's degree or higher.
| Field of Study | # Graduates | % Graduates |
| Computers & Mathematics | 54 | 8.5% |
| Bio, Nature & Agricultural | 30 | 4.7% |
| Physical & Health Sciences | 17 | 2.7% |
| Psychology | 21 | 3.3% |
| Social Sciences | 36 | 5.7% |
| Engineering | 78 | 12.2% |
| Multidisciplinary Studies | 0 | 0.0% |
| Science & Technology | 31 | 4.9% |
| Business | 161 | 25.3% |
| Education | 34 | 5.3% |
| Literature & Languages | 2 | 0.3% |
| Liberal Arts & History | 20 | 3.1% |
| Visual & Performing Arts | 87 | 13.7% |
| Communications | 18 | 2.8% |
| Arts & Humanities | 48 | 7.5% |
| Total | 637 | 100.0% |
Transportation & Commute in Harriman
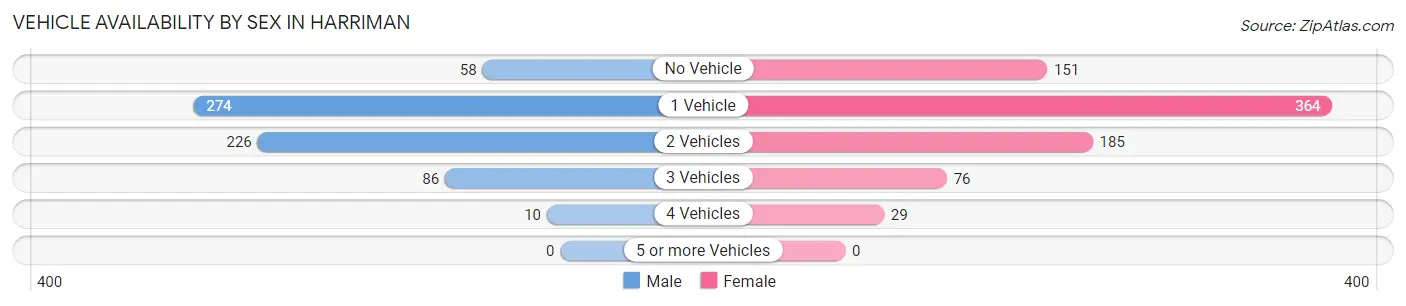
Vehicle Availability by Sex in Harriman
The most prevalent vehicle ownership categories in Harriman are males with 1 vehicle (274, accounting for 41.9%) and females with 1 vehicle (364, making up 34.0%).
| Vehicles Available | Male | Female |
| No Vehicle | 58 (8.9%) | 151 (18.8%) |
| 1 Vehicle | 274 (41.9%) | 364 (45.2%) |
| 2 Vehicles | 226 (34.6%) | 185 (23.0%) |
| 3 Vehicles | 86 (13.2%) | 76 (9.4%) |
| 4 Vehicles | 10 (1.5%) | 29 (3.6%) |
| 5 or more Vehicles | 0 (0.0%) | 0 (0.0%) |
| Total | 654 (100.0%) | 805 (100.0%) |
Commute Time in Harriman
The most frequently occuring commute durations in Harriman are 5 to 9 minutes (241 commuters, 17.9%), 30 to 34 minutes (194 commuters, 14.4%), and 90 or more minutes (186 commuters, 13.8%).
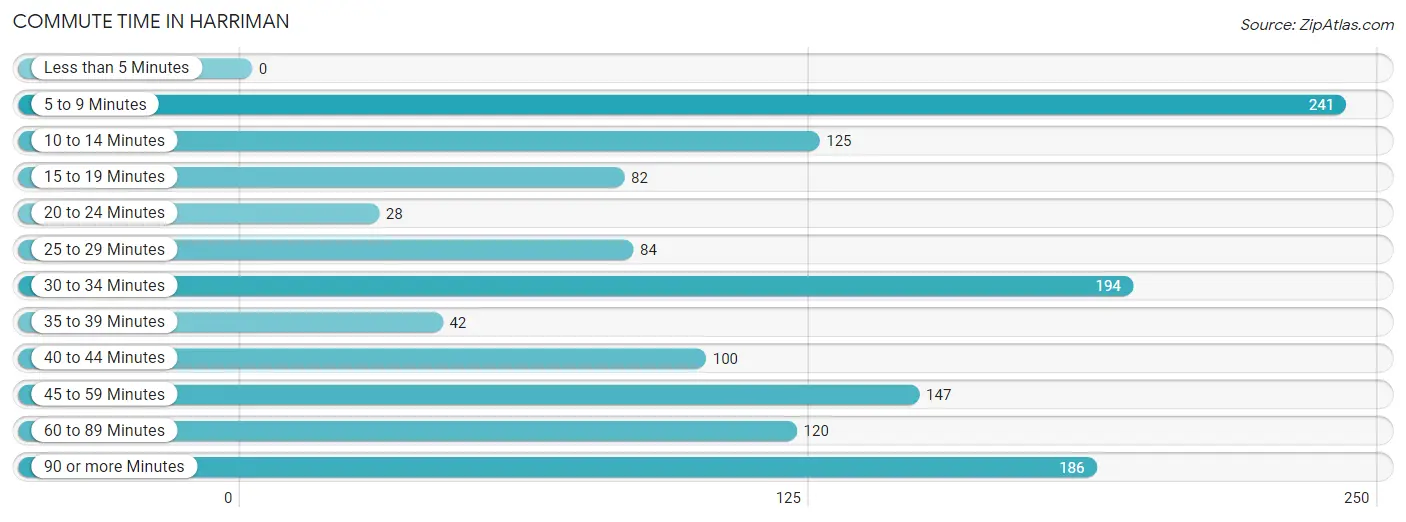
| Commute Time | # Commuters | % Commuters |
| Less than 5 Minutes | 0 | 0.0% |
| 5 to 9 Minutes | 241 | 17.9% |
| 10 to 14 Minutes | 125 | 9.3% |
| 15 to 19 Minutes | 82 | 6.1% |
| 20 to 24 Minutes | 28 | 2.1% |
| 25 to 29 Minutes | 84 | 6.2% |
| 30 to 34 Minutes | 194 | 14.4% |
| 35 to 39 Minutes | 42 | 3.1% |
| 40 to 44 Minutes | 100 | 7.4% |
| 45 to 59 Minutes | 147 | 10.9% |
| 60 to 89 Minutes | 120 | 8.9% |
| 90 or more Minutes | 186 | 13.8% |
Commute Time by Sex in Harriman
The most common commute times in Harriman are 90 or more minutes (118 commuters, 19.0%) for males and 5 to 9 minutes (195 commuters, 26.8%) for females.
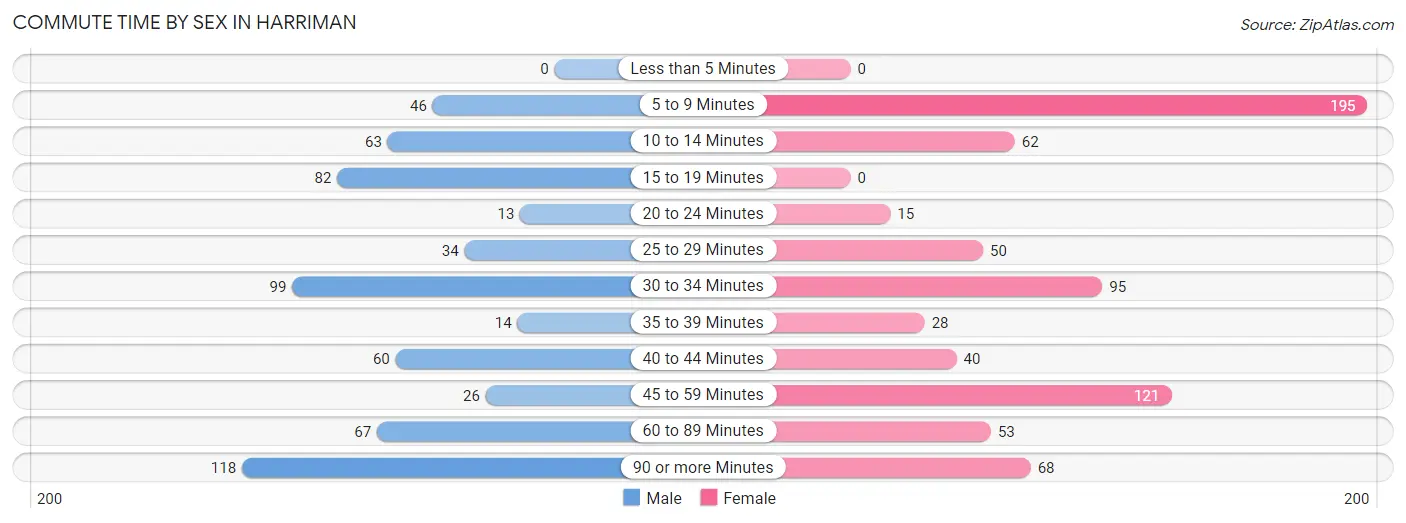
| Commute Time | Male | Female |
| Less than 5 Minutes | 0 (0.0%) | 0 (0.0%) |
| 5 to 9 Minutes | 46 (7.4%) | 195 (26.8%) |
| 10 to 14 Minutes | 63 (10.1%) | 62 (8.5%) |
| 15 to 19 Minutes | 82 (13.2%) | 0 (0.0%) |
| 20 to 24 Minutes | 13 (2.1%) | 15 (2.1%) |
| 25 to 29 Minutes | 34 (5.5%) | 50 (6.9%) |
| 30 to 34 Minutes | 99 (15.9%) | 95 (13.1%) |
| 35 to 39 Minutes | 14 (2.2%) | 28 (3.8%) |
| 40 to 44 Minutes | 60 (9.7%) | 40 (5.5%) |
| 45 to 59 Minutes | 26 (4.2%) | 121 (16.6%) |
| 60 to 89 Minutes | 67 (10.8%) | 53 (7.3%) |
| 90 or more Minutes | 118 (19.0%) | 68 (9.3%) |
Time of Departure to Work by Sex in Harriman
The most frequent times of departure to work in Harriman are 7:30 AM to 7:59 AM (148, 23.8%) for males and 9:00 AM to 9:59 AM (143, 19.7%) for females.
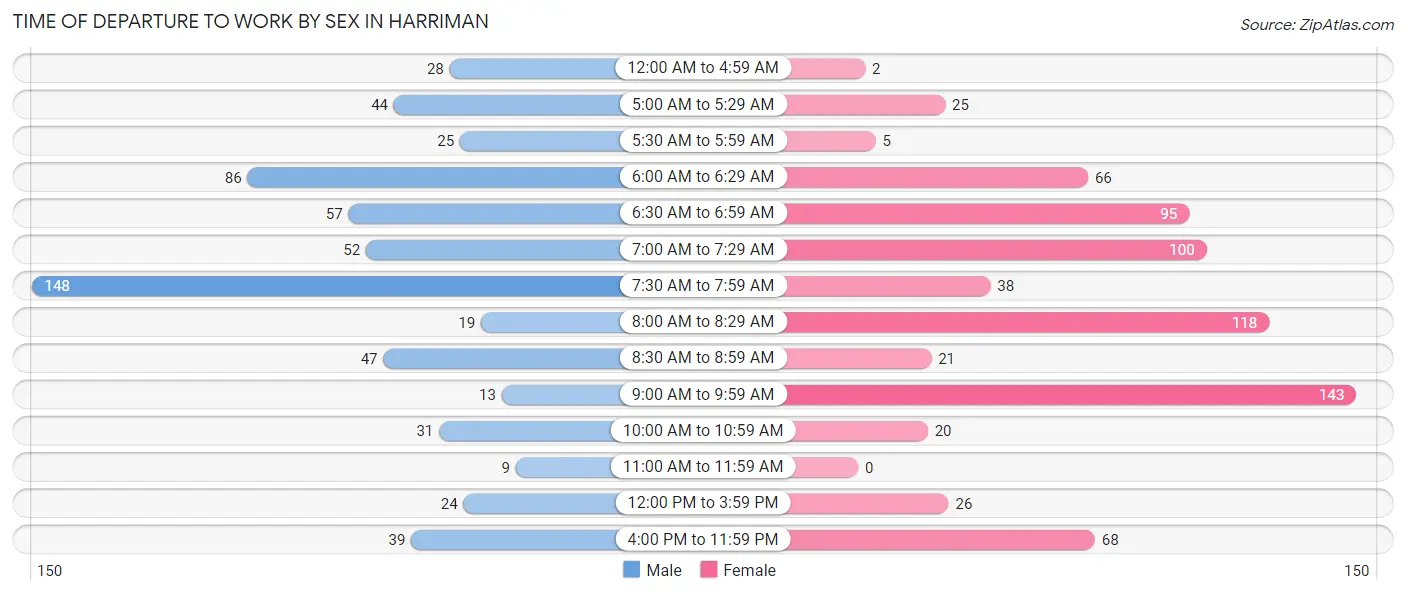
| Time of Departure | Male | Female |
| 12:00 AM to 4:59 AM | 28 (4.5%) | 2 (0.3%) |
| 5:00 AM to 5:29 AM | 44 (7.1%) | 25 (3.4%) |
| 5:30 AM to 5:59 AM | 25 (4.0%) | 5 (0.7%) |
| 6:00 AM to 6:29 AM | 86 (13.8%) | 66 (9.1%) |
| 6:30 AM to 6:59 AM | 57 (9.2%) | 95 (13.1%) |
| 7:00 AM to 7:29 AM | 52 (8.4%) | 100 (13.8%) |
| 7:30 AM to 7:59 AM | 148 (23.8%) | 38 (5.2%) |
| 8:00 AM to 8:29 AM | 19 (3.0%) | 118 (16.2%) |
| 8:30 AM to 8:59 AM | 47 (7.6%) | 21 (2.9%) |
| 9:00 AM to 9:59 AM | 13 (2.1%) | 143 (19.7%) |
| 10:00 AM to 10:59 AM | 31 (5.0%) | 20 (2.8%) |
| 11:00 AM to 11:59 AM | 9 (1.5%) | 0 (0.0%) |
| 12:00 PM to 3:59 PM | 24 (3.9%) | 26 (3.6%) |
| 4:00 PM to 11:59 PM | 39 (6.3%) | 68 (9.3%) |
| Total | 622 (100.0%) | 727 (100.0%) |
Housing Occupancy in Harriman
Occupancy by Ownership in Harriman
Of the total 1,149 dwellings in Harriman, owner-occupied units account for 562 (48.9%), while renter-occupied units make up 587 (51.1%).
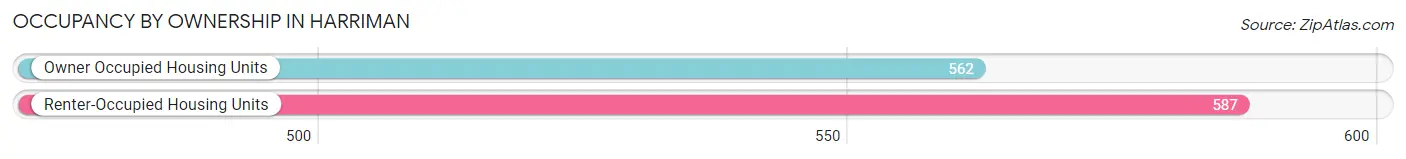
| Occupancy | # Housing Units | % Housing Units |
| Owner Occupied Housing Units | 562 | 48.9% |
| Renter-Occupied Housing Units | 587 | 51.1% |
| Total Occupied Housing Units | 1,149 | 100.0% |
Occupancy by Household Size in Harriman
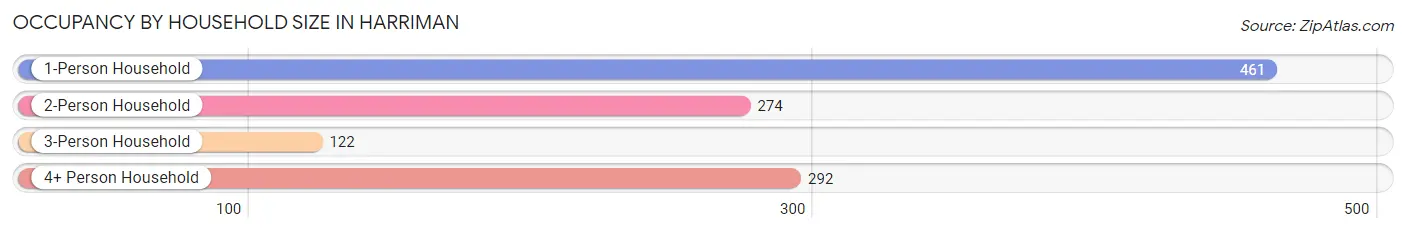
| Household Size | # Housing Units | % Housing Units |
| 1-Person Household | 461 | 40.1% |
| 2-Person Household | 274 | 23.8% |
| 3-Person Household | 122 | 10.6% |
| 4+ Person Household | 292 | 25.4% |
| Total Housing Units | 1,149 | 100.0% |
Occupancy by Ownership by Household Size in Harriman
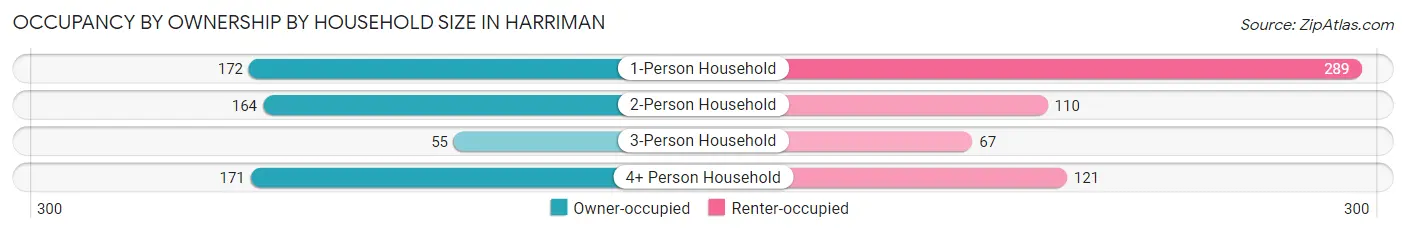
| Household Size | Owner-occupied | Renter-occupied |
| 1-Person Household | 172 (37.3%) | 289 (62.7%) |
| 2-Person Household | 164 (59.9%) | 110 (40.2%) |
| 3-Person Household | 55 (45.1%) | 67 (54.9%) |
| 4+ Person Household | 171 (58.6%) | 121 (41.4%) |
| Total Housing Units | 562 (48.9%) | 587 (51.1%) |
Occupancy by Educational Attainment in Harriman
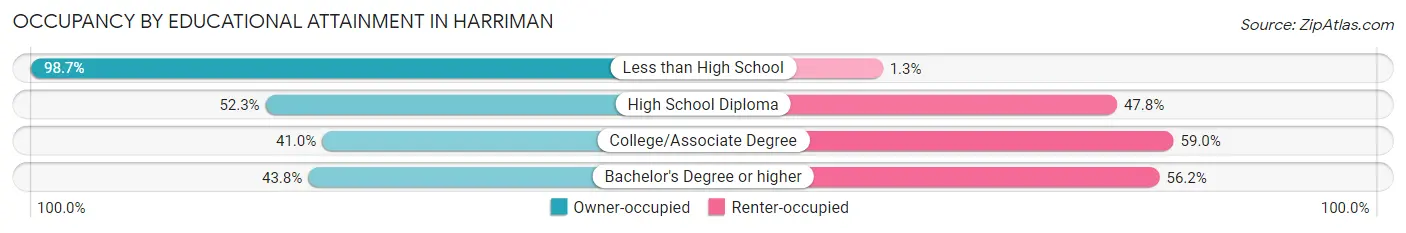
| Household Size | Owner-occupied | Renter-occupied |
| Less than High School | 76 (98.7%) | 1 (1.3%) |
| High School Diploma | 151 (52.2%) | 138 (47.7%) |
| College/Associate Degree | 119 (41.0%) | 171 (59.0%) |
| Bachelor's Degree or higher | 216 (43.8%) | 277 (56.2%) |
Occupancy by Age of Householder in Harriman
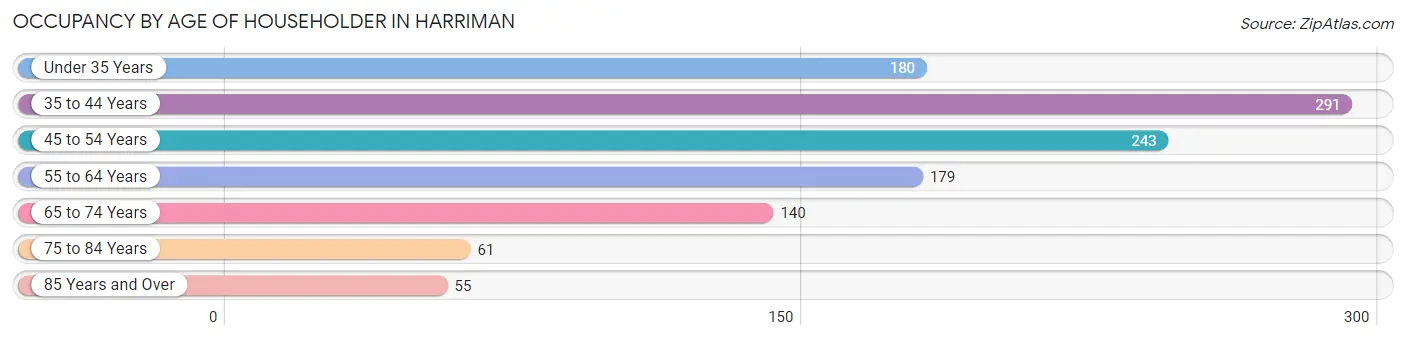
| Age Bracket | # Households | % Households |
| Under 35 Years | 180 | 15.7% |
| 35 to 44 Years | 291 | 25.3% |
| 45 to 54 Years | 243 | 21.1% |
| 55 to 64 Years | 179 | 15.6% |
| 65 to 74 Years | 140 | 12.2% |
| 75 to 84 Years | 61 | 5.3% |
| 85 Years and Over | 55 | 4.8% |
| Total | 1,149 | 100.0% |
Housing Finances in Harriman
Median Income by Occupancy in Harriman
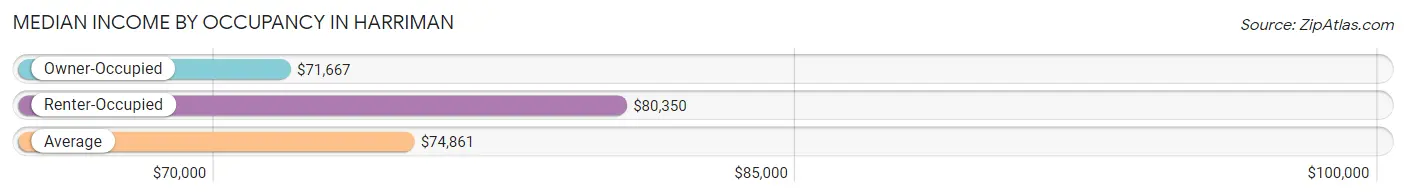
| Occupancy Type | # Households | Median Income |
| Owner-Occupied | 562 (48.9%) | $71,667 |
| Renter-Occupied | 587 (51.1%) | $80,350 |
| Average | 1,149 (100.0%) | $74,861 |
Occupancy by Householder Income Bracket in Harriman
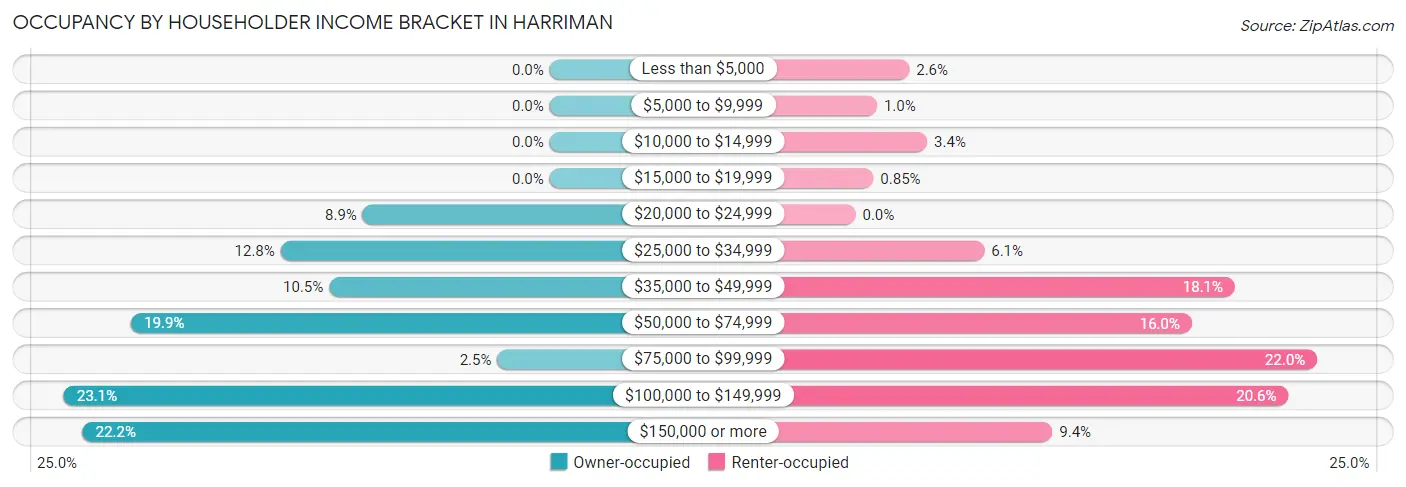
| Income Bracket | Owner-occupied | Renter-occupied |
| Less than $5,000 | 0 (0.0%) | 15 (2.6%) |
| $5,000 to $9,999 | 0 (0.0%) | 6 (1.0%) |
| $10,000 to $14,999 | 0 (0.0%) | 20 (3.4%) |
| $15,000 to $19,999 | 0 (0.0%) | 5 (0.9%) |
| $20,000 to $24,999 | 50 (8.9%) | 0 (0.0%) |
| $25,000 to $34,999 | 72 (12.8%) | 36 (6.1%) |
| $35,000 to $49,999 | 59 (10.5%) | 106 (18.1%) |
| $50,000 to $74,999 | 112 (19.9%) | 94 (16.0%) |
| $75,000 to $99,999 | 14 (2.5%) | 129 (22.0%) |
| $100,000 to $149,999 | 130 (23.1%) | 121 (20.6%) |
| $150,000 or more | 125 (22.2%) | 55 (9.4%) |
| Total | 562 (100.0%) | 587 (100.0%) |
Monthly Housing Cost Tiers in Harriman
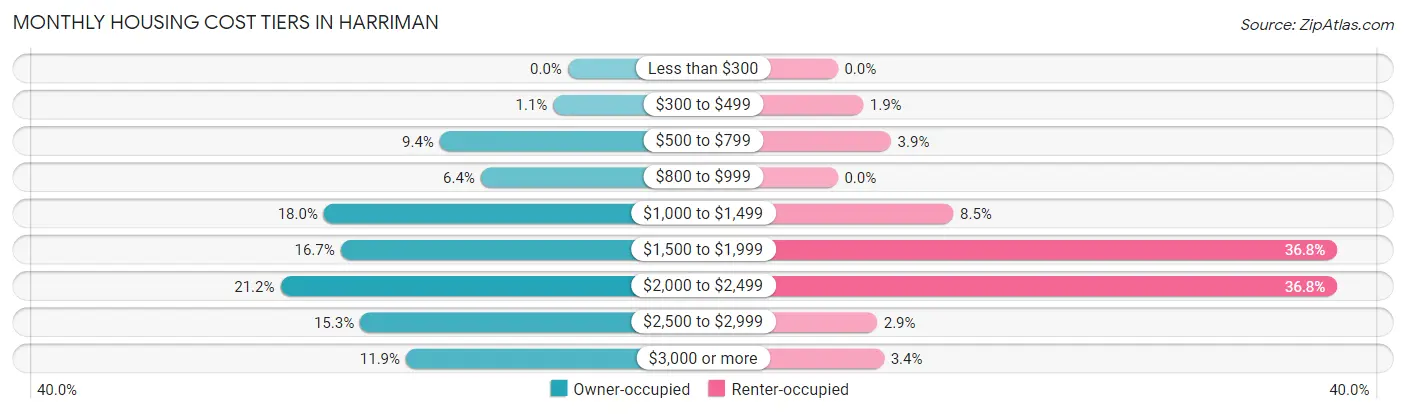
| Monthly Cost | Owner-occupied | Renter-occupied |
| Less than $300 | 0 (0.0%) | 0 (0.0%) |
| $300 to $499 | 6 (1.1%) | 11 (1.9%) |
| $500 to $799 | 53 (9.4%) | 23 (3.9%) |
| $800 to $999 | 36 (6.4%) | 0 (0.0%) |
| $1,000 to $1,499 | 101 (18.0%) | 50 (8.5%) |
| $1,500 to $1,999 | 94 (16.7%) | 216 (36.8%) |
| $2,000 to $2,499 | 119 (21.2%) | 216 (36.8%) |
| $2,500 to $2,999 | 86 (15.3%) | 17 (2.9%) |
| $3,000 or more | 67 (11.9%) | 20 (3.4%) |
| Total | 562 (100.0%) | 587 (100.0%) |
Physical Housing Characteristics in Harriman
Housing Structures in Harriman
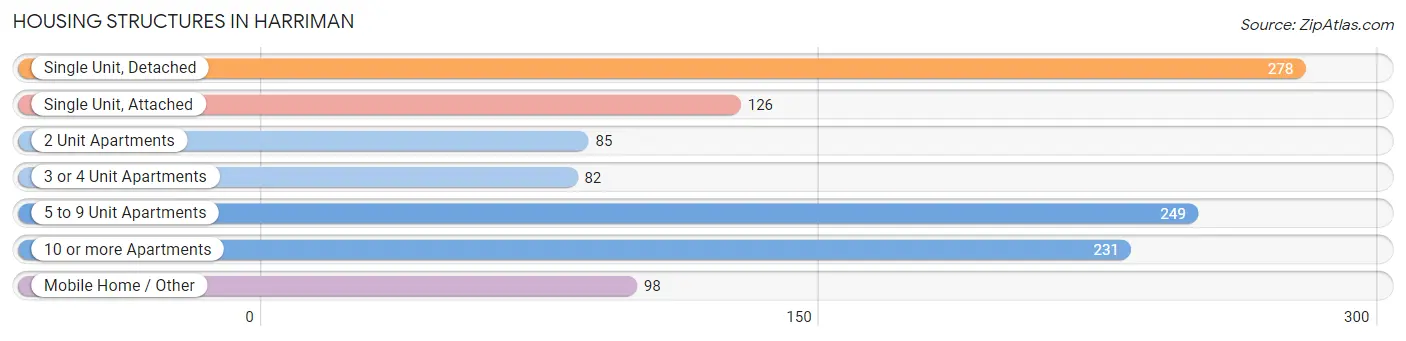
| Structure Type | # Housing Units | % Housing Units |
| Single Unit, Detached | 278 | 24.2% |
| Single Unit, Attached | 126 | 11.0% |
| 2 Unit Apartments | 85 | 7.4% |
| 3 or 4 Unit Apartments | 82 | 7.1% |
| 5 to 9 Unit Apartments | 249 | 21.7% |
| 10 or more Apartments | 231 | 20.1% |
| Mobile Home / Other | 98 | 8.5% |
| Total | 1,149 | 100.0% |
Housing Structures by Occupancy in Harriman
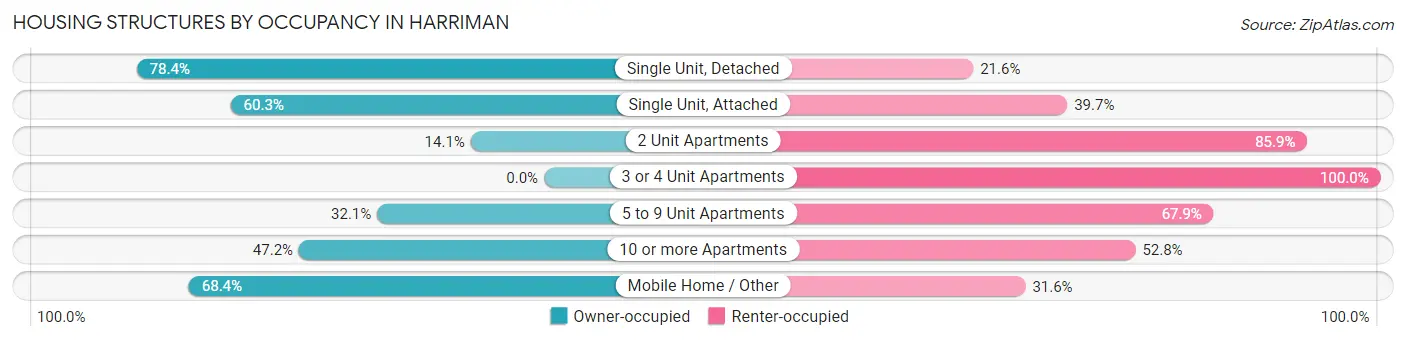
| Structure Type | Owner-occupied | Renter-occupied |
| Single Unit, Detached | 218 (78.4%) | 60 (21.6%) |
| Single Unit, Attached | 76 (60.3%) | 50 (39.7%) |
| 2 Unit Apartments | 12 (14.1%) | 73 (85.9%) |
| 3 or 4 Unit Apartments | 0 (0.0%) | 82 (100.0%) |
| 5 to 9 Unit Apartments | 80 (32.1%) | 169 (67.9%) |
| 10 or more Apartments | 109 (47.2%) | 122 (52.8%) |
| Mobile Home / Other | 67 (68.4%) | 31 (31.6%) |
| Total | 562 (48.9%) | 587 (51.1%) |
Housing Structures by Number of Rooms in Harriman
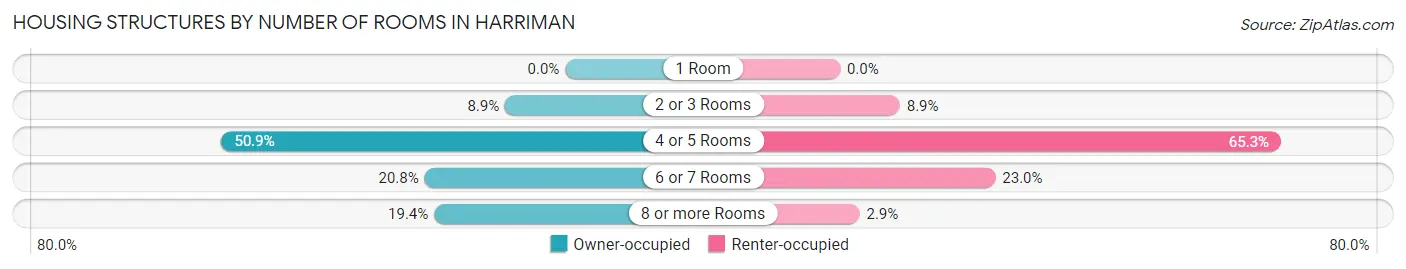
| Number of Rooms | Owner-occupied | Renter-occupied |
| 1 Room | 0 (0.0%) | 0 (0.0%) |
| 2 or 3 Rooms | 50 (8.9%) | 52 (8.9%) |
| 4 or 5 Rooms | 286 (50.9%) | 383 (65.2%) |
| 6 or 7 Rooms | 117 (20.8%) | 135 (23.0%) |
| 8 or more Rooms | 109 (19.4%) | 17 (2.9%) |
| Total | 562 (100.0%) | 587 (100.0%) |
Housing Structure by Heating Type in Harriman
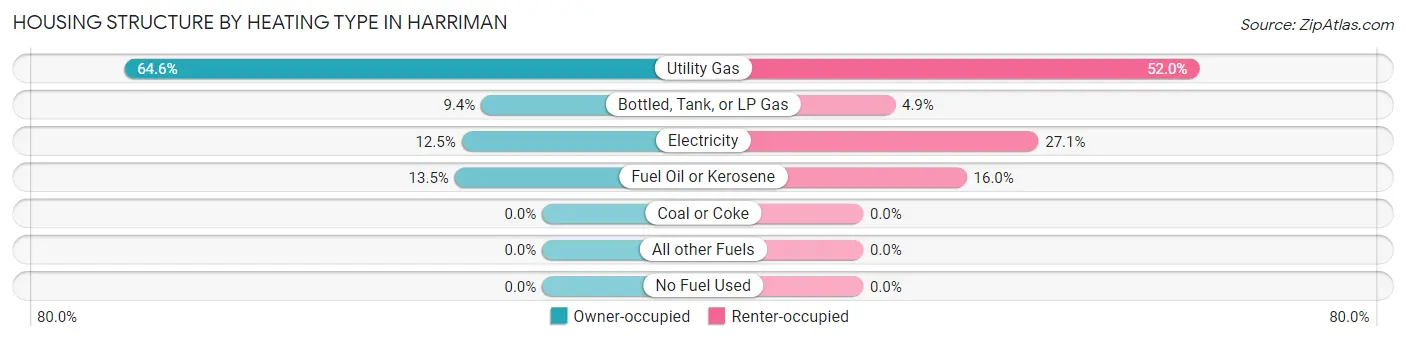
| Heating Type | Owner-occupied | Renter-occupied |
| Utility Gas | 363 (64.6%) | 305 (52.0%) |
| Bottled, Tank, or LP Gas | 53 (9.4%) | 29 (4.9%) |
| Electricity | 70 (12.5%) | 159 (27.1%) |
| Fuel Oil or Kerosene | 76 (13.5%) | 94 (16.0%) |
| Coal or Coke | 0 (0.0%) | 0 (0.0%) |
| All other Fuels | 0 (0.0%) | 0 (0.0%) |
| No Fuel Used | 0 (0.0%) | 0 (0.0%) |
| Total | 562 (100.0%) | 587 (100.0%) |
Household Vehicle Usage in Harriman
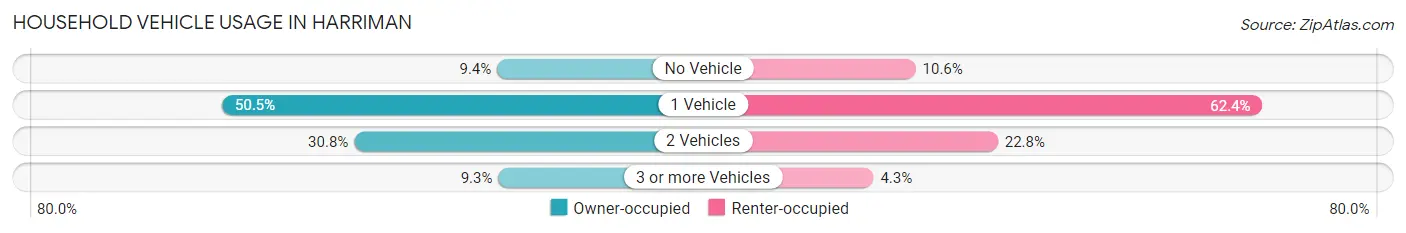
| Vehicles per Household | Owner-occupied | Renter-occupied |
| No Vehicle | 53 (9.4%) | 62 (10.6%) |
| 1 Vehicle | 284 (50.5%) | 366 (62.4%) |
| 2 Vehicles | 173 (30.8%) | 134 (22.8%) |
| 3 or more Vehicles | 52 (9.2%) | 25 (4.3%) |
| Total | 562 (100.0%) | 587 (100.0%) |
Real Estate & Mortgages in Harriman
Real Estate and Mortgage Overview in Harriman
| Characteristic | Without Mortgage | With Mortgage |
| Housing Units | 183 | 379 |
| Median Property Value | $196,500 | $256,900 |
| Median Household Income | $55,568 | $88 |
| Monthly Housing Costs | $1,155 | $67 |
| Real Estate Taxes | $7,031 | $79 |
Property Value by Mortgage Status in Harriman
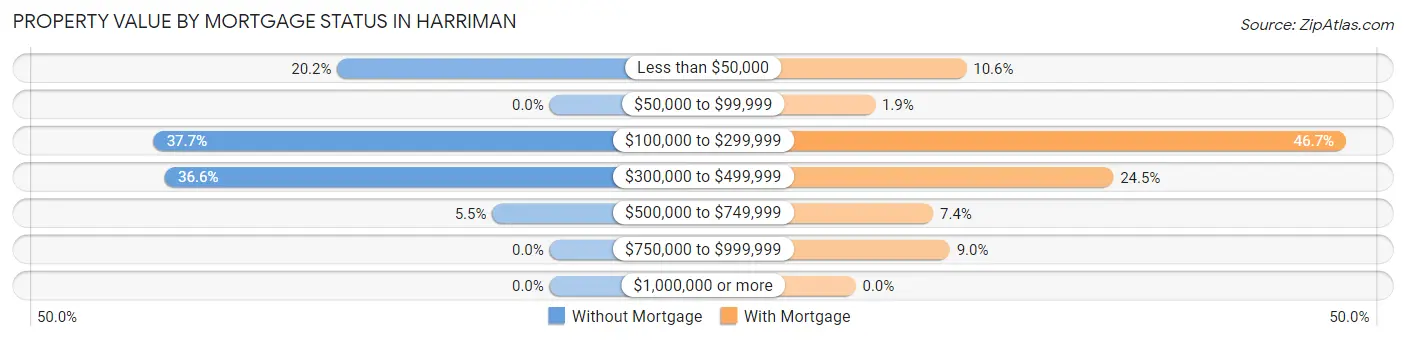
| Property Value | Without Mortgage | With Mortgage |
| Less than $50,000 | 37 (20.2%) | 40 (10.5%) |
| $50,000 to $99,999 | 0 (0.0%) | 7 (1.8%) |
| $100,000 to $299,999 | 69 (37.7%) | 177 (46.7%) |
| $300,000 to $499,999 | 67 (36.6%) | 93 (24.5%) |
| $500,000 to $749,999 | 10 (5.5%) | 28 (7.4%) |
| $750,000 to $999,999 | 0 (0.0%) | 34 (9.0%) |
| $1,000,000 or more | 0 (0.0%) | 0 (0.0%) |
| Total | 183 (100.0%) | 379 (100.0%) |
Household Income by Mortgage Status in Harriman
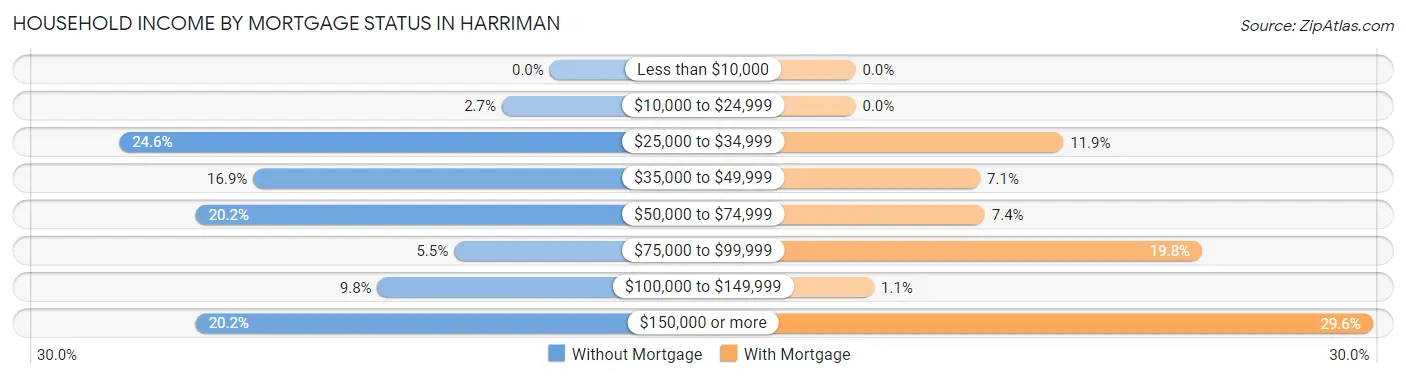
| Household Income | Without Mortgage | With Mortgage |
| Less than $10,000 | 0 (0.0%) | 0 (0.0%) |
| $10,000 to $24,999 | 5 (2.7%) | 0 (0.0%) |
| $25,000 to $34,999 | 45 (24.6%) | 45 (11.9%) |
| $35,000 to $49,999 | 31 (16.9%) | 27 (7.1%) |
| $50,000 to $74,999 | 37 (20.2%) | 28 (7.4%) |
| $75,000 to $99,999 | 10 (5.5%) | 75 (19.8%) |
| $100,000 to $149,999 | 18 (9.8%) | 4 (1.1%) |
| $150,000 or more | 37 (20.2%) | 112 (29.5%) |
| Total | 183 (100.0%) | 379 (100.0%) |
Property Value to Household Income Ratio in Harriman
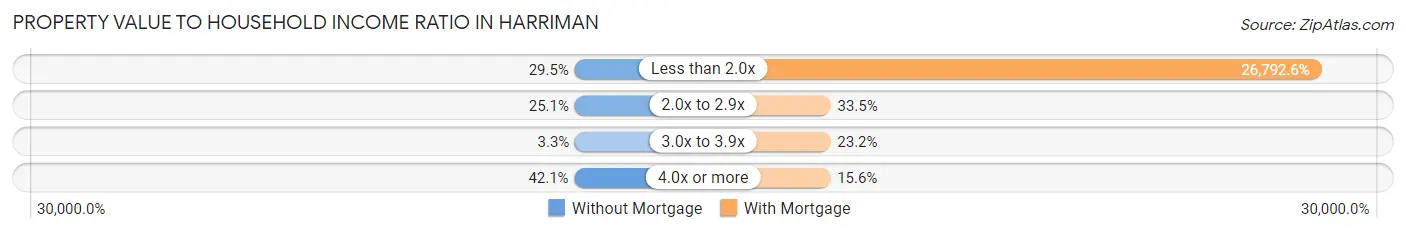
| Value-to-Income Ratio | Without Mortgage | With Mortgage |
| Less than 2.0x | 54 (29.5%) | 101,544 (26,792.6%) |
| 2.0x to 2.9x | 46 (25.1%) | 127 (33.5%) |
| 3.0x to 3.9x | 6 (3.3%) | 88 (23.2%) |
| 4.0x or more | 77 (42.1%) | 59 (15.6%) |
| Total | 183 (100.0%) | 379 (100.0%) |
Real Estate Taxes by Mortgage Status in Harriman
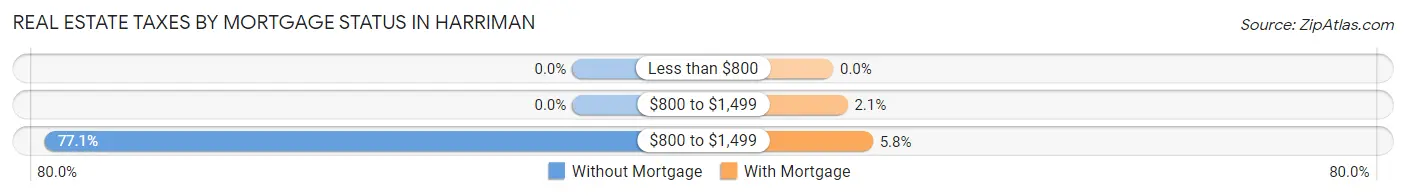
| Property Taxes | Without Mortgage | With Mortgage |
| Less than $800 | 0 (0.0%) | 0 (0.0%) |
| $800 to $1,499 | 0 (0.0%) | 8 (2.1%) |
| $800 to $1,499 | 141 (77.0%) | 22 (5.8%) |
| Total | 183 (100.0%) | 379 (100.0%) |
Health & Disability in Harriman
Health Insurance Coverage by Age in Harriman
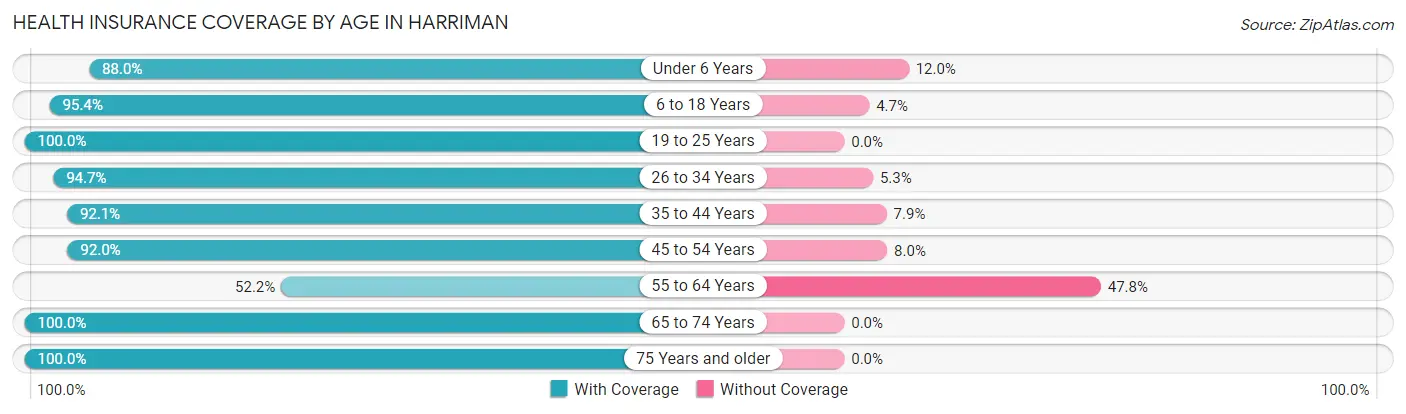
| Age Bracket | With Coverage | Without Coverage |
| Under 6 Years | 249 (88.0%) | 34 (12.0%) |
| 6 to 18 Years | 554 (95.4%) | 27 (4.6%) |
| 19 to 25 Years | 154 (100.0%) | 0 (0.0%) |
| 26 to 34 Years | 319 (94.7%) | 18 (5.3%) |
| 35 to 44 Years | 443 (92.1%) | 38 (7.9%) |
| 45 to 54 Years | 288 (92.0%) | 25 (8.0%) |
| 55 to 64 Years | 217 (52.2%) | 199 (47.8%) |
| 65 to 74 Years | 207 (100.0%) | 0 (0.0%) |
| 75 Years and older | 183 (100.0%) | 0 (0.0%) |
| Total | 2,614 (88.5%) | 341 (11.5%) |
Health Insurance Coverage by Citizenship Status in Harriman
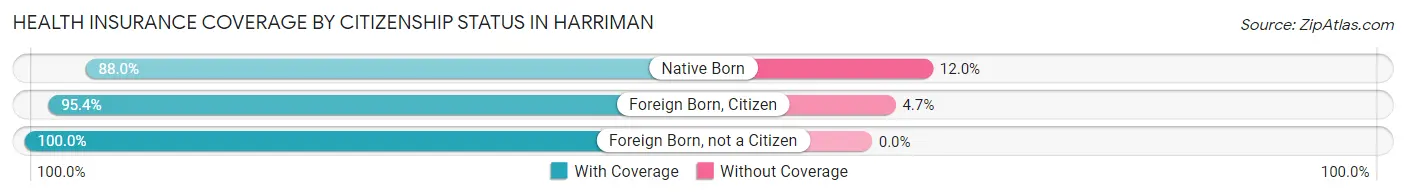
| Citizenship Status | With Coverage | Without Coverage |
| Native Born | 249 (88.0%) | 34 (12.0%) |
| Foreign Born, Citizen | 554 (95.4%) | 27 (4.6%) |
| Foreign Born, not a Citizen | 154 (100.0%) | 0 (0.0%) |
Health Insurance Coverage by Household Income in Harriman
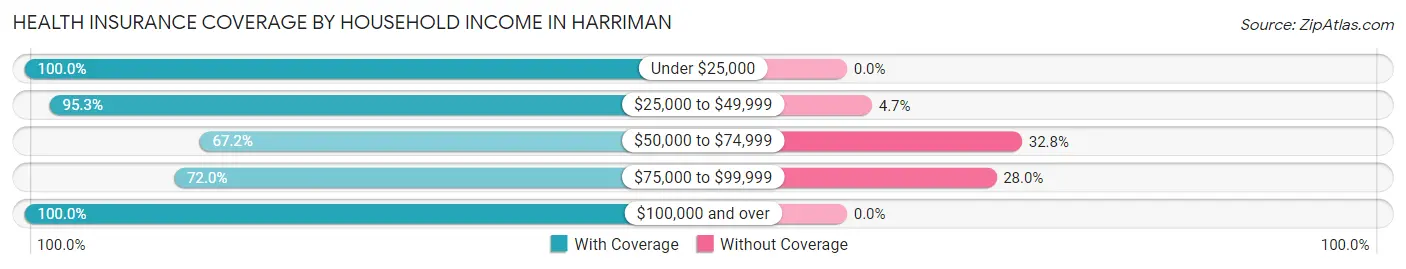
| Household Income | With Coverage | Without Coverage |
| Under $25,000 | 219 (100.0%) | 0 (0.0%) |
| $25,000 to $49,999 | 509 (95.3%) | 25 (4.7%) |
| $50,000 to $74,999 | 408 (67.2%) | 199 (32.8%) |
| $75,000 to $99,999 | 301 (72.0%) | 117 (28.0%) |
| $100,000 and over | 1,177 (100.0%) | 0 (0.0%) |
Public vs Private Health Insurance Coverage by Age in Harriman
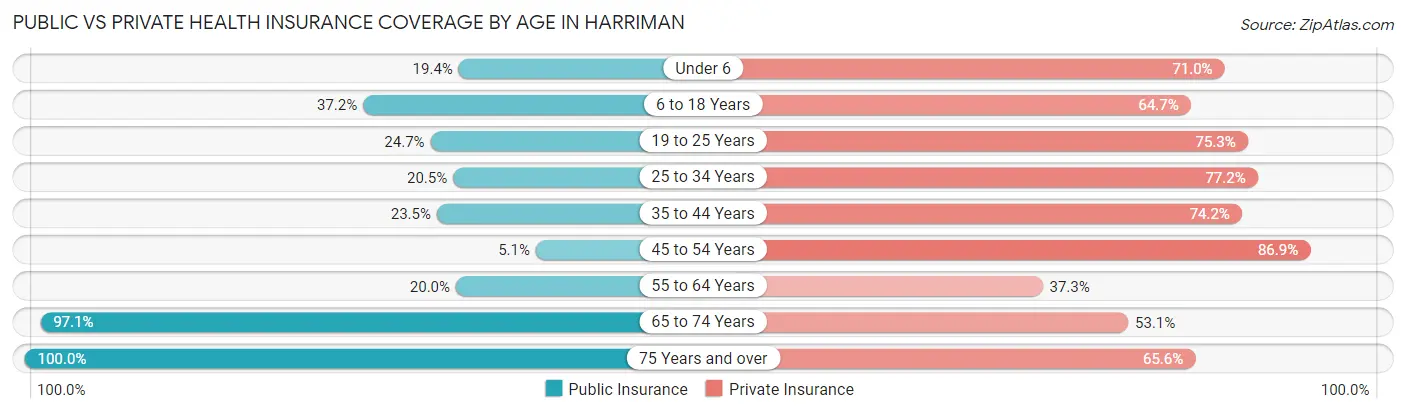
| Age Bracket | Public Insurance | Private Insurance |
| Under 6 | 55 (19.4%) | 201 (71.0%) |
| 6 to 18 Years | 216 (37.2%) | 376 (64.7%) |
| 19 to 25 Years | 38 (24.7%) | 116 (75.3%) |
| 25 to 34 Years | 69 (20.5%) | 260 (77.1%) |
| 35 to 44 Years | 113 (23.5%) | 357 (74.2%) |
| 45 to 54 Years | 16 (5.1%) | 272 (86.9%) |
| 55 to 64 Years | 83 (20.0%) | 155 (37.3%) |
| 65 to 74 Years | 201 (97.1%) | 110 (53.1%) |
| 75 Years and over | 183 (100.0%) | 120 (65.6%) |
| Total | 974 (33.0%) | 1,967 (66.6%) |
Disability Status by Sex by Age in Harriman
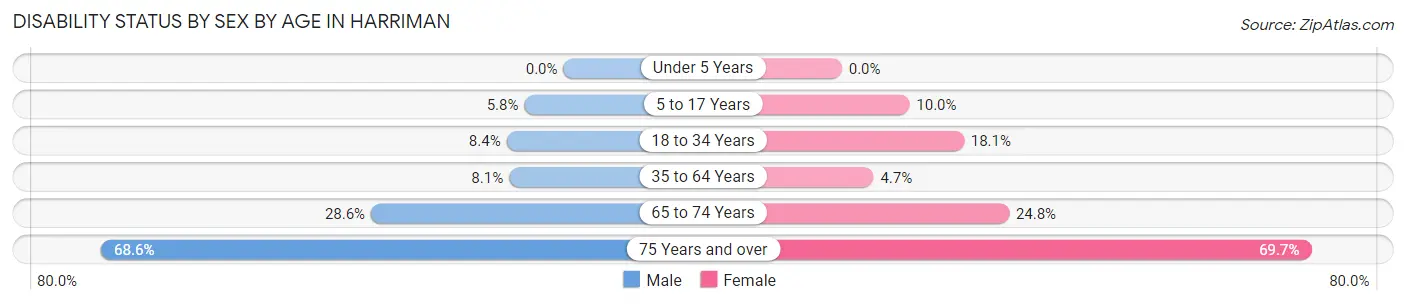
| Age Bracket | Male | Female |
| Under 5 Years | 0 (0.0%) | 0 (0.0%) |
| 5 to 17 Years | 17 (5.8%) | 33 (10.0%) |
| 18 to 34 Years | 20 (8.4%) | 46 (18.1%) |
| 35 to 64 Years | 41 (8.1%) | 33 (4.7%) |
| 65 to 74 Years | 20 (28.6%) | 34 (24.8%) |
| 75 Years and over | 35 (68.6%) | 92 (69.7%) |
Disability Class by Sex by Age in Harriman
Disability Class: Hearing Difficulty
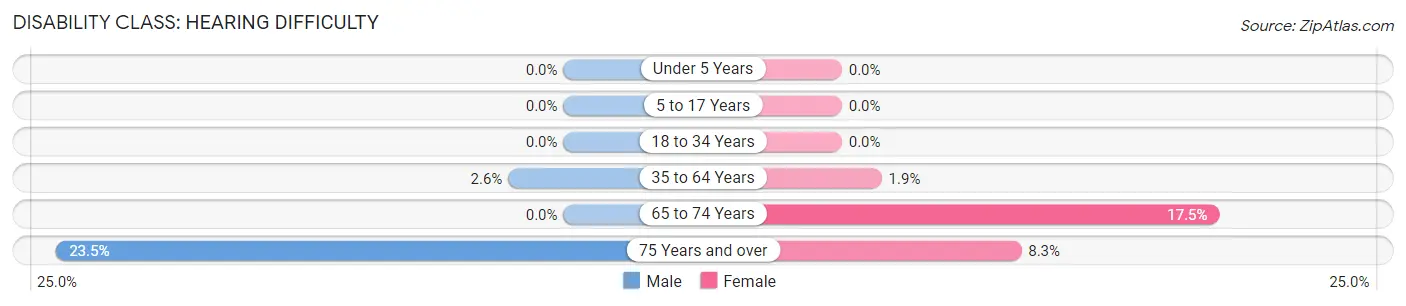
| Age Bracket | Male | Female |
| Under 5 Years | 0 (0.0%) | 0 (0.0%) |
| 5 to 17 Years | 0 (0.0%) | 0 (0.0%) |
| 18 to 34 Years | 0 (0.0%) | 0 (0.0%) |
| 35 to 64 Years | 13 (2.6%) | 13 (1.8%) |
| 65 to 74 Years | 0 (0.0%) | 24 (17.5%) |
| 75 Years and over | 12 (23.5%) | 11 (8.3%) |
Disability Class: Vision Difficulty
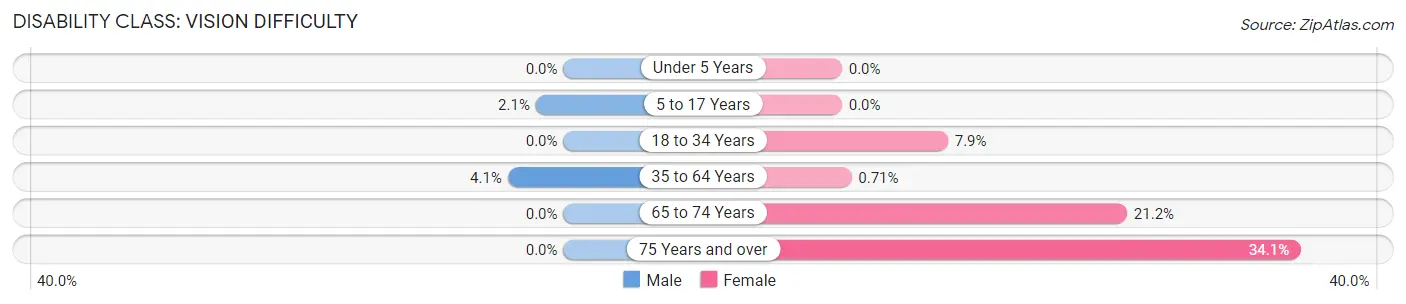
| Age Bracket | Male | Female |
| Under 5 Years | 0 (0.0%) | 0 (0.0%) |
| 5 to 17 Years | 6 (2.1%) | 0 (0.0%) |
| 18 to 34 Years | 0 (0.0%) | 20 (7.9%) |
| 35 to 64 Years | 21 (4.1%) | 5 (0.7%) |
| 65 to 74 Years | 0 (0.0%) | 29 (21.2%) |
| 75 Years and over | 0 (0.0%) | 45 (34.1%) |
Disability Class: Cognitive Difficulty
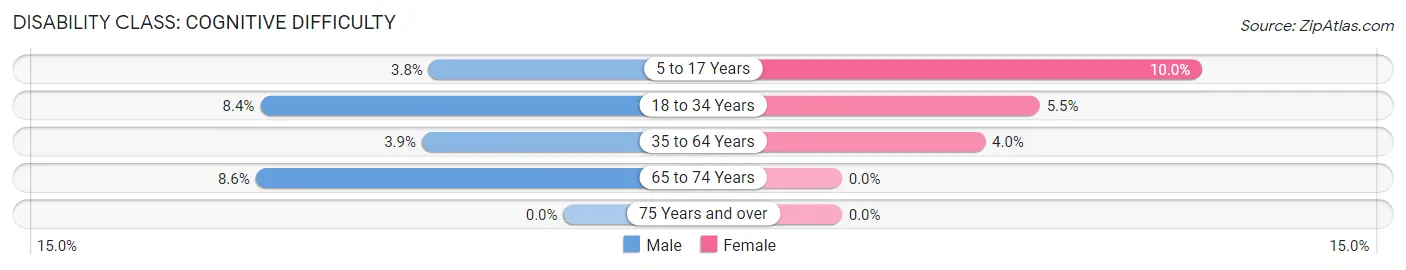
| Age Bracket | Male | Female |
| 5 to 17 Years | 11 (3.7%) | 33 (10.0%) |
| 18 to 34 Years | 20 (8.4%) | 14 (5.5%) |
| 35 to 64 Years | 20 (3.9%) | 28 (4.0%) |
| 65 to 74 Years | 6 (8.6%) | 0 (0.0%) |
| 75 Years and over | 0 (0.0%) | 0 (0.0%) |
Disability Class: Ambulatory Difficulty
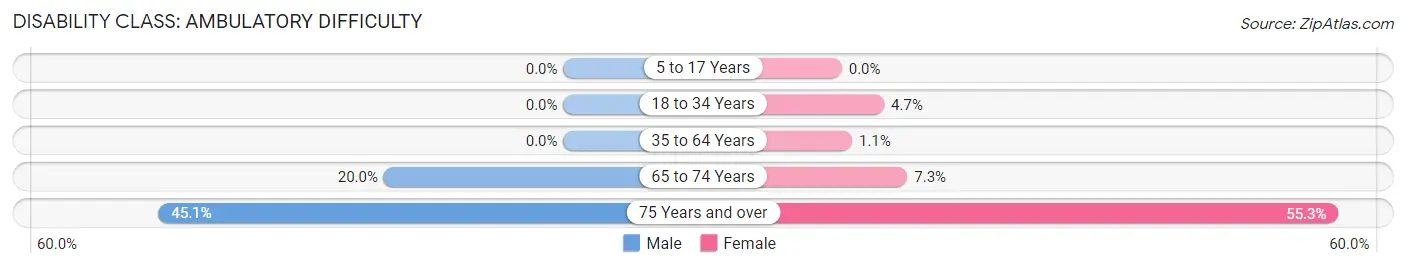
| Age Bracket | Male | Female |
| 5 to 17 Years | 0 (0.0%) | 0 (0.0%) |
| 18 to 34 Years | 0 (0.0%) | 12 (4.7%) |
| 35 to 64 Years | 0 (0.0%) | 8 (1.1%) |
| 65 to 74 Years | 14 (20.0%) | 10 (7.3%) |
| 75 Years and over | 23 (45.1%) | 73 (55.3%) |
Disability Class: Self-Care Difficulty
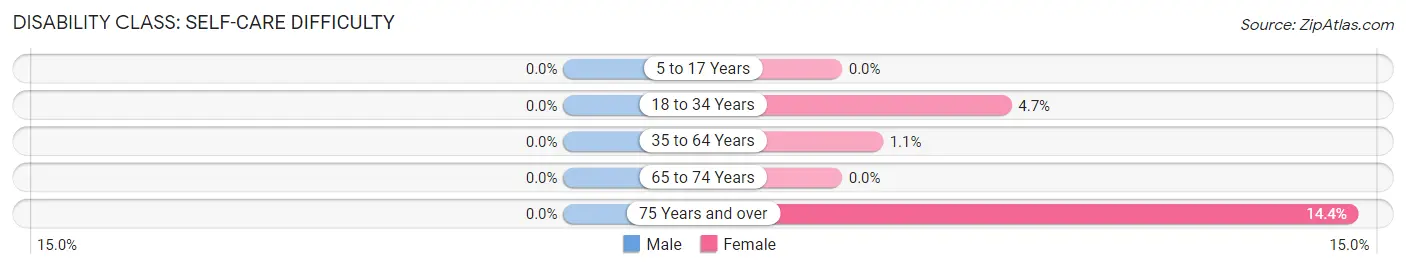
| Age Bracket | Male | Female |
| 5 to 17 Years | 0 (0.0%) | 0 (0.0%) |
| 18 to 34 Years | 0 (0.0%) | 12 (4.7%) |
| 35 to 64 Years | 0 (0.0%) | 8 (1.1%) |
| 65 to 74 Years | 0 (0.0%) | 0 (0.0%) |
| 75 Years and over | 0 (0.0%) | 19 (14.4%) |
Technology Access in Harriman
Computing Device Access in Harriman
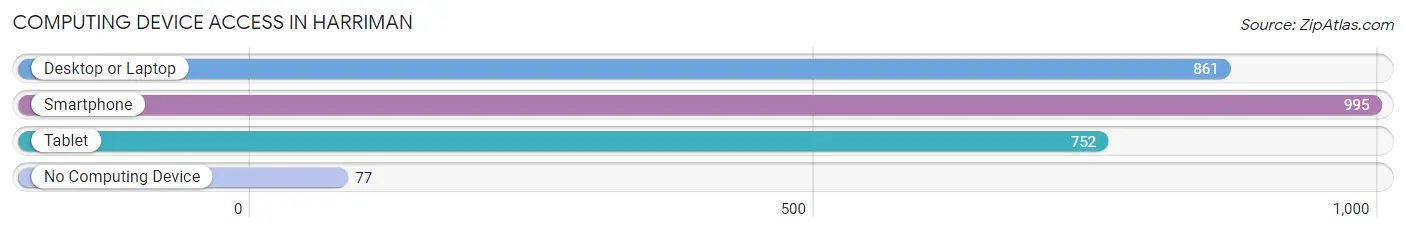
| Device Type | # Households | % Households |
| Desktop or Laptop | 861 | 74.9% |
| Smartphone | 995 | 86.6% |
| Tablet | 752 | 65.4% |
| No Computing Device | 77 | 6.7% |
| Total | 1,149 | 100.0% |
Internet Access in Harriman
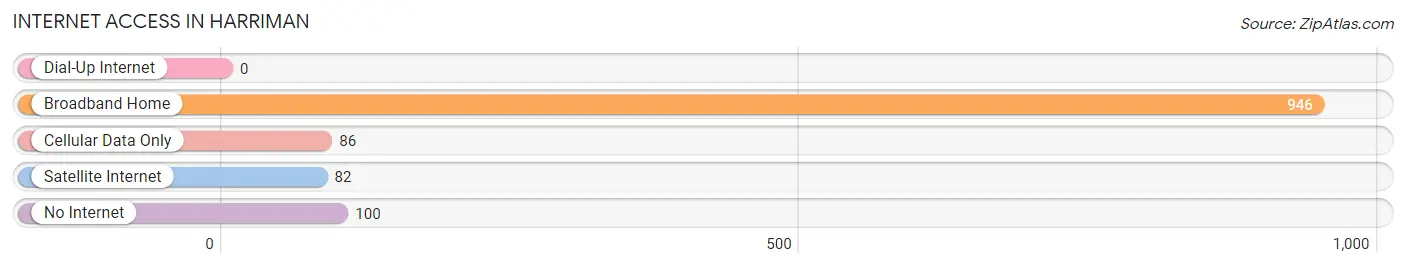
| Internet Type | # Households | % Households |
| Dial-Up Internet | 0 | 0.0% |
| Broadband Home | 946 | 82.3% |
| Cellular Data Only | 86 | 7.5% |
| Satellite Internet | 82 | 7.1% |
| No Internet | 100 | 8.7% |
| Total | 1,149 | 100.0% |
Harriman Summary
Harriman is a village located in Orange County, New York, United States. The village is located within the Town of Monroe and is part of the New York metropolitan area. As of the 2010 census, the village had a population of 6,845.
History
Harriman was founded in 1798 by John Harriman, a Revolutionary War veteran. The village was originally known as Harrimanville, but the name was changed to Harriman in 1879. The village was incorporated in 1891.
Harriman was a major center of the iron industry in the 19th century. The village was home to several ironworks, including the Harriman Iron Works, which was founded in 1845. The ironworks produced a variety of products, including stoves, plows, and other agricultural implements.
Geography
Harriman is located at 41°19'25"N 74°10'45"W (41.323, -74.179). The village is situated in the foothills of the Ramapo Mountains, and is located approximately 40 miles northwest of New York City.
The village has a total area of 2.2 square miles, all of which is land. Harriman is located near the intersection of Interstate 87 and U.S. Route 6.
Economy
Harriman is home to several businesses, including a variety of retail stores, restaurants, and professional services. The village is also home to several manufacturing companies, including a plastics manufacturer and a metal fabrication company.
The village is also home to a number of educational institutions, including the State University of New York at Stony Brook, the State University of New York at New Paltz, and the State University of New York at Orange.
Demographics
As of the 2010 census, there were 6,845 people, 2,717 households, and 1,717 families residing in the village. The population density was 3,093.3 people per square mile. The racial makeup of the village was 87.2% White, 5.3% African American, 0.3% Native American, 2.2% Asian, 0.1% Pacific Islander, 2.2% from other races, and 2.9% from two or more races. Hispanic or Latino of any race were 8.2% of the population.
The median income for a household in the village was $50,945, and the median income for a family was $62,917. The per capita income for the village was $25,945. About 5.2% of families and 8.2% of the population were below the poverty line, including 10.2% of those under age 18 and 5.2% of those age 65 or over.
Common Questions
What is the Total Population of Harriman?
Total Population of Harriman is 2,955.
What is the Total Male Population of Harriman?
Total Male Population of Harriman is 1,340.
What is the Total Female Population of Harriman?
Total Female Population of Harriman is 1,615.
What is the Ratio of Males per 100 Females in Harriman?
There are 82.97 Males per 100 Females in Harriman.
What is the Ratio of Females per 100 Males in Harriman?
There are 120.52 Females per 100 Males in Harriman.
What is the Median Population Age in Harriman?
Median Population Age in Harriman is 37.8 Years.
What is the Average Family Size in Harriman
Average Family Size in Harriman is 3.7 People.
What is the Average Household Size in Harriman
Average Household Size in Harriman is 2.6 People.
What is Per Capita Income in Harriman?
Per Capita income in Harriman is $39,486.
What is the Median Family Income in Harriman?
Median Family Income in Harriman is $87,813.
What is the Median Household income in Harriman?
Median Household Income in Harriman is $74,861.
What is Income or Wage Gap in Harriman?
Income or Wage Gap in Harriman is 12.3%.
Women in Harriman earn 87.7 cents for every dollar earned by a man.
What is Inequality or Gini Index in Harriman?
Inequality or Gini Index in Harriman is 0.39.
How Large is the Labor Force in Harriman?
There are 1,579 People in the Labor Forcein in Harriman.
What is the Percentage of People in the Labor Force in Harriman?
70.9% of People are in the Labor Force in Harriman.
What is the Unemployment Rate in Harriman?
Unemployment Rate in Harriman is 5.3%.