Cities with the Most Immigrants from Middle Africa in New York
RELATED REPORTS & OPTIONS
Middle Africa
New York
Compare Cities
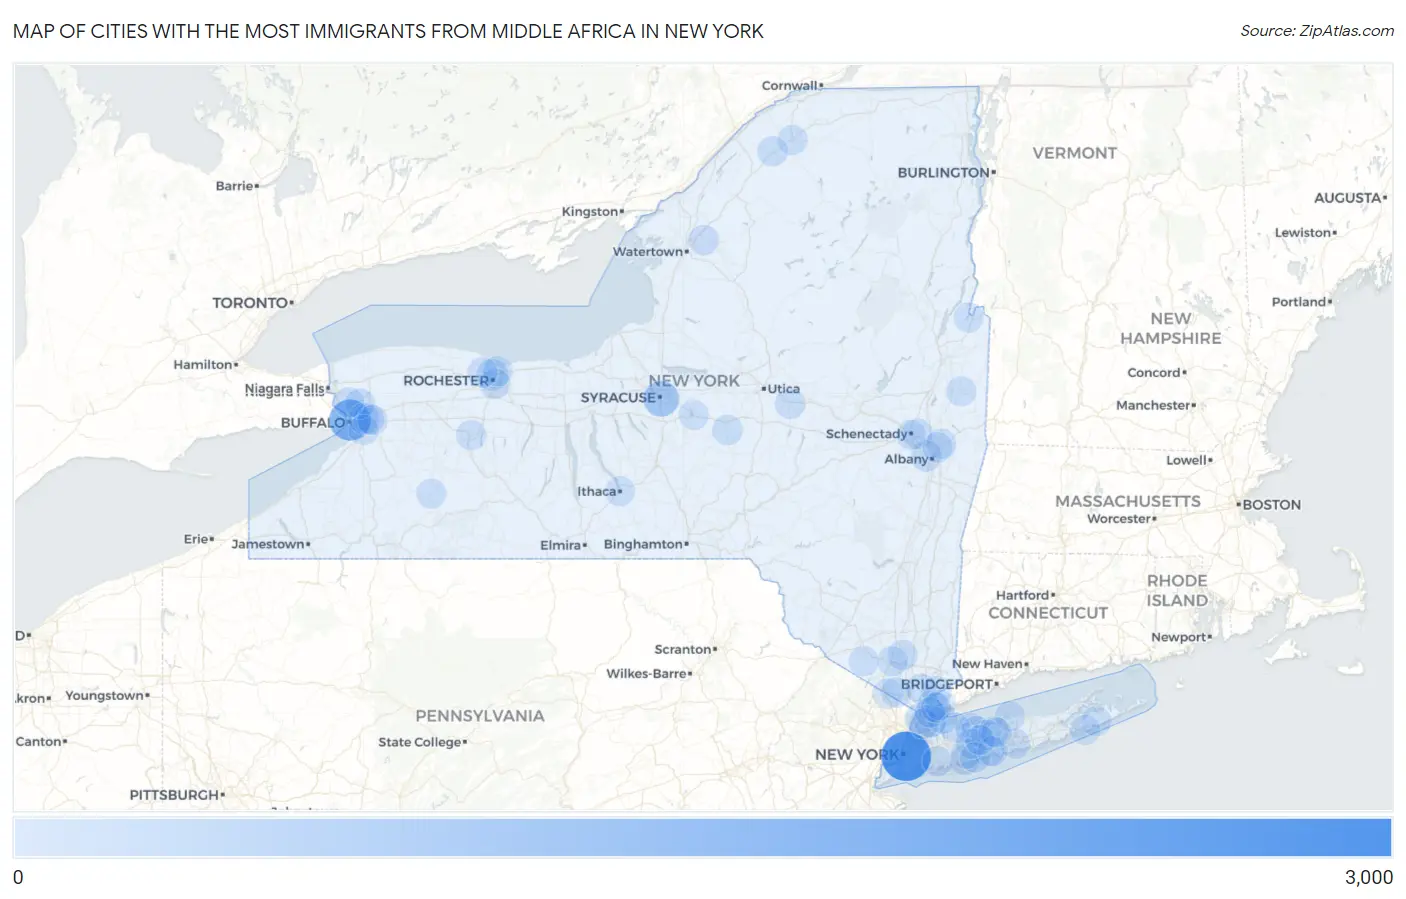
Map of Cities with the Most Immigrants from Middle Africa in New York
0
3,000
Cities with the Most Immigrants from Middle Africa in New York
| City | Middle Africa | vs State | vs National | |
| 1. | New York | 2,619 | 7,089(36.94%)#1 | 193,874(1.35%)#4 |
| 2. | Buffalo | 1,488 | 7,089(20.99%)#2 | 193,874(0.77%)#15 |
| 3. | Syracuse | 721 | 7,089(10.17%)#3 | 193,874(0.37%)#47 |
| 4. | New Rochelle | 244 | 7,089(3.44%)#4 | 193,874(0.13%)#169 |
| 5. | Rochester | 194 | 7,089(2.74%)#5 | 193,874(0.10%)#210 |
| 6. | Huntington | 101 | 7,089(1.42%)#6 | 193,874(0.05%)#340 |
| 7. | Albany | 97 | 7,089(1.37%)#7 | 193,874(0.05%)#353 |
| 8. | Cheektowaga | 90 | 7,089(1.27%)#8 | 193,874(0.05%)#374 |
| 9. | Brighton | 83 | 7,089(1.17%)#9 | 193,874(0.04%)#401 |
| 10. | Yonkers | 72 | 7,089(1.02%)#10 | 193,874(0.04%)#440 |
| 11. | White Plains | 72 | 7,089(1.02%)#11 | 193,874(0.04%)#444 |
| 12. | Depew | 65 | 7,089(0.92%)#12 | 193,874(0.03%)#486 |
| 13. | Roessleville | 55 | 7,089(0.78%)#13 | 193,874(0.03%)#537 |
| 14. | Niskayuna | 50 | 7,089(0.71%)#14 | 193,874(0.03%)#572 |
| 15. | Bay Shore | 45 | 7,089(0.63%)#15 | 193,874(0.02%)#606 |
| 16. | Fort Drum | 44 | 7,089(0.62%)#16 | 193,874(0.02%)#612 |
| 17. | Valley Stream | 38 | 7,089(0.54%)#17 | 193,874(0.02%)#670 |
| 18. | West Point | 37 | 7,089(0.52%)#18 | 193,874(0.02%)#682 |
| 19. | Hamilton | 35 | 7,089(0.49%)#19 | 193,874(0.02%)#697 |
| 20. | Greenlawn | 34 | 7,089(0.48%)#20 | 193,874(0.02%)#707 |
| 21. | Briarcliff Manor | 29 | 7,089(0.41%)#21 | 193,874(0.01%)#765 |
| 22. | University At Buffalo | 29 | 7,089(0.41%)#22 | 193,874(0.01%)#766 |
| 23. | Canton | 27 | 7,089(0.38%)#23 | 193,874(0.01%)#788 |
| 24. | Massapequa | 26 | 7,089(0.37%)#24 | 193,874(0.01%)#798 |
| 25. | Mount Vernon | 25 | 7,089(0.35%)#25 | 193,874(0.01%)#806 |
| 26. | Mohawk | 25 | 7,089(0.35%)#26 | 193,874(0.01%)#814 |
| 27. | North Patchogue | 24 | 7,089(0.34%)#27 | 193,874(0.01%)#820 |
| 28. | Potsdam | 21 | 7,089(0.30%)#28 | 193,874(0.01%)#873 |
| 29. | Irondequoit | 16 | 7,089(0.23%)#29 | 193,874(0.01%)#961 |
| 30. | South Farmingdale | 16 | 7,089(0.23%)#30 | 193,874(0.01%)#969 |
| 31. | Greece | 16 | 7,089(0.23%)#31 | 193,874(0.01%)#970 |
| 32. | Watervliet | 16 | 7,089(0.23%)#32 | 193,874(0.01%)#972 |
| 33. | Tonawanda | 15 | 7,089(0.21%)#33 | 193,874(0.01%)#983 |
| 34. | Troy | 15 | 7,089(0.21%)#34 | 193,874(0.01%)#986 |
| 35. | West Seneca | 14 | 7,089(0.20%)#35 | 193,874(0.01%)#1,009 |
| 36. | Suffern | 14 | 7,089(0.20%)#36 | 193,874(0.01%)#1,016 |
| 37. | Geneseo | 14 | 7,089(0.20%)#37 | 193,874(0.01%)#1,018 |
| 38. | Fairview Cdp Westchester County | 14 | 7,089(0.20%)#38 | 193,874(0.01%)#1,023 |
| 39. | Woodbury | 13 | 7,089(0.18%)#39 | 193,874(0.01%)#1,039 |
| 40. | East Setauket | 13 | 7,089(0.18%)#40 | 193,874(0.01%)#1,040 |
| 41. | Southampton | 13 | 7,089(0.18%)#41 | 193,874(0.01%)#1,048 |
| 42. | Florida | 13 | 7,089(0.18%)#42 | 193,874(0.01%)#1,050 |
| 43. | Rye | 12 | 7,089(0.17%)#43 | 193,874(0.01%)#1,072 |
| 44. | Armonk | 11 | 7,089(0.16%)#44 | 193,874(0.01%)#1,114 |
| 45. | Schenectady | 10 | 7,089(0.14%)#45 | 193,874(0.01%)#1,122 |
| 46. | Commack | 10 | 7,089(0.14%)#46 | 193,874(0.01%)#1,130 |
| 47. | Melville | 10 | 7,089(0.14%)#47 | 193,874(0.01%)#1,136 |
| 48. | Monsey | 9 | 7,089(0.13%)#48 | 193,874(0.00%)#1,164 |
| 49. | Scarsdale | 9 | 7,089(0.13%)#49 | 193,874(0.00%)#1,172 |
| 50. | Rye Brook | 8 | 7,089(0.11%)#50 | 193,874(0.00%)#1,201 |
| 51. | Mill Neck | 8 | 7,089(0.11%)#51 | 193,874(0.00%)#1,211 |
| 52. | Smithtown | 7 | 7,089(0.10%)#52 | 193,874(0.00%)#1,221 |
| 53. | Belle Terre | 6 | 7,089(0.08%)#53 | 193,874(0.00%)#1,263 |
| 54. | Harrison | 5 | 7,089(0.07%)#54 | 193,874(0.00%)#1,266 |
| 55. | Ithaca | 3 | 7,089(0.04%)#55 | 193,874(0.00%)#1,310 |
| 56. | Cazenovia | 3 | 7,089(0.04%)#56 | 193,874(0.00%)#1,323 |
| 57. | Greenwich | 3 | 7,089(0.04%)#57 | 193,874(0.00%)#1,330 |
| 58. | Lindenhurst | 2 | 7,089(0.03%)#58 | 193,874(0.00%)#1,342 |
| 59. | Islip | 2 | 7,089(0.03%)#59 | 193,874(0.00%)#1,344 |
| 60. | Village Of The Branch | 2 | 7,089(0.03%)#60 | 193,874(0.00%)#1,355 |
| 61. | Bridgehampton | 2 | 7,089(0.03%)#61 | 193,874(0.00%)#1,356 |
| 62. | Dix Hills | 1 | 7,089(0.01%)#62 | 193,874(0.00%)#1,373 |
| 63. | Lancaster | 1 | 7,089(0.01%)#63 | 193,874(0.00%)#1,382 |
| 64. | Whitehall | 1 | 7,089(0.01%)#64 | 193,874(0.00%)#1,390 |
| 65. | Houghton | 1 | 7,089(0.01%)#65 | 193,874(0.00%)#1,392 |
Common Questions
What are the Top 10 Cities with the Most Immigrants from Middle Africa in New York?
Top 10 Cities with the Most Immigrants from Middle Africa in New York are:
#1
2,619
#2
1,488
#3
721
#4
244
#5
194
#6
101
#7
97
#8
90
#9
83
#10
72
What city has the Most Immigrants from Middle Africa in New York?
New York has the Most Immigrants from Middle Africa in New York with 2,619.
What is the Total Immigrants from Middle Africa in the State of New York?
Total Immigrants from Middle Africa in New York is 7,089.
What is the Total Immigrants from Middle Africa in the United States?
Total Immigrants from Middle Africa in the United States is 193,874.